Article

Clues of Lithosphere, Atmosphere and Ionosphere Variations Possibly Related to the Preparation of La Palma 19 September 2021 Volcano Eruption

1
College of Instrumentation and Electrical Engineering, Jilin University, Changchun 130061, China
2
Space Observation Research Center, National Institute of Natural Hazards, MEMC, Beijing 100085, China
*
Author to whom correspondence should be addressed.
Remote Sens. 2022, 14(19), 5001; https://doi.org/10.3390/rs14195001
Submission received: 18 August 2022 / Revised: 5 October 2022 / Accepted: 5 October 2022 / Published: 8 October 2022
(This article belongs to the Special Issue Multi-Sensor Remote Sensing Data for Volcanic Hazards Monitoring)

Abstract

:
On 19 September 2021, La Palma Cumbre Vieja Volcano started an eruption classified as Volcanic Explosive Index (VEI) 3. In this study, at least the six months prior to such an event have been investigated to search for possible lithosphere–atmosphere–ionosphere bottom-up interactions. The lithosphere has been analysed in terms of seismicity getting advantages from the high-density local seismic network. Possible atmospheric alterations related to the volcano emissions or release of gases due to the uplift of the magmatic chamber have been searched in SO2, aerosol, dimethyl sulphide, and CO. The magnetic field on Earth’s surface has been studied by ground geomagnetic observatories. The status of the ionosphere has been investigated with two satellite missions: China Seismo Electromagnetic Satellite (CSES) and European Space Agency Swarm constellation, with Total Electron Content (TEC) retrieved from global maps. We identified a temporal migration of the seismicity from November 2020 at a depth of 40 km that seems associable to magma migration, firstly to a deep chamber at about 15 km depth and in the last 10 days in a shallow magma chamber at less than 5 km depth. The atmospheric composition, ground geomagnetic field, and ionosphere showed anomalies from more than three months before the eruption, suggesting a possible influence from the bottom geo-layers to the upper ones. CSES-01 detected an increase of electron density, confirmed by TEC data, and alterations of vertical magnetic field on ground Guimar observatory that are temporal compatible with some volcanic low seismic activity (very likely due to the magma uplift), suggesting an eventual electromagnetic disturbance from the lithosphere to the ionosphere. A final increase of carbon monoxide 1.5 months before the eruption with unusually high values of TEC suggests the last uplifting of the magma before the eruption, confirmed by a very high shallow seismicity that preceded the eruption by ten days. This work underlines the importance of integrating several observation platforms from ground and overall space to understand geophysics better, and, in particular, the natural hazard affecting our planet.

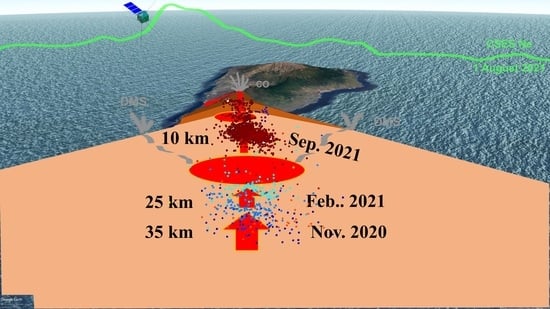
Graphical Abstract

1. Introduction

Studying the lithosphere, atmosphere, and ionosphere as a whole is a new frontier of geoscience. In particular, the possible interactions between each geo-layer before an earthquake or a volcano eruption are predicted by several models, and multiple observations support their existence, even if a definitive proof is still missing [1,2,3]. Instead, some evidence statistically proves such phenomena [4,5,6,7]. Limitations are due to the multidisciplinary nature of such studies and the rareness of earthquakes and volcano eruptions, as they are not everyday events. In particular, the recording instrumentation is not always available close to the natural hazard location. In the last decades, the launch of several remote sensing satellites in Low Earth Orbits (LEO) permitted global coverage of our planet [8]. On the contrary, the satellite flew above the region of interest only for a limited time. Consequently, some effects could be lost if they are shorter than the revisit time of the satellite. Geostationary satellites observed the same region for 24 h/24 h, but their orbit is at about 36,000 km, so their spatial resolution is generally limited [9]. Furthermore, some observable physical quantities, like the geomagnetic field, require observation at a maximum altitude of hundreds of km. In fact, the weak magnetic perturbations that the preparation of the natural hazard are supposed to produce are just a few nT at an altitude of 400 km~500 km, and reduce as the altitude increases.
Concerning the electromagnetic pre-volcano eruption studies, Uyeda et al. [10] reported several geomagnetic Ultra Low Frequency (ULF) emissions before volcanic and seismic activity in Izu Island (Japan). In particular, they underlined two stages of preparation for the volcanic eruption with different transient levels that they identified as pre-seismic and pre-volcano eruptions. They also reported a confirmation as co-event transients.
Several studies on satellite remote sensing multispectral imaging reported the identification of thermal infrared atmospheric anomalies as pre-volcano activity [6,11]. Recently, Marchese et al. [12] successfully found thermal emission anomalies before the 2021 Etna volcano paroxysm, applying the Robust Satellite Technique (RST), initially developed for pre-earthquake thermal anomalies.
All of these pre-volcano and earthquake phenomena could be explained by a lithosphere atmosphere ionosphere coupling (LAIC) model, such as the one proposed by Pulinets and Ouzounov [2] or Pulinets and Davidenko [13] that started from radon or other gas emissions from the faults (for earthquakes) and from faults or directly from the vent in the case of a volcano. Then, reaching the atmosphere, they could ionise the air. Consequently, an alteration of the global electric circuit of the atmosphere and ionosphere could result, as further described by Pulinets and Khachikyan [14].
Parrot [15] proposed that electrical discharge inside the volcanic ash plumes can create some atmospheric and ionospheric disturbances, providing some shreds of evidence from the Etna volcano eruption recorded by the DEMETER satellite.
Similar work has been performed by Tramutoli [16] on the occasion of Etna volcano activity and Sahara dust storm in 2006–2008 using atmospheric and ionospheric data from DEMETER satellite and other instruments. They investigated the atmospheric chemical potential and outgoing longwave radiation for the atmosphere. Electron density and electric field (from DEMETER satellite), together with Total Electron Content (TEC) (from ground stations), detected some possible interaction phenomena between the lithosphere, atmosphere, and ionosphere before the Etna eruptions, as well as some independent ionospheric anomalies more likely due to external sources [16].
Pulinets et al. [17] widely investigated the effect of dust storms from the Sahara desert over the Atlantic Ocean in 2012 and 2020 on the atmosphere and the ionosphere (TEC). In the same paper, the authors monitored the impact of eruptions of several volcanoes on the atmosphere and ionosphere. Still, they concentrated on co-eruption (or dust storm effects) rather than pre-eruption. On the other hand, those works are also a substantial base to determine the impact of a desertic dust storm over the ocean and not confuse it as a “pre-eruption” anomaly.
While the lithosphere–atmosphere–ionosphere bottom-up influence prior to earthquakes and volcano eruptions is a more debated topic among the scientific community, the possibility of predicting volcano eruption by seismic, geodetic, and geochemical measurements is more accepted and has proved to be effective [18].
Recent studies have focused on the incredible explosion of the Hunga Tonga-Hunga Ha’apai volcano that occurred on 15 January 2022. It was a powerful enough explosion to bring some water into the troposphere, impacting Earth’s climate [19] and producing a pressure wave (Lamb wave) that travelled all around the globe. Some studies also found an upward disturbance from the troposphere to the ionosphere during the propagation of the pressure wave, for example, analysing ground Total Electron Content TEC in Japan [20], or by CSES satellite and also TEC from Global Navigation Satellite System (GNSS) detectors [21]. Despite the Hunga Tonga-Hunga Ha’apai and La Palma volcanoes being different (the first one is a submarine stratovolcano, while the second one is an emersed stratovolcano) and the intensity of the explosions being significantly different (VEI = 6 and second one VEI = 3), a similar approach used in [21] is here applied to pre-activity of “La Palma” volcano eruption, by a comprehensive analysis of the lithosphere atmosphere and ionosphere geophysical layers.
La Palma is a volcanic island part of “Las Canarias” archipelagos composed of several islands, all of them of volcanic origin, as visible in Figure 1. Las Canarias archipelagos are located westward of the African continent at the same latitude as the Sahara Desert, but jurisdictionally are part of Spain (European Union). In such archipelagos, and in particular, in La Palma Island, there are several optical telescopes (the National Italian telescope Galileo [22], and the Cherenkov one, like MAGIC [23]). In fact, due to the low light pollution present in the place, it deserves special interest as an elected place for the installation of astrophysical instrumentation. From a tectonic point of view, the Atlantic Ocean is divided in its middle by the Mid-Atlantic Ridge, which is an accretion plate boundary with the continuous formation of the new lithosphere. Among the Atlantic Ocean’s East side, due to the interaction with Eurasian and African plates, several volcano arcs are present from northern Iceland to the southern Capo Verde archipelagos. In the middle are the Las Canarias ones, the object of study of this paper.
In the investigated area during the last 40 years, only an eruption of the El Hierro volcano has been documented, from 10 October 2011 until 5 March 2012 [24,25]. This eruption was a submarine event associated with pre-seismic, geomagnetic, and gravity field anomalies that started in July 2011 [26].
On 19 September 2021, an eruption preceded by high seismic activity started at La Cumbre Vieja vent of “La Palma” volcano [27]. The eruption lasted until 13 December 2021, covering lava, an area of about 12.2 km2 located west of the vent toward the sea [25]. The last previous eruption of “La Palma” volcano was in 1971 at a site called Teneguía [27].

Bottom-Up Lithosphere–Atmosphere–Ionosphere Coupling Interaction Mechanisms

The existence of bottom-up lithosphere–atmosphere–ionosphere effects before volcano eruptions and earthquakes is a controversial scientific topic. For example, a recent paper by Schekotov et al. proposed that what was considered a cause–effect interaction between radon emission and electromagnetic anomalies before Mw9.1 Tohoku (offshore of Oshika Peninsula, Japan) 2011 earthquake are two independent phenomena; nevertheless, the authors still support them as separate precursors of the mega-thrust earthquake [28]. In this paper, we investigated a volcano and not an earthquake. Literature on LAIC and volcano is less rich than on LAIC and earthquakes, but the volcanos are more known for their geological features and underground structures.
It is important to point out that the researchers proposed several different models to explain the possible interactions between lithosphere–atmosphere–ionosphere [29], which we will briefly illustrate in the following. The differences in the proposed models are based on the mechanism that could be an electromagnetic interaction based on Maxwell equations or a mix of mechanic, thermal, chemical, and electromagnetic phenomena. Such ways of interaction affect the parameters differently with specific propagation times; for example, an electromagnetic wave propagates at the speed of light in the medium that permits it to cover 500 km in 1.7 ms (in the air). In comparison, an acoustic wave at the speed of sound requires about 25 min to cover 500 km (in the air in standard conditions).
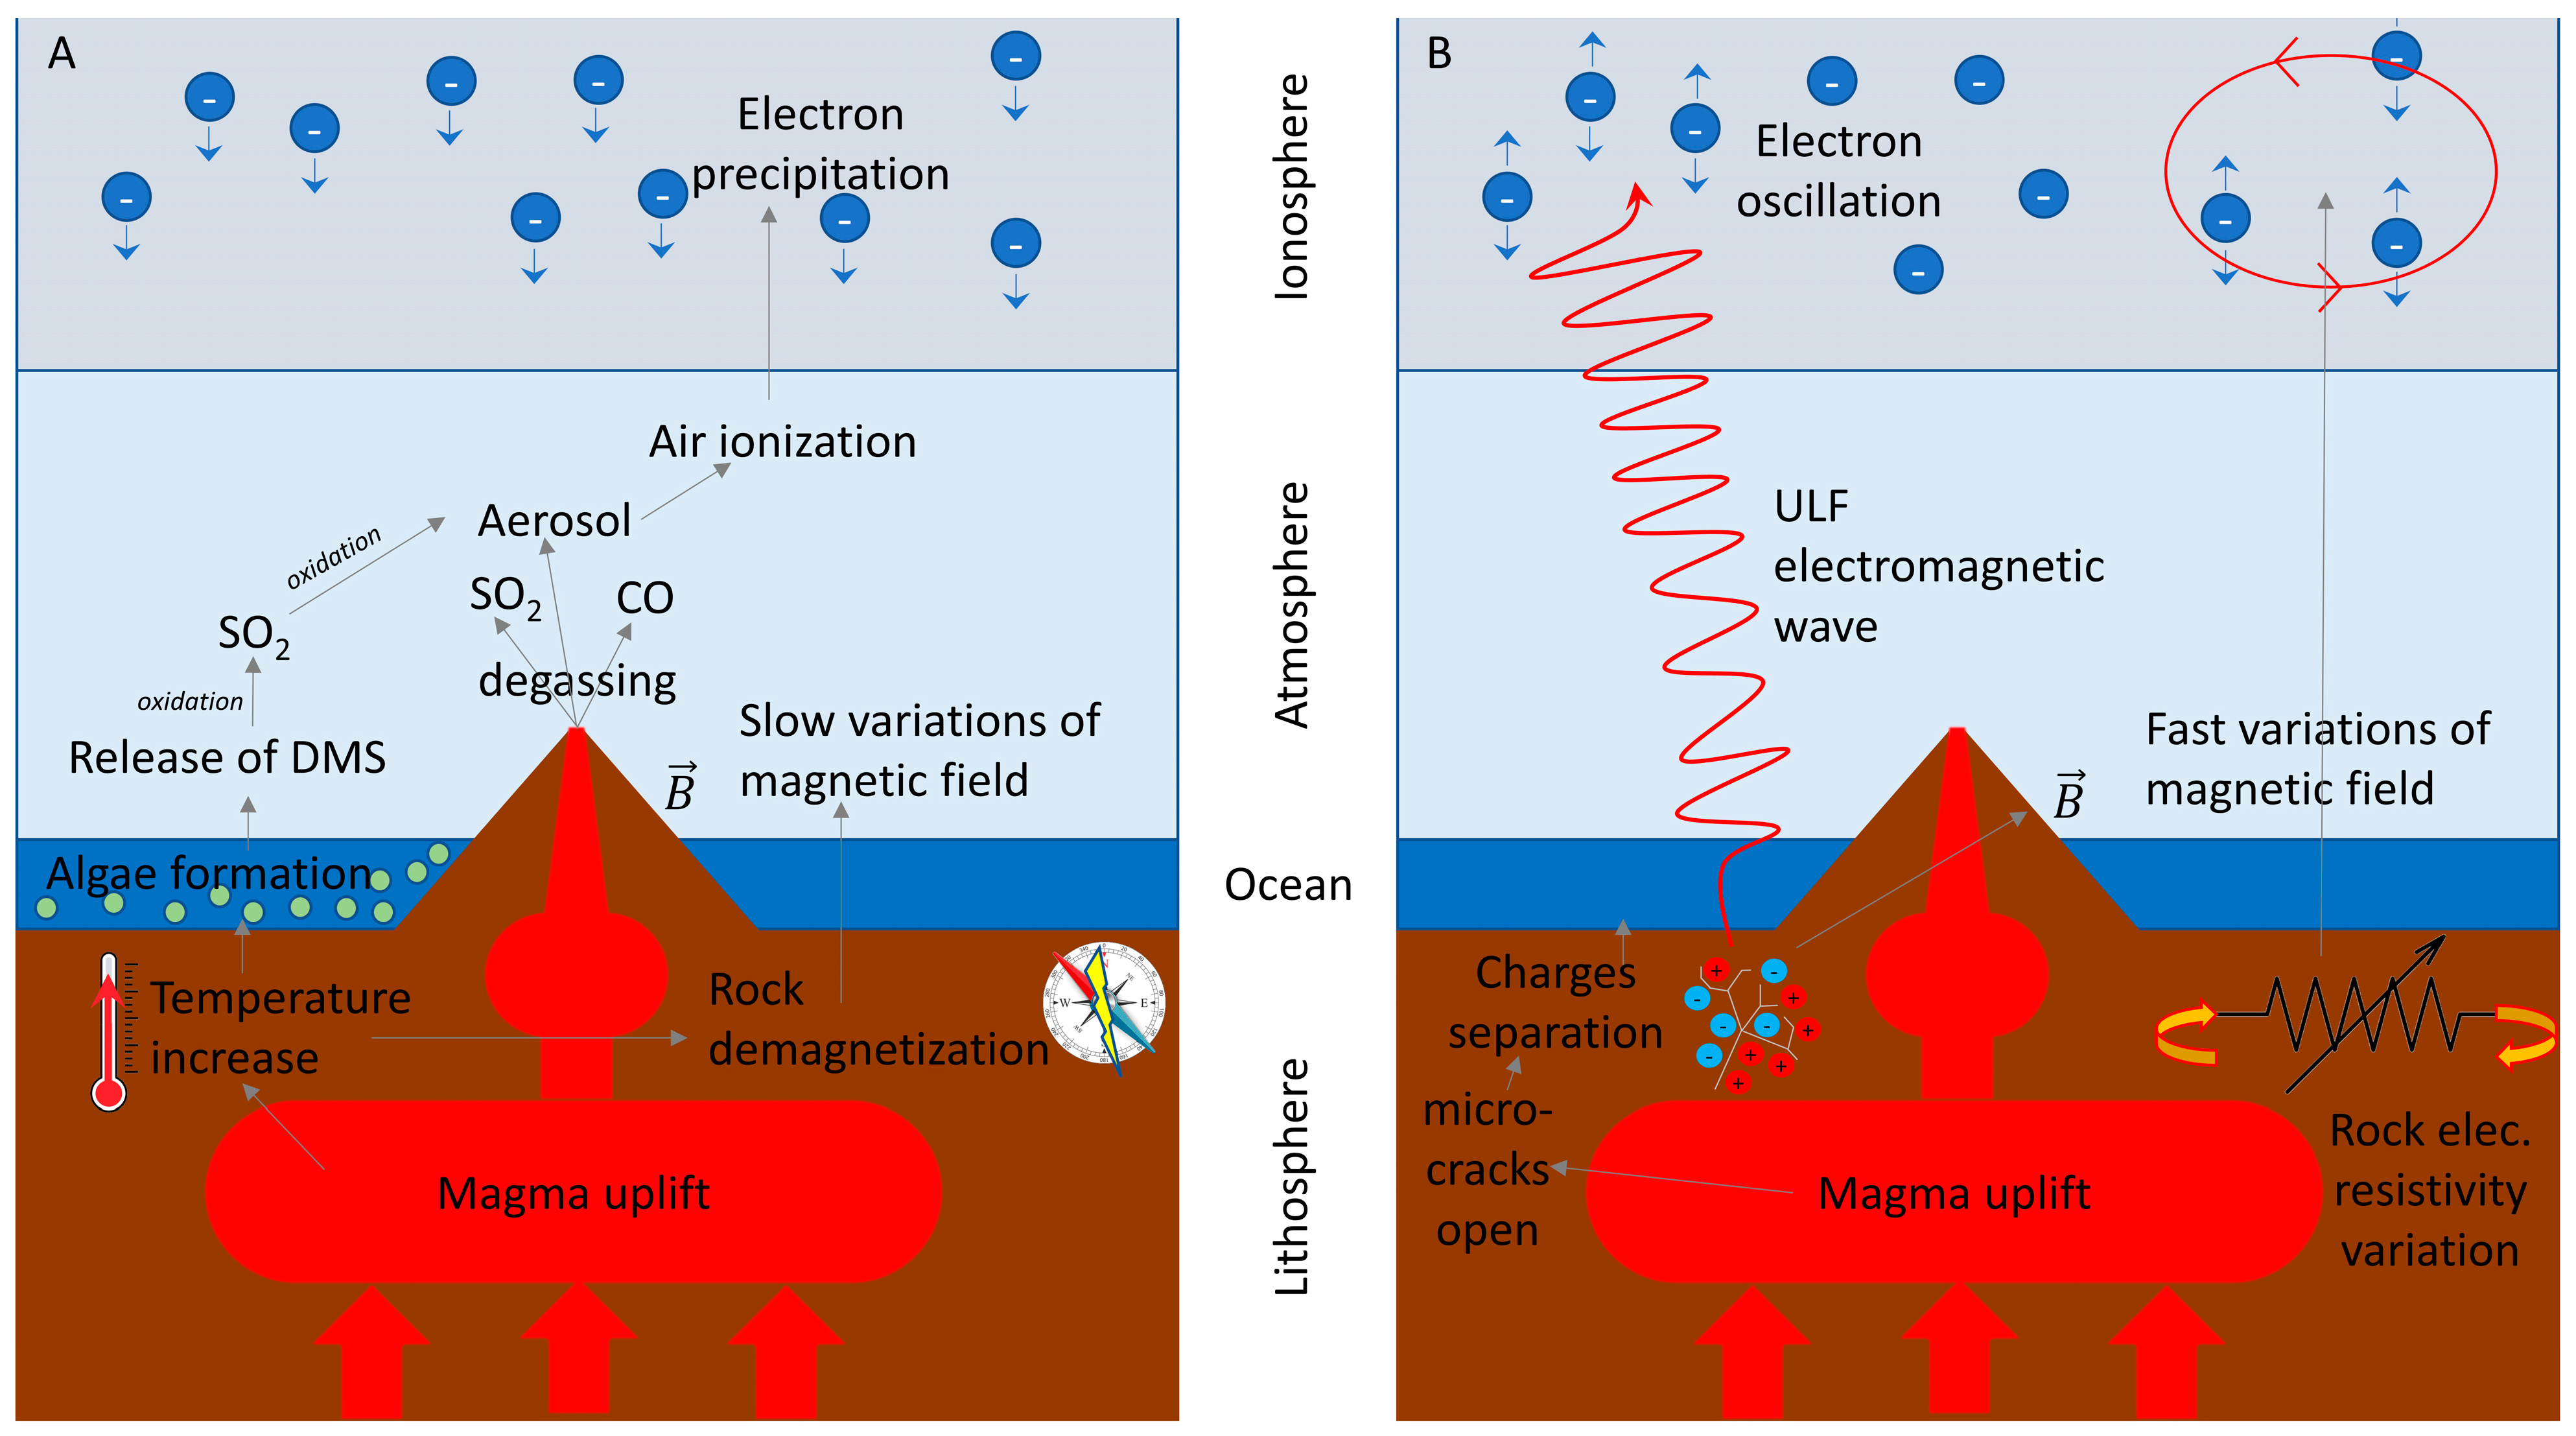
The basic source under the volcano is the magma accumulation in its magmatic chambers, and several volcanos have more than one (for example, Changbaishan in China [30] or La Palma object of this study [31]). The accumulation and uplift of the magma prior to the eruption can bring at least three effects: firstly, an increase in the temperature of the lithosphere under the volcano, secondly a demagnetization of the crustal due to the increase of the temperature above the Curie temperature, and thirdly a direct degassing from the cone of the volcano due to the rise of underground pressure [32]. The increase in temperature in the underwater lithosphere can trigger an increase in the growth rate of algae that are directly responsible for DyMethil Sulphide (CH3SCH3 or DMS) emission in the atmosphere [33]. Furthermore, DMS can be oxidated in the air, forming sulphur dioxide [34]. Despite the presence in the atmosphere of SO2 as a result of oxidation of DMS, we can expect a direct emission from the volcano, as it is among the primary sources of SO2 in the atmosphere [35]. SO2 can be oxidised, producing sulphate aerosol, so the whole chemical chain is: DMS oxidised in SO2, which is oxidised in aerosol [36]. Carbon monoxide is also directly emitted by volcanoes, even if its amount compared to other natural sources, like the burning of vegetation and even anthropogenic sources, is negligible for the global budget [37]. Volcanoes also emit water vapour (H2O), CO2, H2S, HCl, hydrogen fluoride, hydrogen bromide, CH4, CH3Cl, H2, and heavy metals, as explained by Wallace and Hobbs [36], but these other substances are not considered in this study. The process of accumulation of gases in the atmosphere could bring ionization of the air, which is an important key driver of possible electrical phenomena in the atmosphere and ionosphere, altering the global electric circuit of Earth [2,38]. The chain of these phenomena has been graphically resumed in Figure 2A. Another important factor to take into account is the required time of such phenomena, which could be days or weeks, according to some previous studies on earthquakes (e.g., [39,40]). Additionally, the persistence in the atmosphere of the investigated chemical compounds needs to be taken into account—it is 0.7 days for DMS, some days for SO2, and about two months for CO [36].
Other bottom-up lithosphere–atmosphere–ionosphere effects based on electromagnetic interactions could be possible, as we represented in the sketch of Figure 2B. For example, the uplift of the magma could open several micro-cracks in the rocks that can create separation of the electrical charges and the following generation of Ultra-Low-Frequency (ULF) electromagnetic waves, as proposed by Molchanow and Hayakawa for earthquakes [41,42]. In the case of the volcano, small earthquakes are generated, but they are due to volcanic activity and not tectonic activity. In principle, the same ULF electromagnetic wave theory from microfractures on the rocks can still be considered. The ULF electromagnetic wave can be theoretically recorded both at the Earth’s surface with geomagnetic ground observatories (as reported by Hattori et al. [43,44] for Japanese earthquakes) or in the ionosphere by satellites (as reported by Ouyang et al. [45,46] before several earthquakes). Enomoto [47] proposed that variation of electric resistivity in the lithosphere could produce a ring current in the ionosphere for an induction system. His model for earthquakes is constructed in a subduction context, the one where the volcanos are generally localized, in particular on the forearc of the subduction slab. Therefore, this model can also be considered for a possible explanation of pre-volcano phenomena in lithosphere–atmosphere–ionosphere. Due to the “pure” electromagnetic interaction mechanism of this second scenario, we do not expect a direct effect in the atmosphere, even if, in principle, the currents can facilitate the accumulation of aerosol (that are easily polarized particles) in clouds.
Other possible bottom-up propagation ways could be based on acoustic gravity waves as proposed, for example, by Hayakawa [48], but we do not consider them in this paper.
Finally, we would remark that the main two proposed scenarios in Figure 2 are not exclusive, and they could exist at the same time or in different stages of preparation of the eruption, for example, in function of the depth of the magma uplifting movements.
Finally, in this paper, multiparametric analysis of lithosphere, atmosphere, and ionosphere before the La Palma volcano eruption of 19 September 2021 is provided in order to extract anomalies in these three geo-layers, providing a brief description of data and methods in Section 2 and the results in Section 3. To the authors’ knowledge, this is the first time a comprehensive analysis has been provided for this volcano, and very few examples exist in the literature about other volcano eruptions as the papers often investigated only one or few parameters and not in a multi-layer approach. Our results are discussed in the view of lithosphere–atmosphere–ionosphere bottom-up interactions in Section 4; even if this study does not pretend to demonstrate the geo-layers interactions but only support them by observations and empirical considerations, future studies are vital to address better this point. We provided our conclusions in Section 5 and some Appendixes and Supplementary Materials, with additional details of the investigations and validations of the used datasets.

2. Materials and Methods

2.1. Earthquake Catalogue

In order to study the lithosphere and eventual variations in the crust, the earthquake catalogue has been acquired and investigated. As the seismicity eventually produced by volcanic activity is expected to be characterised by low magnitude seismic events, it is essential to use a catalogue obtained from a dense and sensible seismic network, i.e., with a low threshold of detectable seismicity. For this purpose, we selected the earthquake catalogue provided by the Spanish National Institute of Geography, which is the most complete for the Canarias Islands, to the knowledge of the authors. The data were firstly investigated by the seismic analysis tool freely provided by ETH (Zurich, Switzerland) ZMap [49], in particular to search for the completeness magnitude “Mc” of the catalogue and its variations over the decades. To properly monitor the possible variations of seismic trend, the Cumulative Benioff Strain “S” [50] was estimated, limited to the event with magnitude M > Mc:
S ( t ) = t 0 t 10 ( 1.5 · M + 4.8 ) = i = 1 N E i
where “t” is time that starts from “t0”. The calculus can be performed by summing the square root of the released energy “Ei” in Joule of the “N” earthquakes that occurred from “t0” to “t”.

2.2. Atmospheric Data and Methodologies

The atmosphere was investigated with two types of observables: one is the geomagnetic field, and the other is its composition. The two approaches rely on the different possible main mechanisms that have been previously illustrated in Figure 2.
The geomagnetic field has been explored with the geomagnetic measurements sampled at 1 min from Guimar (GUI) at Tenerife Island compared with Tamanrasset (TAM) in the Algeria–Sahara Desert, a far observatory from the volcano. GUI is located at 28.321°N, 16.441°W, 868 m above sea level and TAM at 22.790°N, 5.530°E, 1373 m above sea level. Both observatories are equipped with several instrumentations. Still, in this work, only the fluxgate three components of the geomagnetic field in the NEC (North-East-Centre) frame have been investigated.
To investigate the atmospheric composition and, in particular, possible alterations due to volcano activity and gas emissions, the data from the climatological archive Modern-Era Retrospective Analysis for Research and Applications, Version 2 (MERRA-2, [51]) released by NASA and updated monthly were retrieved. The dataset has a spatial resolution of 0.625° in longitude and 0.5° in latitude and a time resolution of one hour. For this study, the value closer to the local midnight has been selected to reduce the possible influence of day-time variation produced by solar irradiation on the atmosphere. In particular, solar irradiation increases the Earth’s surface temperature, which can facilitate some chemical reactions close to the ground, influencing the atmospheric composition, especially close to the surface, with some of the quantities that we analysed (e.x., CO surface concentration). This paper investigated sulphur dioxide, Dimethyl Sulfide (DMS), Aerosol Optical Thickness (AOT), and carbon monoxide. Volcanoes normally emit such substances, which can be a proxy of the underground activity of magma pressure and movements before the eruptions.
The values of such parameters in the six months prior to “La Palma” volcano eruption were investigated using the “MErra-2 ANalysis to search Seismic precursors” (MEANS) algorithm [52]. For each parameter, the algorithm calculates the mean daily value closer to the local midnight not to be influenced by solar irradiation inside a square box of 3° side centred on the volcano. Then, it compares the value in the year with the eruption with the historical mean and standard deviation of the same day of the other available years from 1980 to 2020 (for example, 23 March 2021 is compared with the mean and standard deviation of (23 March 1980, 23 March 1981, …, 23 March 2020). If one year presents one or more values above the mean + 10 standard deviations, this is excluded, and the whole time series is computed again. This is particularly important for volcano regions to exclude other eruptions that could alter the estimation of the typical value.
In this paper, we also decided to plot the basic time series of the whole available years from 1980 to the La Palma eruption in 2021. As most of the parameters clearly show a seasonal modulation, the signals have been decomposed by the wavelet decomposition tool of Matlab in several frequencies [53]. For this purpose, we decided to use 9 frequency bands whose limits were selected by the same algorithm based on the spectral energy content in the original signal (as decomposed by wavelet). The reconstructed signal has excluded the frequency band containing a one-year period (i.e., the one with an automatically identified period range from 248 days to 531 days). The detrended (i.e., reconstructed) signal has been analysed as a time series and by the third and fourth statistical moments that estimate the symmetricity and tallness of the distribution—Skewness and Kurtosis.

2.3. Ionospheric Data and Methodologies

The ionosphere has been investigated in terms of its plasma electron density and the magnetic field’s observations from two different satellite missions: China Seismo Electromagnetic Satellite (CSES) and the European Space Agency ESA Swarm three-identical satellite constellation. CSES is a multi-payloads satellite mission primarily dedicated to searching for possible pre- and co-seismic effects of earthquakes in the world [54]. For this purpose, it is equipped with several instruments to detect possible particle bursts, variations of electric and magnetic fields, and the plasma property and composition of the ionosphere. Such a combination of instrumentations is not only precious for studying earthquakes and other natural hazards like volcano eruptions but also for more general geophysical studies, like elaborating a model of Earth’s magnetic field (Yang et al. [55]). The Swarm mission is the “state of the art” for measuring the Earth’s magnetic field and its evolution [56]. The mission has been in orbit for more than eight years, providing excellent results such as the detection of oceanic currents [31], understanding of the geomagnetic field, and even its variation in quasi-real time as an acceleration of movement of geomagnetic poles [57].

2.3.1. CSES Electron Density Data Processing

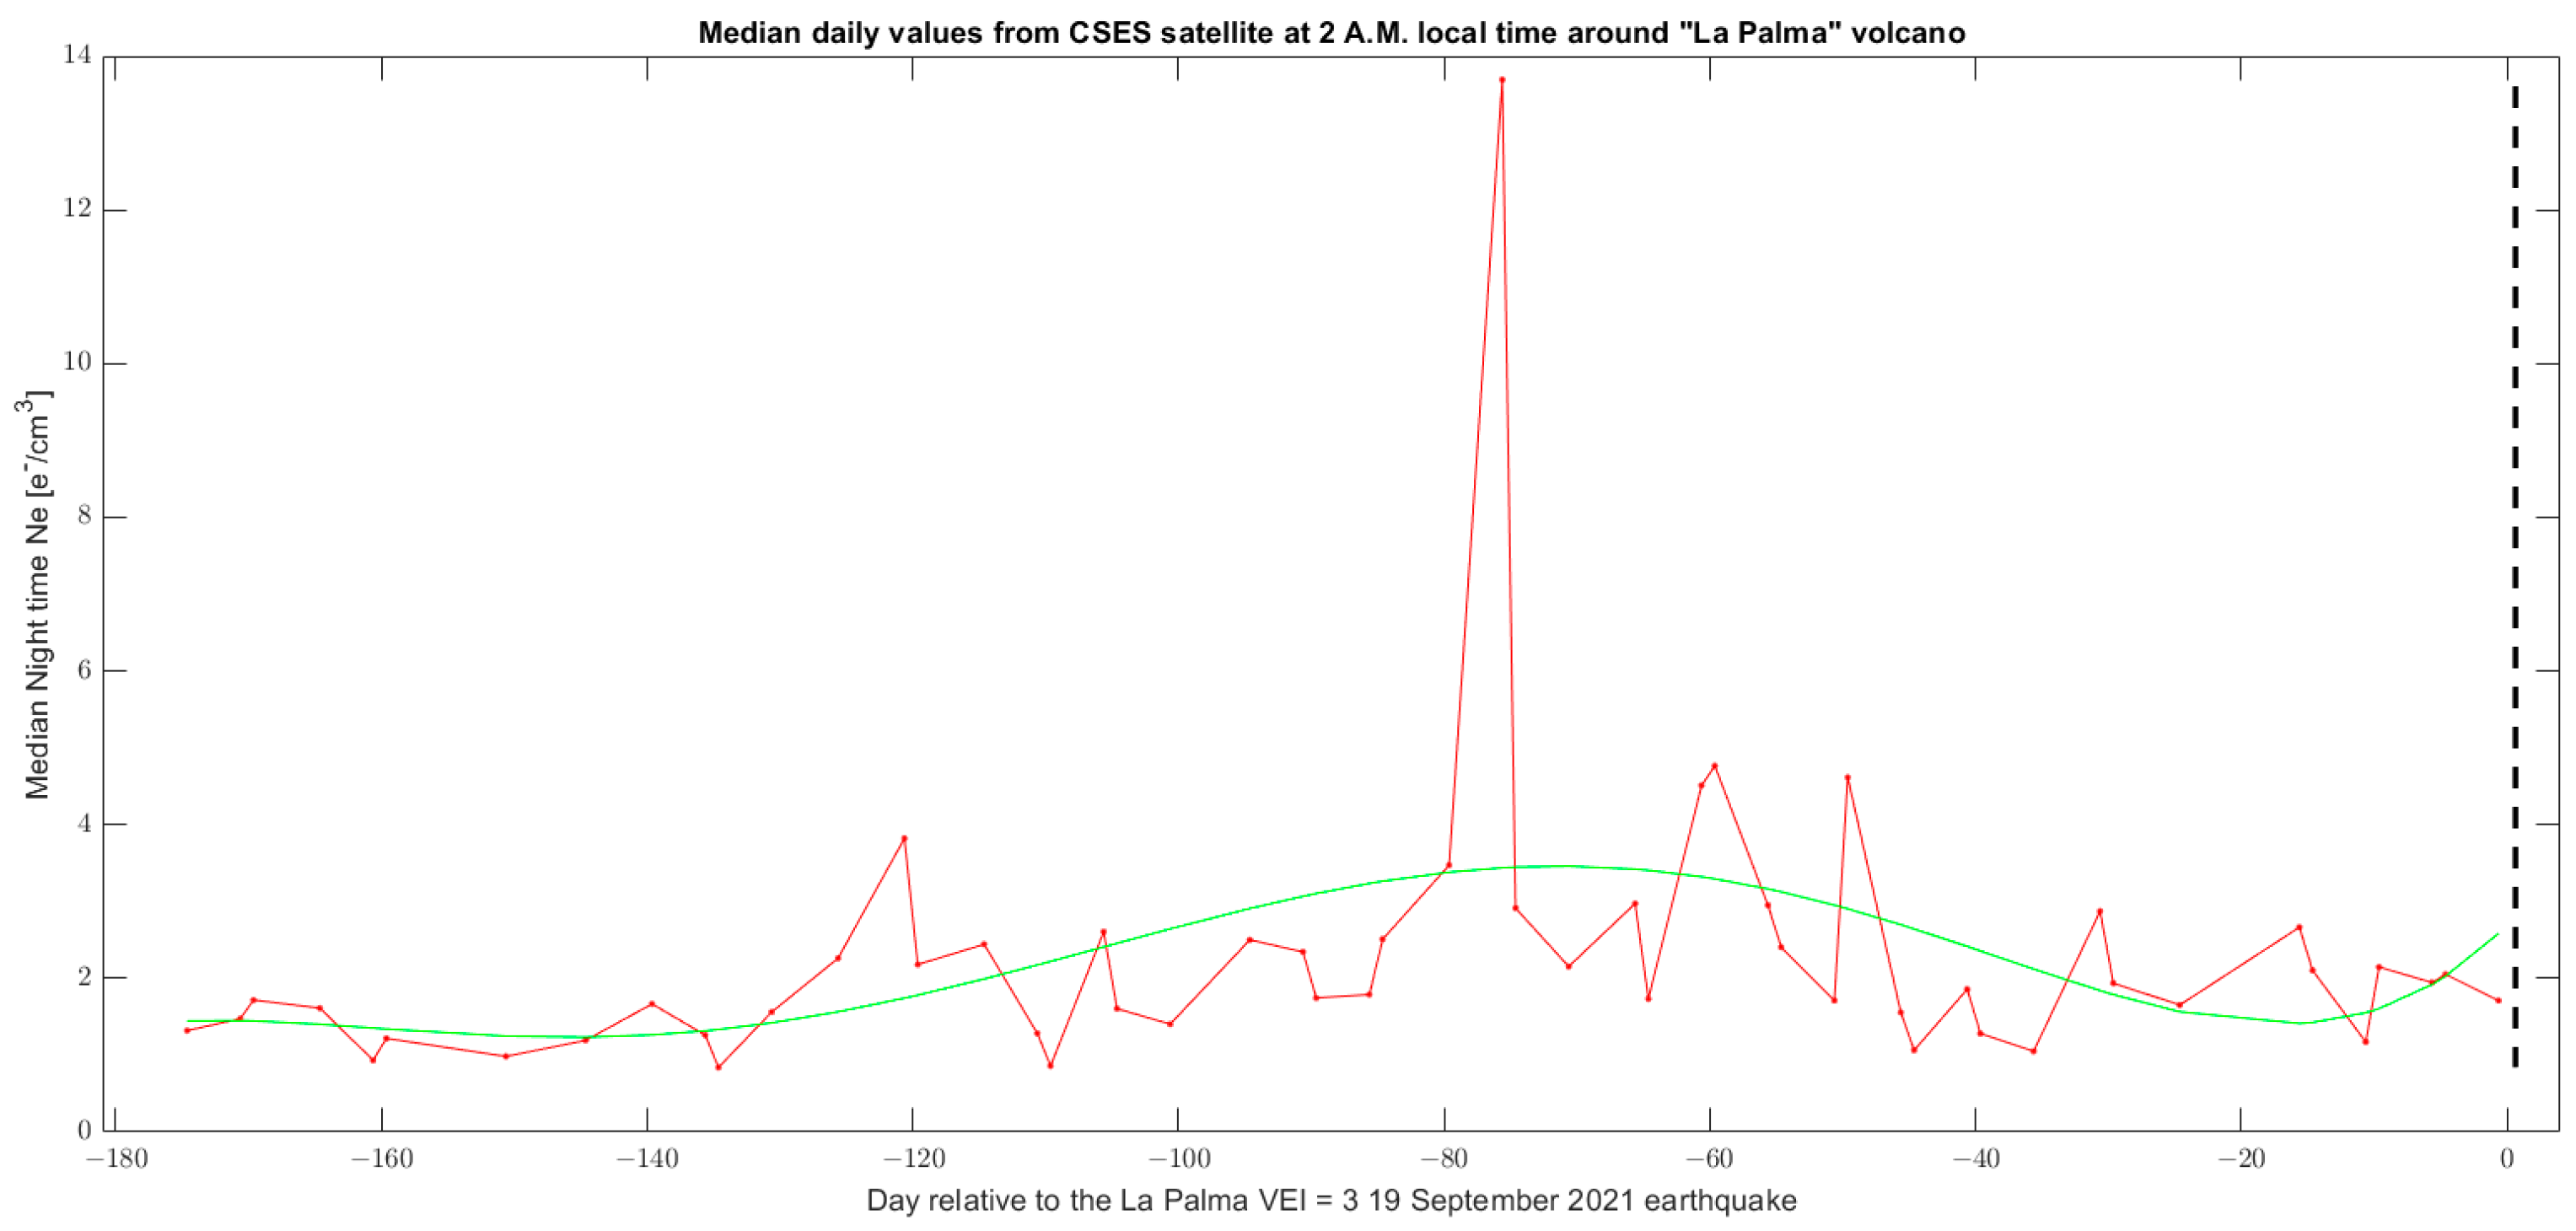
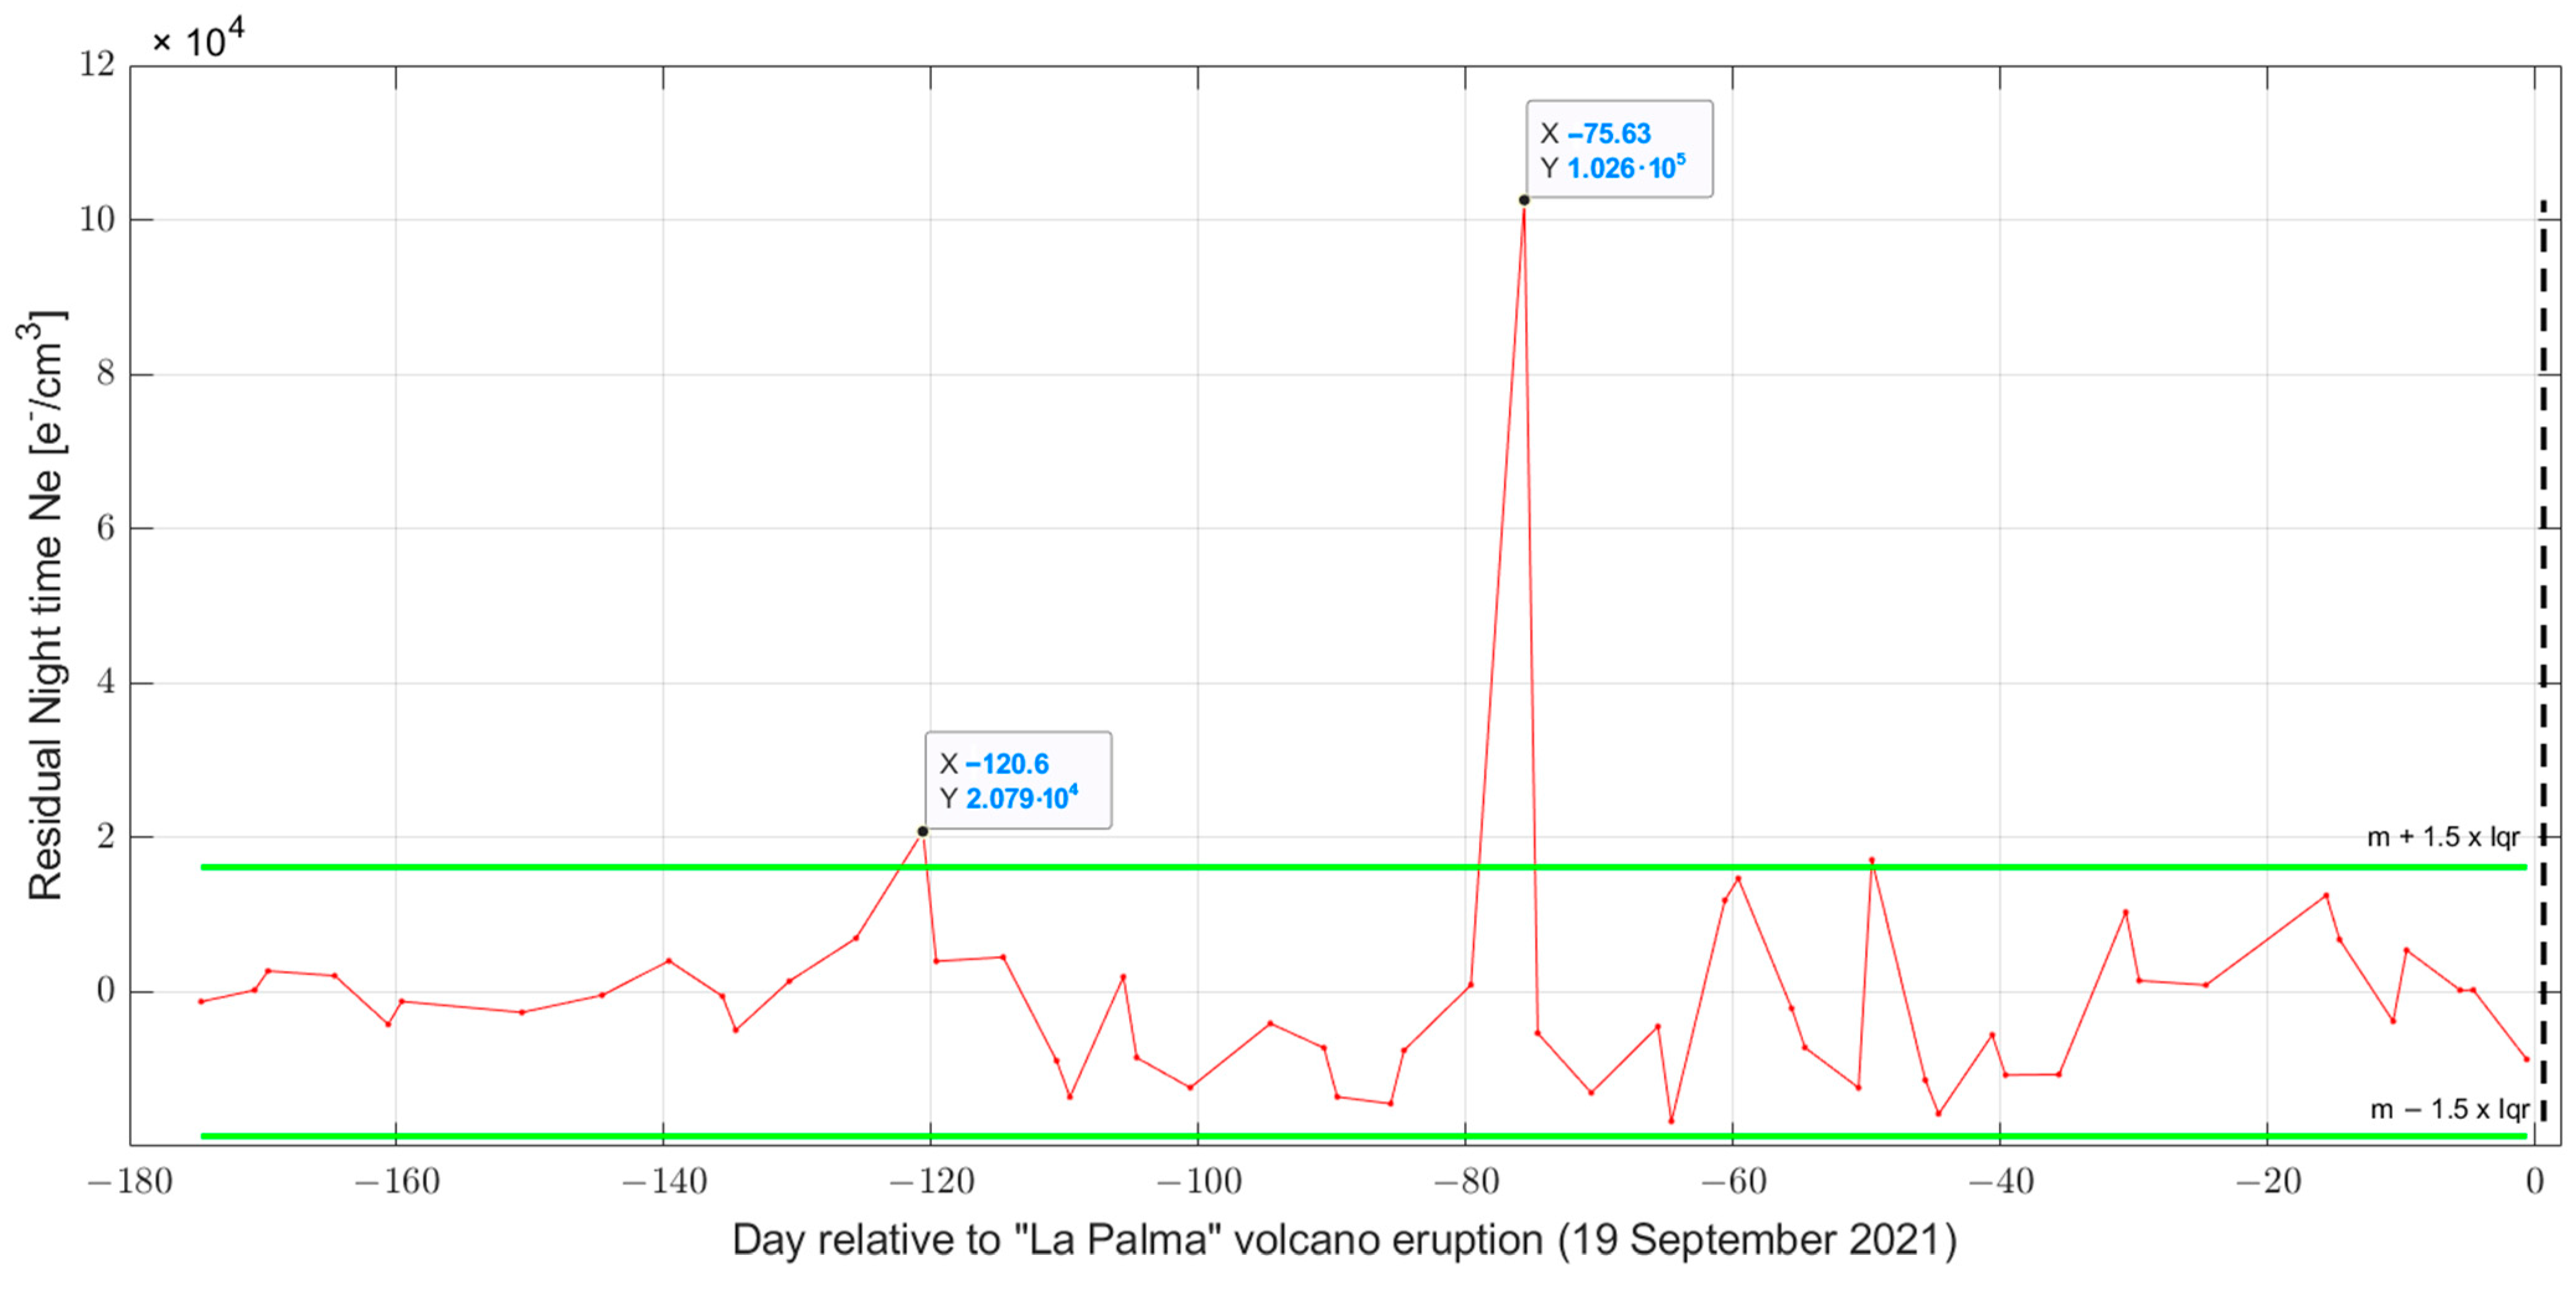
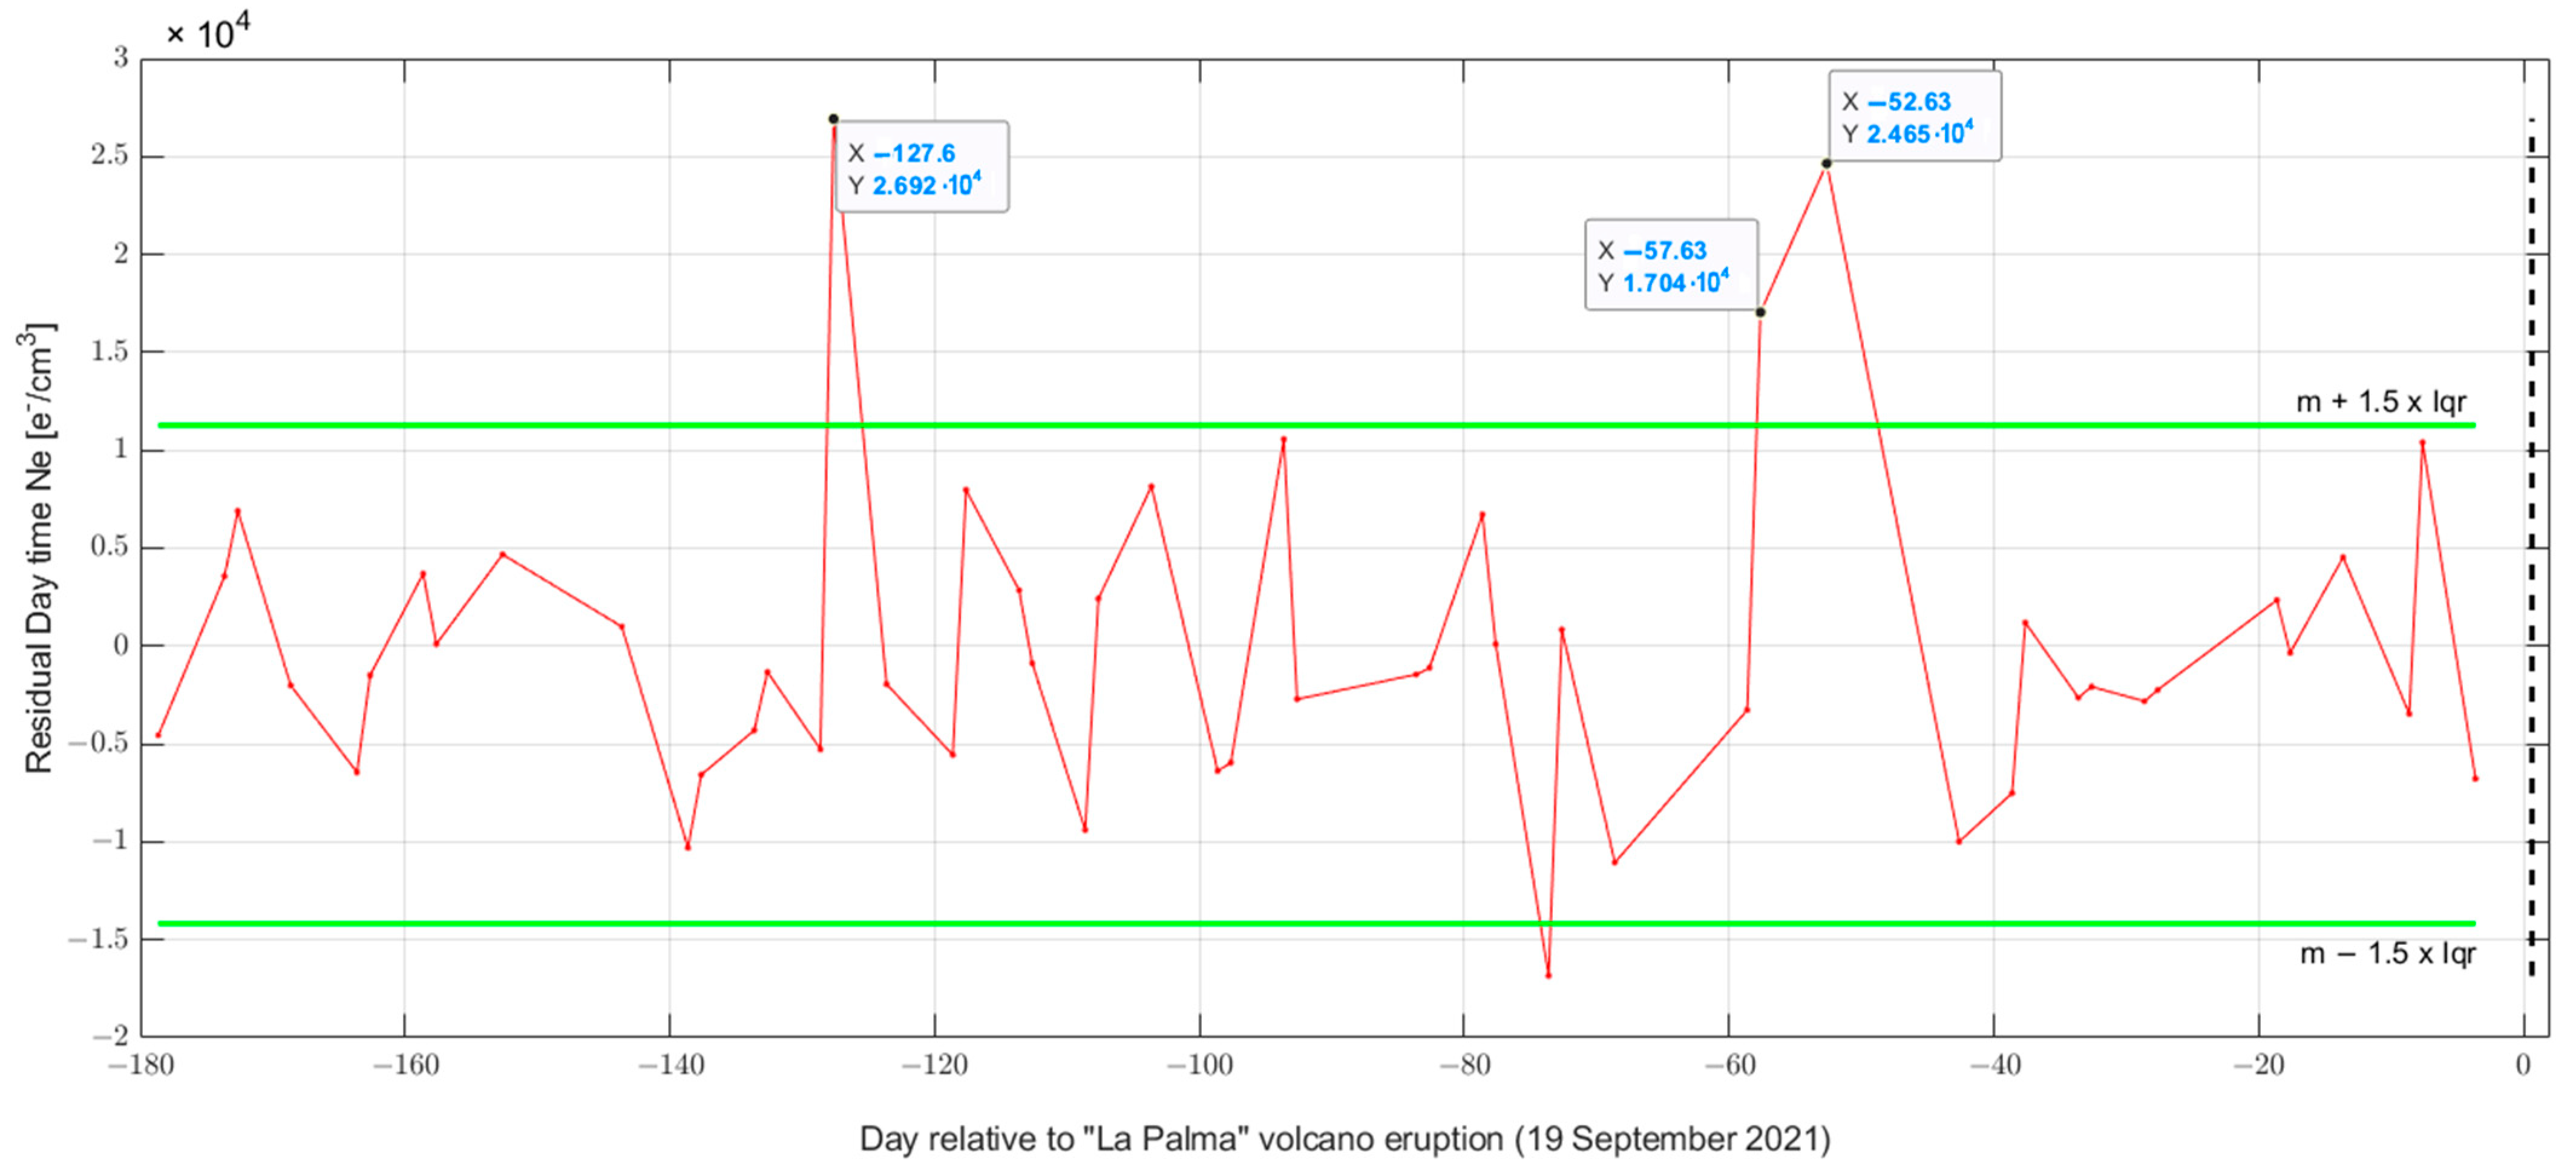
CSES data were first analysed by constructing a night-time and day-time electron density (Ne) time series and secondly by checking the latitudinal profiles. The time series was built by computing the daily median value of all the Ne samples acquired in a circled area centred on the volcano. Only the tracks acquired during quiet geomagnetic conditions determined with Dst and ap geomagnetic indexes were considered. The ap index is a global 3-h index obtained from several geomagnetic observatories placed at different latitudes and gives an indication of the status of the geomagnetic activity on Earth [58]. Dst index has been selected as it is obtained from 4 geomagnetic observatories close to the geomagnetic equator, and it is representative of the geomagnetic activity in the equatorial region where “La Palma” volcano is placed [59]. Dst has recently been proved to be a good estimator of the ionosphere’s geomagnetic conditions; recent works reproduced the Dst index from data of Swarm and CSES satellites (the same satellites used in this work) [60,61]. In particular, we impose that |Dst| ≤ 20 nT and ap ≤ 10 nT for quiet conditions. If no tracks are available in quiet geomagnetic conditions or for other reasons, the day is skipped on the time series. Even if the samples are always acquired at the same local time for the Sun-synchronous orbit of CSES, a seasonal trend is still present in the time series. Consequently, we fitted a polynomial of 5 degrees for night-time and 7 degrees for day-time and removed it to construct a final detrended time series. The polynomial grade was empirically determined in previous studies based on the same CSES Ne time series, for example, by Akhoondzadeh et al. [62]. On this detrended time series, the median and interquartile range were calculated in order to define the anomalies as the values that overpass the median plus 1.5 times the interquartile range. Further details of the CSES Ne analyses are provided in Appendix A. Since LAIC models predict an enhancement of electron density [2,63,64], we do not consider eventual negative anomalies, i.e., low electron density values.

2.3.2. Total Electron Content Data Processing

In order to validate the CSES Ne data and further investigate the ionosphere status above La Palma volcano, the Global Ionospheric Maps (GIM) map of the vertical Total Electron Content (vTEC or simply TEC) has been retrieved. The Total Electron Content is the vertical integral of the electron density Ne. It is measured from Global Navigation Satellite System (GNSS) stations on the ground receiving two frequency signals from GNSS satellites in geostationary orbits of one or more constellations (e.g., Global Position System, GPS; Compass Baidu, Galileo) operated by several space agencies. As the “line of sight” of the satellite is generally inclined with respect to the vertical (defining the zenithal angle distance), the measured quantity is the slant–TEC. By a geometrical correction, the vertical TEC was estimated. In this work, we download the pre-processed GIM-TEC maps that some researchers like Tornatore et al. [65] compared with other techniques to obtain TEC in a regional context, founding a general good correlation. Despite this, the absolute TEC values were generally overestimated in GIM, especially in high solar activity. For the purpose of this study, the data are used to construct TEC time series, which are irrelevant to an eventual overestimation of TEC and to validate CSES Ne, verifying that the structures are compatible. Therefore, this task is not affected by the TEC absolute value.
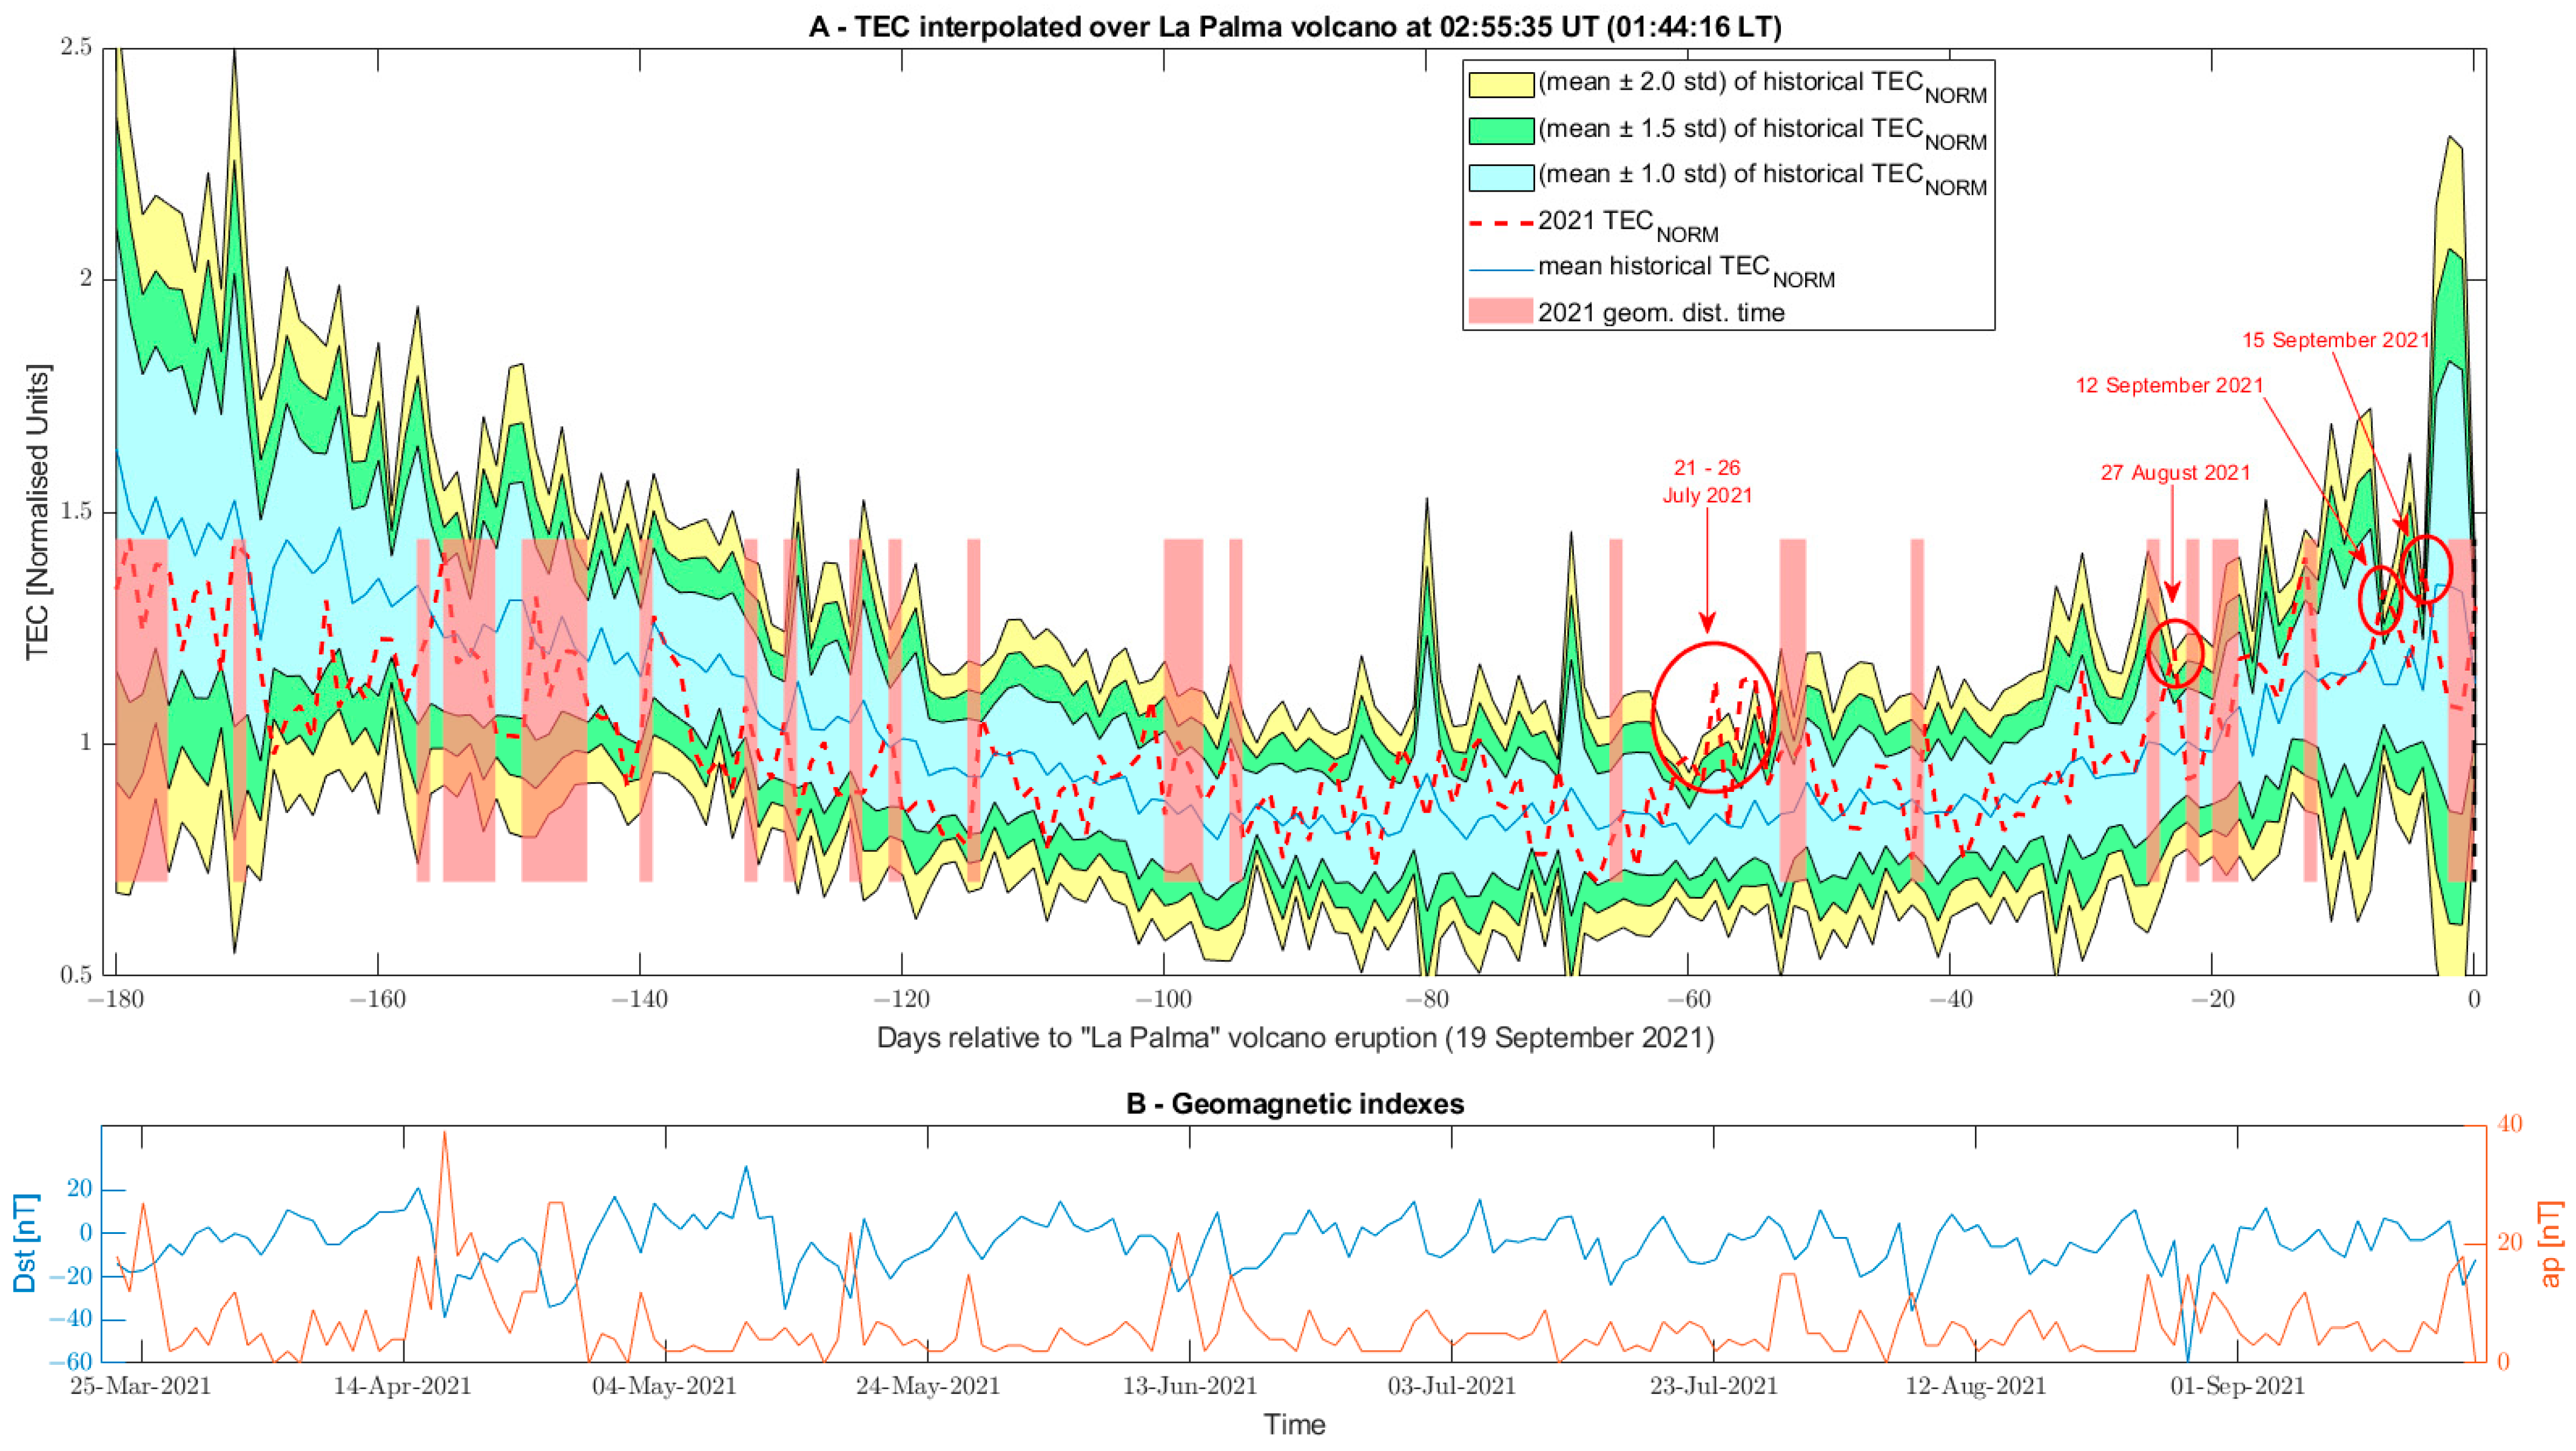
We retrieved the GIM TEC data from International GNSS Service (igns) from 2000 to 2021 from 23 March until 19 September (6 months for each year). In order to construct a time series of the typical value of the year, it was fundamental to remove the solar cycle modulation from the data. As the original data had a 5° longitude and 2.5° latitude space resolution and 2 h of time resolution, we interpolate the TEC value above “La Palma” volcano at 1:44 LT. The chosen local time is the hour of the night-time passages of CSES-01 at La Palma latitude; in this way, the data will be more reciprocally comparable. To spatially interpolate the data, a two-dimensional cubic interpolation was performed, obtaining the previous and following data after a linear interpolation was performed to estimate the TEC at the selected local time.
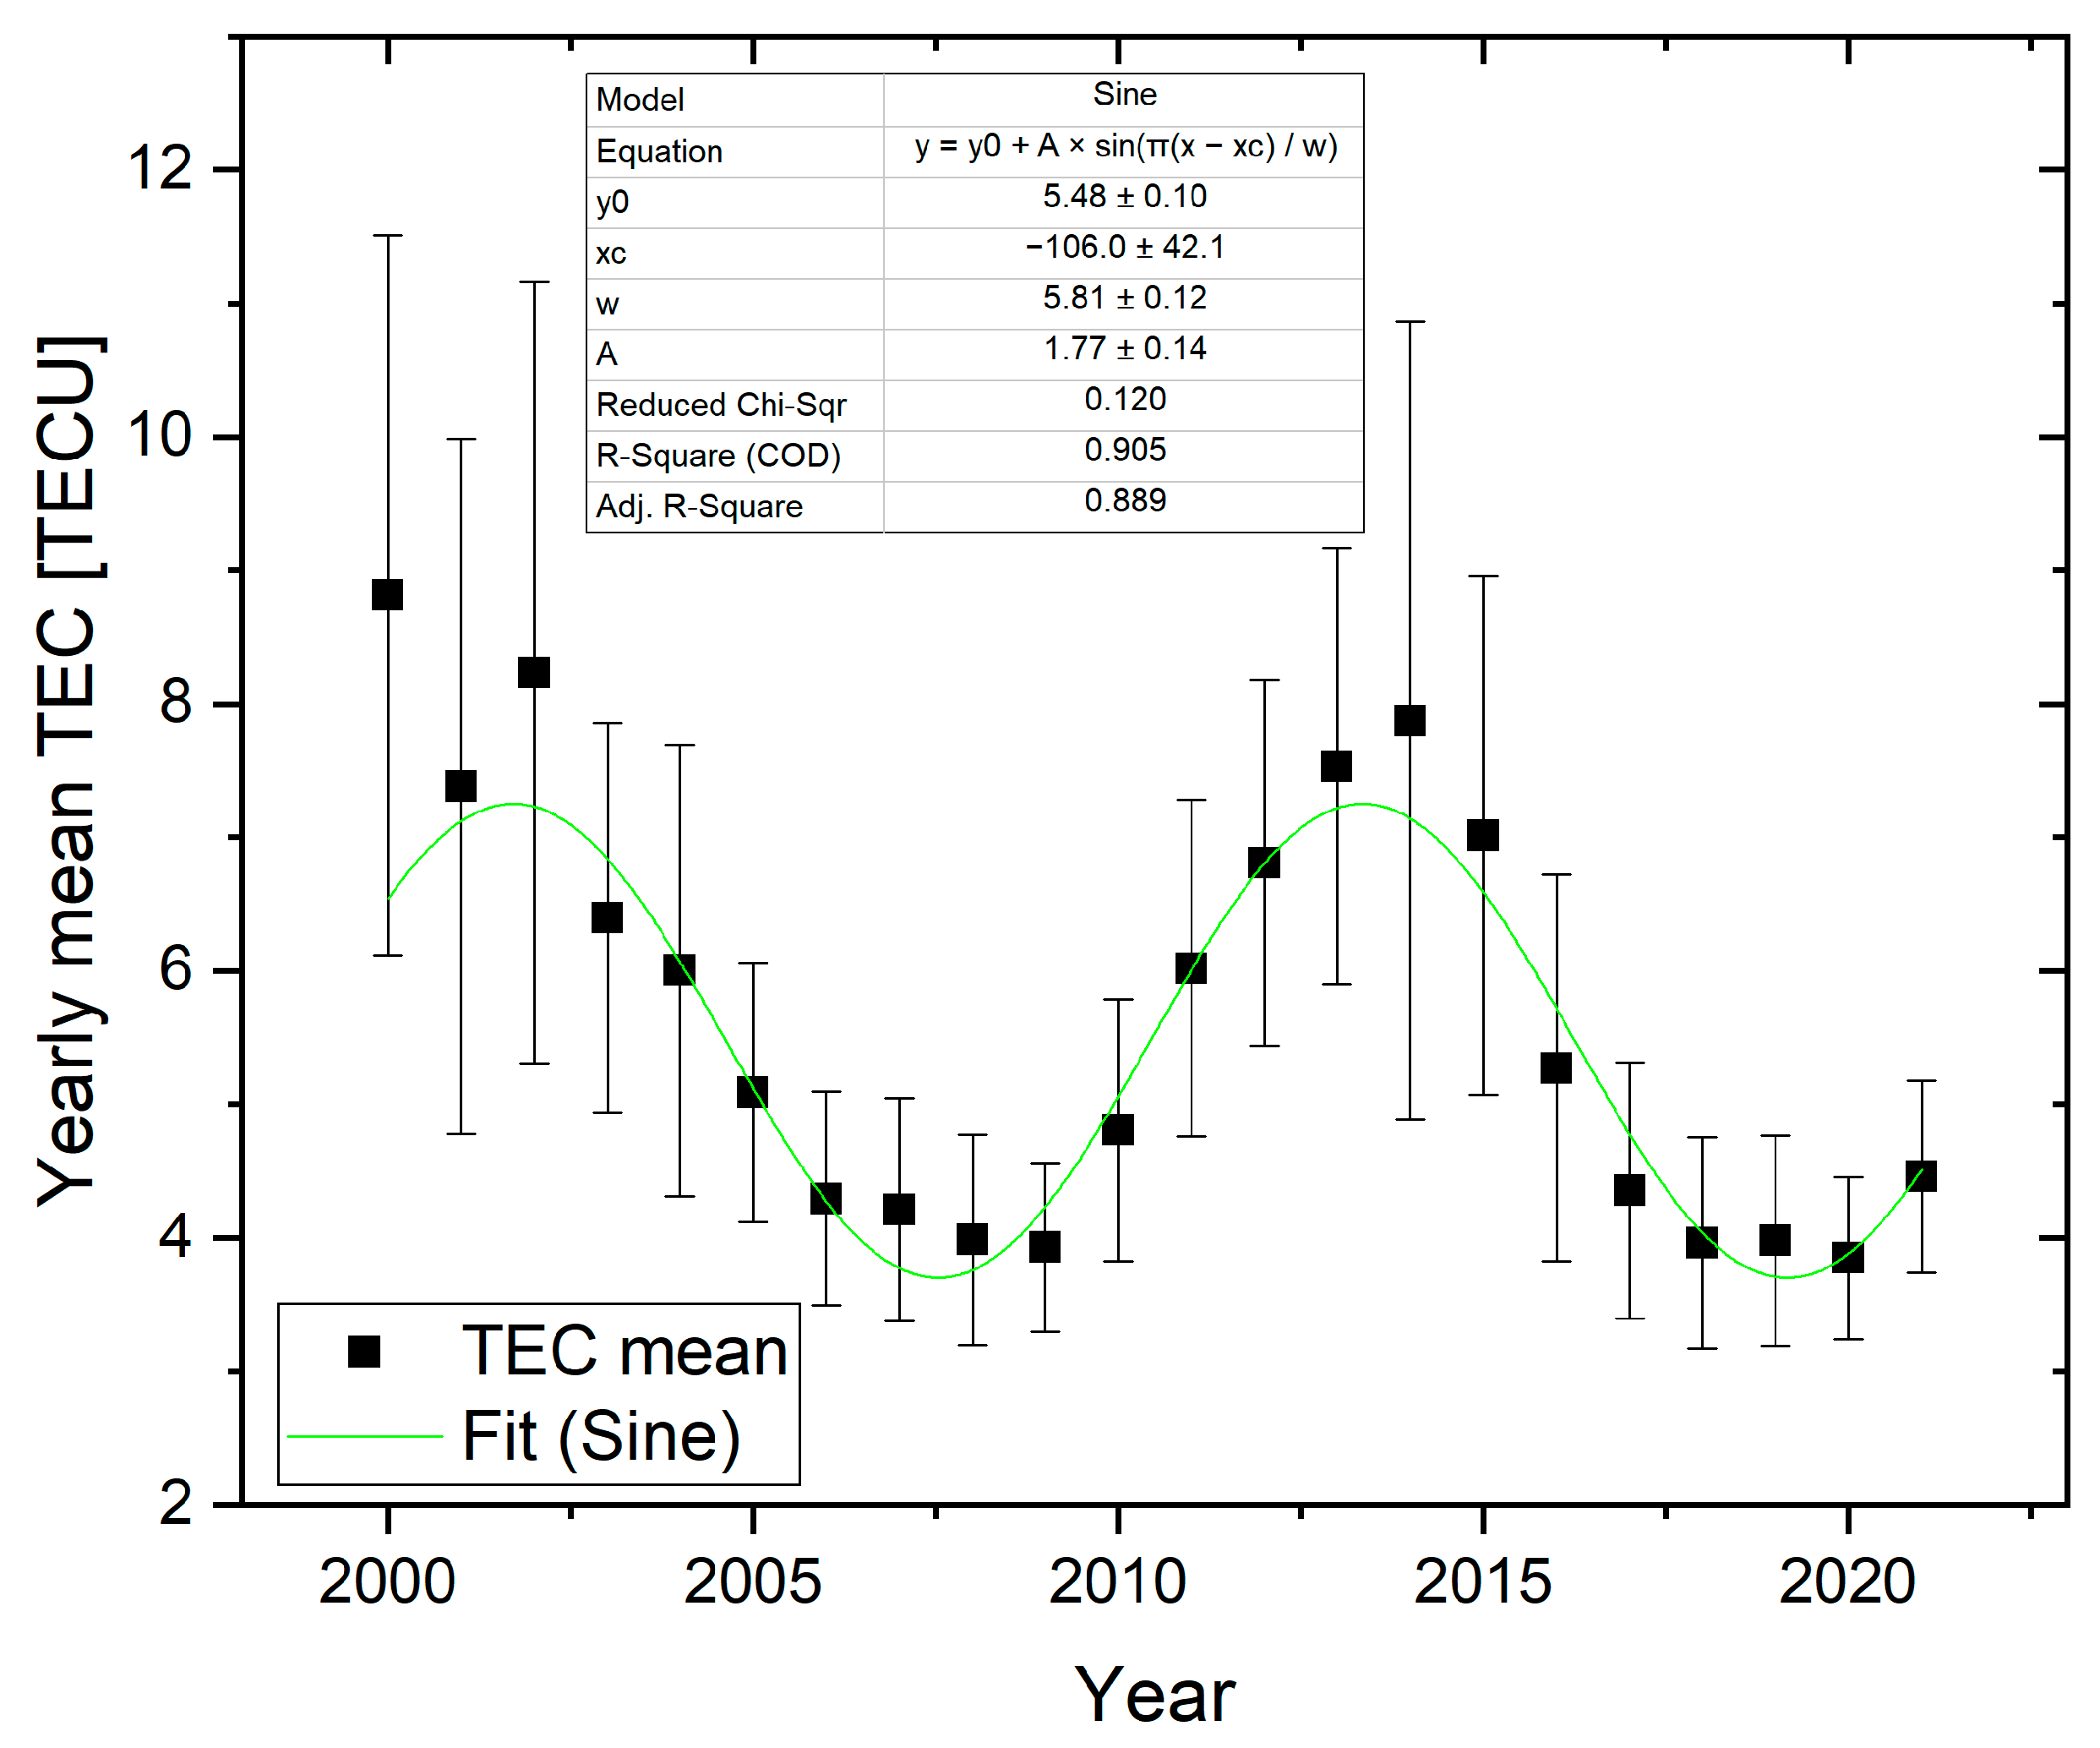
The yearly mean on the values from 23 March to 19 September of TEC above La Palma is shown in Figure 3. The modulation of TEC is evident from the 11 year solar cycle. A sinusoidal fit has been performed, and its period of 11.6 years (2 w) is very close to the theoretical period of 11 years. We note that in the maximum of 2000–2002, the TEC values seem higher than in the maximum of 2013–2015, and better future implementation of this method could include the Sunspot number or another indicator of the solar activity to fit not only the modulation but also the variations of the intensity of each maximum (and minimum). Indeed, for the present work, the fit can be more than sufficient, with adjusted-R2 equal to 0.889. To obtain a time series that is detrended from the solar modulation, the TEC data were divided for the sinusoidal fit “Sine” which estimated the following normalized TECTECNORM”:
T E C N O R M ( d a y ,   y e a r ) = T E C ( d a y ,   y e a r ) S i n e ( y e a r )
The historical time series was calculated with the normalized TEC values in analogy with the atmospheric data investigation. The TEC anomalies have also been defined as the value of the 2021 TECNORM, which overpassed the two standard deviations of the historical time series based on the years 2000 to 2020.

2.3.3. Swarm Magnetic Data Processing

Magnetic data of ESA Swarm mission were investigated using the MAgnetic Swarm anomaly detection by Spline analysis (MASS) algorithm defined and used in several papers searching for electromagnetic pre-earthquakes signals [4,5,40,66,67,68]. Basically, MASS computes a first-order approximation of the derivative of the magnetic signal (X-North, Y-East, Z-Centre, or F-Scalar) and subtracts a cubic spline fitted on the same derivative data [66]. What remains is called the residual signal or simply the residual, and it is analysed by a moving window (of 3° latitude in this work) that moves along the track with a step of 1/5 of window length. If at least one root mean square rms is greater than “kt” times, the Root Mean Square RMS of the whole track and geomagnetic conditions are quiet (|Dst| ≤ 20 nT and ap ≤ 10 nT), the centre of the window is inside the research area, and the track is defined as anomalous. “kt” is the threshold to define an anomaly, i.e., how many time the residual in the window must be greater than the one in the whole track. For a normal distribution of residual, it acts on the number of standard deviations.
The cumulative number of the anomalous tracks in the function of the time is represented to search for possible variation with respect to the mean trend that is expected to be almost linear with a positive but not null slope, as other phenomena apart from the one under investigation can also generate magnetic anomalies. On the other hand, an increase with respect to such a trend could be, in principle, due to the phenomenon under investigation (in this case, La Palma volcano eruption).

2.3.4. Monitor the Solar Activity

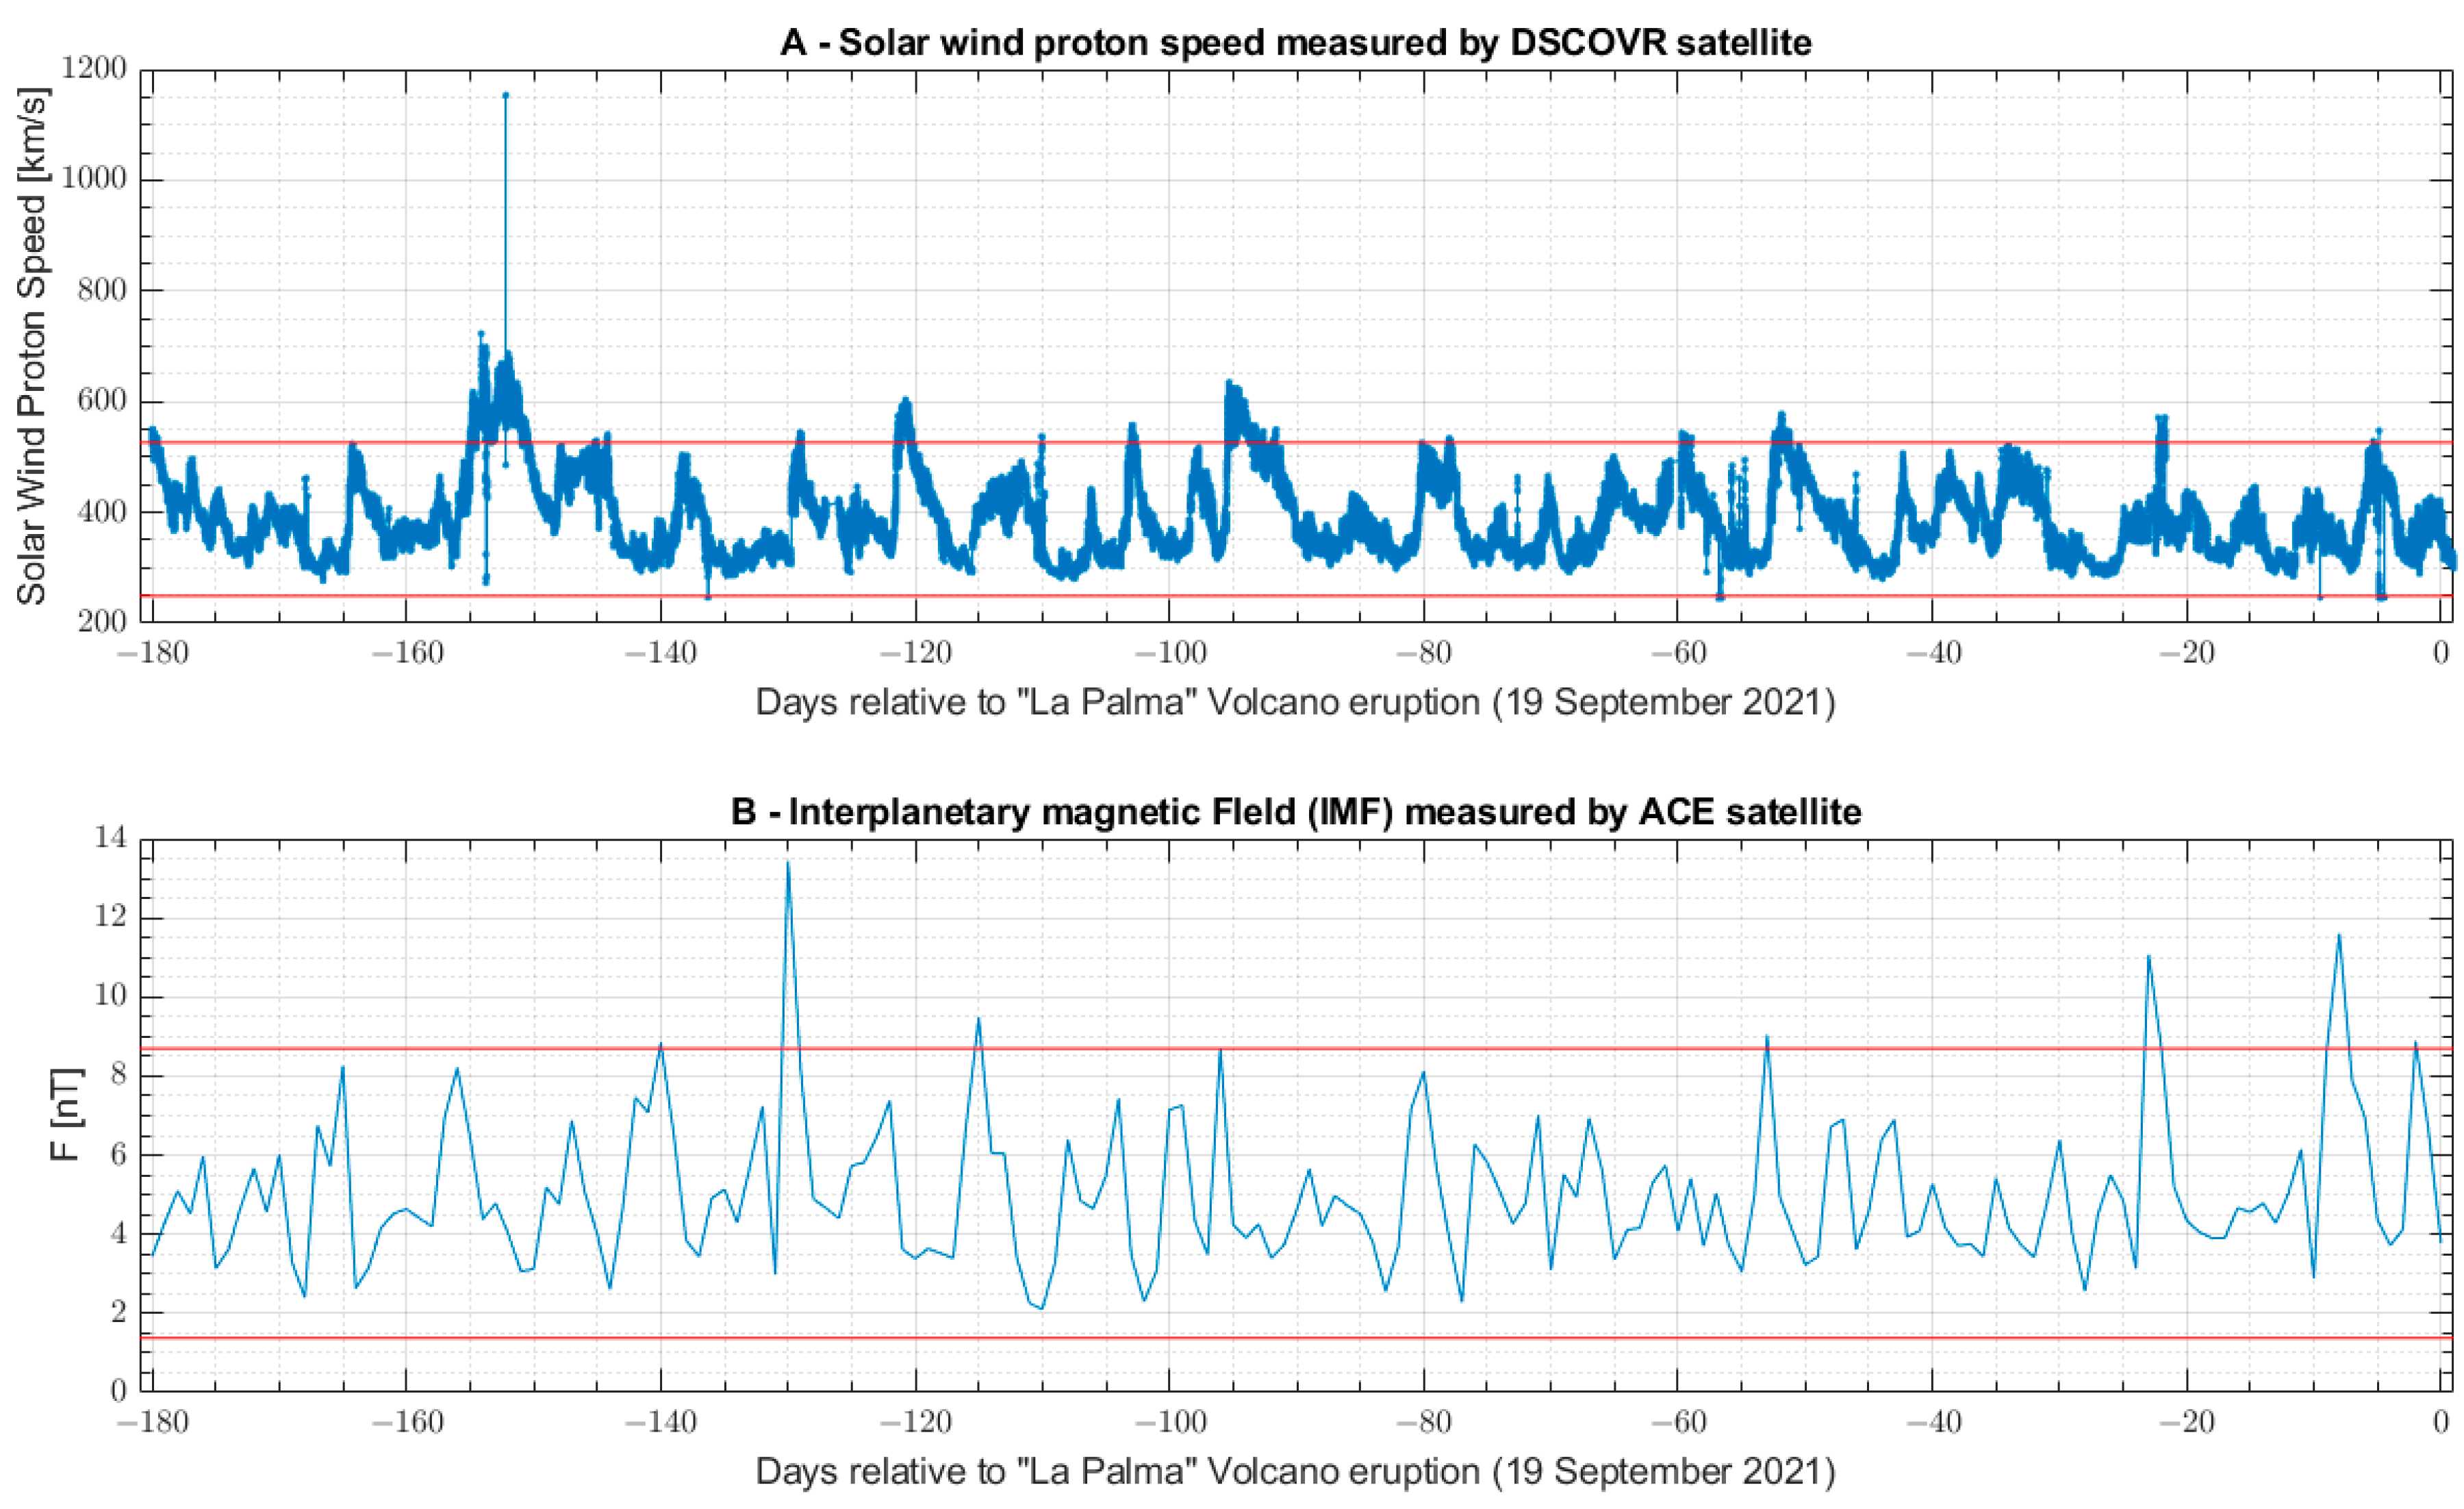
In order to properly discriminate the ionospheric anomalies due to external disturbances like solar activity, we provided two representative quantities of the solar conditions in Figure 4: the solar wind speed and the Interplanetary Magnetic Field (IMF). We retrieved these data from two satellite missions in Lagrangian point L1, i.e., about 1.5 million km from Earth in the line connecting Earth and Sun. Such a place is a special point for the gravitational field (i.e., the Earth and Sun gravitational fields are equipotential at this point) [69] and overall is a point place in the magnetosphere that can record the increase of solar activity with about one hour before the eventual impact on the Earth ionospheric environment. Advanced Composition Explorer (ACE [70]) and Deep Space Climate ObserVatoRy (DSCOVR [71]) are two satellites dedicated to monitoring solar activity. The first one was launched in 1997, while the second one was launched in 2015 to replace ACE in case of failures of payloads that are working well beyond the planned mission time of 5 years. Both satellites are equipped with fluxgates magnetometers and electrical cap instruments to measure the plasma properties of the solar wind, including the speed we reported here. In fact, when the solar wind speed and the IMF increase, they indicate a stronger solar activity with a possible perturbation of the ionospheric environment. Therefore, any anomalies identified in the hours following such high solar activity are likely to be due to the impact of the solar wind on the Earth’s magnetic field. In the figures, two thresholds are estimated as mean ± 2 standard deviations of the same time series, and the solar activity can be considered higher above the upper threshold.

3. Results

3.1. Seismicity Investigation

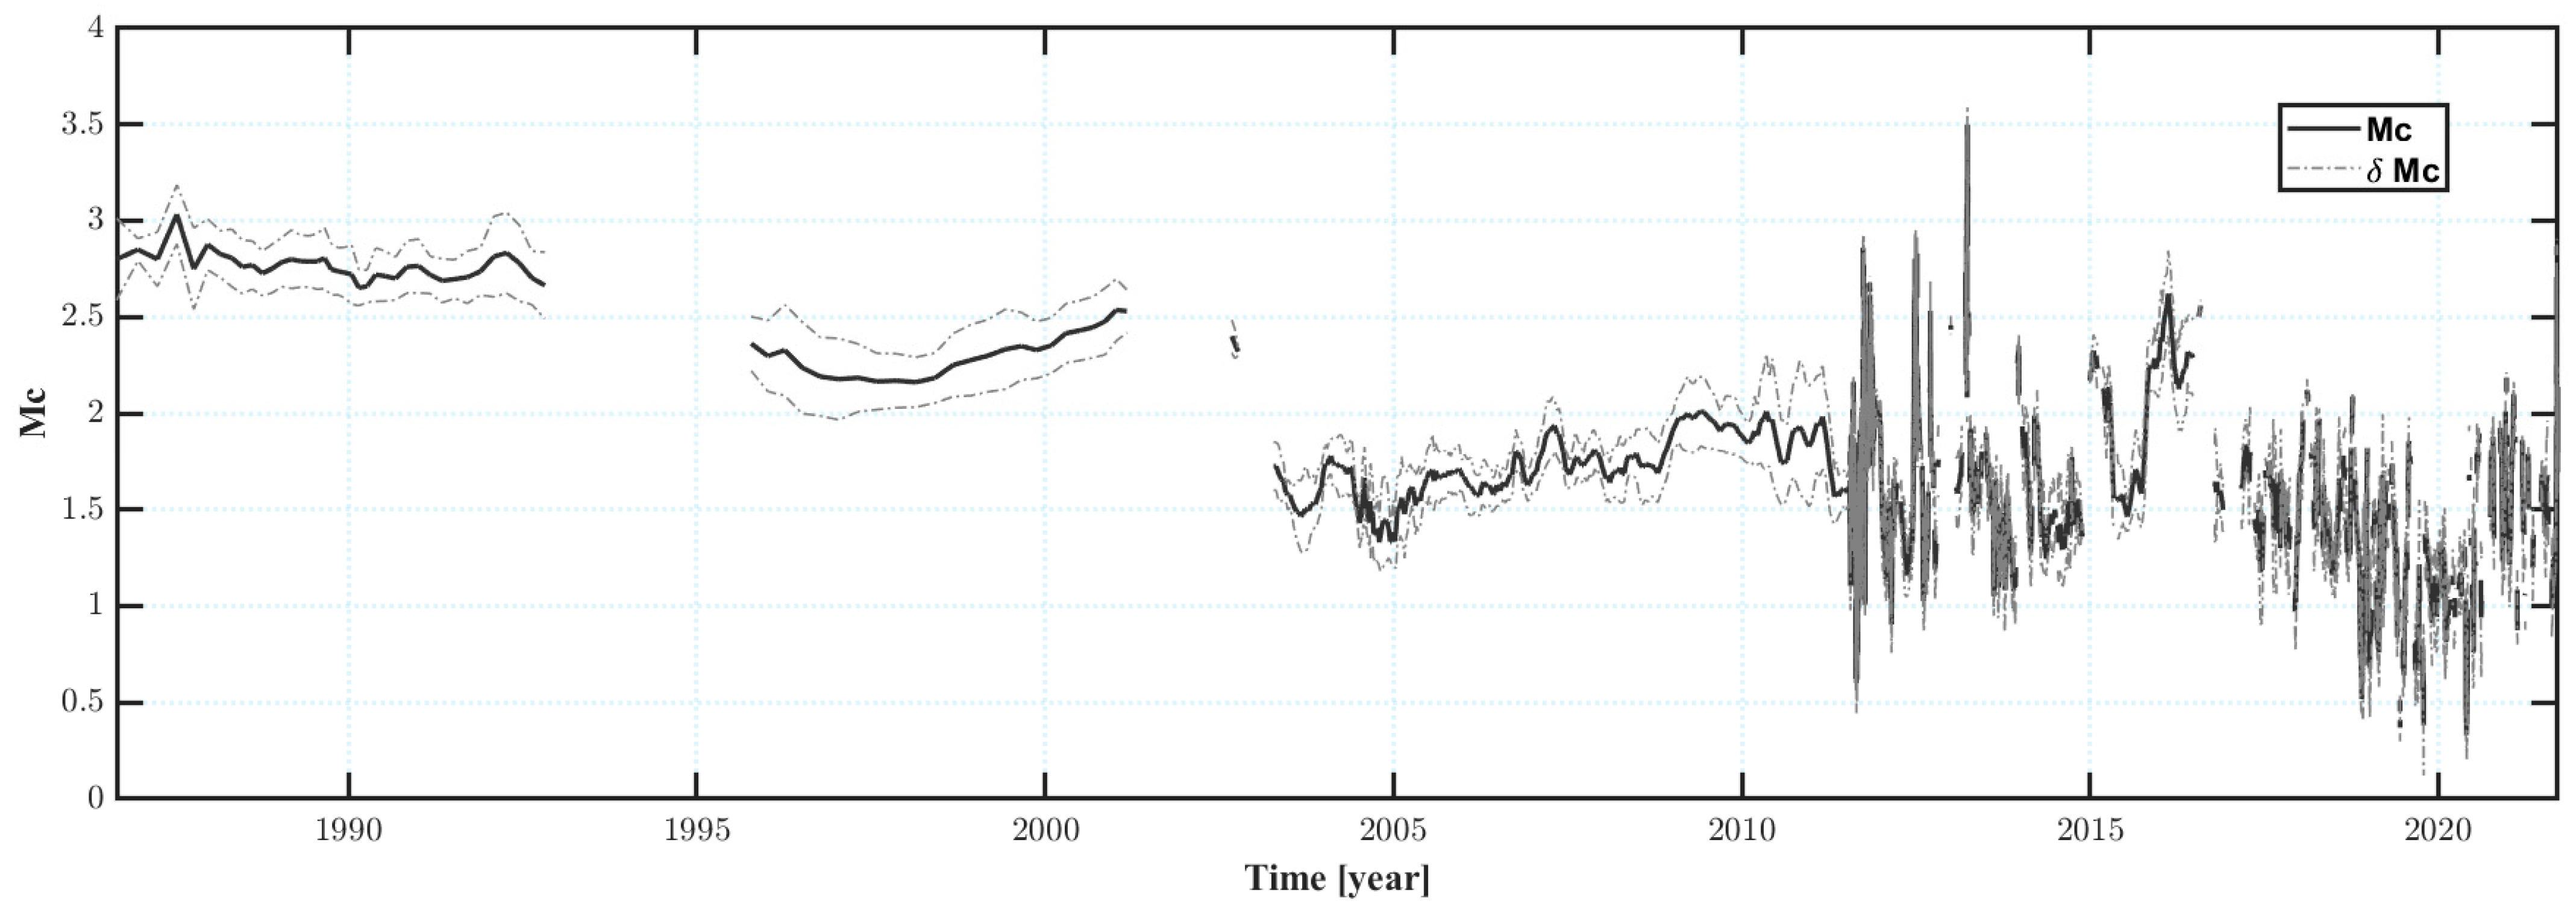
In this section, the seismicity has been investigated from the earthquake catalogue provided by the Spanish National Institute of Geography extracted in the area around the Canarias Islands volcanic area, limited by 20°W ≤ longitude ≤ 12°W and 26°N ≤ latitude ≤ S31°N from 1980 until 19 September 2021. The selected period for the seismicity is the same as the one available for the atmospheric data. In a period that spans more than four decades, the seismic network has been significantly improved in terms of the number of seismic stations and the quality of the same sensors. Such improvements imply that, nowadays, the network can detect smaller seismicity, permitting better monitoring. In fact, the seismicity due to volcanic activity and not tectonic activity is generally associated with lower magnitude events. Such fractures in the lithosphere can be induced by the uplift of the magma prior to an eruption and have been proved to be an effective method for predicting volcanic eruptions [72]. We checked the magnitude of completeness (Mc) by the free software ZMap [49] using the statistical criteria Mc90, i.e., the minimum magnitude determined with a 90% probability that all the events with magnitude equal to or greater than Mc have been properly detected. Figure 5 represents the variation of Mc with time. Some gaps are due to low or null seismicity detected in the investigated area, as we required a minimum of 20 seismic events to estimate Mc reasonably. In particular, we can confirm that Mc improved (become lower) in recent years: between 1980 and 1992 it oscillated around 2.7 (best estimation always lower than 3.0); from 1995 to 2001 it seems a trend comprised between 2.2 and 2.5; from 2003 to 2011 it was comprised between 1.4 and 2.0. From 2011 until the present, the Mc shows more oscillation of its value following particularly strong events, but generally is lower than 2.0 and often around 1.5. The Mc not only can change in function of the time, but also for geographical reasons. In fact, for example, sea and oceanic do not permit the installation of seismic stations, typically reducing the capability of detecting the smaller off-shore seismicity. Despite this, as in this work, we will investigate an emersed volcano, and we do not expect this aspect to affect our results significantly. Some other variations of the completeness magnitude could also be due to natural variations of the seismicity. In fact, after a larger magnitude event, Mc could increase as the seismic network could not distinguish smaller events inside the perturbations produced by the larger ones. Modern machine learning techniques partially addressed this problem, but they are out of the scope of this paper [73]. Furthermore, a variation of the depth of the seismicity can also affect the Mc, as it tends to increase among the depth. These could explain some smoothed variation in a short time of a few years like the ones from 1996 to 2000, probably due only to variation of depth of seismicity.
The seismicity recorded one year before 19 September 2021 (excluded) in a box around the volcano island (17.1°E ≤ longitude 18.1°E and 28.4°N ≤ latitude 28.9°N) was extracted, and their map and time series are represented in Figure 6. Such events are used in the following to compute the Cumulative Benioff Strain.
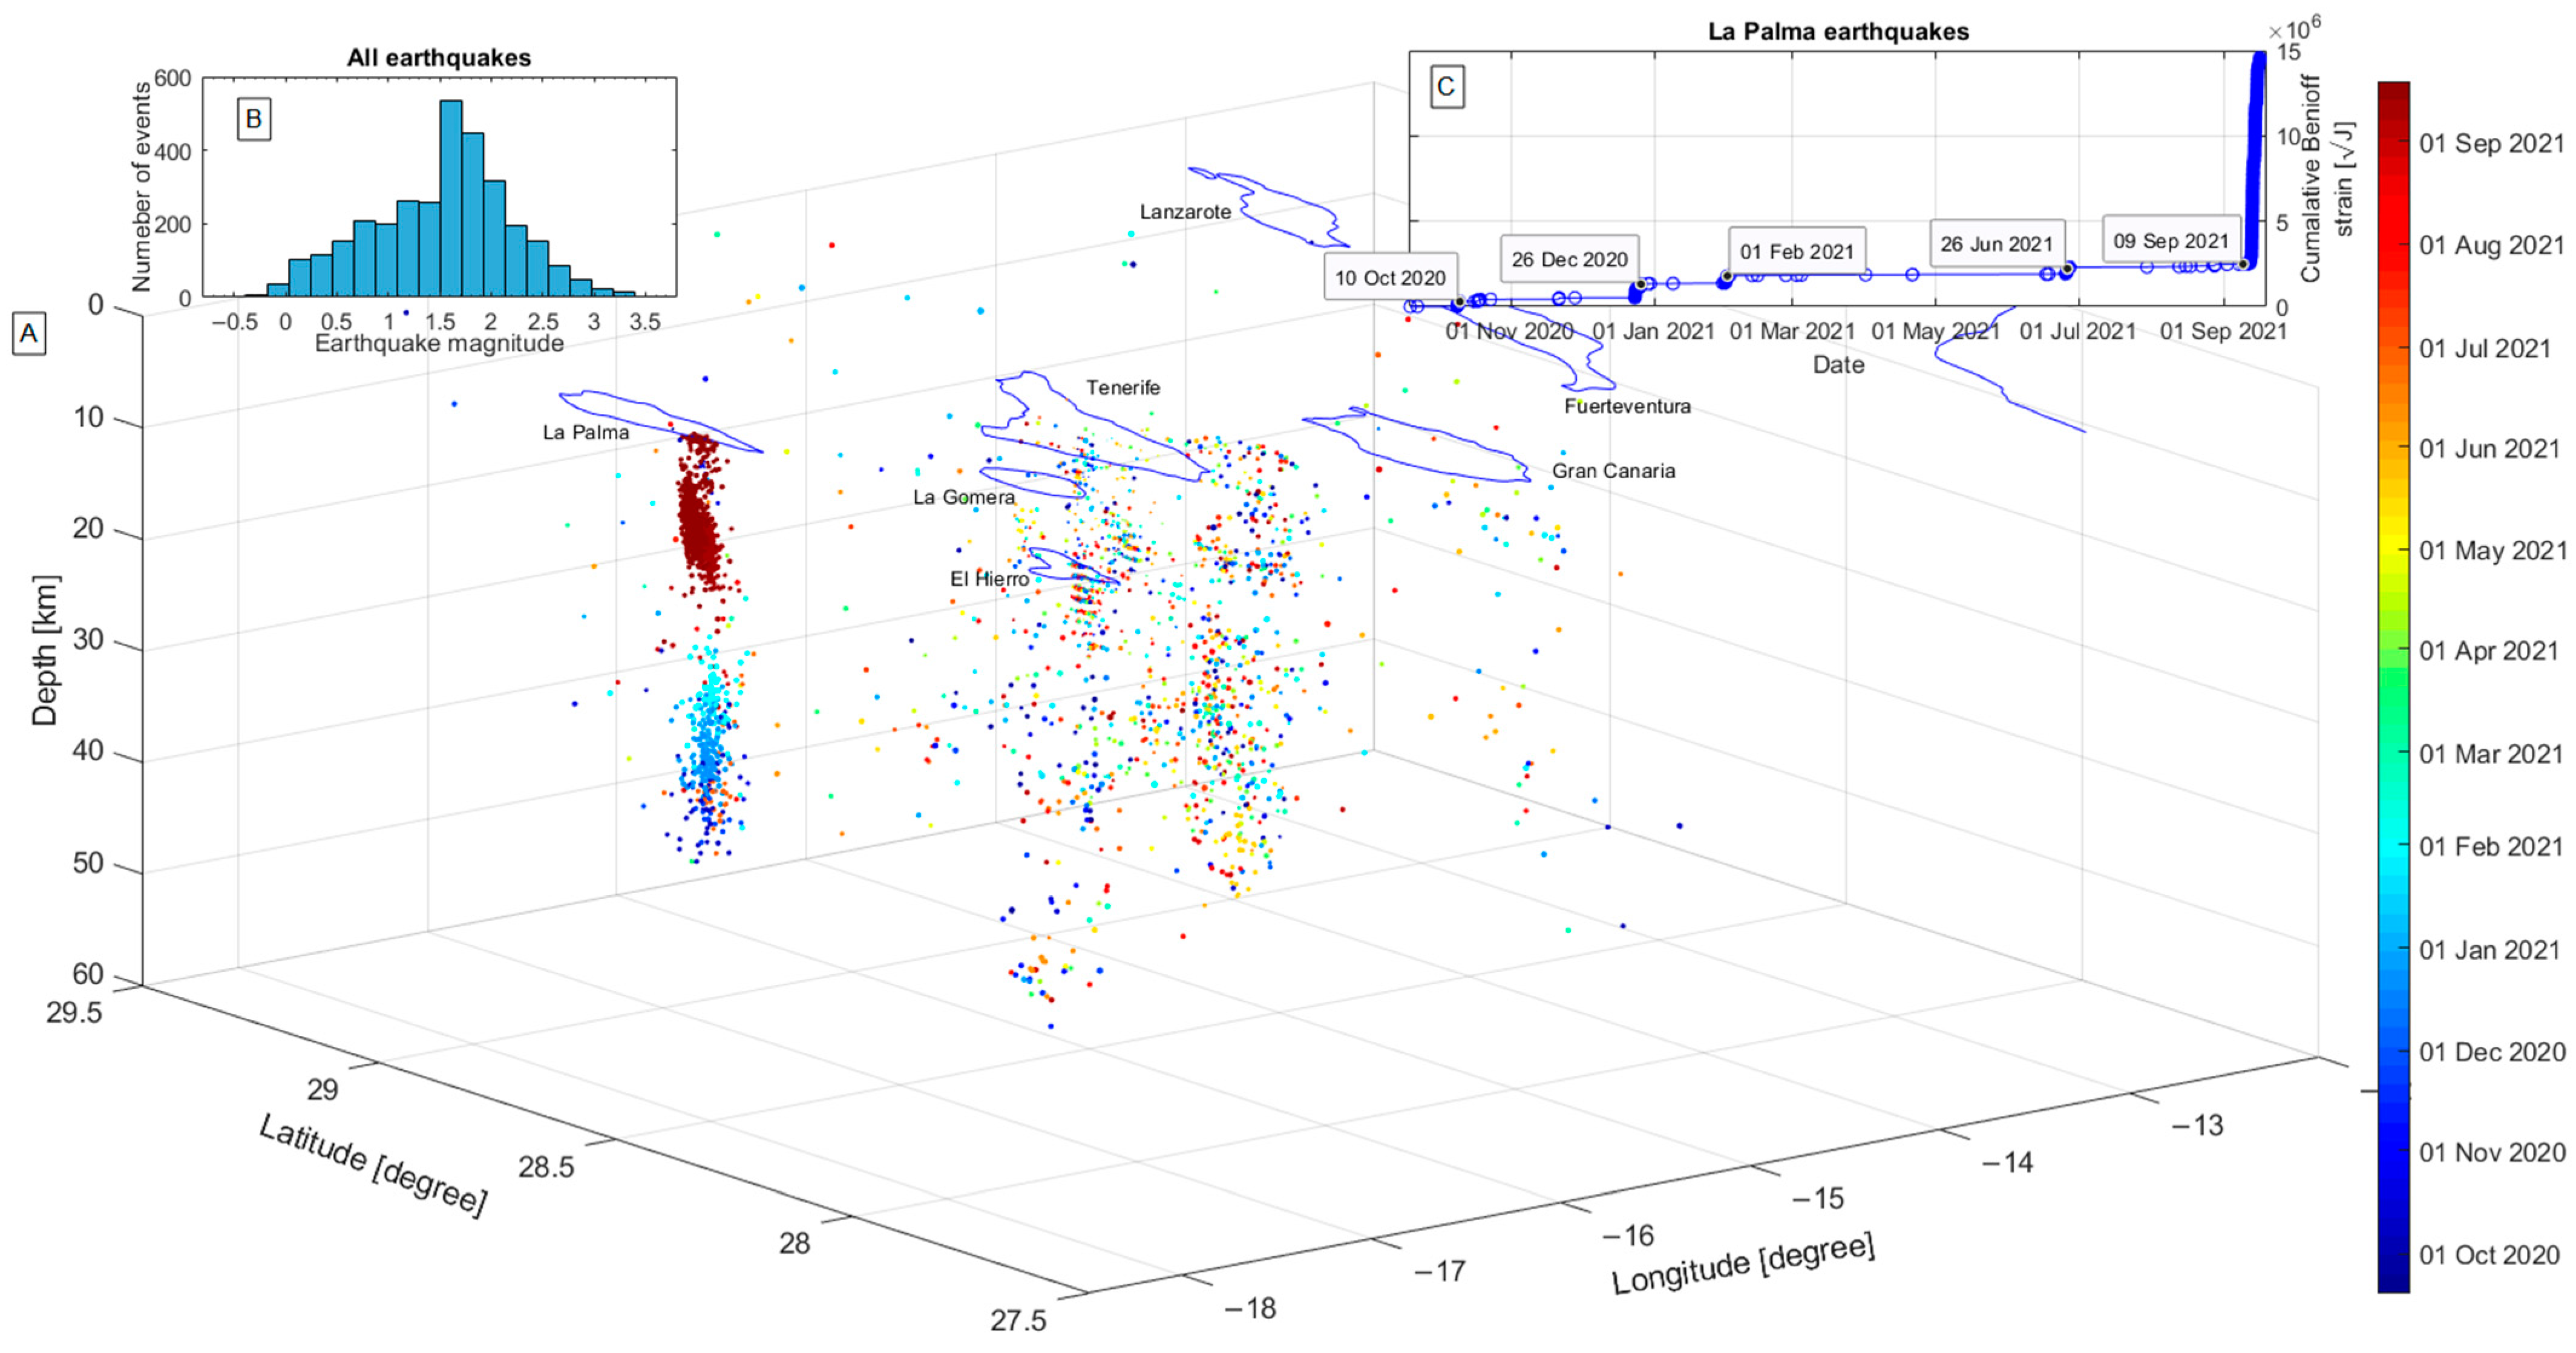
To better investigate the seismicity of the area, we plotted the earthquake hypocentres in the three-dimensional graph in Figure 7. The colour represents the time of occurrence of the recorded seismic events. The magnitude of these events is comprised in the range between −0.5 and 3.5, as also shown in the magnitude distribution in Figure 7B. The magnitude histogram distribution confirms the previous analysis shown in Figure 5, which estimated a completeness magnitude of about 1.5 at the end of the time series that coincides with the year analysed in Figure 6 and Figure 7.
In some cases, it is possible to note that at a certain time, the seismicity is recorded mainly at a particular depth. This can affect and modulate the Mc trends depicted in Figure 5. In fact, Mc is intrinsically higher for the deeper seismicity, as the instrumentation is installed on the surface. Furthermore, it is outstanding to consider that the seismicity under La Palma volcano migrated from deeper locations of about 40 km 9 months before the eruption to 30 km, from 30 km to 20 km 7.5 months before and finally from 20 km until the wide under-surface seismicity observed from 10 days before the eruption. In addition, we depicted two gaps in the column of seismicity under La Palma volcano, a deeper gap located between 13 km and 20 km depth and a shallower gap at less than 5 km depth. Such gaps could be two magmatic chambers under the volcano. In fact, inside a magmatic chamber, it is impossible that an earthquake could happen as the rock is melted. The shallow magmatic chamber is also known in the literature, for example, by De Luca et al. [27]. We can infer that firstly the magma migrated from the mantle in a deeper magmatic chamber at ~15 km depth 9–7 months before the eruption, and then in the shallower magmatic chamber from about ten days before the volcanic eruption. The presence of a deep magmatic chamber was also documented by Klügel et al. [74].
For comparison, it is possible to see that some seismicity has been recorded under the other volcanos during this year. Still, there is not a temporal order related to the depth like for “La Palma” volcano, confirming that the seismicity recorded under La Palma is very likely a proxy of the magma uplift.
The Cumulative Benioff strain of the events already selected in Figure 6 with M ≥ 1.5 (i.e., greater or equal to the completeness magnitude) in La Palma Island (18.1°W ≤ longitude ≤ 17.5°W and 28.4°N ≤ latitude ≤ 28.9°N) have been calculated using the Equation (1) and finally plotted in Figure 7C.

3.2. Atmospheric Investigation

In this section, we analysed the ground geomagnetic field and four atmospheric parameters (SO2, DMS, Aerosol, and CO) in the six months before the volcanic eruption, and later we overlooked the whole time series from 1980 (the start of availability of the select dataset) until the event.

3.2.1. Ground Geomagnetic Field

In this section, we present the investigation of ground geomagnetic field data retrieved from an observatory station relatively close to the volcano, Guimar (GUI), at Tenerife Island compared with the far observatory of Tamanrasset (TAM). The goal is to search for possible variations of the magnetic field induced by the volcano that could likely have reached the close geomagnetic observatory of GUI, as its distance is about 140 km inside the same volcano system group of Las Canarias. The comparison observatory was more than 2400 km away, so it is unlikely to be influenced by the volcano. Instead, a common signal to both the observatories located in the same North hemisphere and quite comparable geomagnetic latitude (GUI: 33.17°N TAM: 24.37°N) can be considered a global or external disturbance.
The original data were cleaned from the non-available samples (i.e., the samples equal to −9999), and the data were interpolated at 1 min sampling by a Piecewise Cubic Hermite Interpolating Polynomial (PCHIP, [75]) to avoid the data gap that is fundamental for the data filtering, requiring uniformly distributed data.
The available band is from a period of 2 min for the Nyquist theorem [76]; it has been divided into five frequency bands by applying five digital filters. They are selected as a pass-high with a period of 1 h, a pass-band between 1 h and 6 h periods, a pass-band filter between 6 h and 1 day periods, a pass-band filter between 1 day and 1 week periods, and a pass-low filter at 1 week period. The selected period considers some natural phenomena like the tidal modulation over a period of 6 h or the SQ current, a daily (24 h) typical current that influences the magnetic field [77].
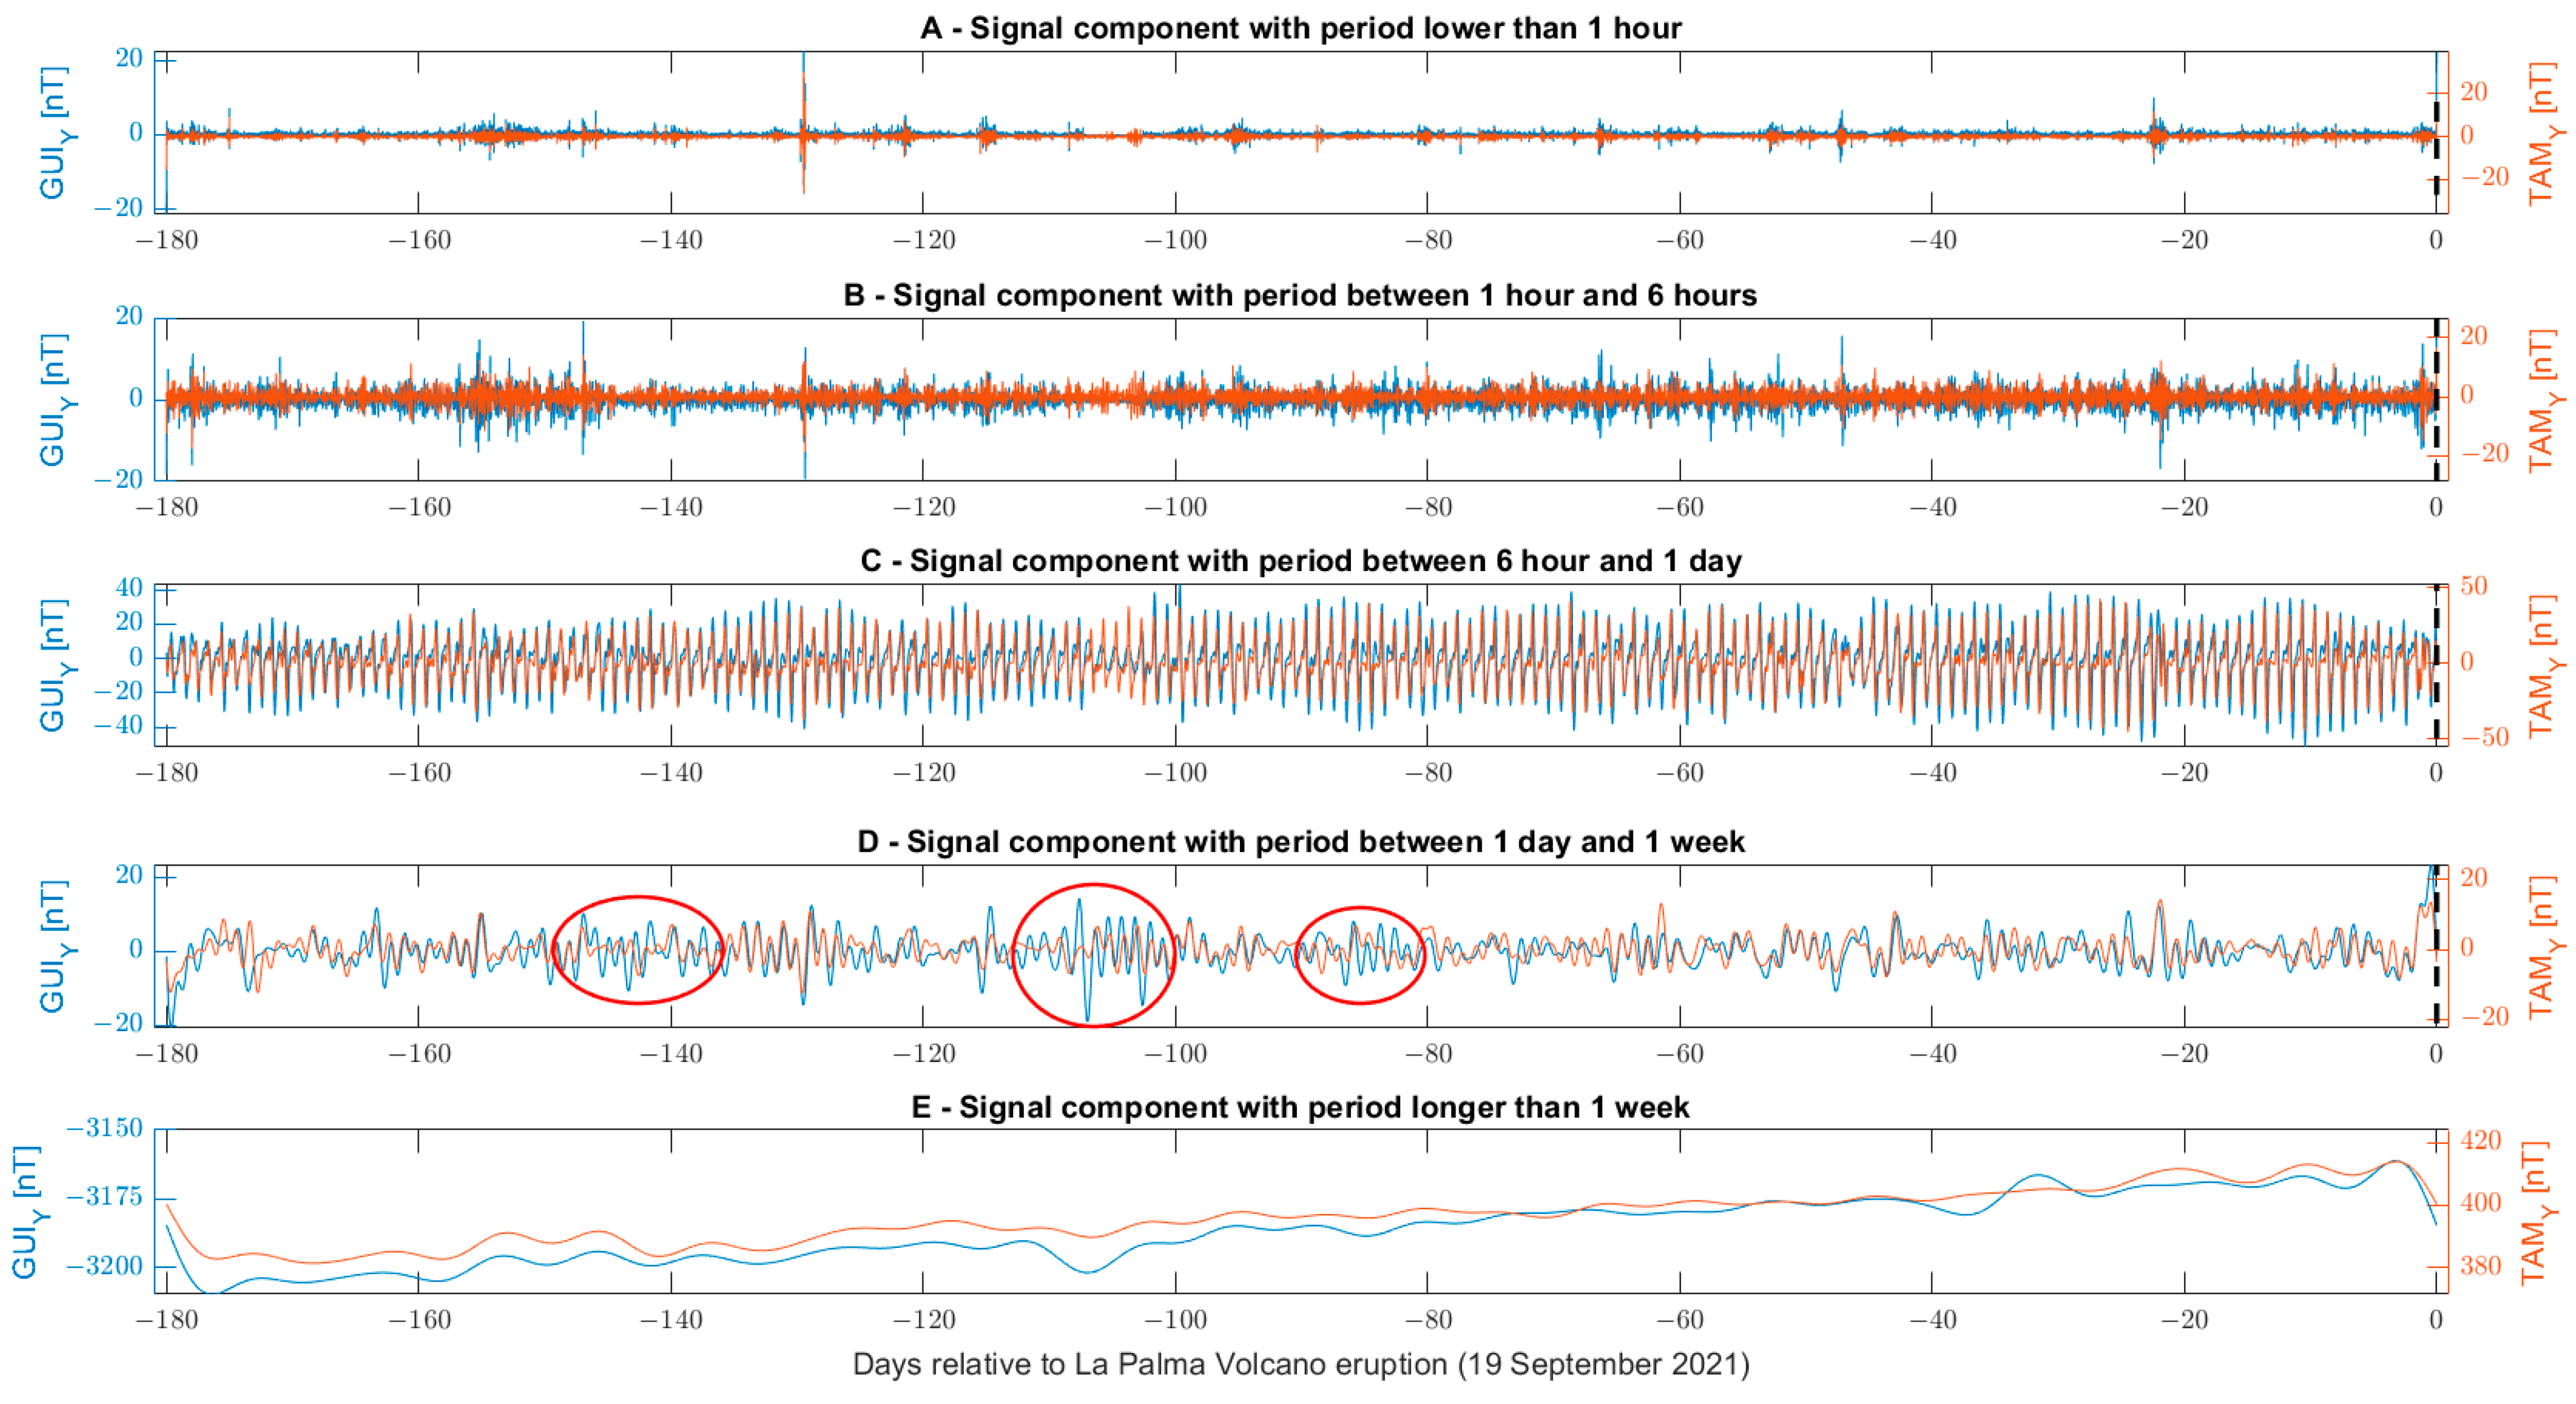
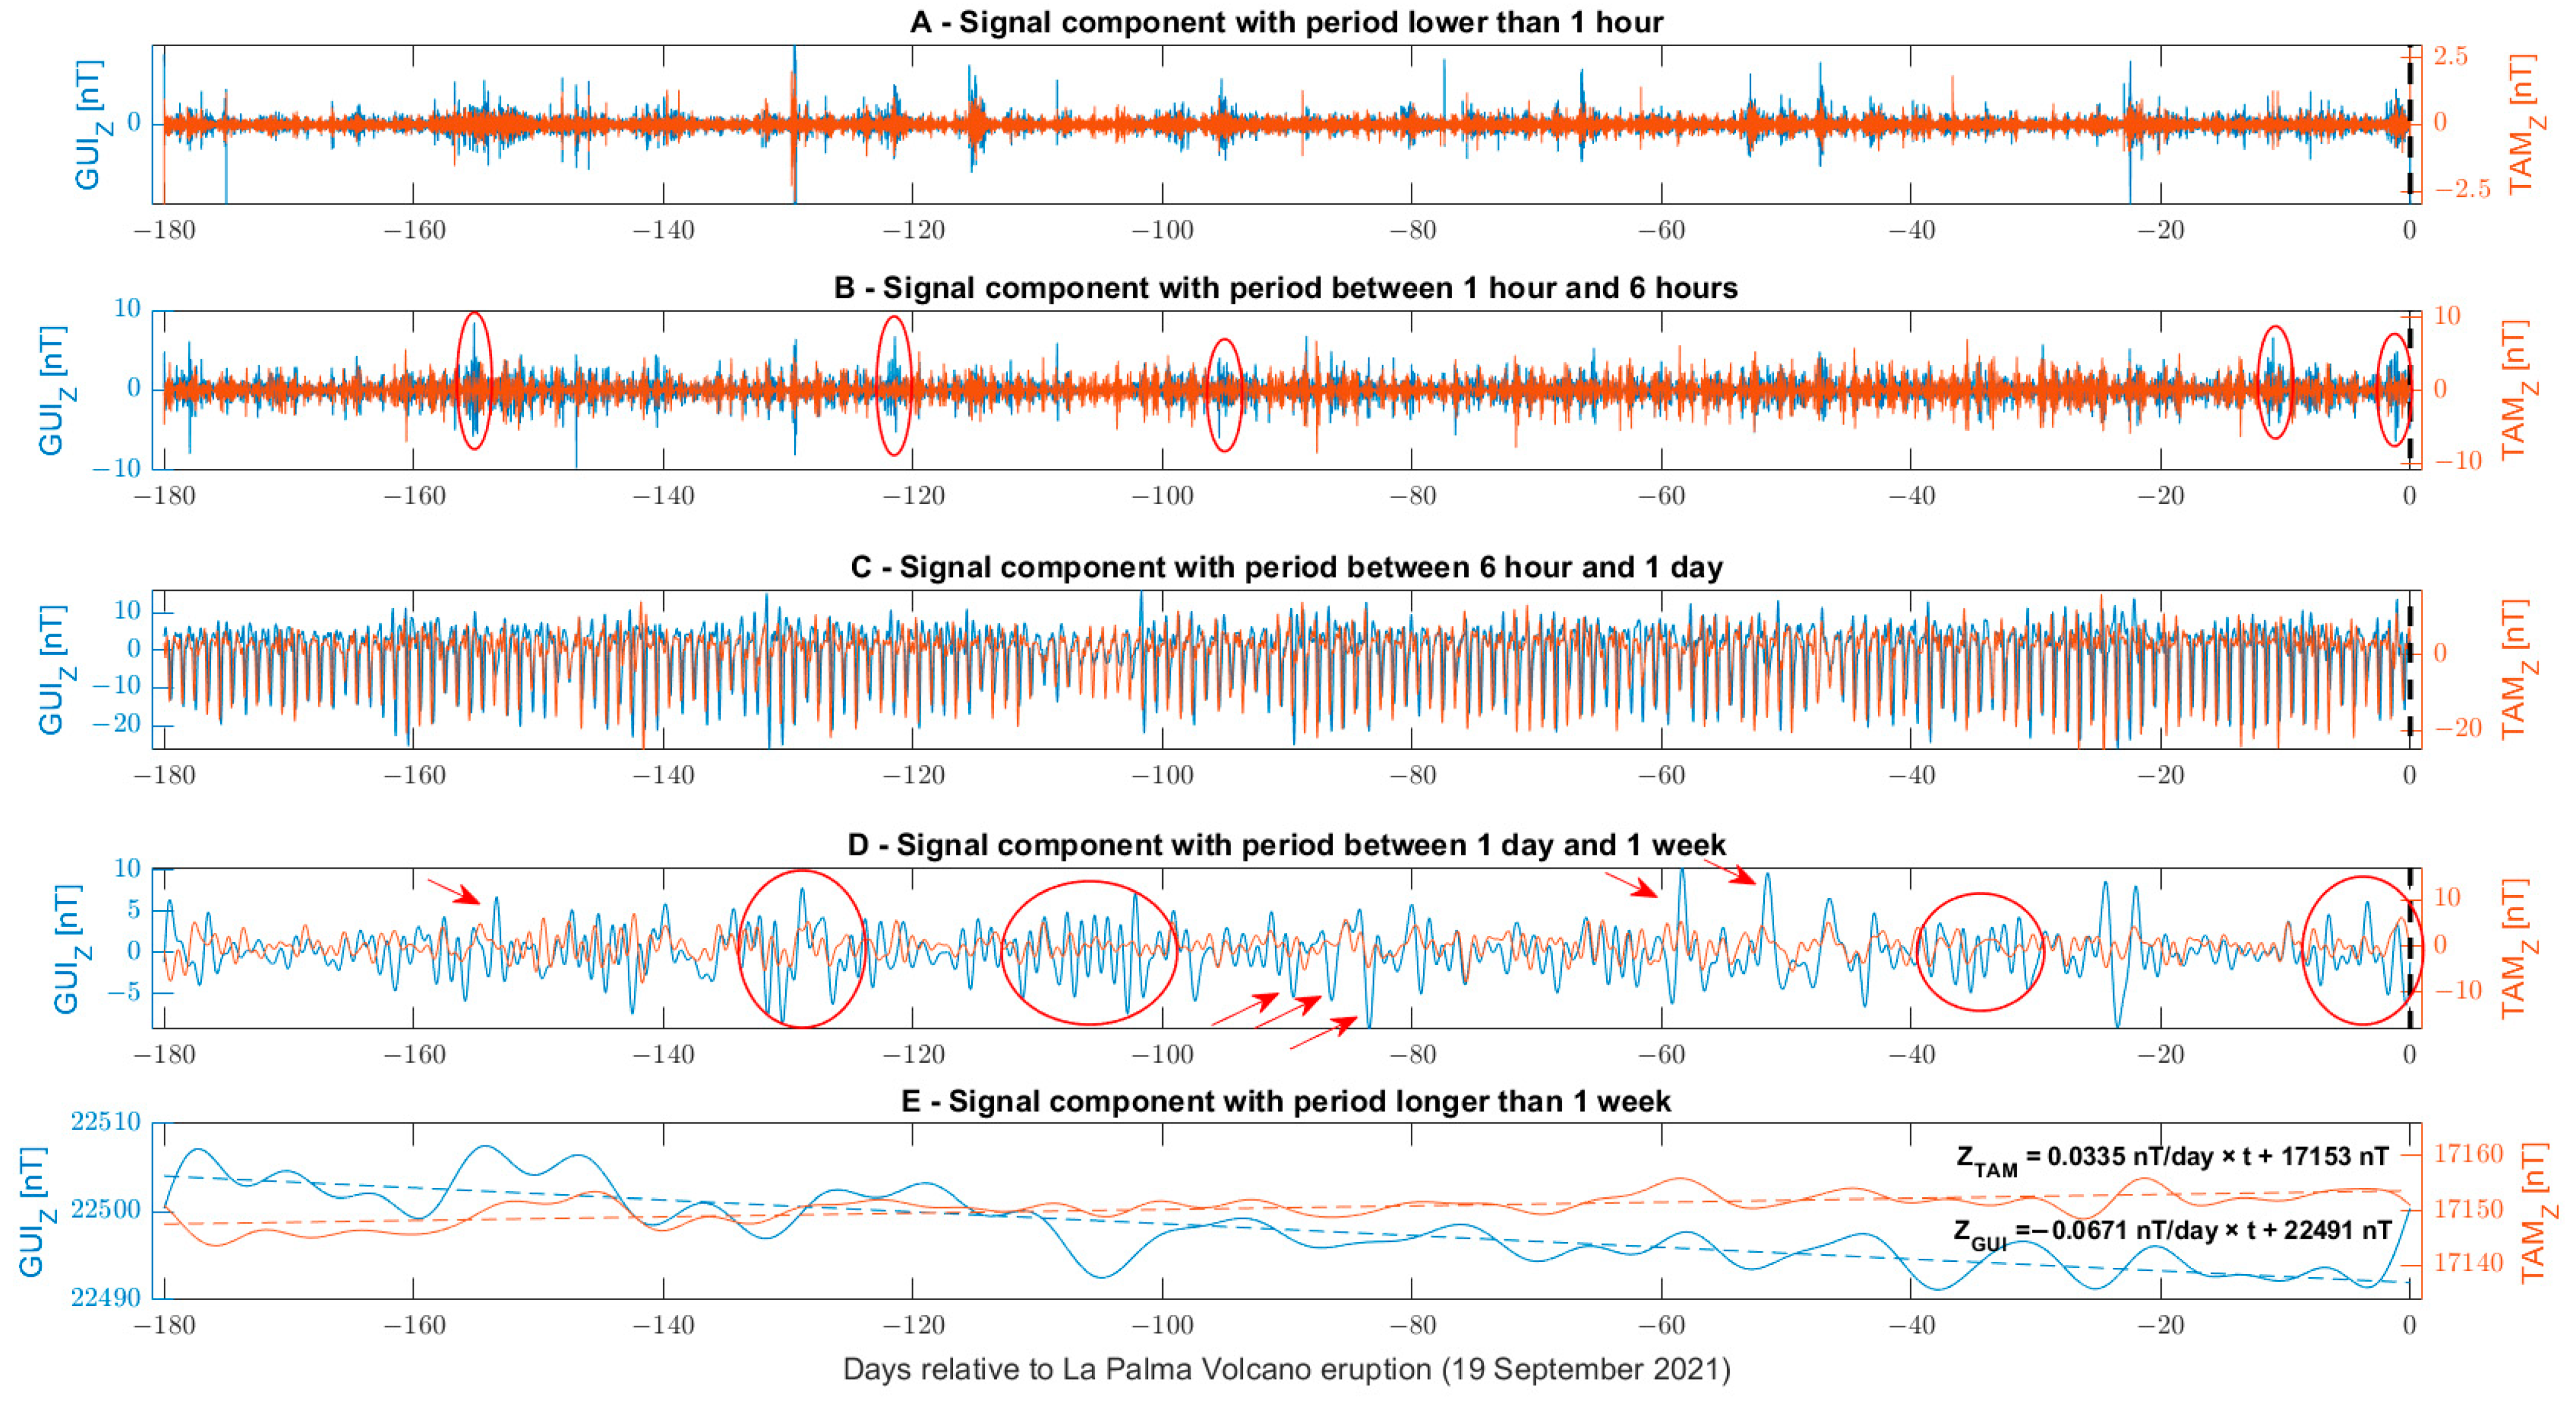
Figure 8 and Figure 9, and Figure S1 (in Supplementary Materials File S1) report the geomagnetic data filtered in the five frequency bands from GUI (blue curves) and TAM (orange curves) observatories for X (North), Y (East), and Z (Centre) geomagnetic components, respectively. It is possible to note that the two observatories are generally in agreement, and this is their response to the global perturbation. In particular, the X-North component shows very similar behaviour in all the investigated bands. This could be due to the main orientation of the geomagnetic field that horizontally is very close to this component, so a small local perturbation cannot significantly affect the X component but could be visible in the Y, which has an absolute value of about ten times lower. In fact, Y and Z (Figure 8 and Figure 9) show some slight differences between the two observatories. When the TAM observatory shows some higher signal, this could also be due to local perturbations like the Sahara dust storm, but it is out of the scope of this work. With red circles and arrows, some differences when GUI shows some different (more) signal than TAM have been pointed out. Such signals are likely to be local in the Canarias archipelago, and they could be due to the preparation of “La Palma” volcano eruption on 19 September 2021. Furthermore, the Z, vertical component at GUI observatory, shows a trend of decreasing its intensity as shown in Figure 9 by the superposed linear fit (dashed blue line) and its slope equal to −0.067 nT/day. On the other observatory of TAM, the same linear fit show a slight increase of 0.033 nT/day vertical magnetic field. Such a local decrease of the magnetic field in the vertical component could be produced by the demagnetization of the rocks induced by the warming caused by the uplift of the magma in the analogy of what Kanda et al. [32] found for the Kuchi-erabu-jima volcano in Japan.
In order to validate by an objective criterium the identified anomalies in GUI observatory by visual inspection, a correlation coefficient has been computed inside a moving window. The window length has been selected according to the band of the signal as two times longer than the higher cut-off period or 35 days for a more extended period (so they are: 2 h, 12 h, 2 days, 14 days, and 35 days). The window has been shifted of 1/5 of its length at any movement to be able to retrieve any possible anomalous signal. Only the window with more than 90% of good original samples has been considered. Furthermore, the correlation coefficient has been computed only for the samples acquired in quiet geomagnetic conditions (|Dst| ≤ 20 nT and ap ≤ 10 nT). If the window has less than 10 samples obtained in quiet geomagnetic conditions, it is rejected. The estimated correlation coefficient in function of the time is represented in Figure S2 (in Supplementary Materials File S1). When it is equal to 1, it indicates that the two stations observe a perfect identical trend inside the window; when zero, it means the signals are uncorrelated, and when it is −1, it means they are anti-correlated (so an opposite trend). As we want to search for differences in the two observatories, we further selected the uncorrelated windows defined with |r| < 3, and their cumulation over time is shown in Figure S3 (in Supplementary Materials File S1). This approach is similar to what Marchetti et al. [78] applied to two geomagnetic observatories in Italy to study the preparation phase of the Central Italy seismic sequence 2016–2017. Here the approach has been improved, including several bands to investigate the signal from the geomagnetic station.
From the cumulative graphs shown in Figure S3, the most interesting plots are the ones with a lower period of less than 1 h for X and Y, which shows a similar acceleration in the central period between –120 days to –55 days. In addition, the Y signal in the period band between 1 day and 1 week also shows anomalies between –150 days and –70 days. The other trends are almost linear, or without anomalies, so they are not interesting from this point of view.

3.2.2. Atmospheric Composition Investigation (SO2, DMS, Aerosol and CO)

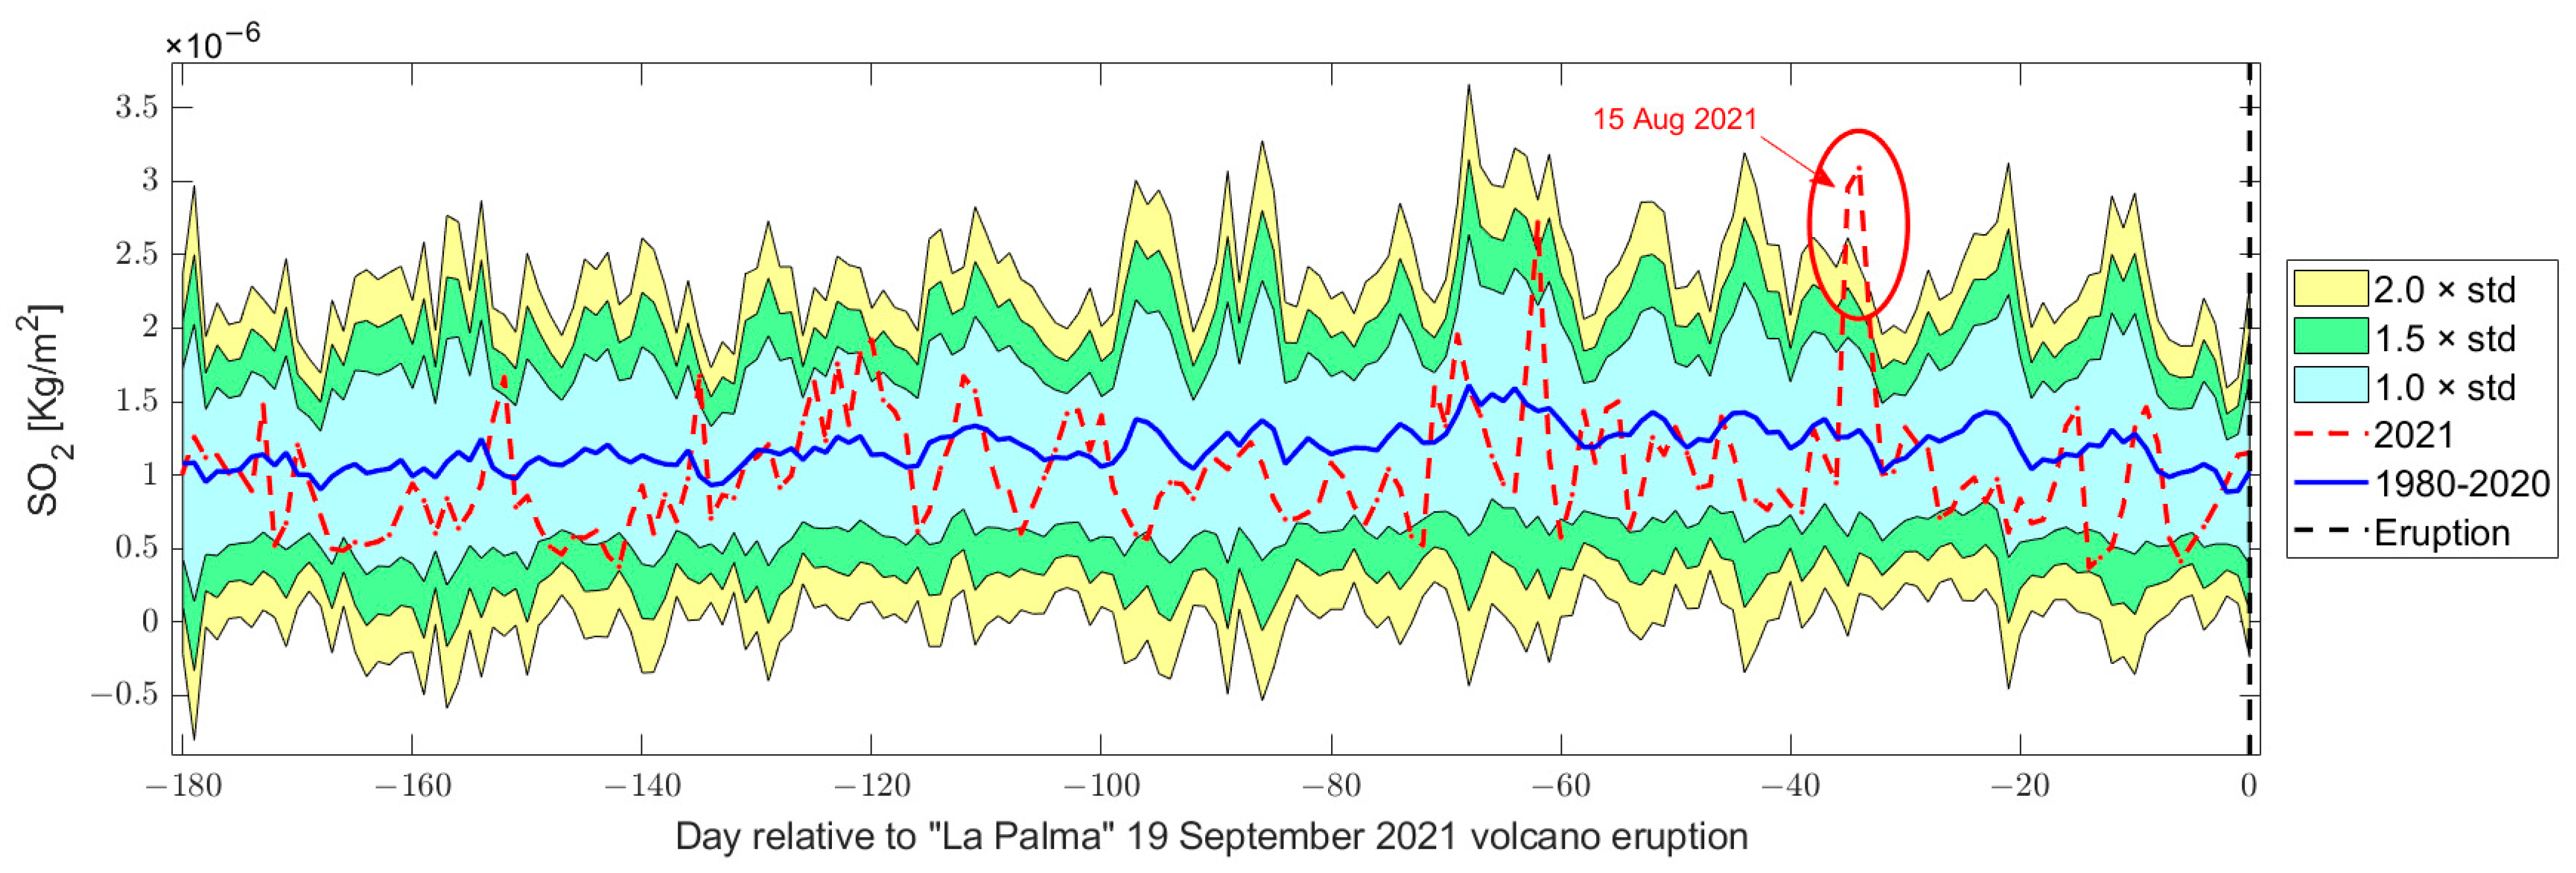
Figure 10 represents the time series of SO2 from 23 March until 19 September (included). The red dashed line represents its value in 2021, i.e., the year of the eruption, while the colour bands indicate 1.0, 1.5, and 2.0 standard deviations of typical historical values (blue line). It is possible to note that only two days (circled by red oval) exceed the two standard deviations: 15 and 16 August 2021, which are a little more than one month before the eruption and are better investigated in the following.
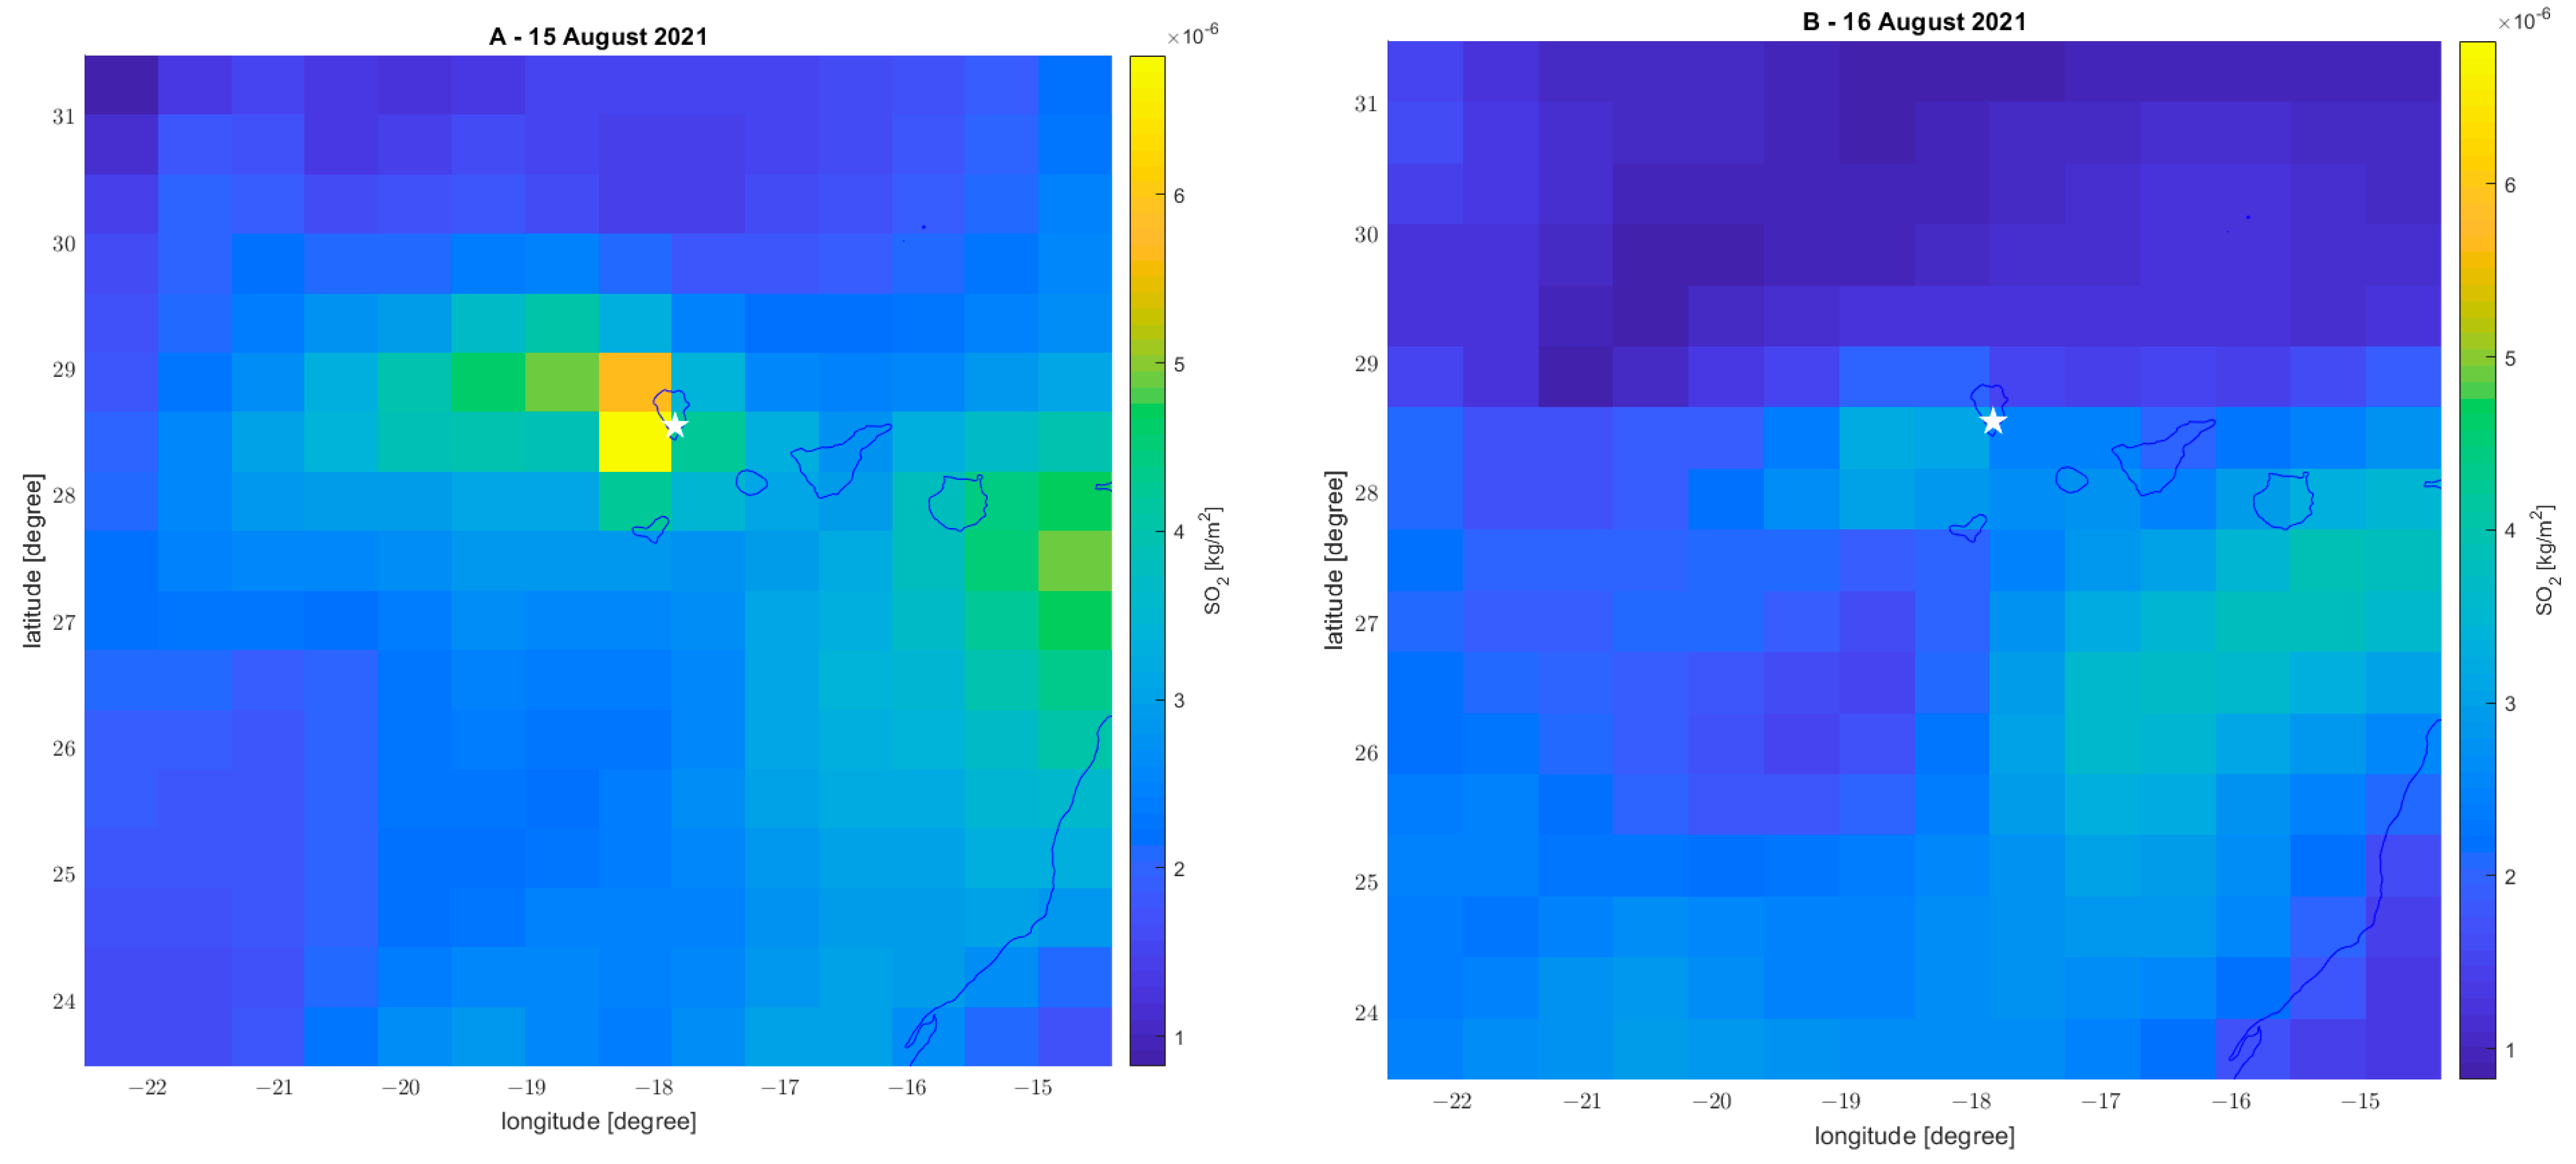
Figure 11 shows the maps of distributions of the two most anomalous days (i.e., 15 and 16 August 2021) in the SO2 time series. From the map, it is possible to depict that the maximum concentration of SO2 not only coincides with La Palma island, but also with the same pixel where Cumbre Vieja vent is located (i.e., the Southern-West side of the island La Palma), even if the resolution of the atmospheric data is too low to confirm that the emission was from this volcano vent. On the other side, on 16 August 2021, a small presence of a western plume of SO2 was likely emitted by the volcano. Despite this, the Atlantic Ocean between Canarias islands and the North African coast experienced a wide cloud of SO2 that could have partially influenced the time series. Contrarily, the maximum SO2 value of 15 August 2021 was about double that of 16 August 2021. This could mean that the Cumbre Vieja volcano’s emission was much more intense, supporting its possible volcanic source.
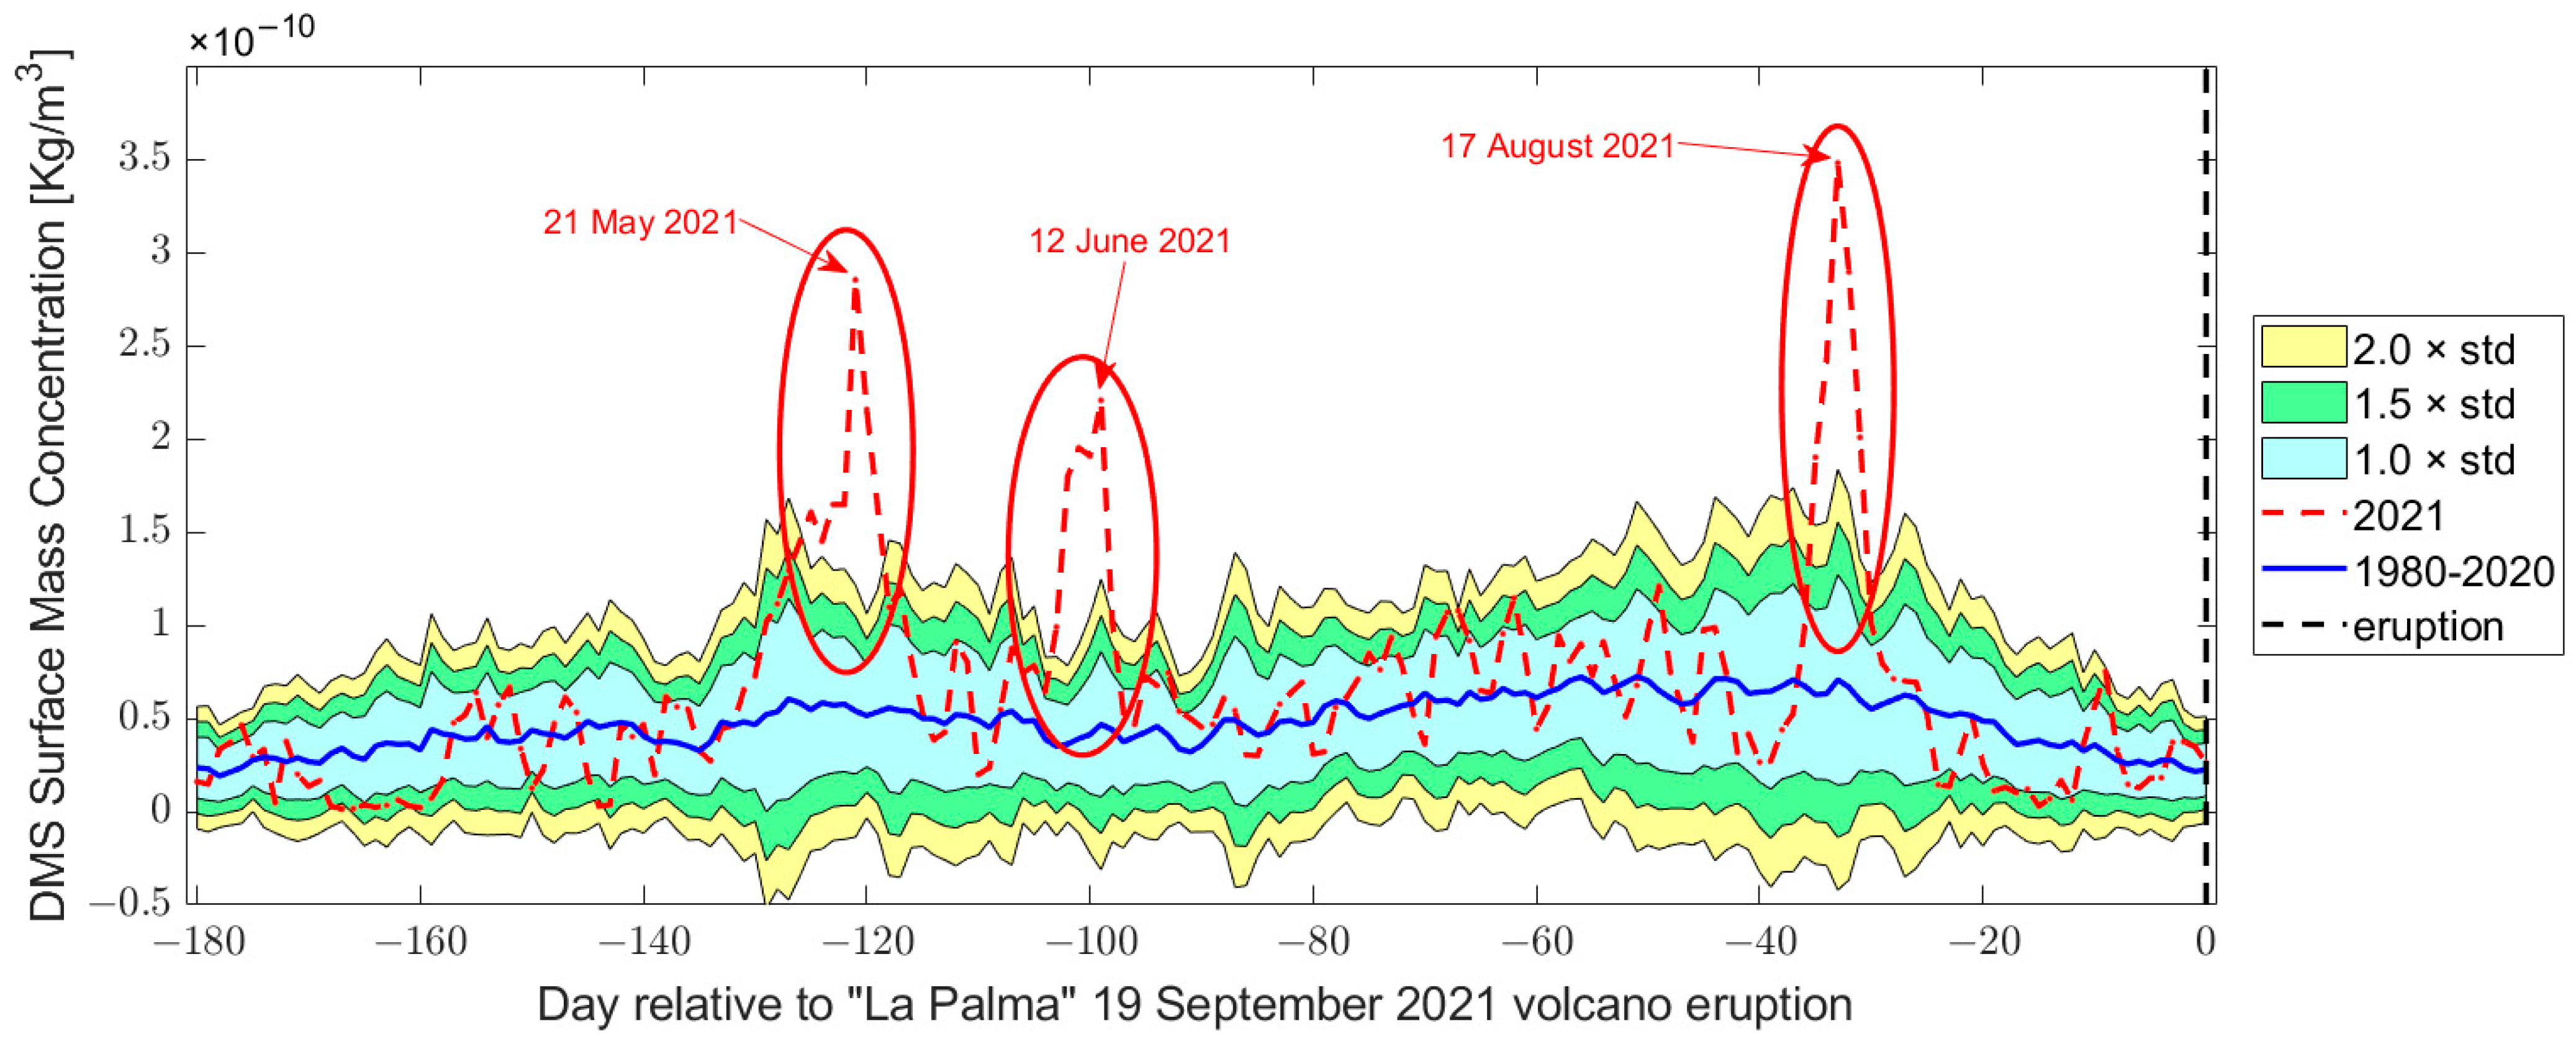
The time series of DMS is illustrated in Figure 12, and it shows a large number of anomalous days grouped in three periods circled with red ovals: (1) from 17 to 23 May 2021, (2) from 8 to 12 June 2021, and (3) from 15 to 19 August 2021. On all other days, the curve is inside two standard deviations, so we consider it a normal oscillation of the value for this area. It is a pity to note that the distribution maps of some of these anomalous days in Figure 13 seem to exclude that DMS was emitted straight from the volcano. In fact, all the maps show higher concentrations in the sea, suggesting more of a direct emission from the oceanic sea water as proposed, for example, by Andrae and Raemdonck [79]. Despite this, we cannot exclude some indirect processes, like an increase in the temperature of the ocean floor due to the uplift of magma that could increase the algae in the seawater that are associated with high concentrations of dimethyl sulphide [34].
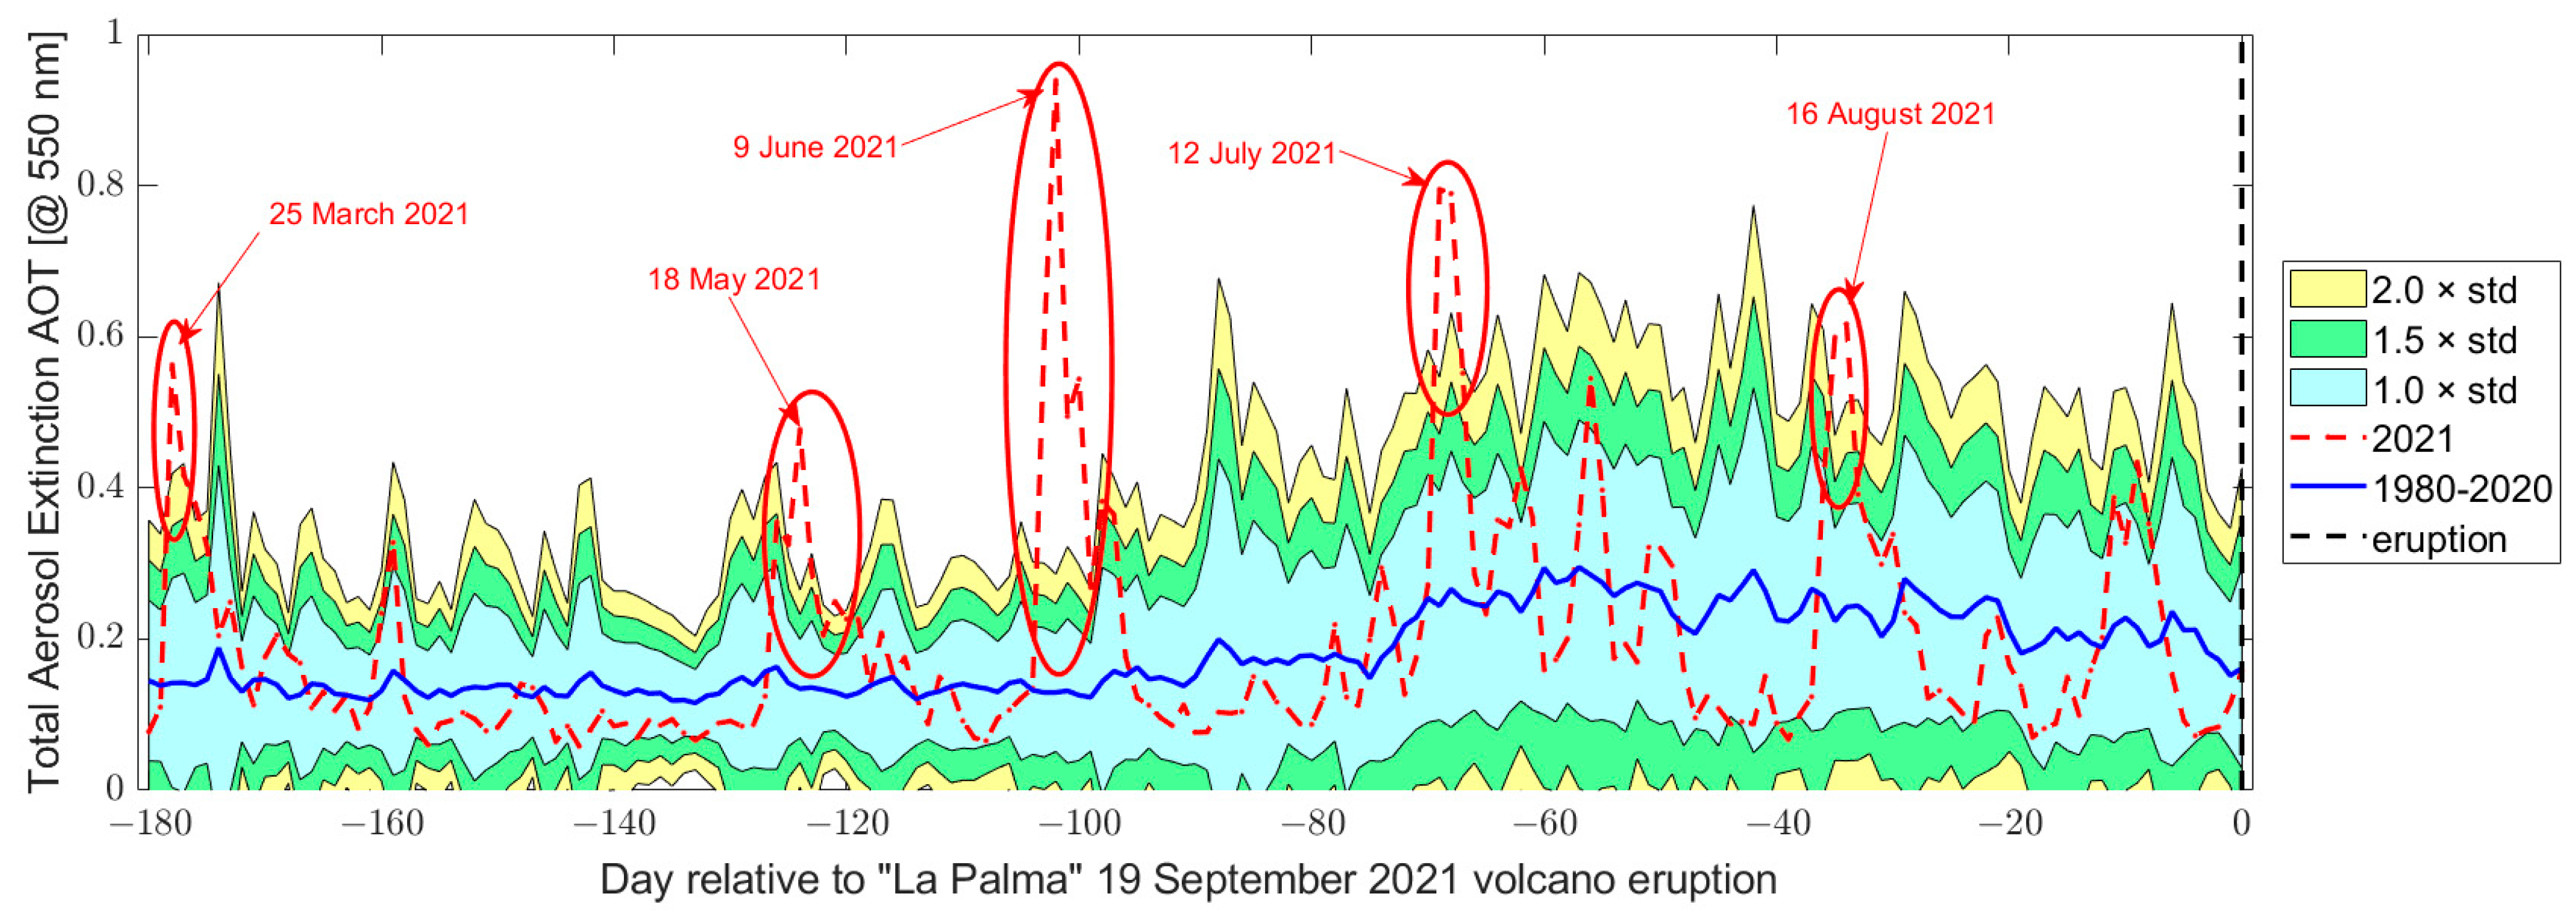
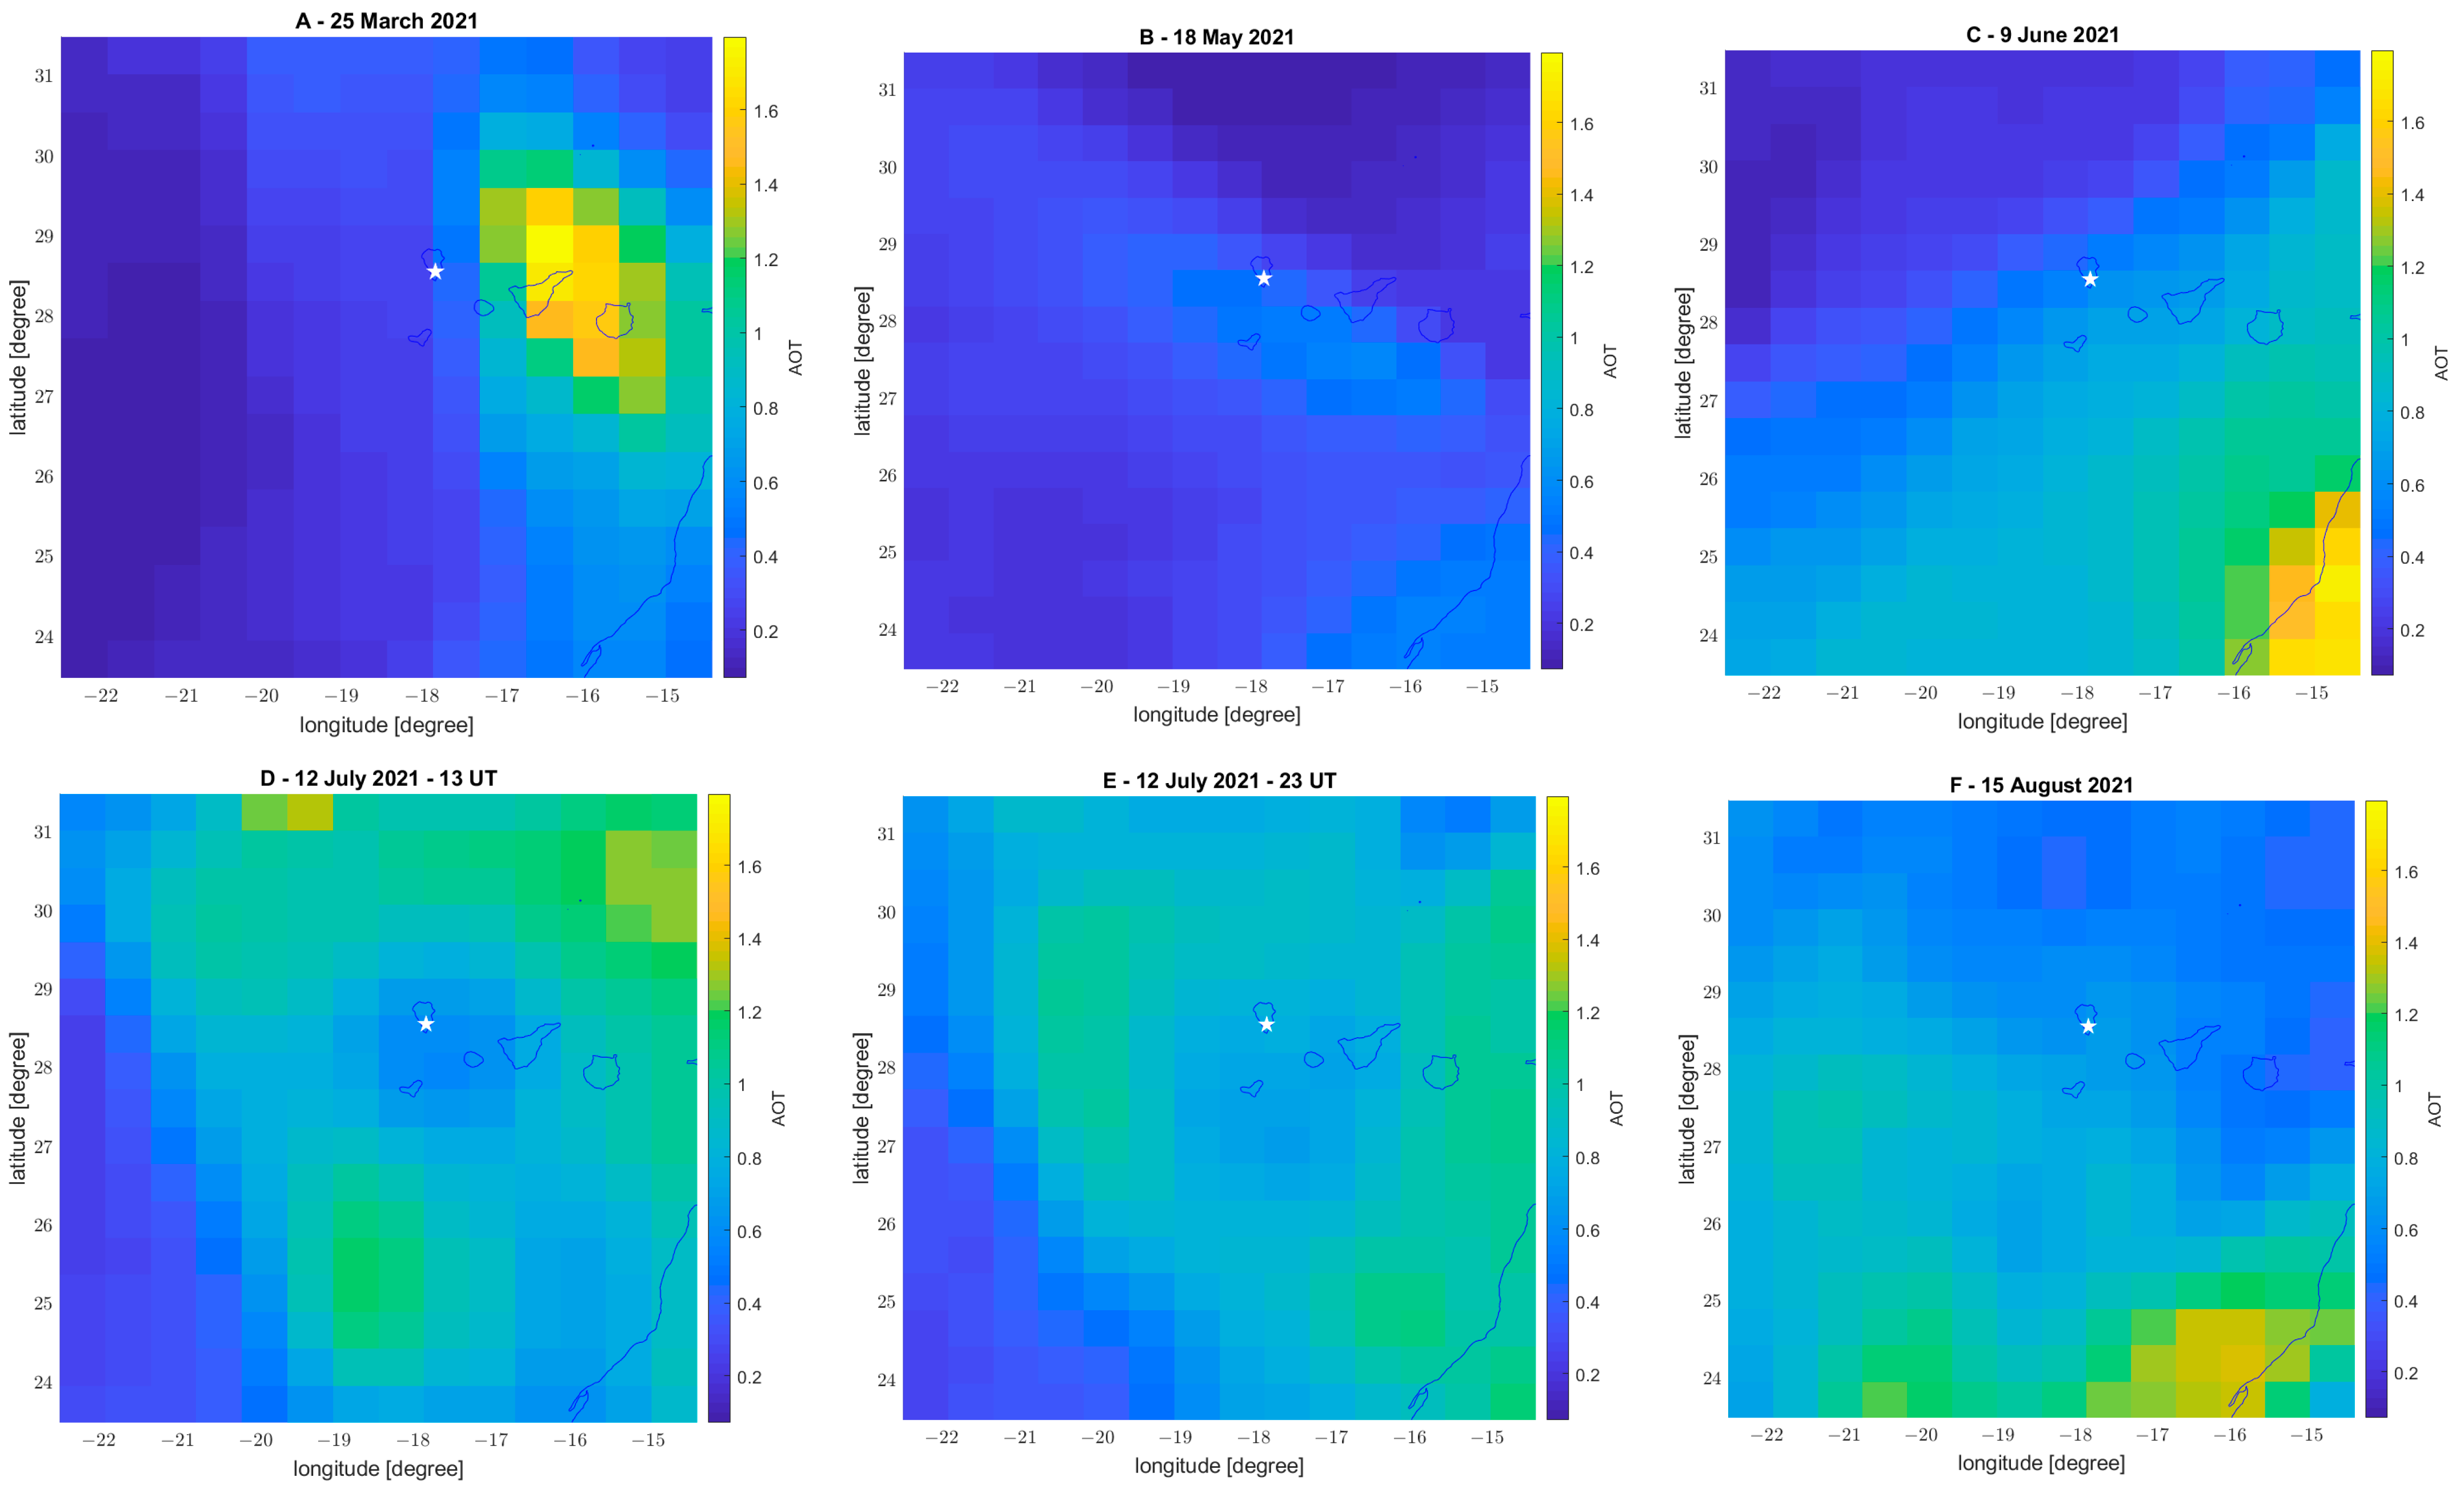
Aerosol Optical Thickness (AOT) time series investigation in the six months before “La Palma” volcano eruption is provided in Figure 14. Several days show a significant anomalous positive increase of aerosol above La Palma volcano, but it is important to check the parameter more deeply, as it could be affected by other factors like sandstorms from the Sahara desert [80]. For this purpose, we have produced the map of all anomalous days, and in Figure 15, we reported some of them. In particular, Figure 15C (9 June 2021) and Figure 15F (15 August 2021) show a very high aerosol concentration from the Southeast, i.e., close to the Sahara Desert, and they are likely due to sandstorms. On the other hand, Figure 15A (25 March 2021) and Figure 15B (18 May 2021) show high concentrations in the Canarias volcano caldera, even if the La Palma volcano does not seem to observe particularly high concentrations. The aerosol distribution reported in Figure 15D,E (12 July 2021 at 13 and 23 UT) suggest that around the volcano, the aerosol was lower, and it is difficult to think that it is produced by the volcanic activity, even if it cannot be excluded some indirect phenomena.
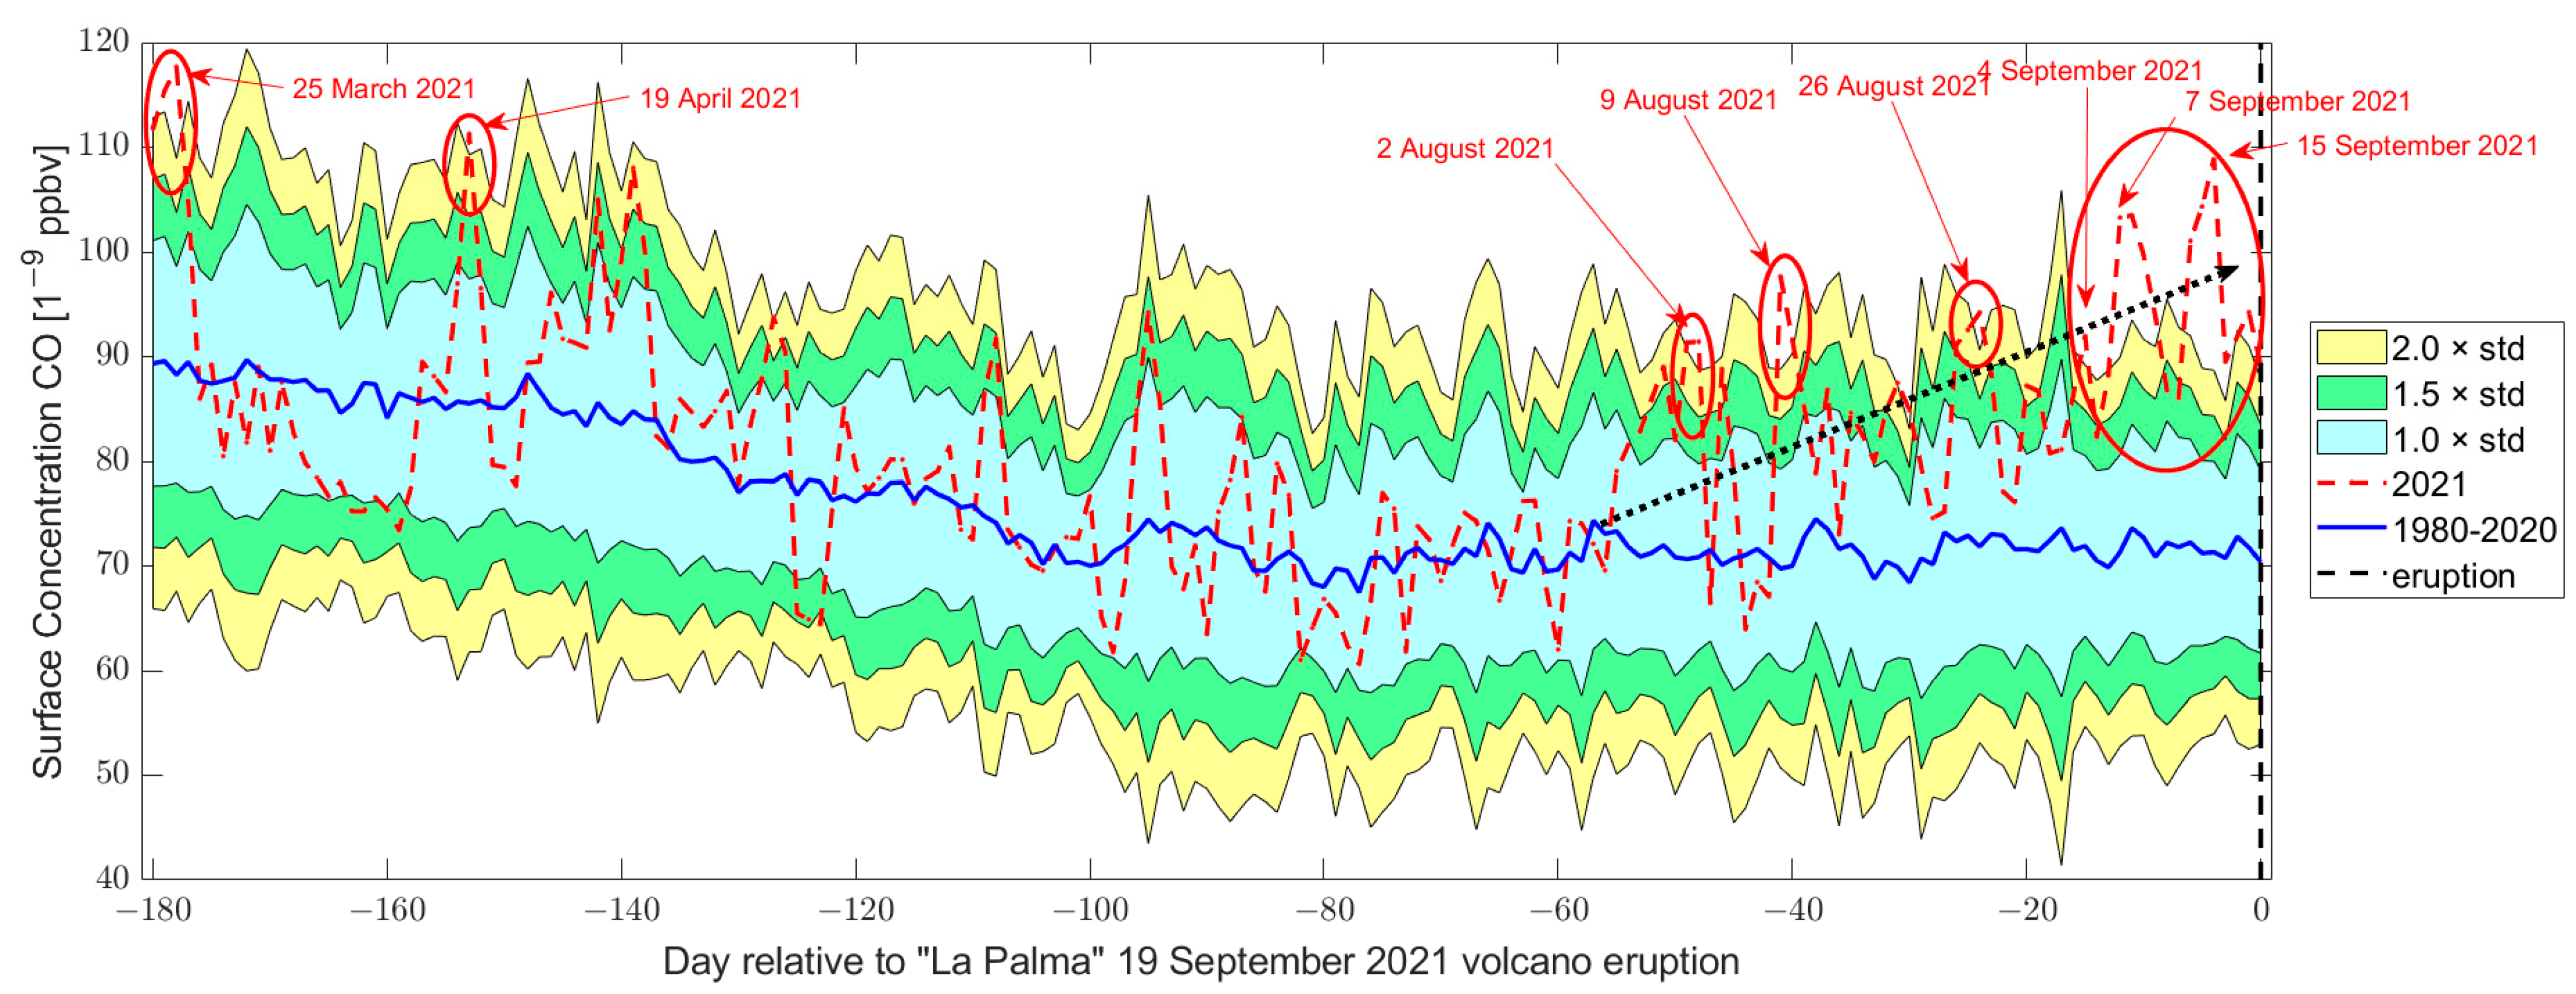
Figure 16 shows the carbon monoxide time series in the six months preceding “La Palma” volcano eruption. CO presents several anomalous values, and maps of some of them are represented in Figure 17. It is also interesting to note that from the end of July, the CO trend seems to increase with respect to the typical historical value, as we marked with the black dot bold arrow in Figure 16. Investigating the maps, it is possible to exclude a volcano source for the 19 April and 2 August anomalies, while the other days could be related to the volcanic activity but still not directly emitted from the volcano. In particular, the values of 25 March and 14 September 2021 are spatially closer to the volcano and Canarias caldera.
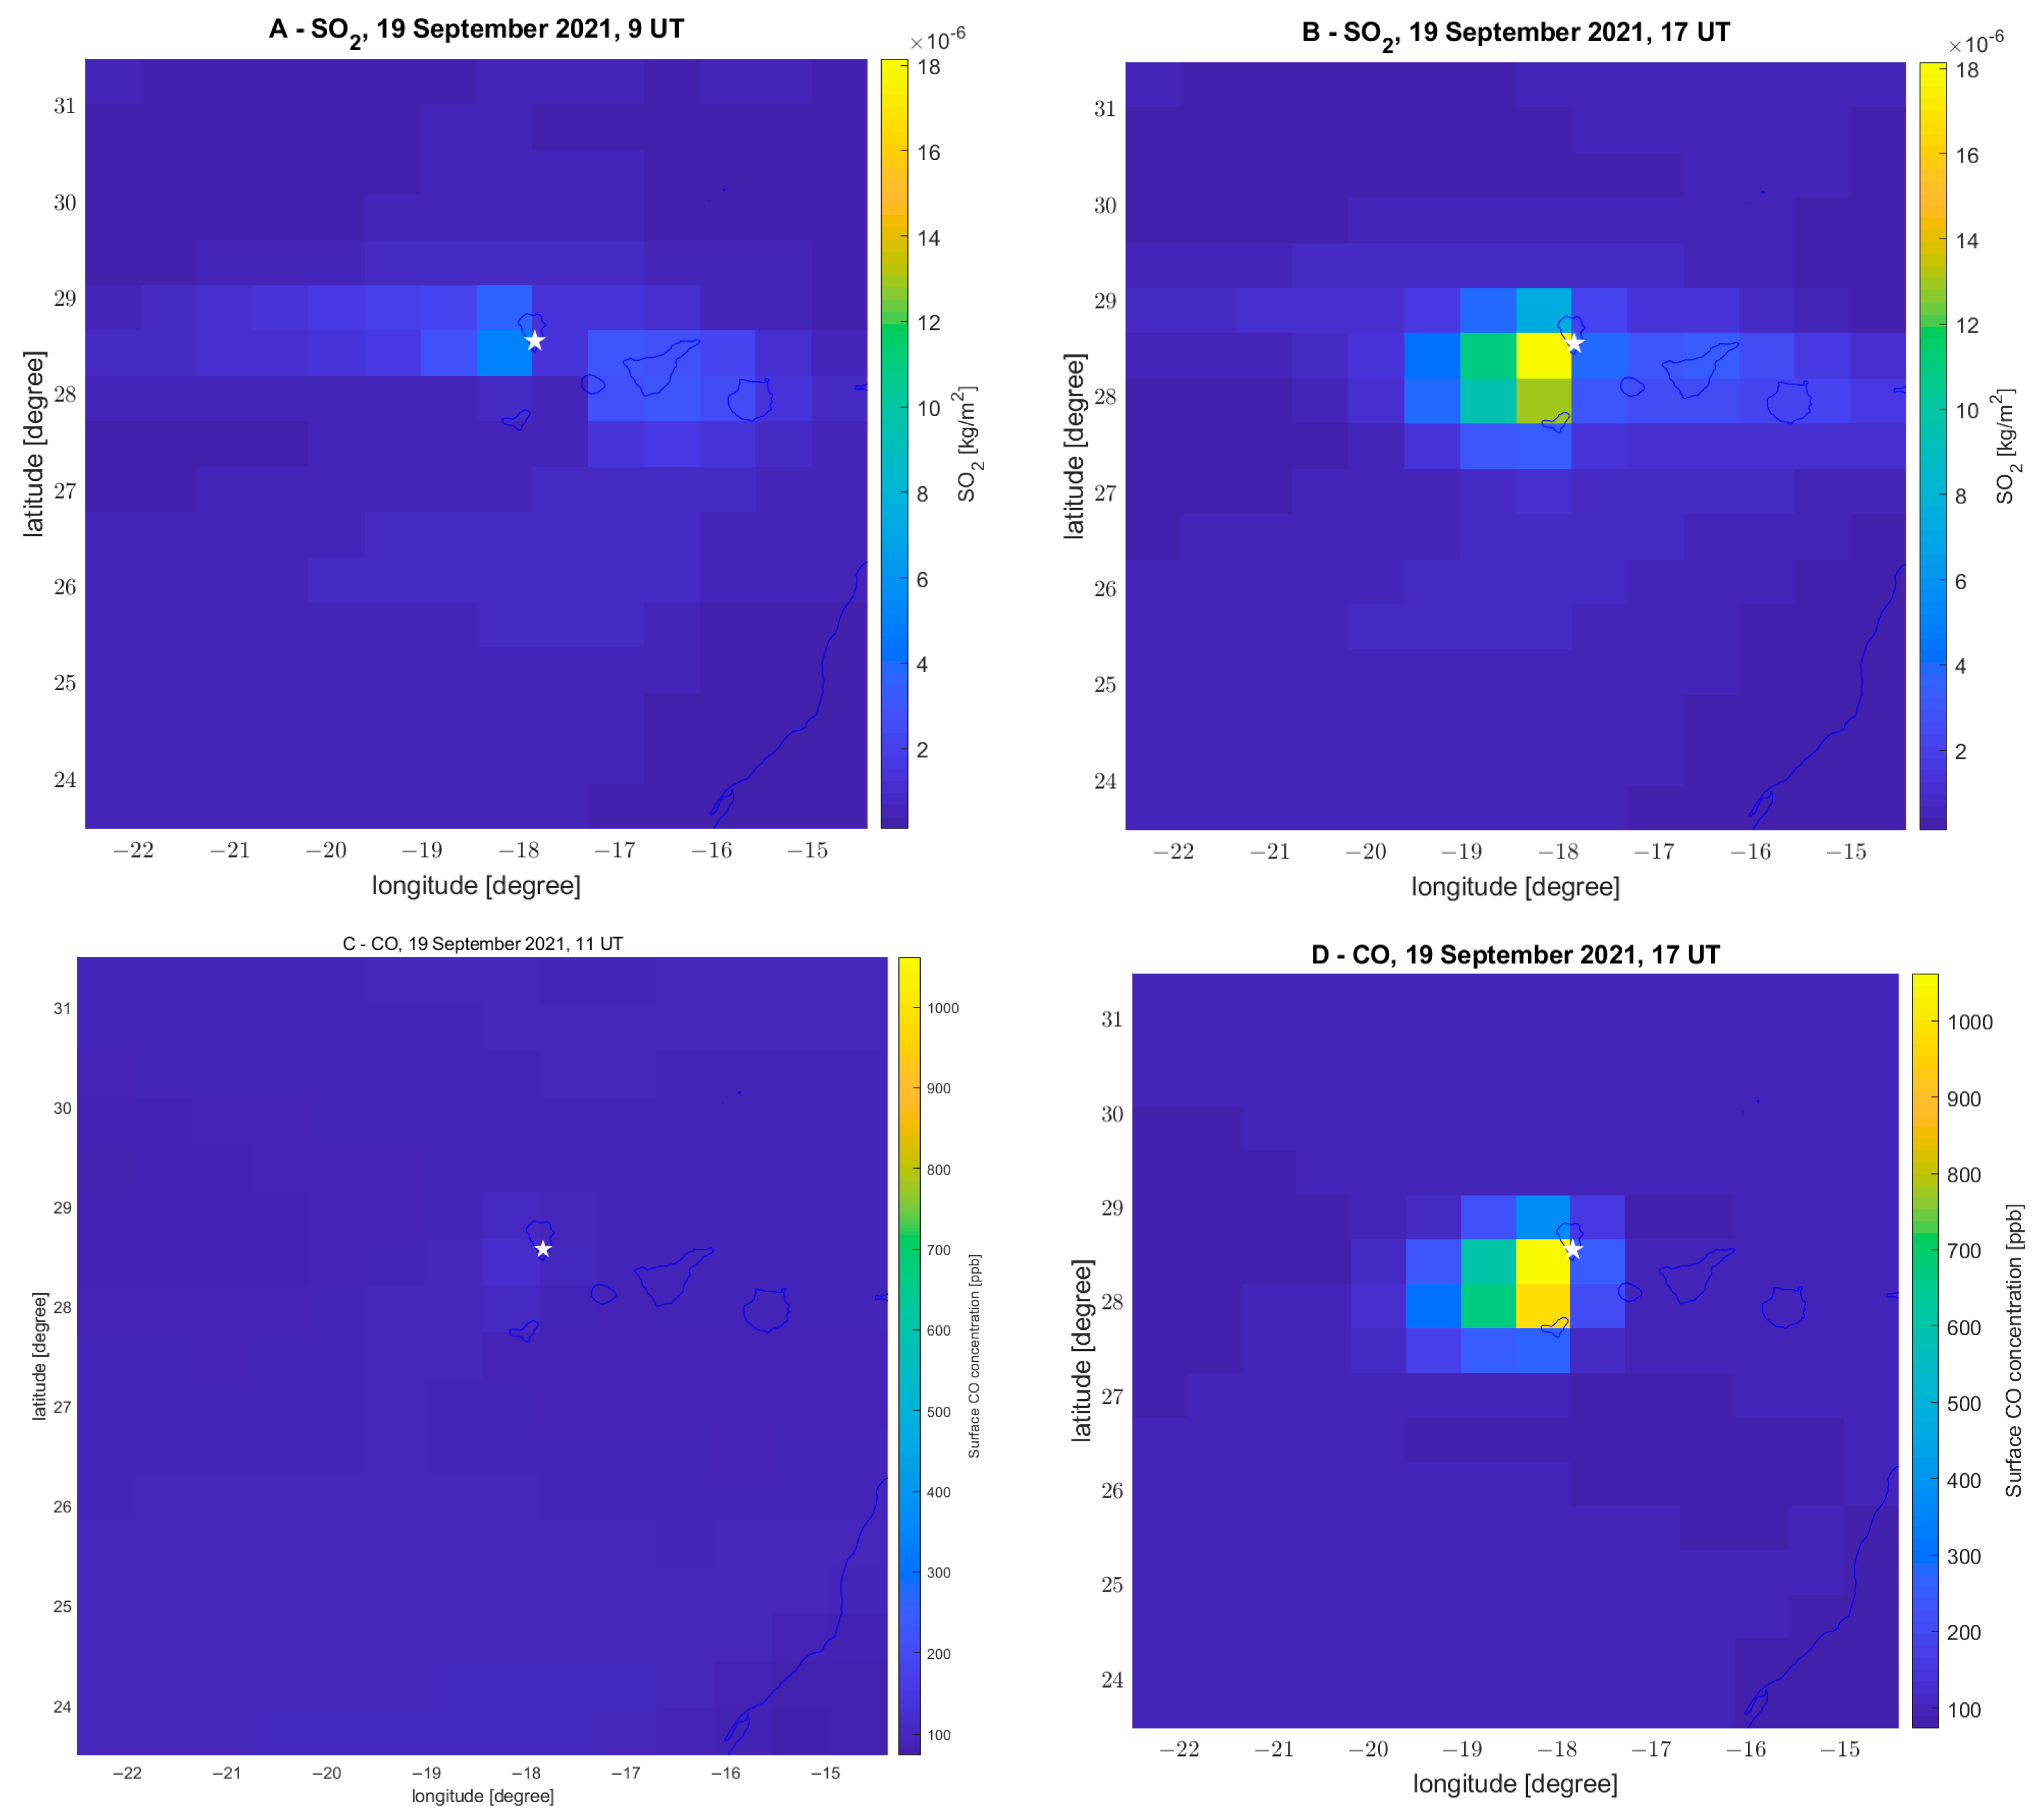
On the day of the eruption, only SO2, CO, and aerosol presented particularly high values, as shown in Figure 18 and Figure S4 (in Supplementary Materials File S1), while DMS showed normal values above la Palma. In Figure 18A, we identified the start of the emission of SO2 around 9 UT, even if in the hours before there was an almost-continuous emission but with a lower intensity. The start of emission of carbon monoxide seems later at about 11 UT, as shown in Figure 18C. Both the parameters reached the maximum concentrations at 17 UT, as depicted in Figure 18B,D. It is possible to note that the maximum value is about ten times higher than previous maps, i.e., the typical value. This high concentration is very likely due to the volcano’s eruption, and we expect it to be much more intense than possible pre-eruption emissions.
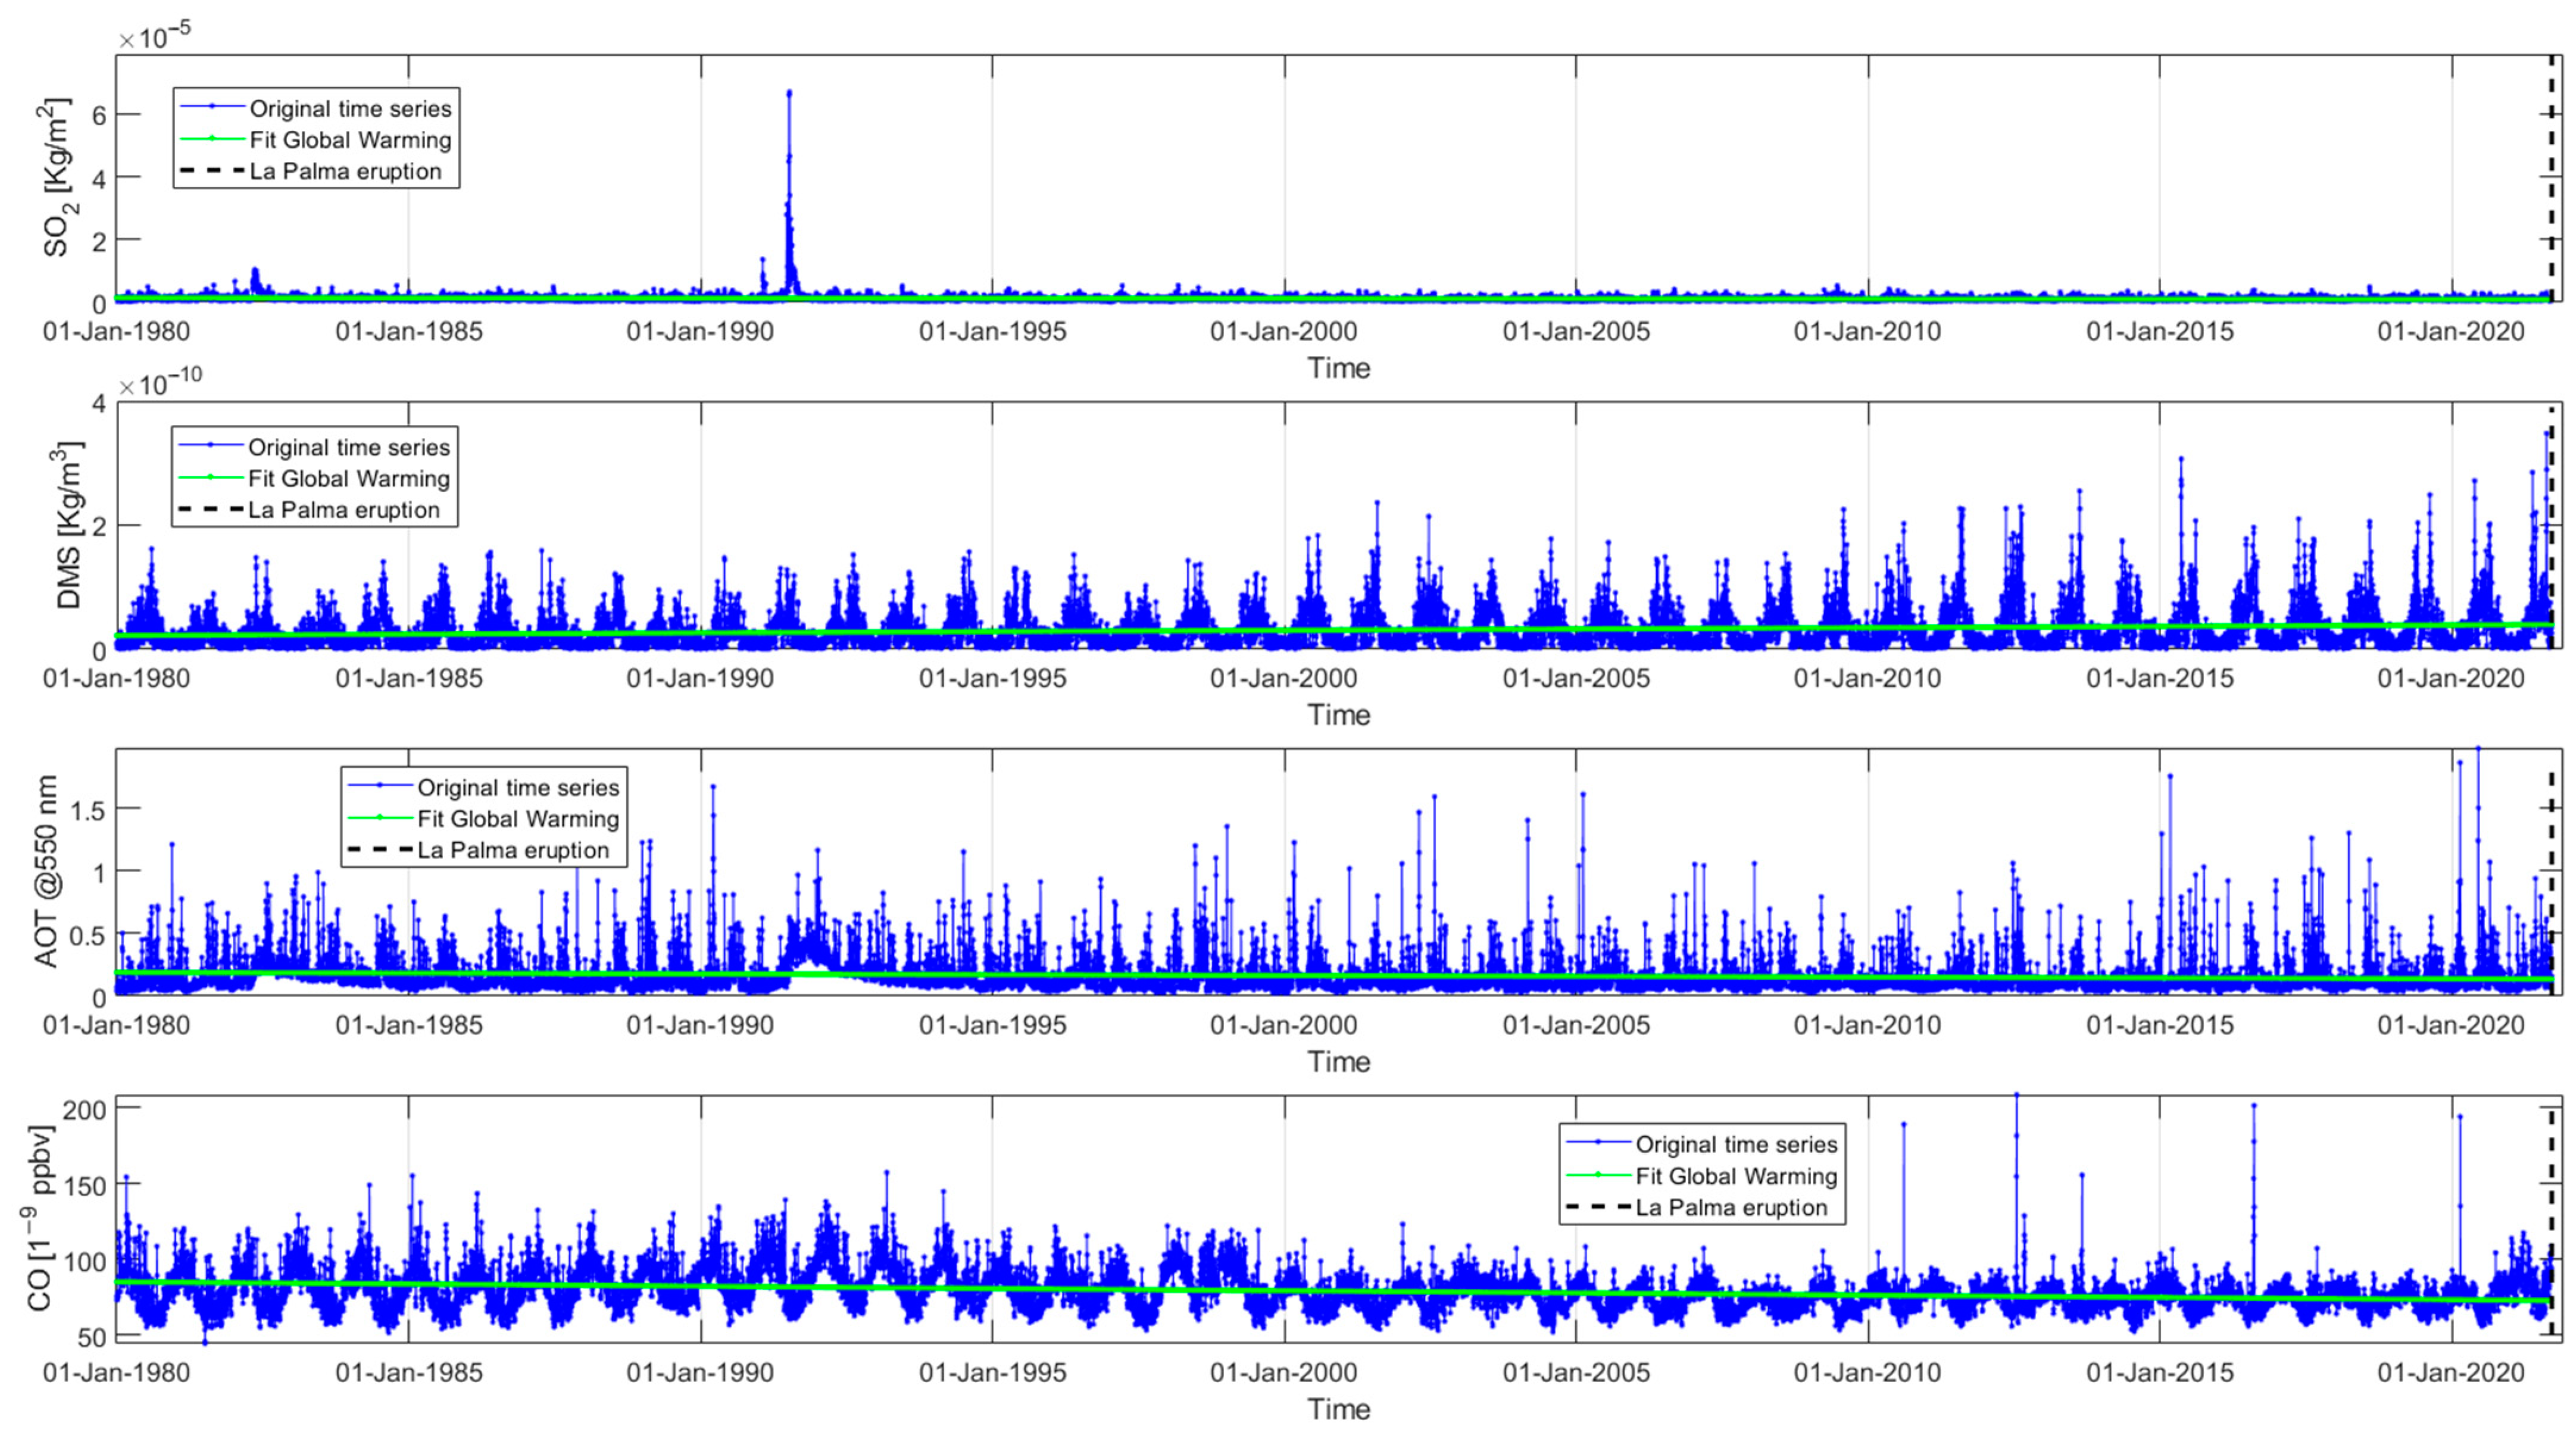
Figure 19 represents the daily mean value of SO2, dimethyl sulphide (DMS), aerosol, and CO inside a 3 degrees side square box centred on the volcano. A linear fit has been computed to estimate an eventual trend of “global warming”, although the obtained slopes are almost null for all parameters. This is probably because the selected parameters are not substantially affected by this phenomenon, like the temperature or the greenhouse gases such as methane and carbon dioxide, which instead show such a trend, as we found in previous works [52,81,82,83].
SO2 showed a very high peak in 1991, and the aerosol baseline is higher in the same period, but without such a high peak. We dedicated the specific paragraph 4.1 of the discussion to investigating the source of this signal. All the parameters show modulation of their values for a period of one year, that is, the seasonal trend. We removed this trend by a wavelet decomposition of the signal, reconstructed the decomposed component without such modulation, and analysed the final signal in Figure 20 and Figures S5–S7 (in Supplementary Materials File S1).
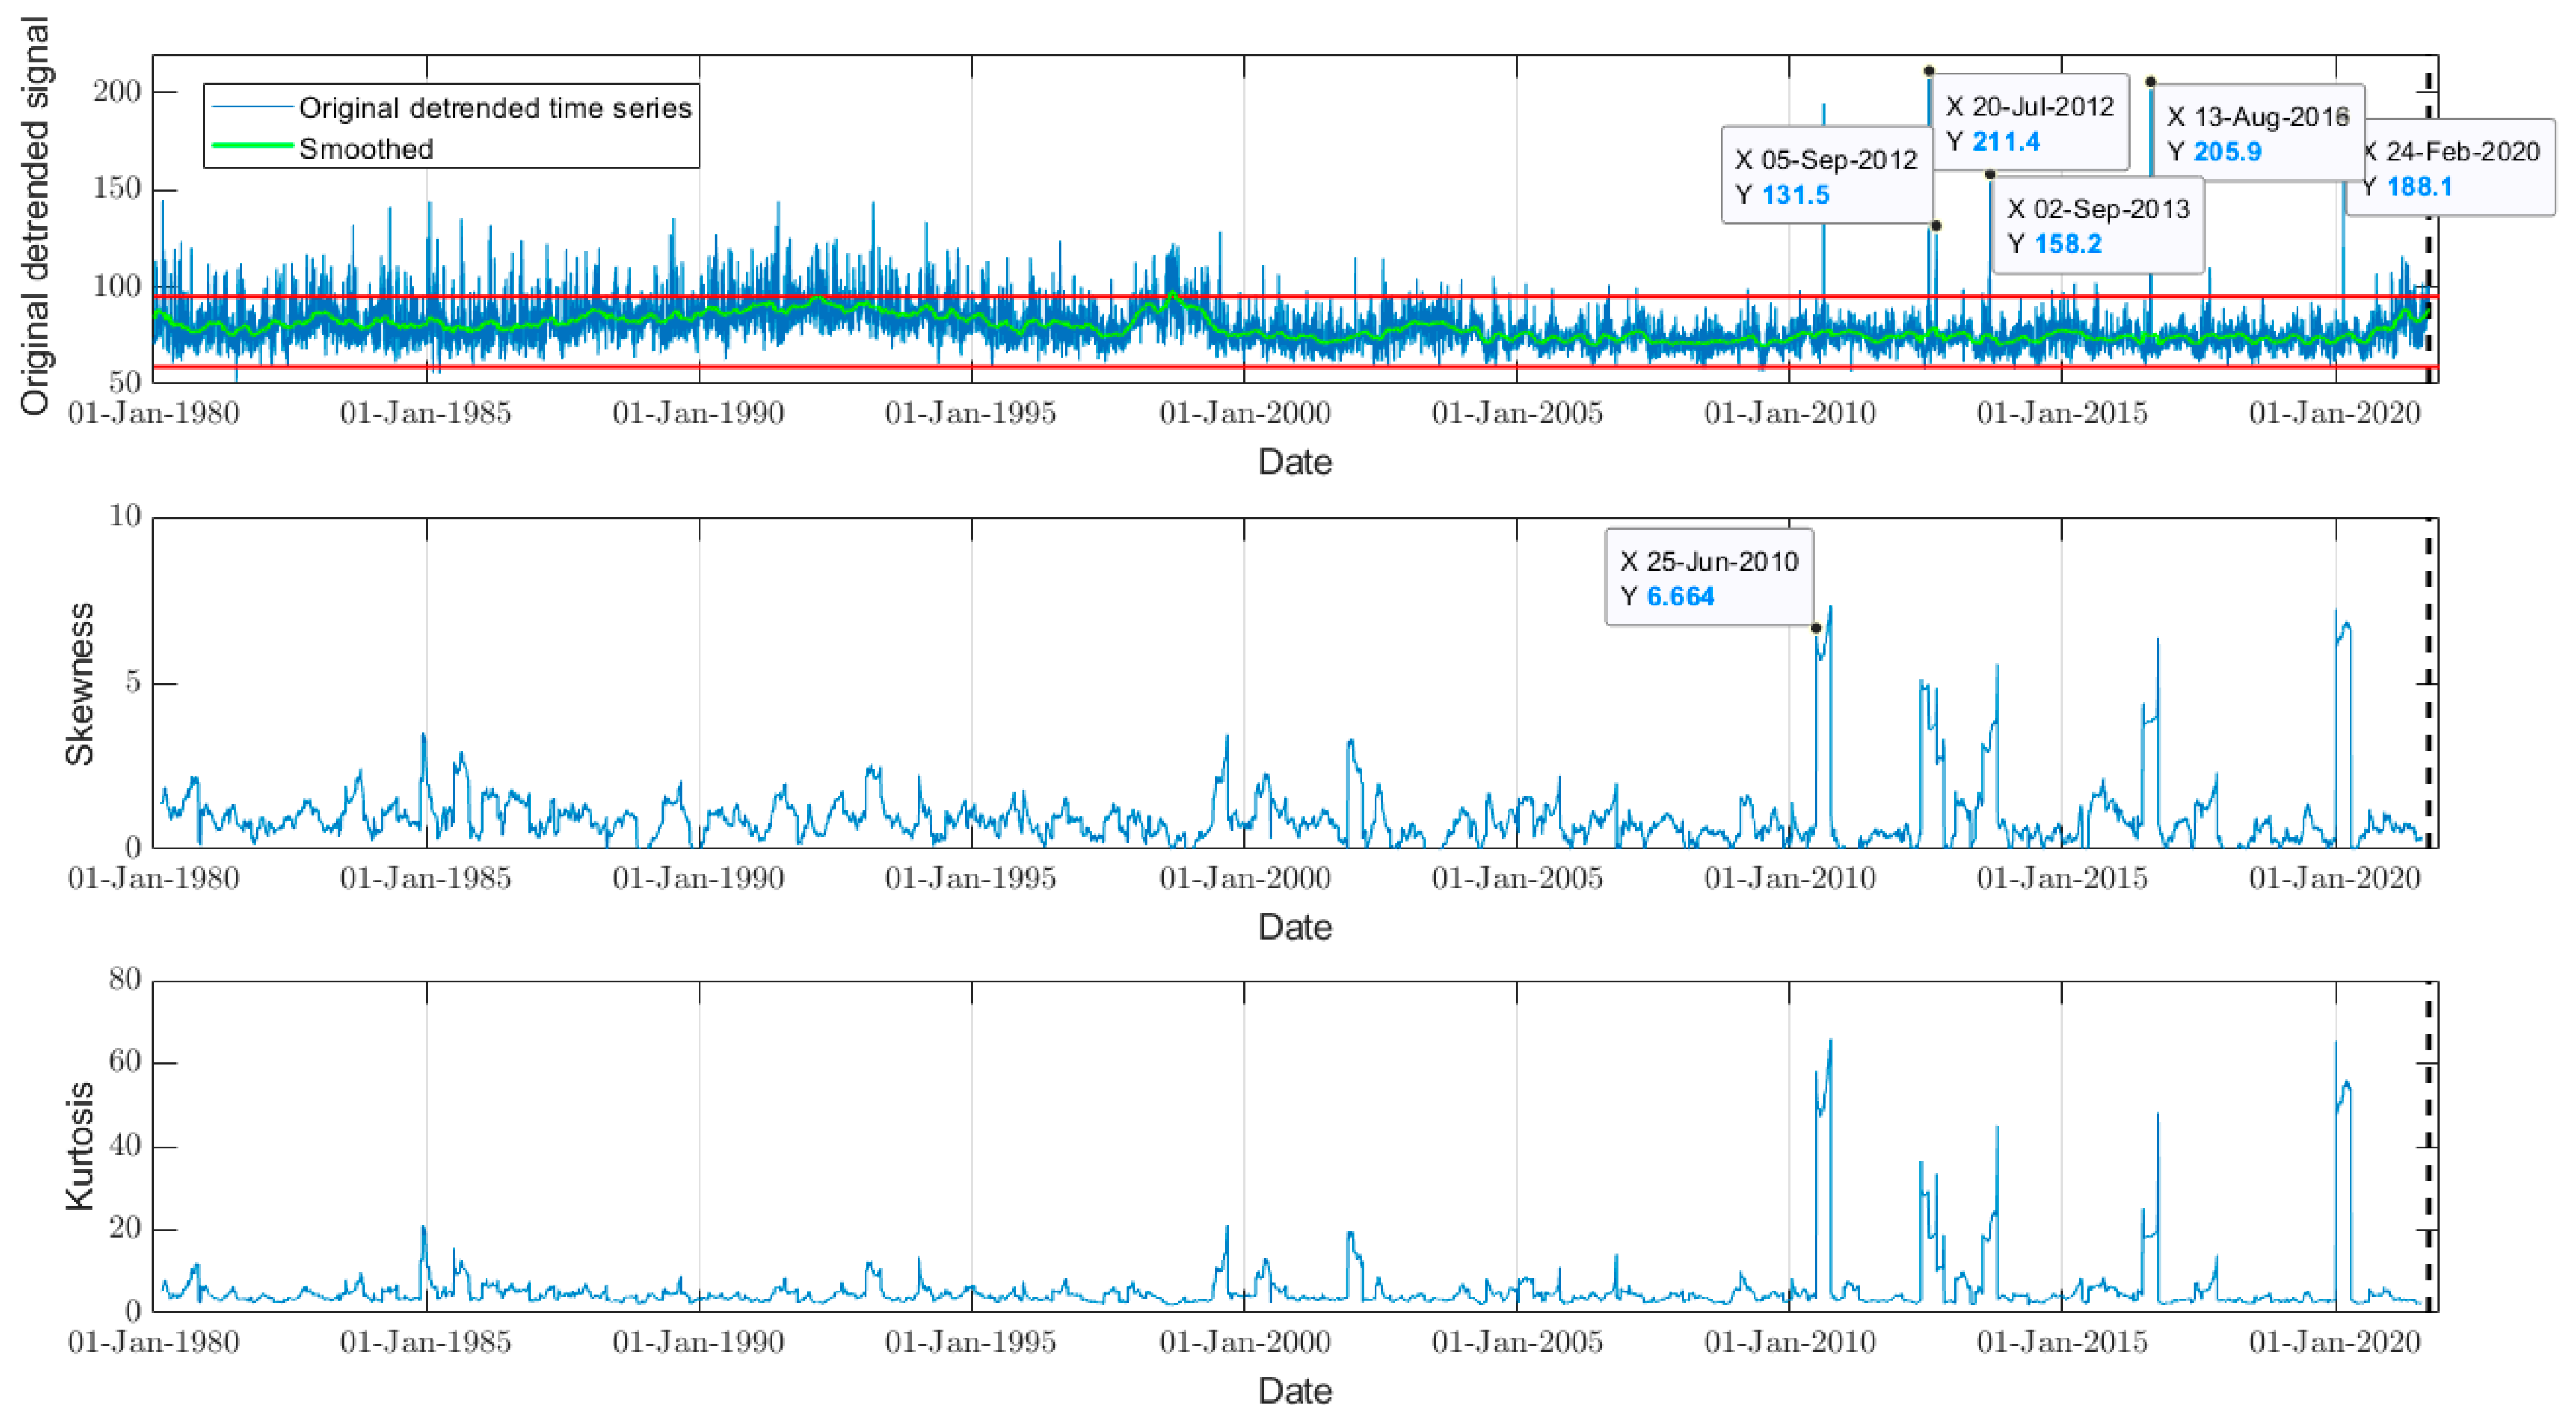
In particular, Figure 20 and Figures S5–S7 (in Supplementary Materials File S1) represent the detrended signals of SO2, DMS, AOT, and CO from 1 January 1980 until 19 September 2021. We reported two thresholds as two red lines, calculated on the same time series representing the median plus or minus 1.5 times the interquartile range. In principle, the value outside such thresholds could be considered anomalous, but this is true only for a normal distribution. We have calculated the Skewness and Kurtosis (i.e., the third and fourth moments of the distribution) of such time series using a moving window of 100 days, i.e., 100 samples. It is possible to note that, in particular, the Skewness is often greater than 0, so the distributions are usually not Gaussian. Despite this, some values clearly presented high anomalous values, both in terms of their symmetry (Skewness) and the tailedness (Kurtosis) of their sample distributions. For such abnormal days, we reported a tip with an indication of the day and value for further discussion. In the case of CO, it is outstanding to note that there was no particular anomaly before 2010 (i.e., for about 30 years), and in the last 11 years, there have been several anomalous values. A specific discussion is provided in Section 4.3.

3.3. Ionospheric Investigation

Electron density of CSES has been monitored in the volcanic area of the Canarias Islands system, considering a circle centred on La Palma volcano with a radius of 420 km. Considering that the ionosphere status is very different at night- and day-time for the influence of solar irradiation that induced, for example, the classic fountain effect around the magnetic equator [84], we separated their analyses. Figure 21 reports the night-time detrended values measured by CSES at about 2 AM, and Figure 22 reports those of day-time, acquired at about 2 PM. For each day in quiet geomagnetic time (|Dst| ≤ 20 nT and ap ≤ 10 nT), the median of the Ne samples in the circular area is computed and represented after detrending, as explained in Appendix A. The figures report the indications of the anomalous positive days with the indication of how many days before the La Palma volcano eruption were recorded and the amount of anomaly. We noted that both analyses identified an increase in electron density about four months before the eruption (−128 days for day-time and −121 days for night-time).
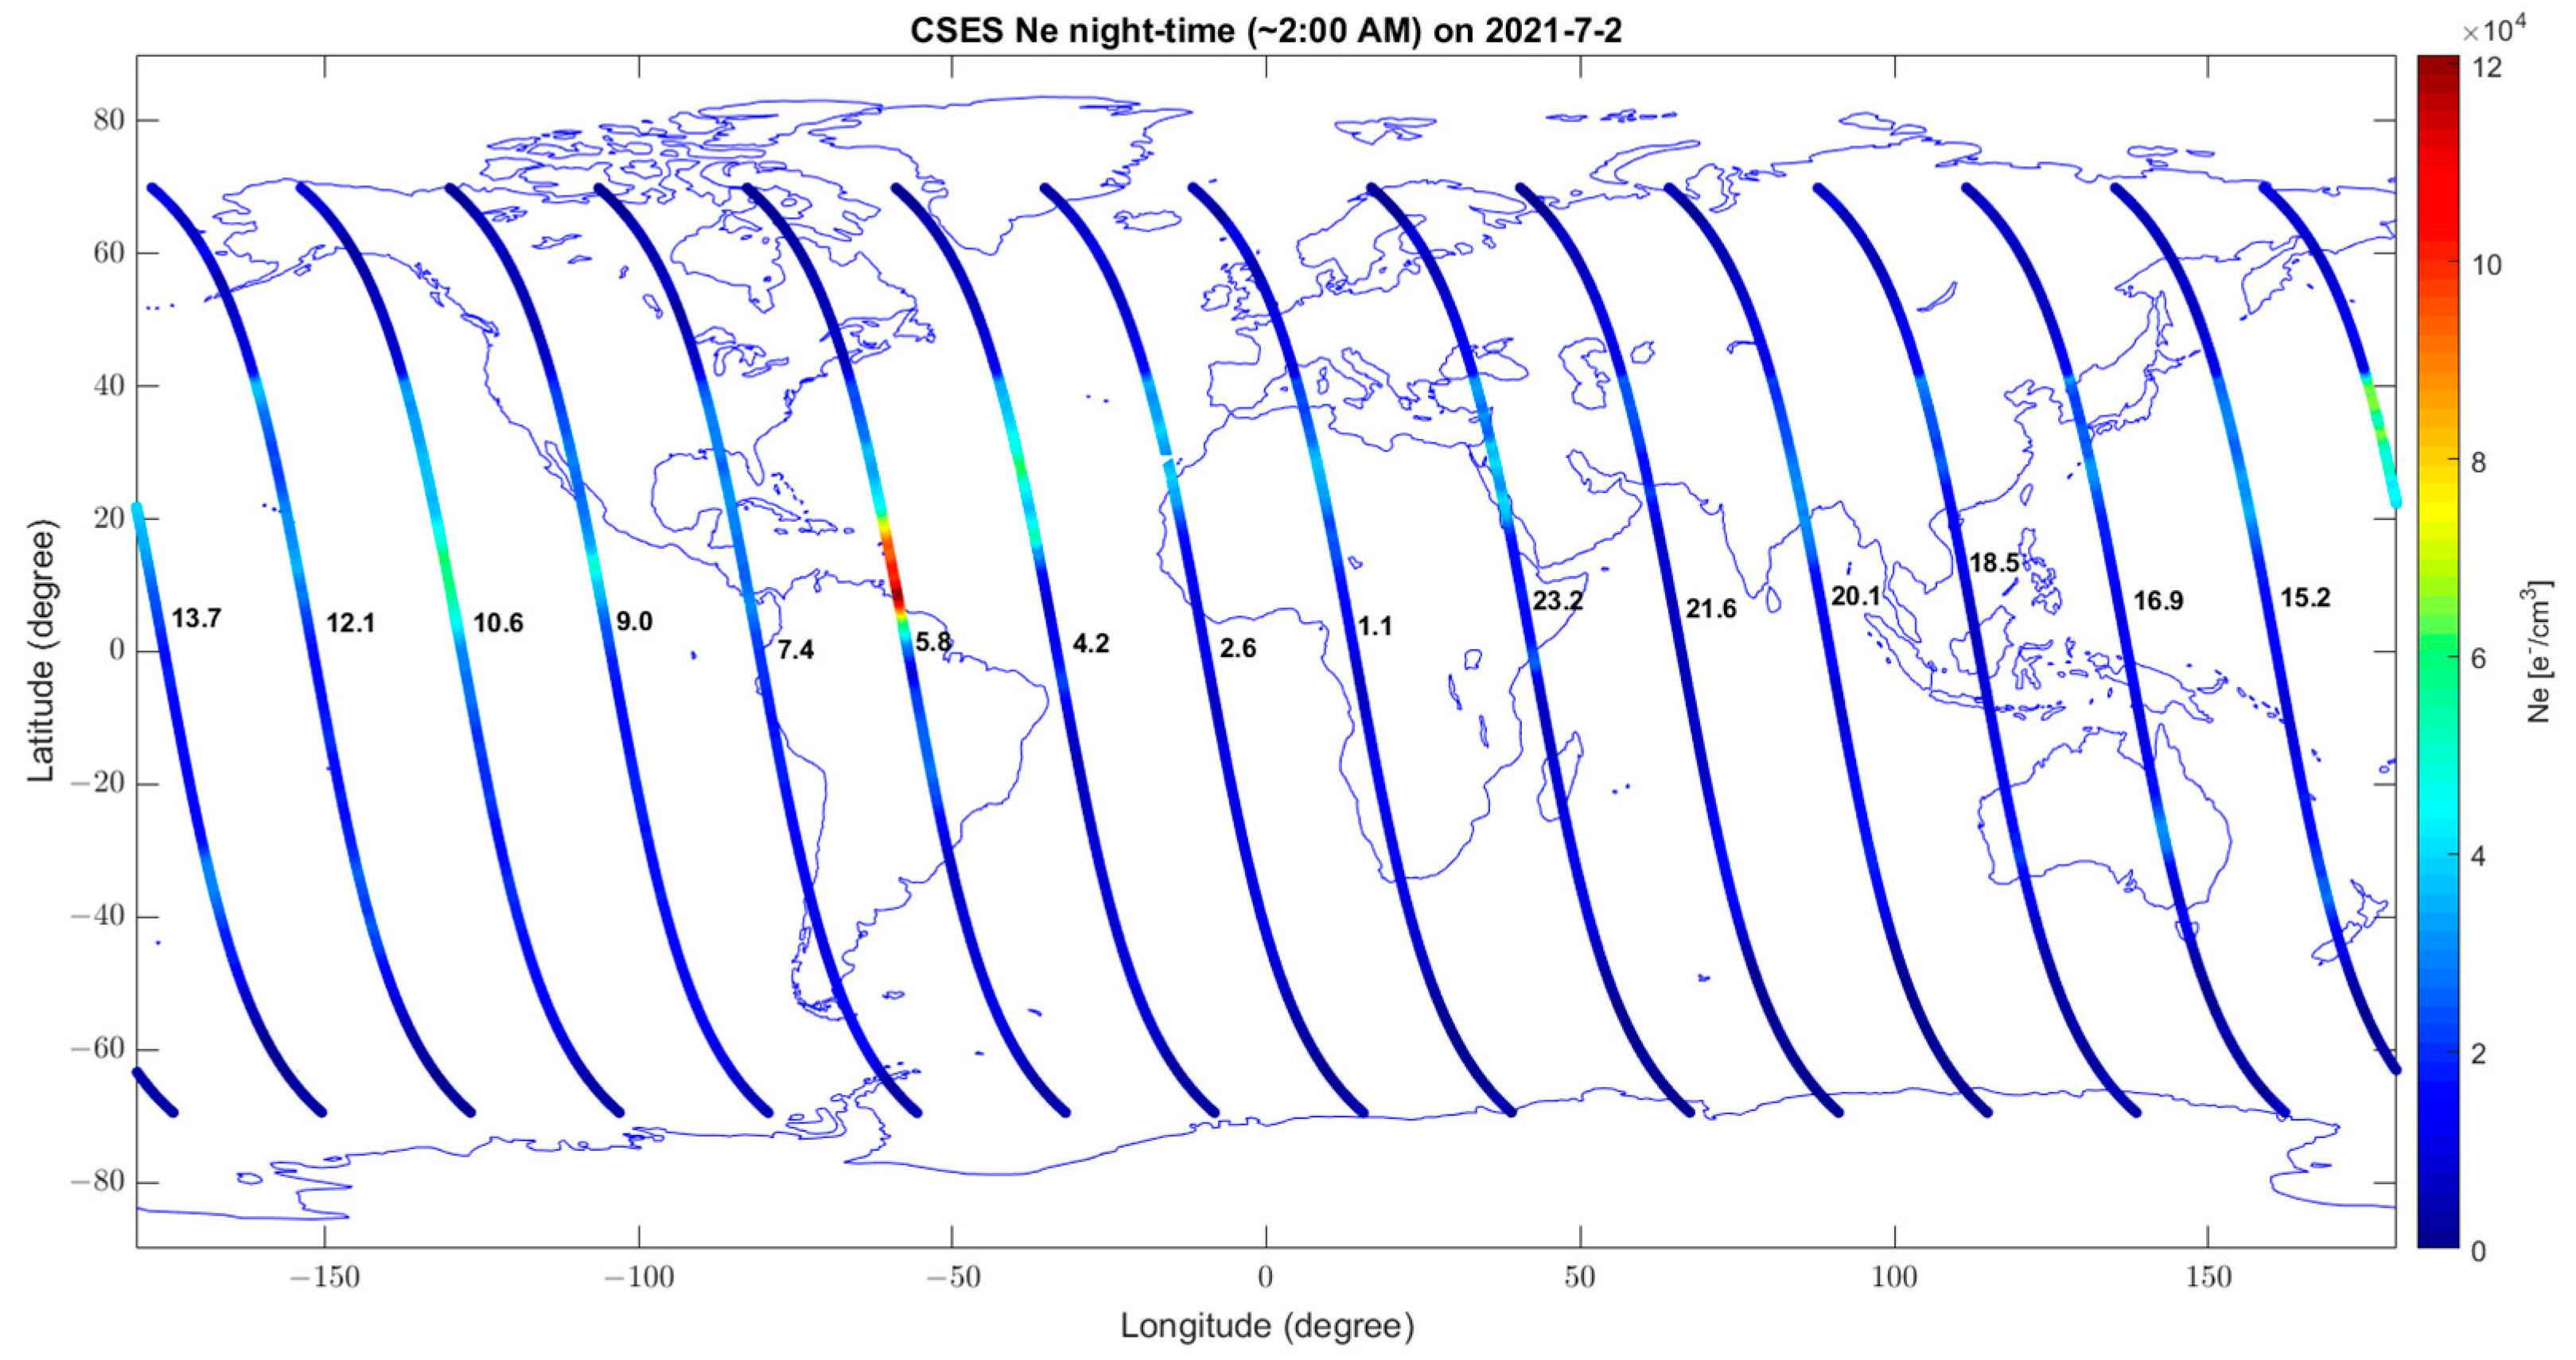
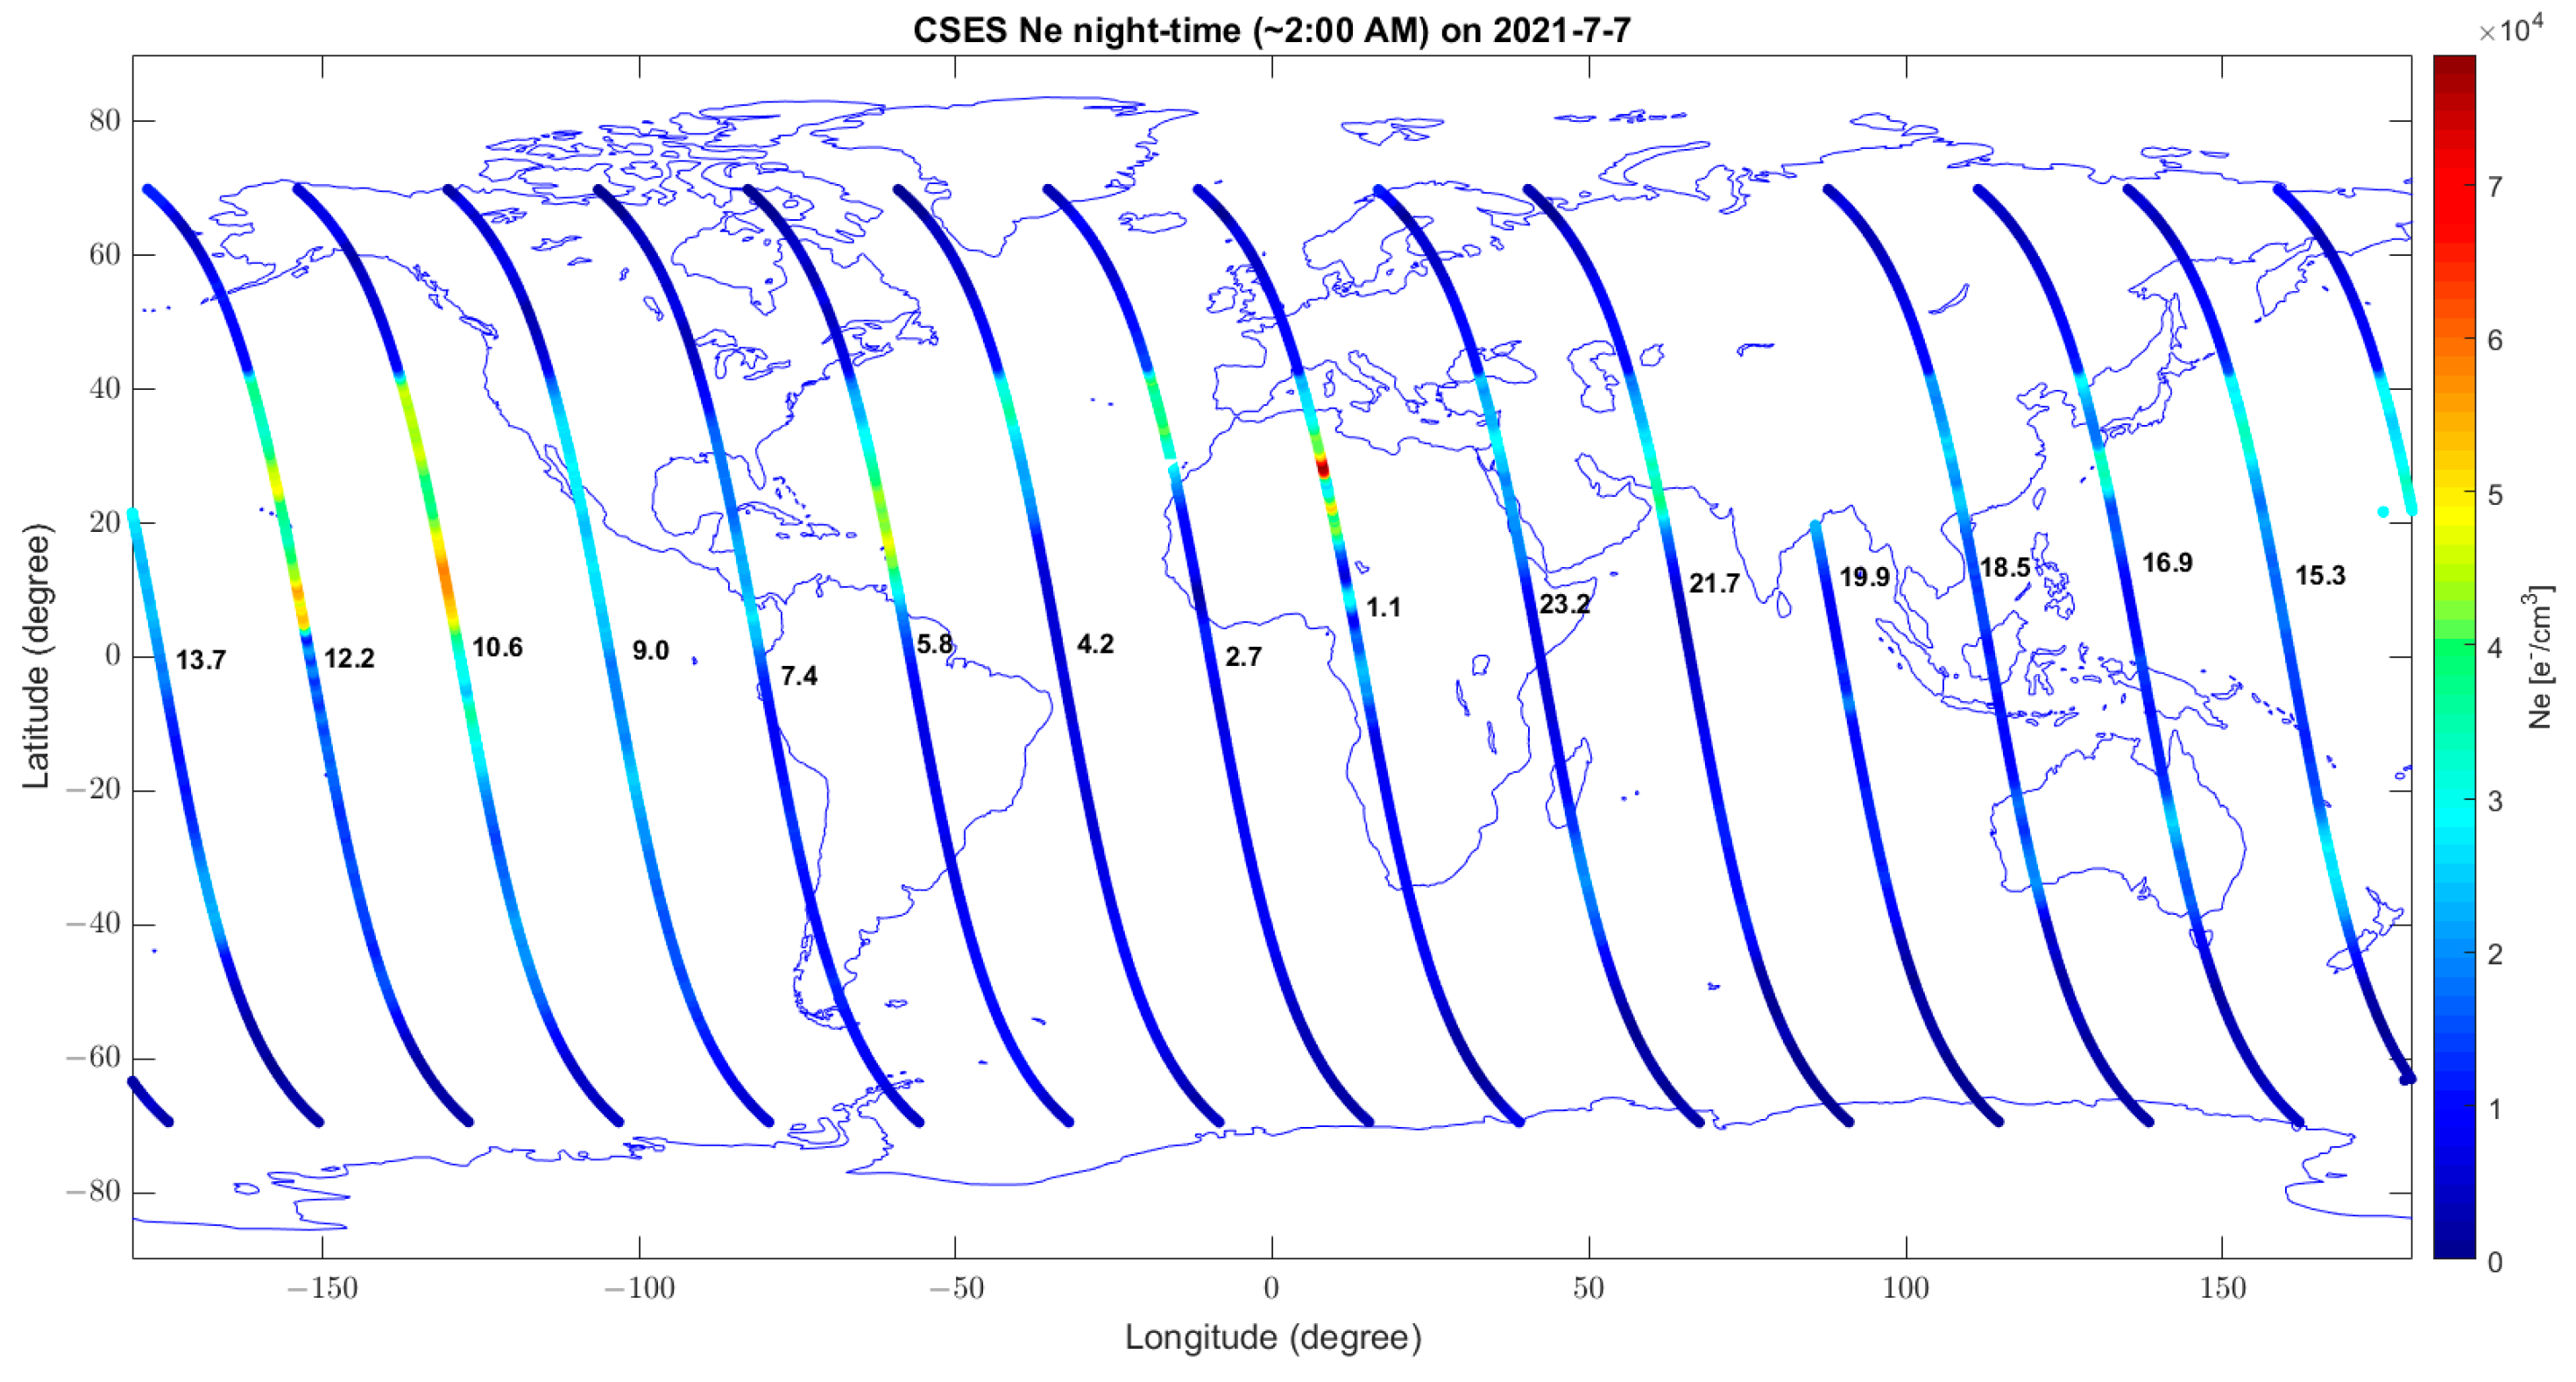
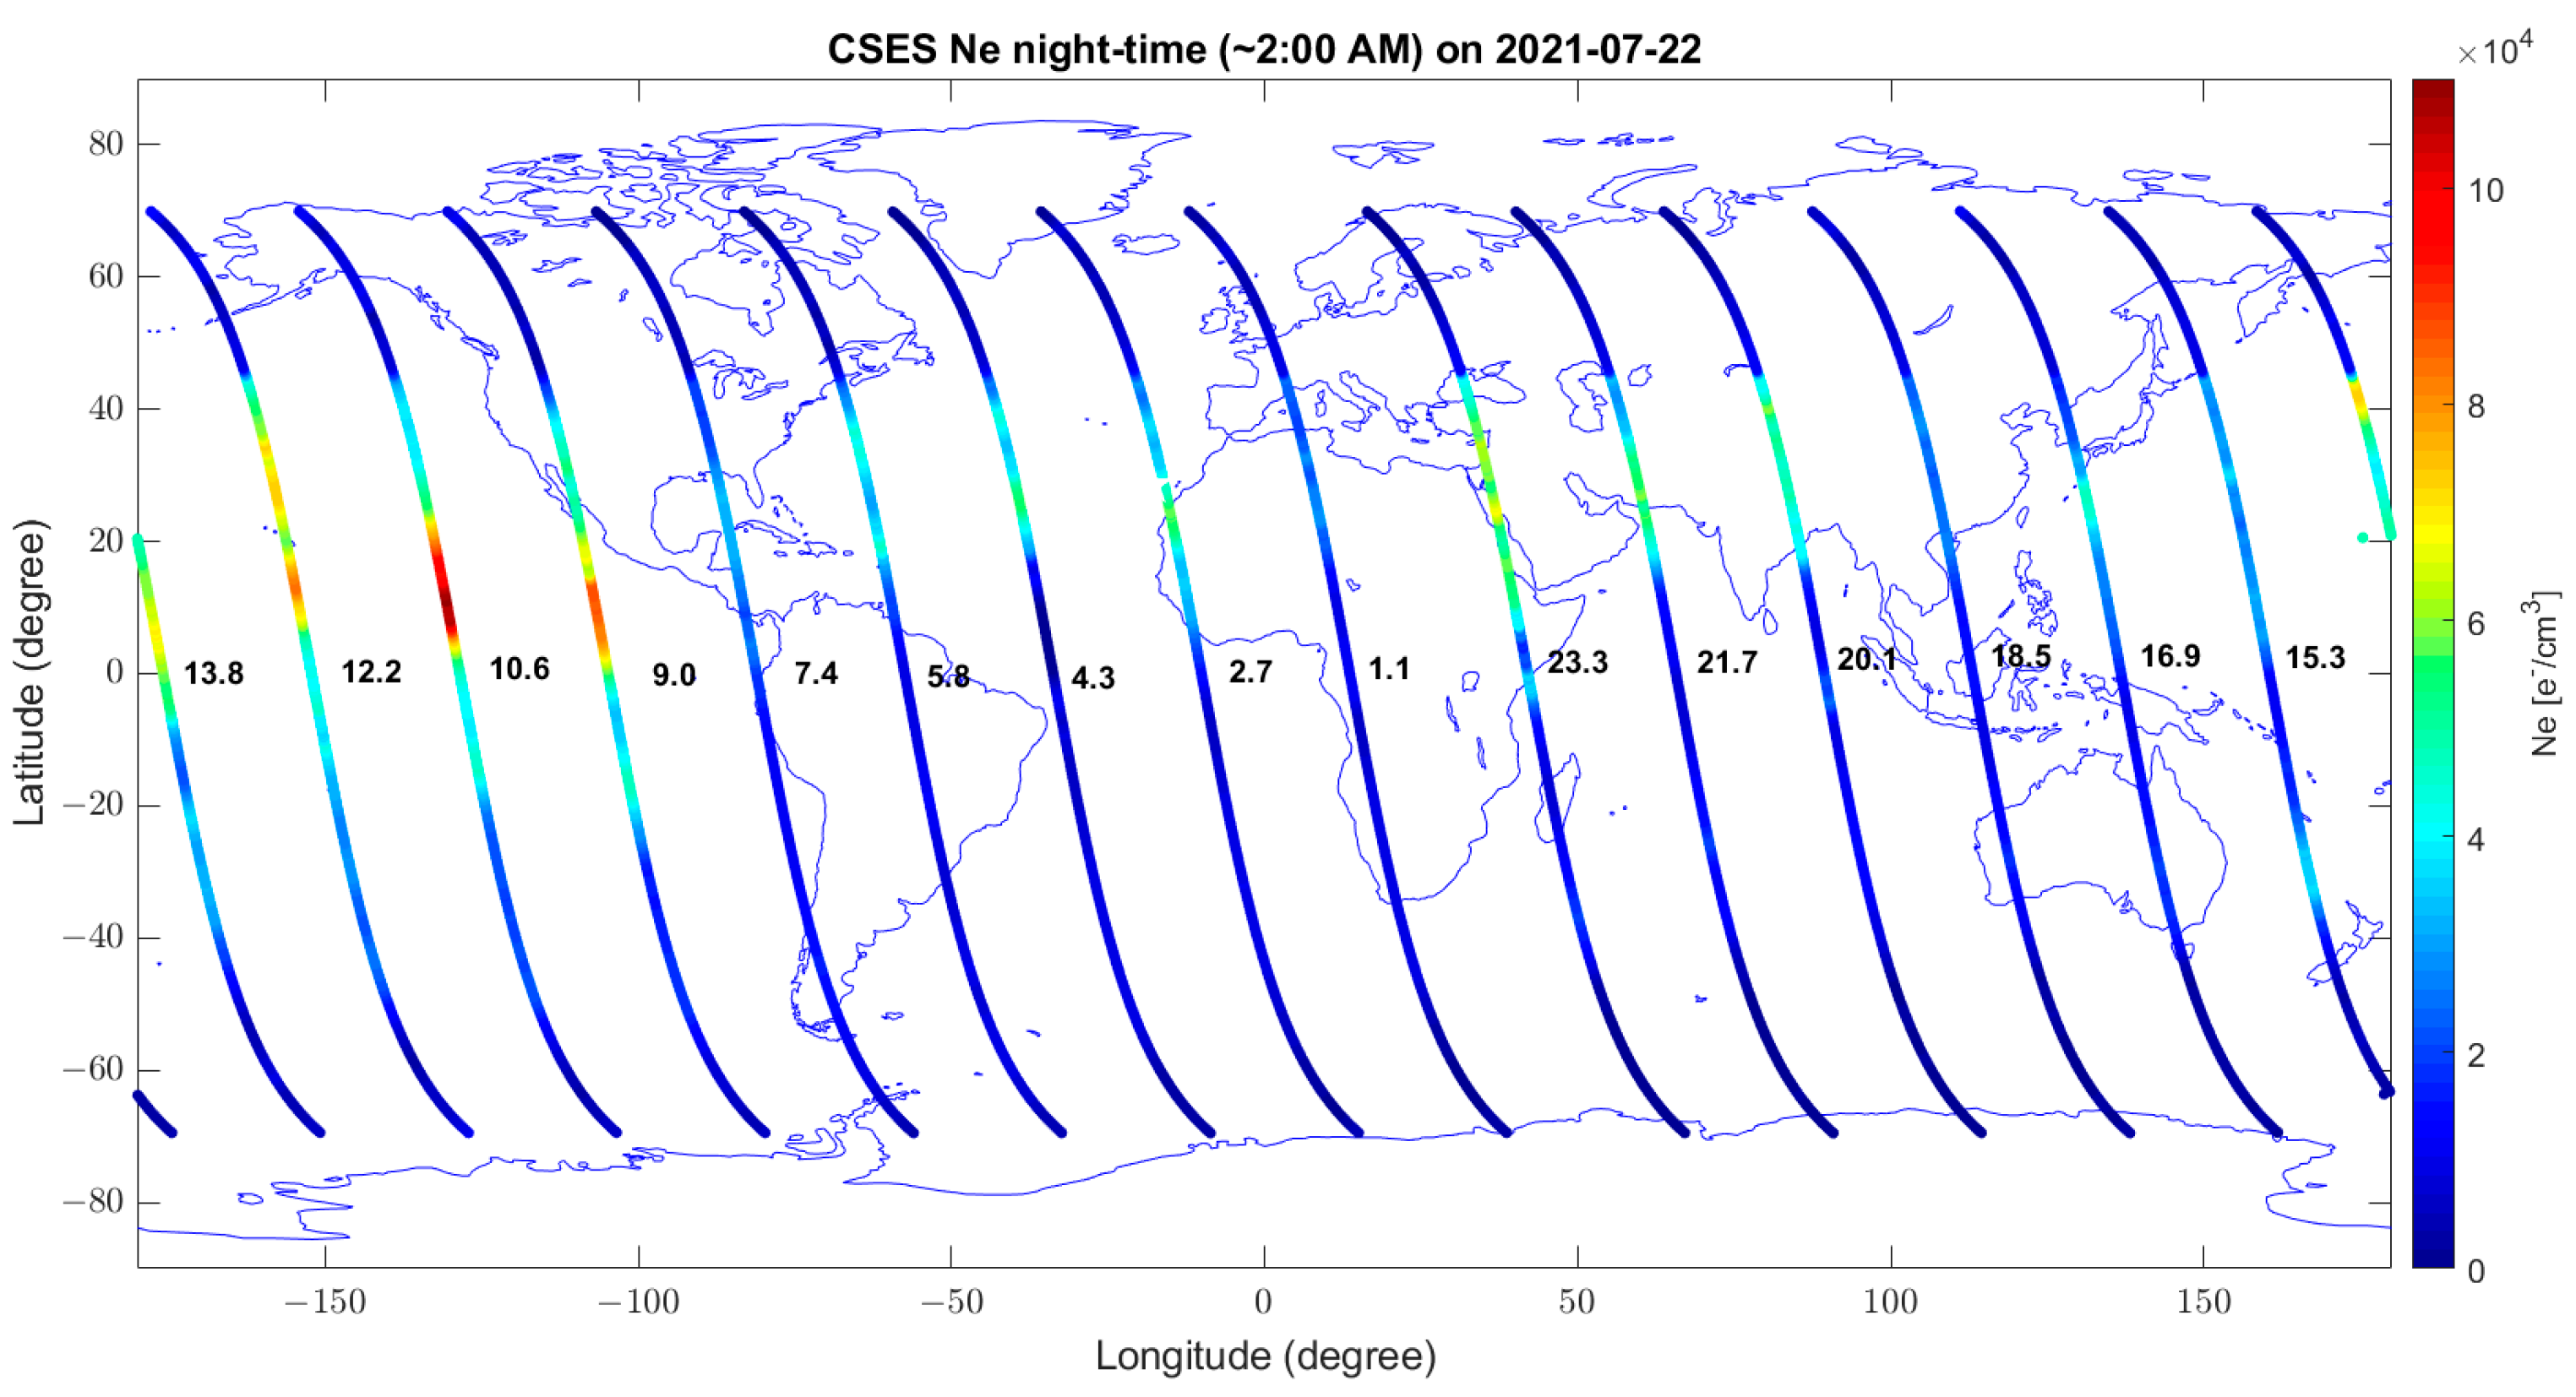
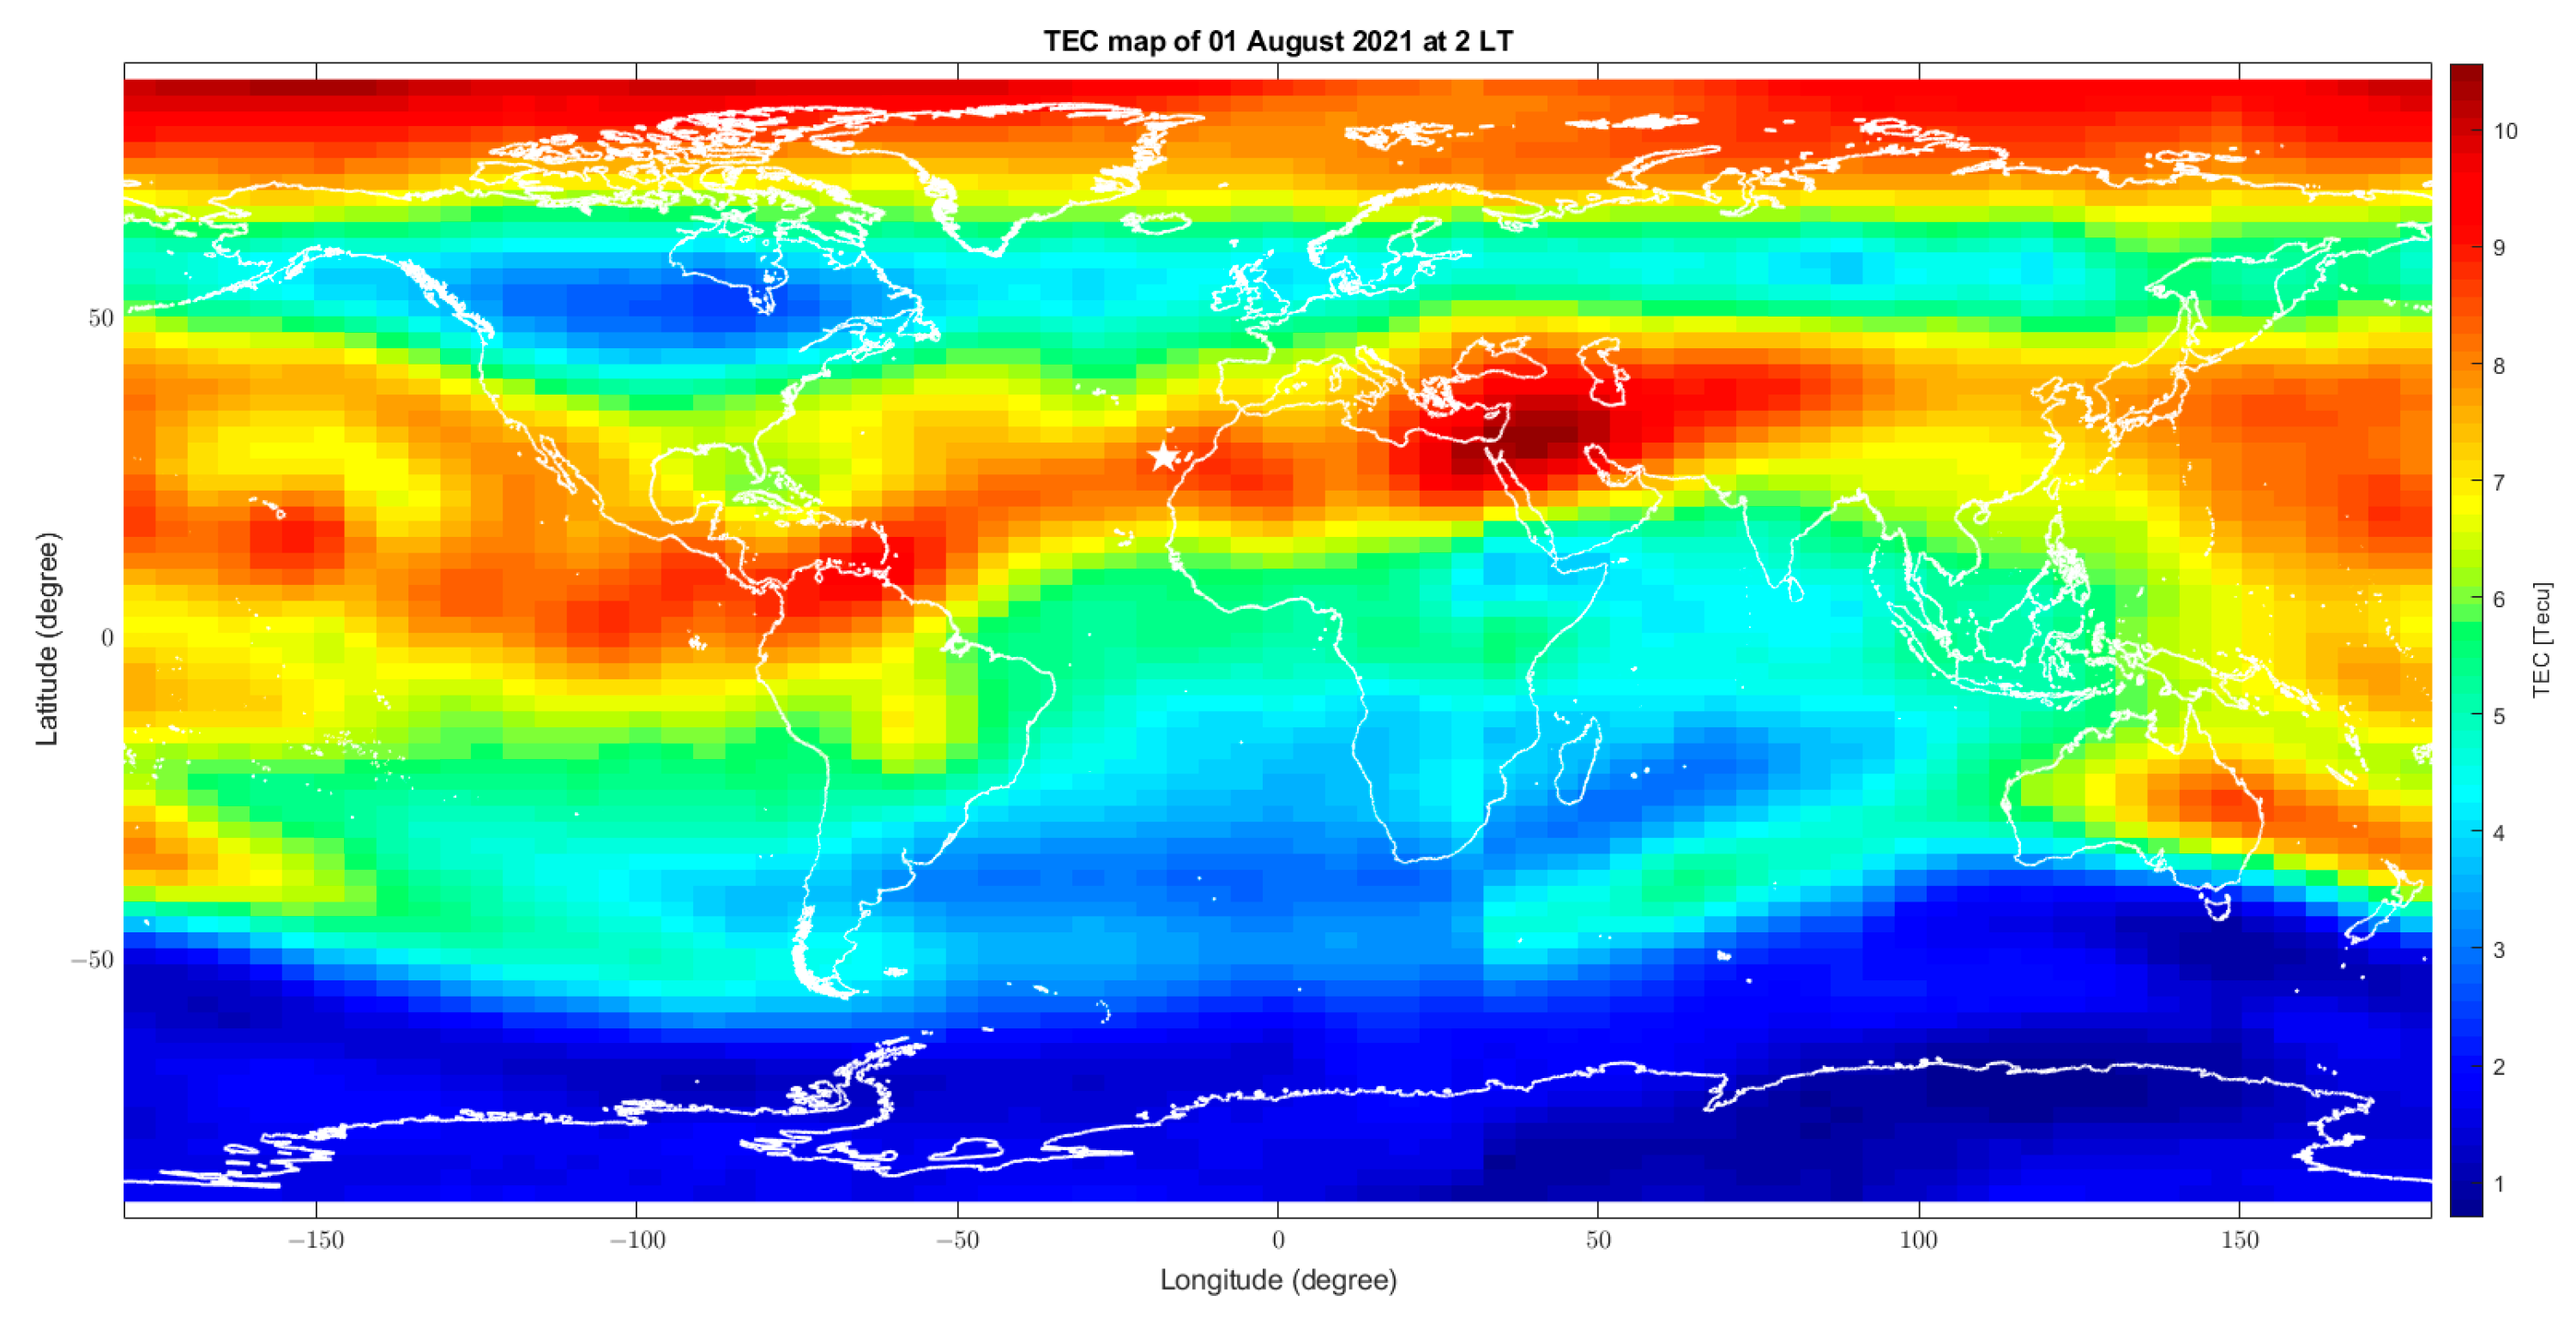
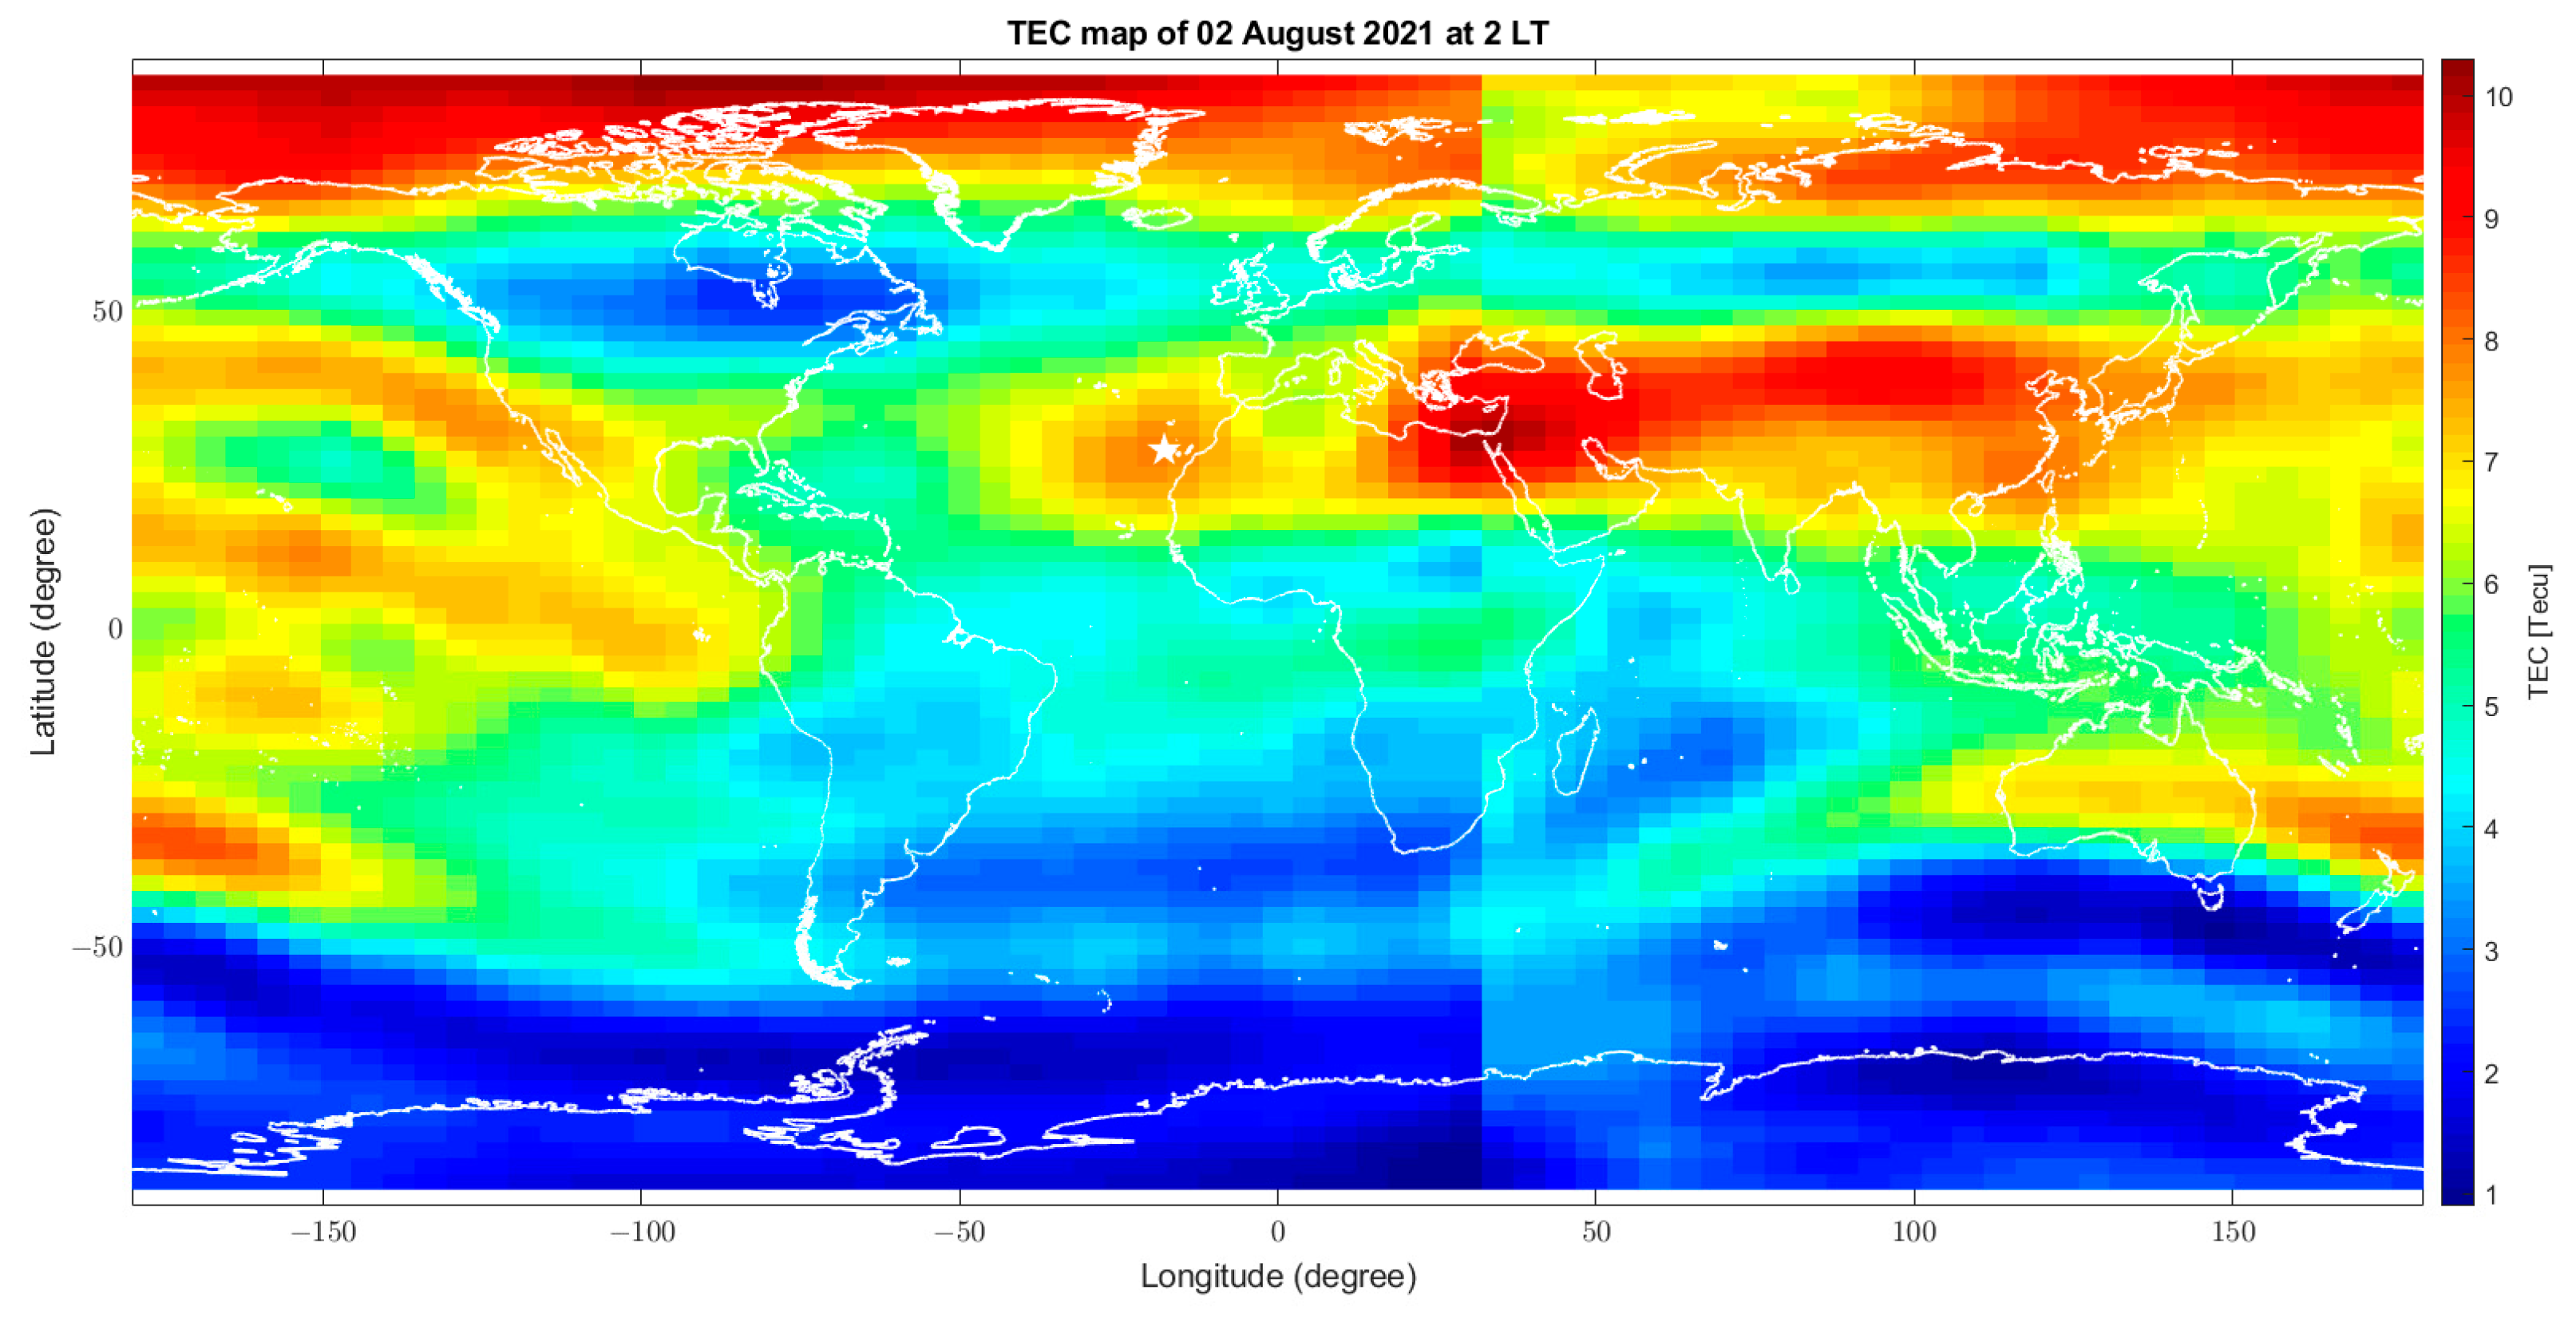
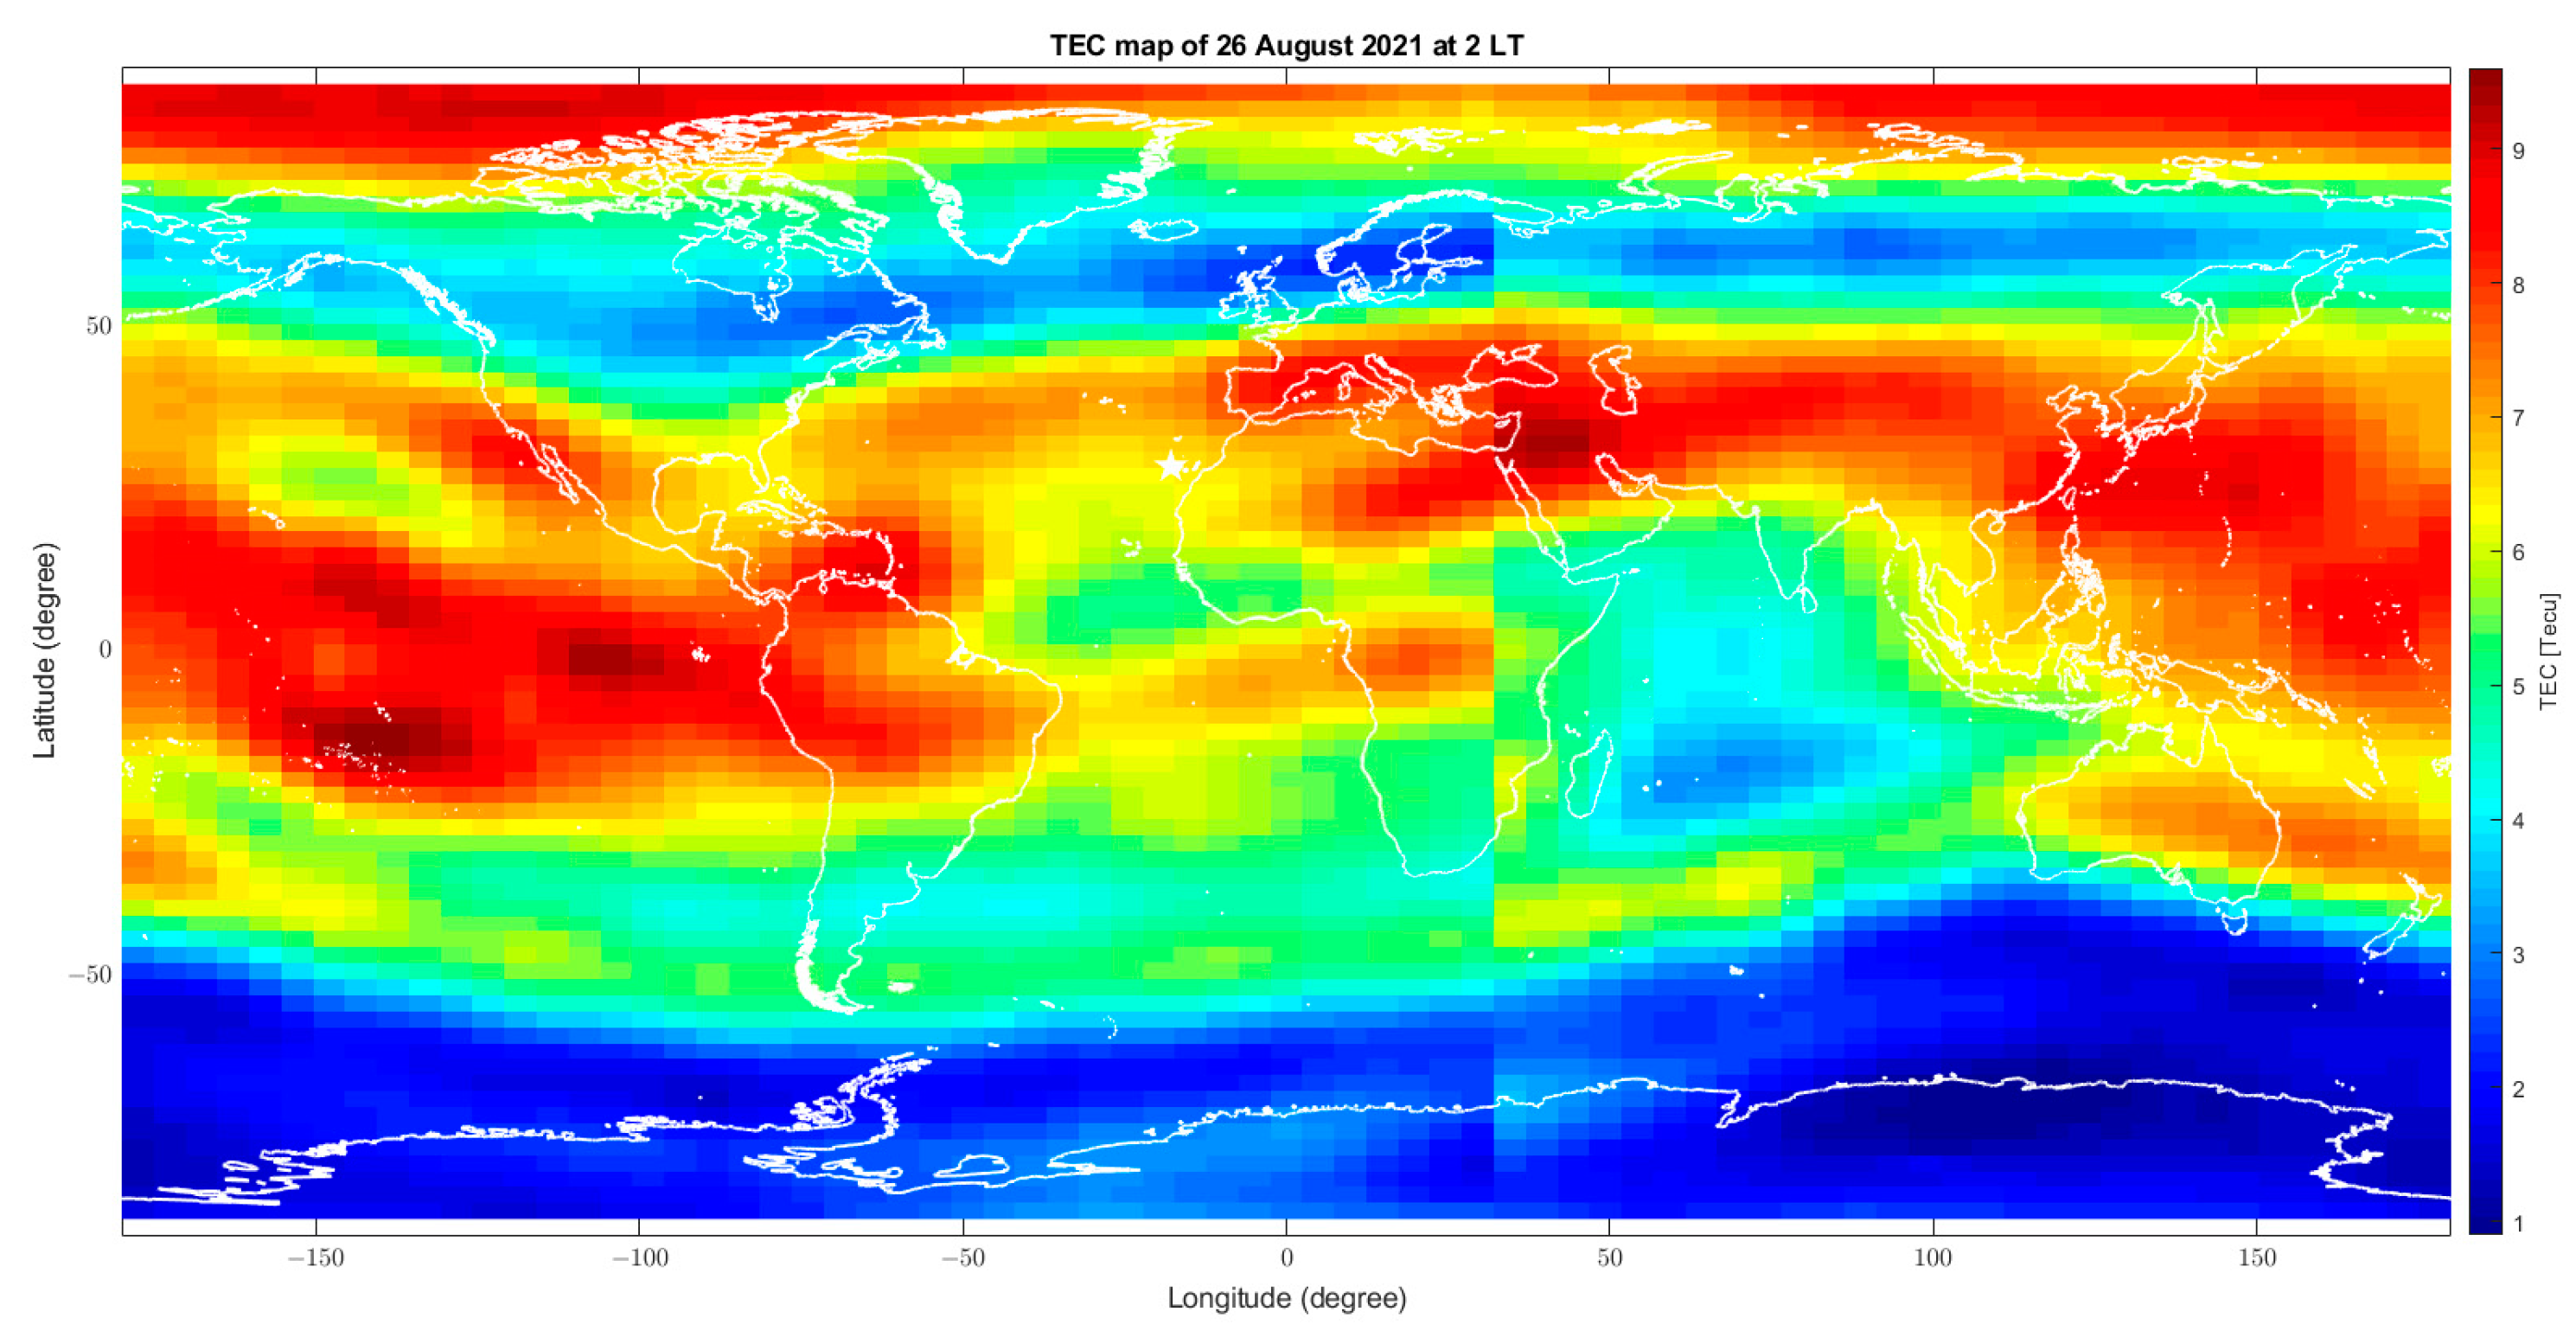
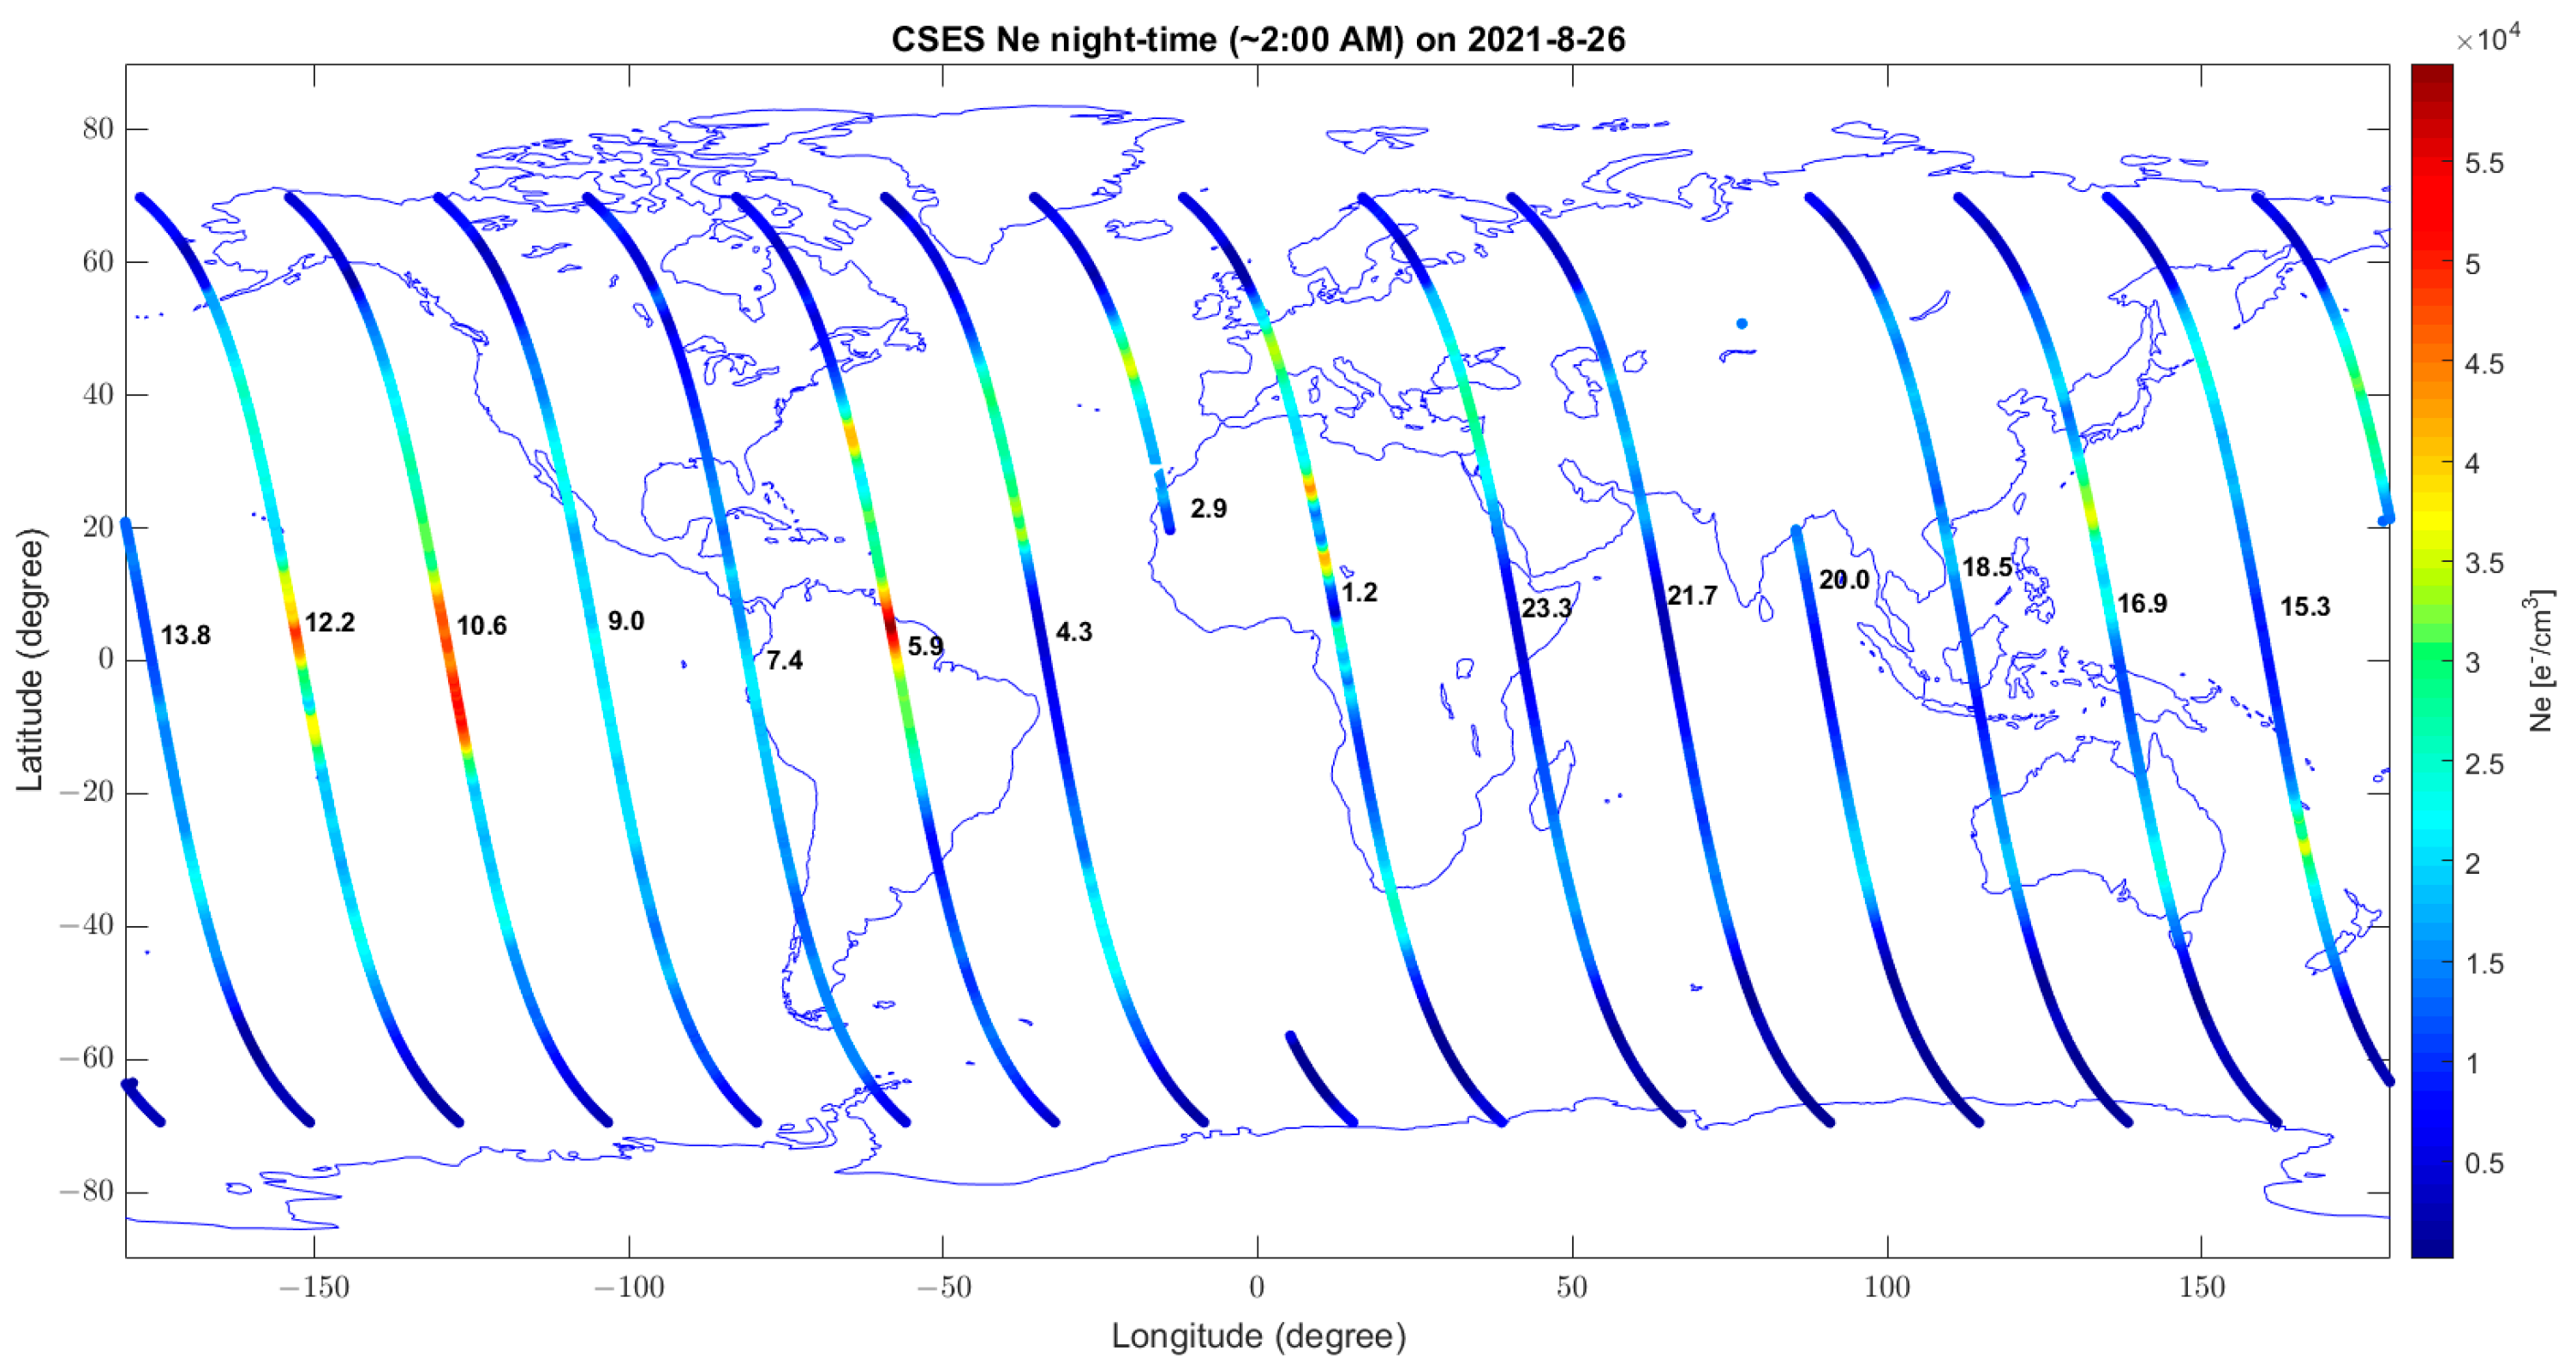
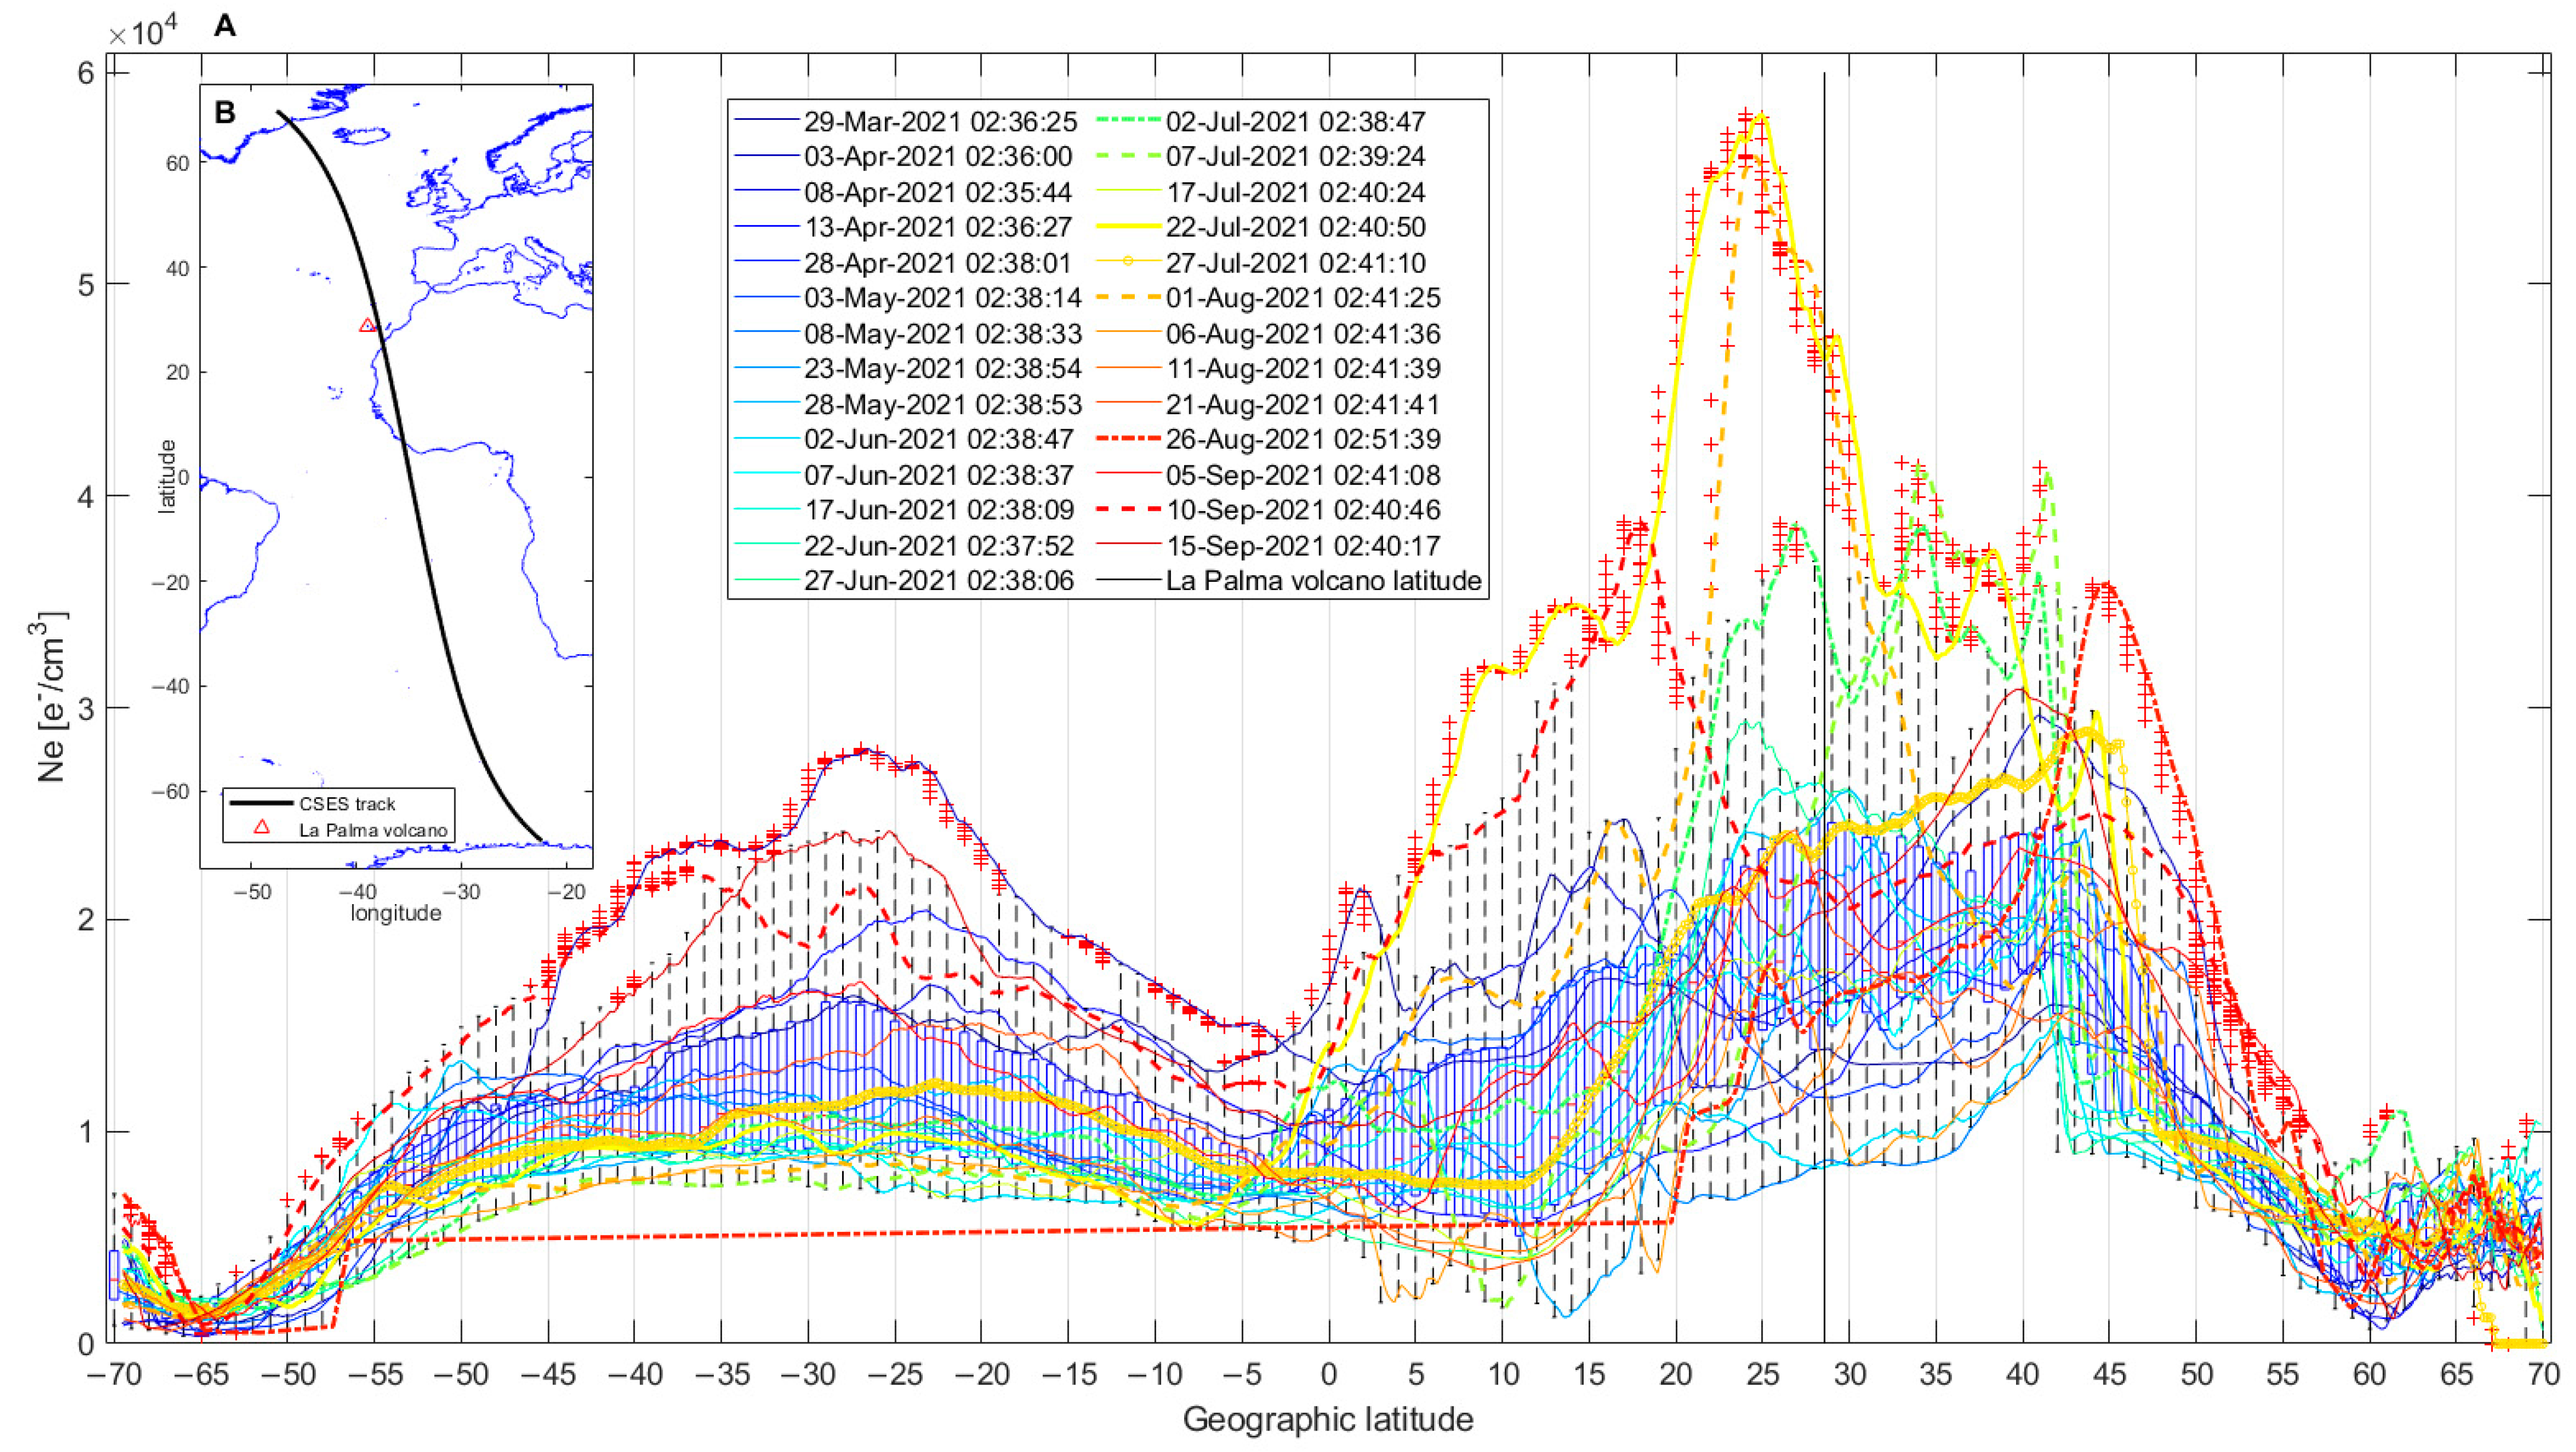
Considering that the CSES satellite every five days passes in exactly the same orbit, here we analysed the orbit more closely to La Palma volcano for night-time measurements that are less affected by variation of solar activity. All such Ne latitudinal profiles are superposed in Figure 23. Every 1° latitude, the interquartile and eventual outliers were computed and denoted by red crosses. It is evident that two passes show a very high value of night-time electron density just southward of the La Palma volcano latitude (denoted by a vertical black line). They were acquired on 22 July 2021 and 1 August 2021. On 22 July 2021, the Auroral Electrojet (AE) index showed a very high geomagnetic activity at poles with a value that even overpassed 1000 nT. Despite this, the passage of CSES-01 above La Palma volcano was before the AE values reached such a high value, even if not completely calm. Despite this, from the comparison provided in Appendix C with the TEC map of the same day, the anomaly depicted by CSES-01 is confirmed with TEC from GNSS stations, but it seems to be a global phenomenon. Consequently, it is less probable that the source of the anomaly was the volcano. A completely different scenario was for 1 August 2021; in fact, the AE index presented low values for the whole day. Furthermore, the TEC map shown in Appendix C of the following day identifies a local anomaly above the region of La Palma volcano; this provides more chances that the Ne increase depicted by CSES-01 on 1 August was a local phenomenon that may be linked to the preparation of the volcano eruption. It is noteworthy that the Swarm satellite on 26 July and 2 August 2021 detected some magnetic anomalies, as reported in Supplementary Materials File S2. This further confirms the reliability of CSES-01 data and underlines the ionosphere’s perturbed status in such time. Outliers close to La Palma volcano latitude were also observed on 2 July 2021. Even if less intense than the previous track, the latitude of the peak is the closest to the volcano among all the anomalous tracks, so we consider it a strong indication of possible relation with the volcano activity. Another peak was recorded on 10 September 2021, but its distance (more than 10°) seems quite unrealistic to be due to the pre-eruption volcano processes. The same is for 26 August 2021, which showed a high anomalous value at 45° North, which is too far and probably due to some auroral activity, even if geomagnetic conditions were quiet.
Appendix C compares the CSES-01 Ne with TEC data for the tracks that show some outliers around the La Palma volcano in Figure 23. The first key point is that the CSES-01 Ne ionospheric structures are in agreement with the one depicted by TEC obtained from the GNSS ground station. This confirms the scientific reliability and good quality of CSES-01 Ne data. In Figure 24, we provided an analysis based only on TEC data, processed and normalized, as explained in Section 2.3.2. In particular, the normalized TEC from 23 March 2021 until 19 September 2021 was compared with historical values, searching if it overpasses the two standard deviations threshold. The disturbed days (|Dst| > 20 nT and/or ap > 10 nT) were depicted by transparent red boxes, and the geomagnetic indexes time series are also reported in panel B. The geomagnetic index trend and disturbed times are in agreement with the high solar activity identified in Figure 4. Finally, the anomalous values occurred during 21–26 July 2021, 27 August 2021 (even if before and after geomagnetic conditions were perturbed), and 12 and 15 September, i.e., a few days before the volcano eruption. These days coincide with the CO anomalies and could be another indication of the alterations of the geo-layers in preparation for the eruption, even if future studies are necessary to demonstrate the bottom-up propagation effects proposed here as a possible reading of the identified anomalies.
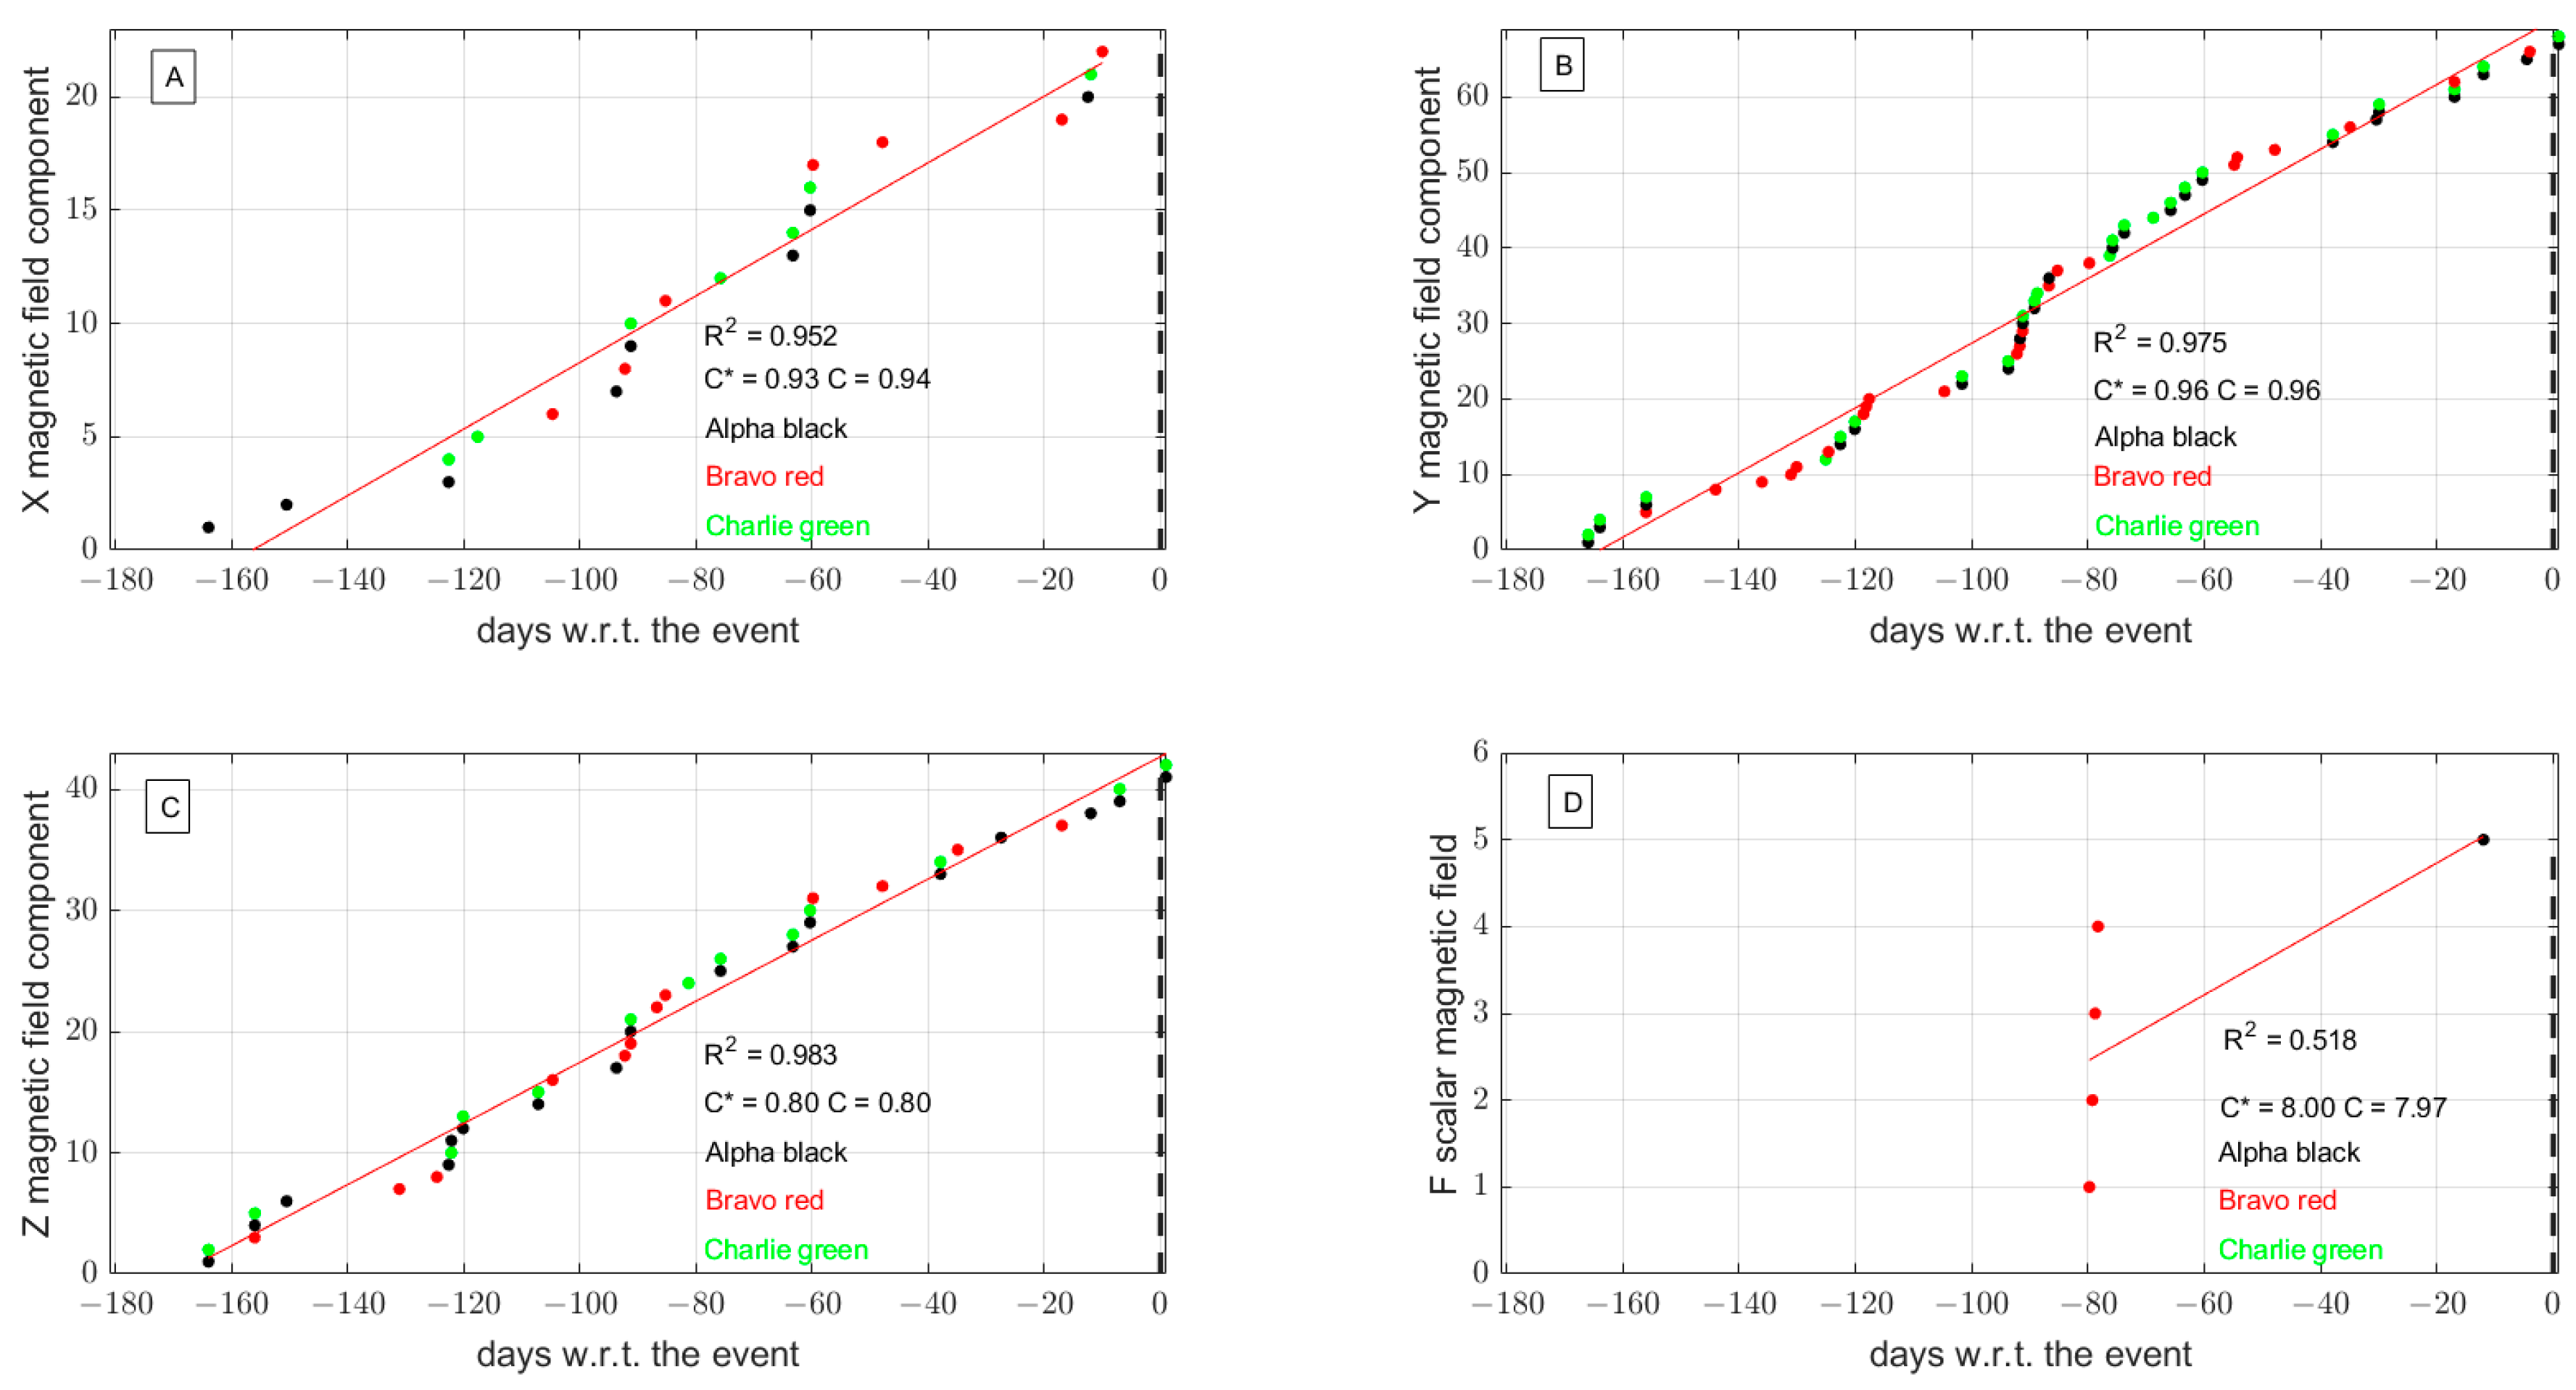
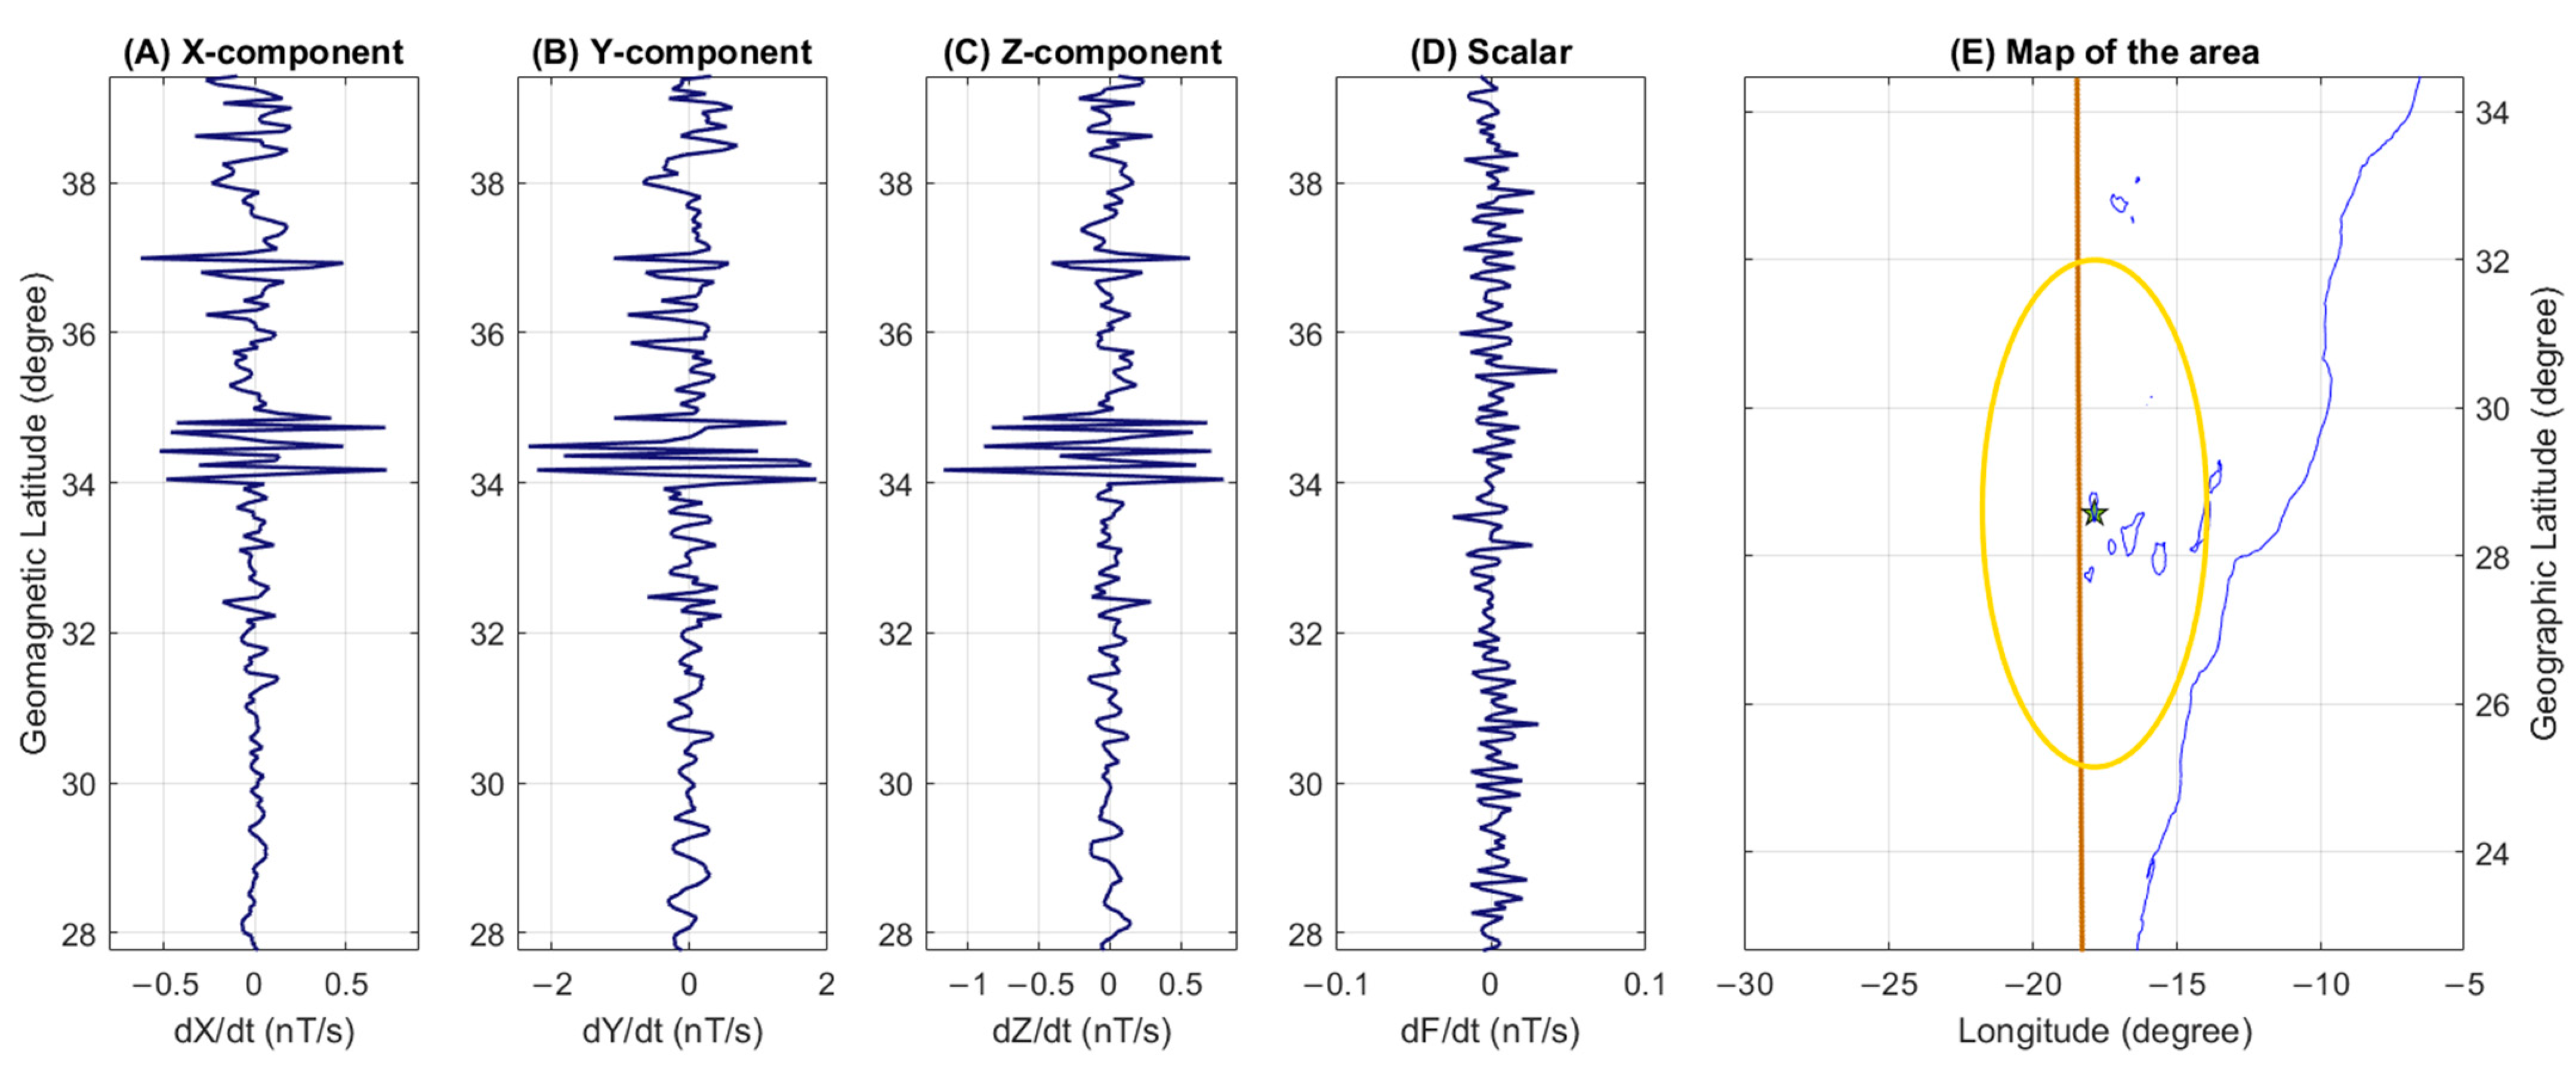
Swarm magnetic data were systematically analysed considering a circular area containing the whole volcanic area of the Canarias Islands with a radius of 420 km. Some details of the data processing are provided in Appendix B. The cumulative number of anomalous tracks in the function of time is shown in Figure 25. In Supplementary Materials File S2, all the tracks that present one or more anomalies are shown. All three geomagnetic field components show some increase of anomalies (see Figure 25), i.e., an acceleration of the trend at about three months before the eruption (−90 days). Despite this, the Y-East component is more evident; in fact, no other similar behaviours are depicted in such a period as the rest of the trend is quite linear, as also pointed out by the very close to 1 R2 coefficient of determination. For example, such a characteristic is confirmed by looking at the single-track residuals in Figure 26. In fact, the peak–peak maximum perturbation of the Y-East component is about 4 nT/s while the X-North component is about 1.3 nT/s and the Z-Centre component is about 2 nT/s. The four scalar magnetic field anomalous tracks of Swarm Bravo 80 days before the eruption (i.e., 1 July 2021) are due to an issue on the mission pointed out by ESA in the operational mission news (https://earth.esa.int/eogateway/news/swarm-bravo-scalar-magnetic-field-data-unavailable-from-1-to-4-july-2021, accessed on 26 July 2022) of the mission. Therefore, they need to be disregarded for this study as they are not due to a geophysical phenomenon but due to post-processing of the satellite data.

4. Discussion

4.1. Source of the High Amount of SO2 Detected in 1991

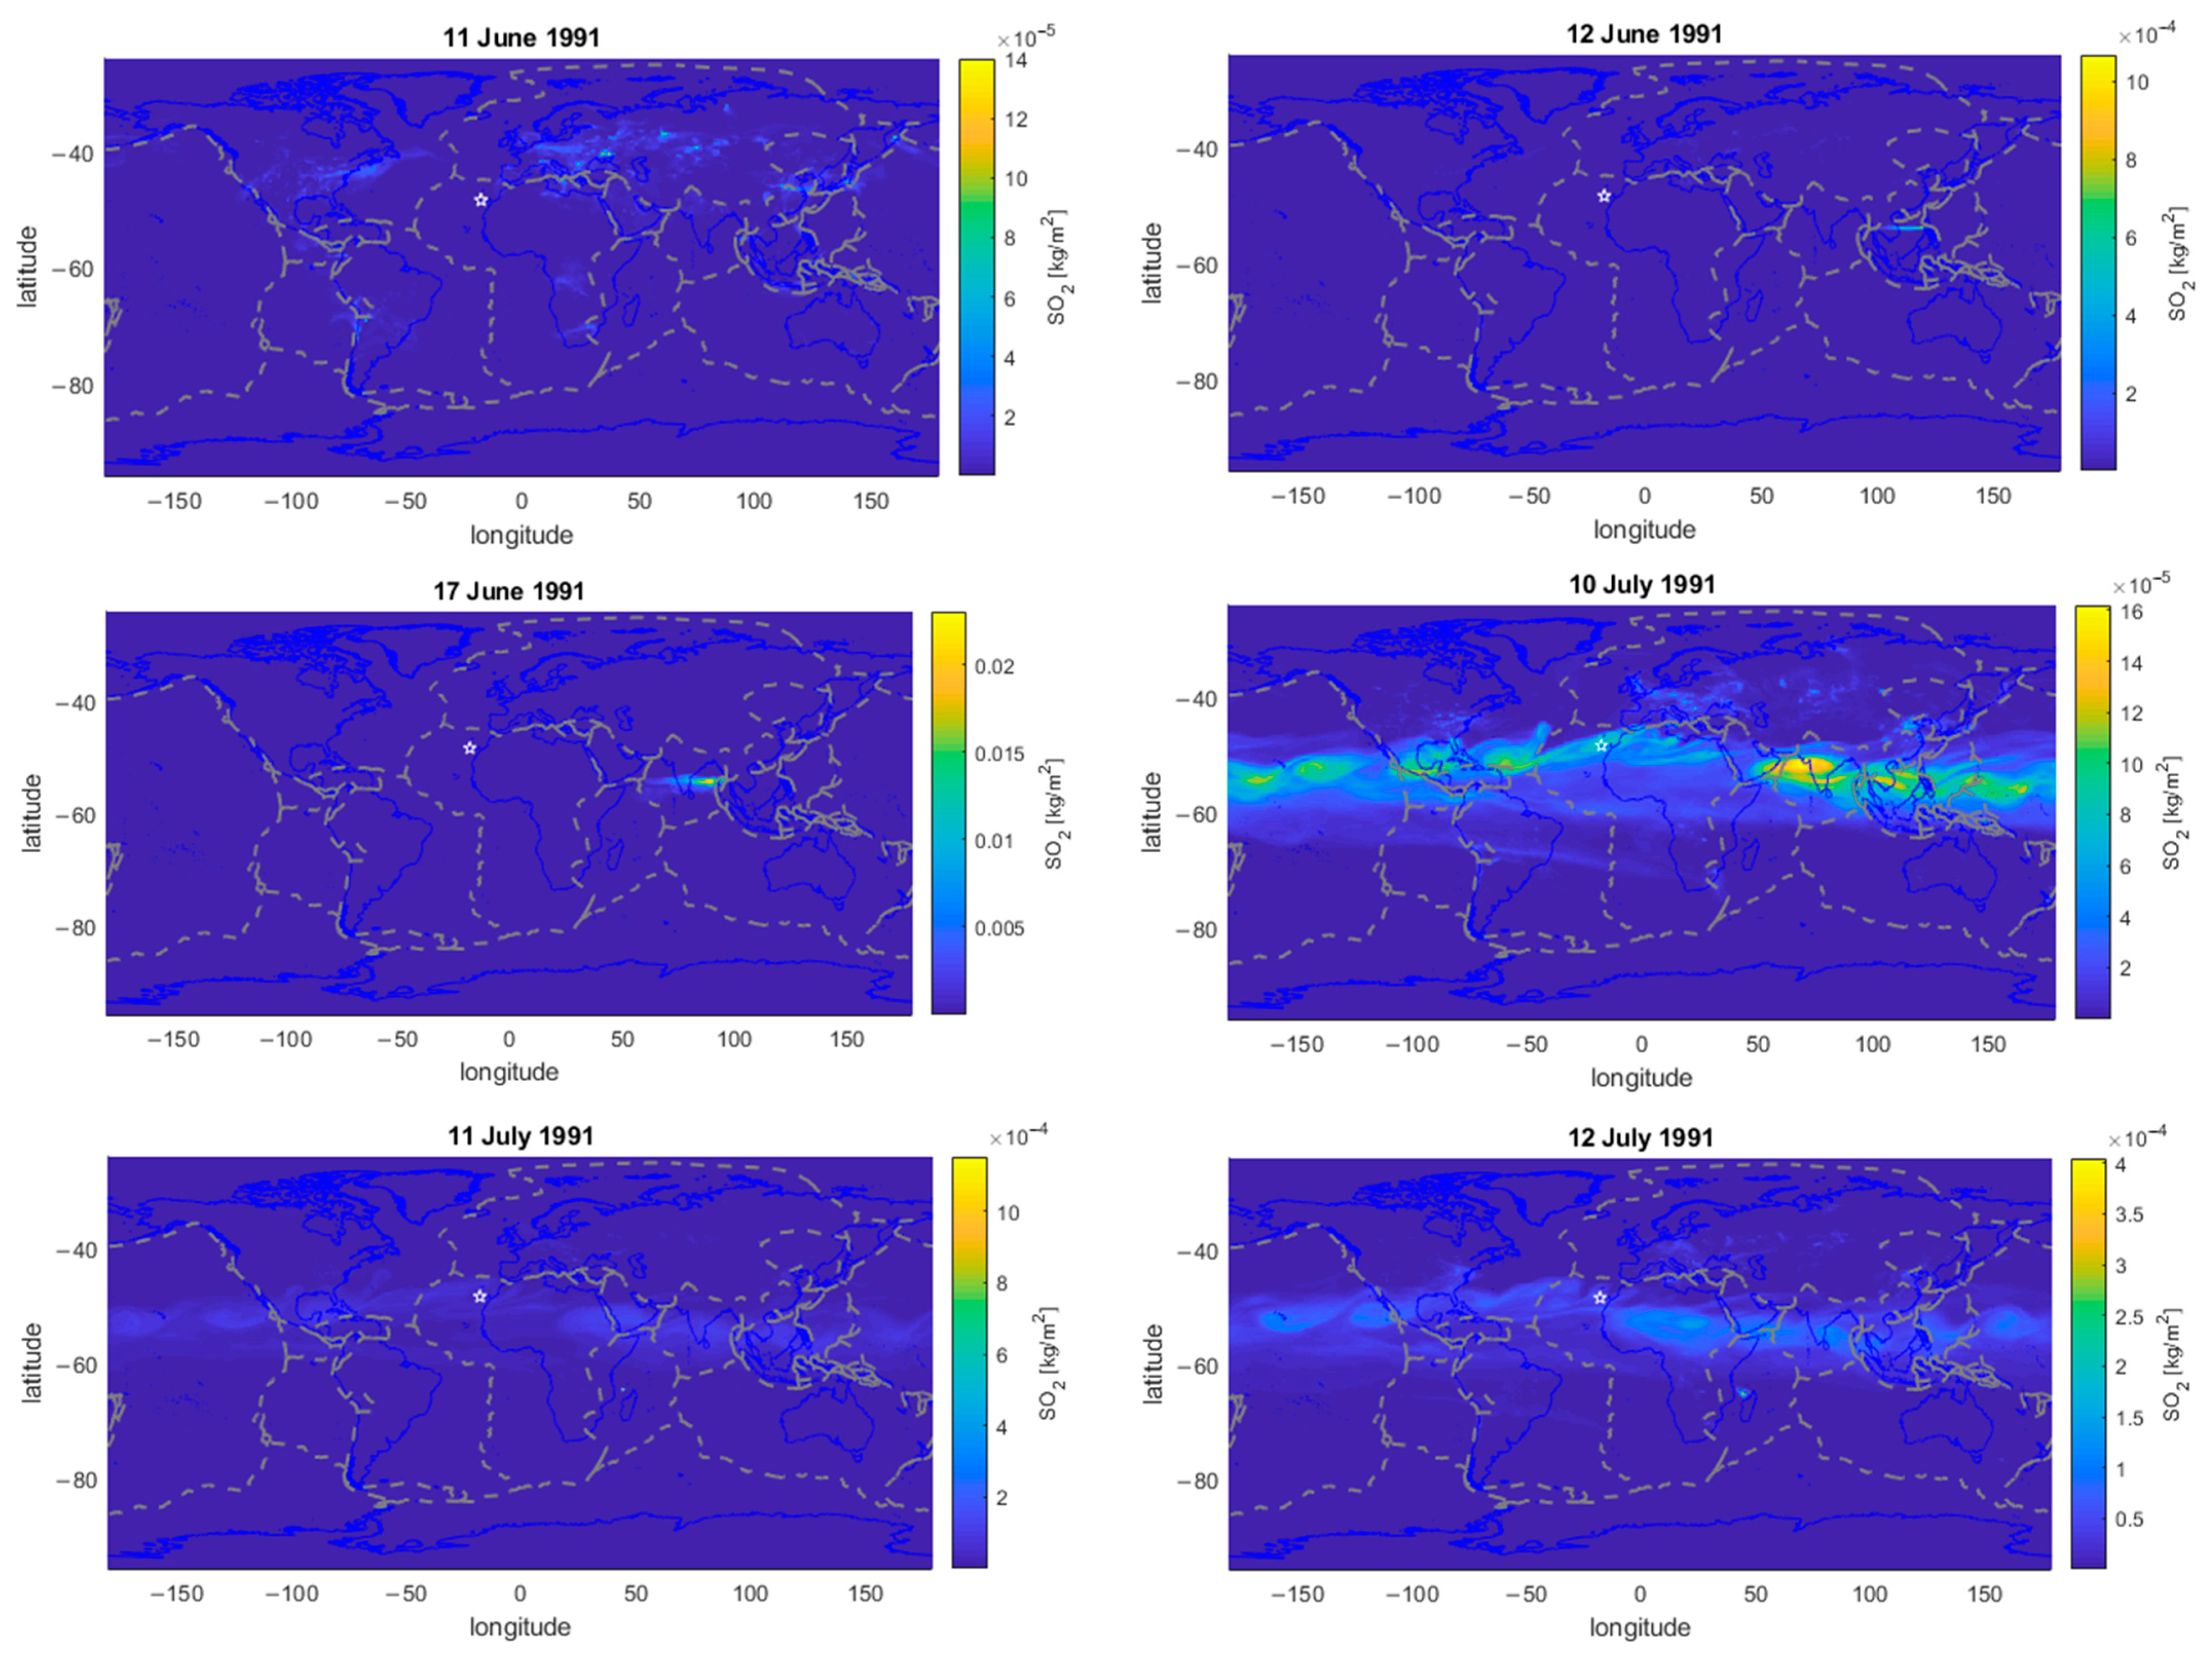
It is surprising to note that in 1991 the value of SO2 showed a clear peak more intense than all the other 40 years, as is visible in Figure 19. The first interpretation of this behaviour would be an emission from La Palma or other Canarias-volcano systems in the atmosphere. Still, there are no reports of eruptions or emissions in this area for that year. To search for the source of this particularly high peak of SO2, we plotted the worldwide distribution maps of SO2 in Figure 27. Here we reported only six representative days, but in online Supplementary Materials, it is possible to reproduce an animated gif with all the days from 1st June until 31 July 1991. We clearly immediately noted that the whole equatorial region is affected by the SO2 plume covering the entire Earth’s circumference at the equator. Backtracking the origin of such a large emission of SO2 in the atmosphere, we found that it was due to a vast and violent explosion one month prior of the Pinatubo volcano. In fact, on 11 June 1991, the distribution of SO2 can be considered “standard” with a maximum value of about 1.4 10−4 kg/m2 (as seen from the maximum of the colour bar). The distribution is also above several regions of the world, probably due to natural and human sources. On the day after, i.e., 12 June 1991, the maximum value increased by about one order of magnitude, reaching 10−3 kg/m2. This is clearly above the Pinatubo volcano, which had an eruption estimated of Volcano Explosive Index VEI = 6 in June 1991 [85,86]. In the following weeks, the SO2 plume was transported by the winds and slowly diluted in all the equatorial regions, as visible from the picture in Figure 27 and in the animated gif in Supplementary Materials. Our findings are in agreement with the global effects induced by the Pinatubo 1991 explosion reported by Bluth et al. [87].

4.2. Lithosphere, Atmosphere, and Ionosphere Bottom-Up Interactions in the Six Months Preceding the 19 September 2021 La Palma Volcano Eruption

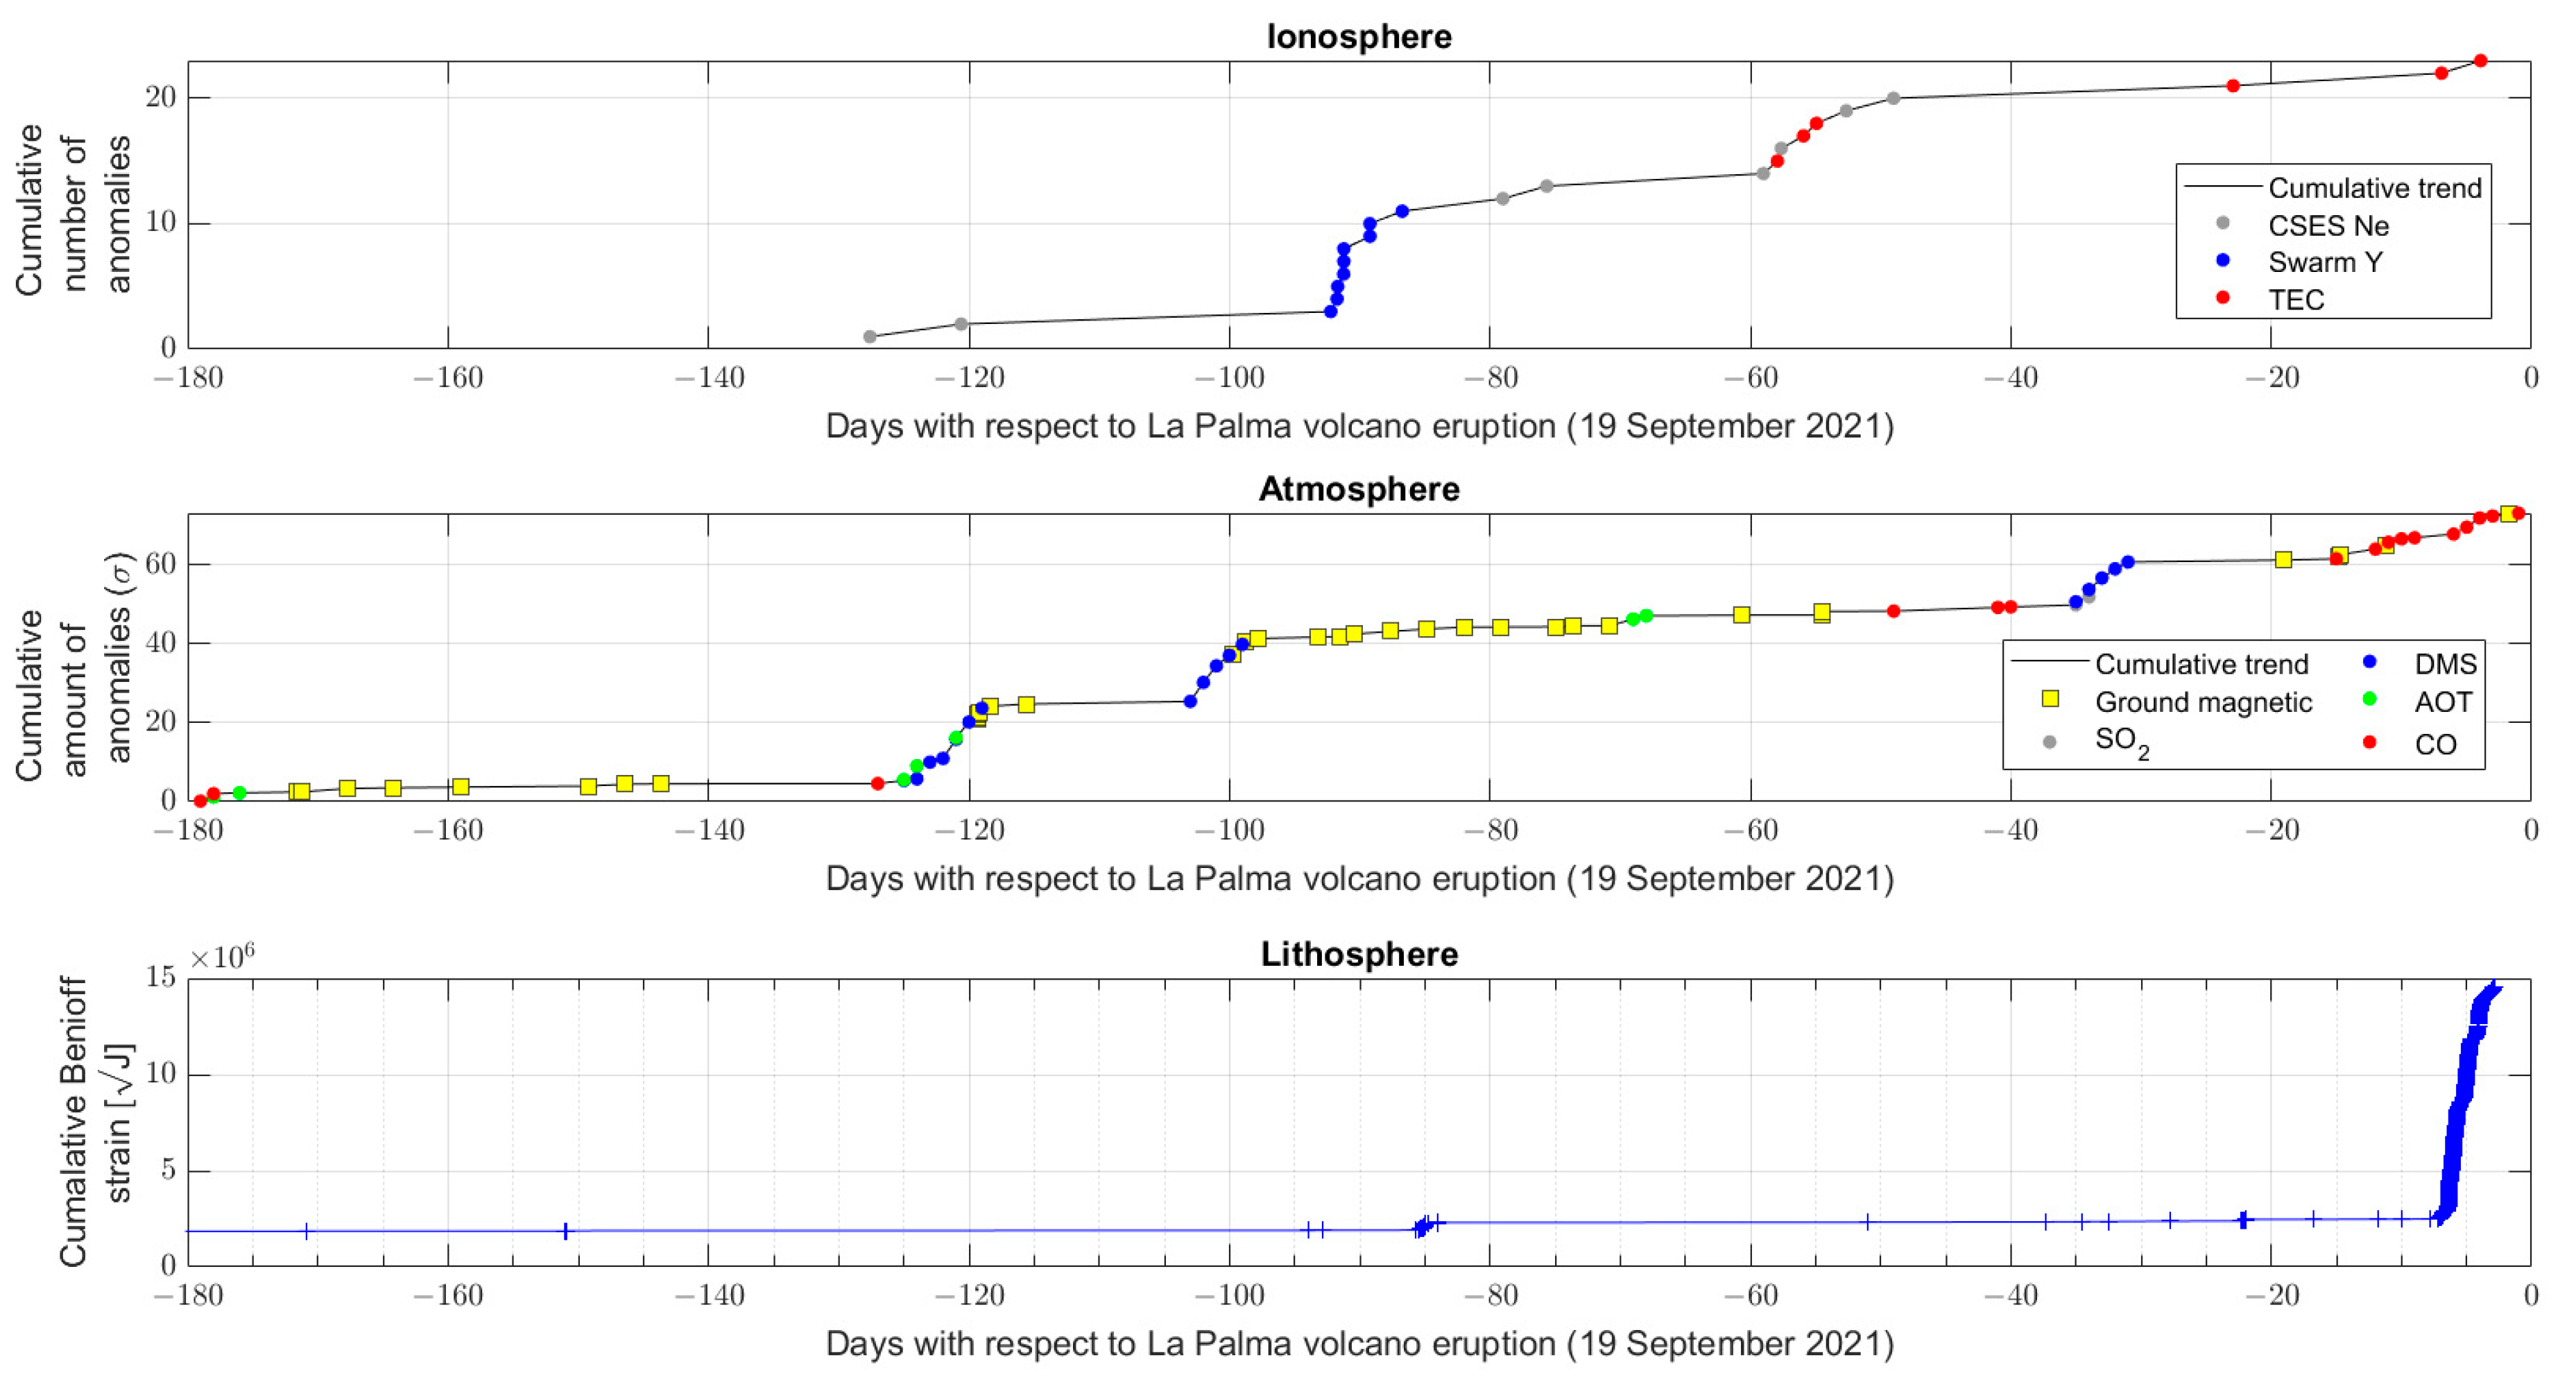
In the following Figure 28, we provided a common view of the identified anomalies in the lithosphere, atmosphere, and ionosphere during the six months before the eruption of “La Palma” volcano on 19 September 2021. Considering that not all the identified anomalies are related to the La Palma volcanic activity, we excluded the anomalies in this section that are unlikely to be related to such an event. However, we still kept the one with a doubt source. For this purpose, we resumed all the identified anomalous days in Table 1, also providing the amount of exceedance of the threshold in terms of sigma and a comment for each group of anomalies based mainly on the visual investigation of the corresponding parameter maps.
A common vision of the three geo-layers, as presented in Figure 28, is essential to search for possible interactions between them. In this work, we search for possible effects from the lithosphere to the ionosphere (bottom-up effects) even if the opposite effect (top-down) is also possible, for example, in the case of the impact of solar pulsation on Earth’s environment like Pi2 [88]. Still, they are out of the scope of this paper. We noted that the atmospheric anomalies identified between −130 and −120 of CO, AOT, and DMS correspond to two anomalous days in terms of high electron density observed by CSES in the ionosphere. Furthermore, the significant increase in the atmospheric trend (dominated by DMS anomalies) at −100 days is followed at about −90 days by a particular magnetic activity detected by Swarm satellite in the ionosphere, with concomitance anomalies from GUI ground geomagnetic observatory that could correspond to the migration of the disturbance from the atmosphere to the ionosphere. A delay of one week is in agreement with previous studies. It can be explainable only by a mix of mechanical and chemical processes in the atmosphere that slowly migrates to the ionosphere, such as the model proposed by Pulinets and Ouzounov [2] or the one illustrated in Figure 2A.
Another possible fluctuation of the ionosphere with simultaneous variations in the atmosphere was detected by an increase in night- and day-time of CSES-01 electron density compatible with the TEC map, between −80 and −40 days with respect to the eruption, together with high values of aerosol and CO in the atmosphere.
It is outstanding to note that from about 40 days before the eruption, there are several recordings of seismic events and anomalies of CO and DMS in the atmosphere and even TEC in the ionosphere. In this case, we suppose that the uplift of magma could have produced some degassing depicted by the atmospheric anomalies. Finally, the last uplift produced significant cracks in the upper crust, highlighted by the very high seismicity in the last days before the eruption, a clear pre-eruption process. Despite this, other explanations of atmospheric and ionospheric anomalies are still possible. For example, they could be due to atmospheric weather perturbations or external solar disturbances, even if the solar condition has been checked and reported quiet. Therefore, the bottom-up lithosphere–atmosphere–ionosphere propagation effect of the identified anomalies is one of the possible interpretations of the phenomena. Future studies need to demonstrate the interaction mechanism between the geo-layers, excluding other possible explanations and sources.

4.3. Comparison with Other Works and Longer Term Preparation Effects of the Eruption of 19 September 2021

Torres-Gonzales et al. [89] identified an increase of seismicity and degassing some years before this eruption, i.e., in October 2017 and February 2018, revealing that the preparation for the eruption of September 2021 had a long preparation even some years before. For this purpose, we investigated the atmospheric time series from 1980 until the “La Palma” eruption in 2021. Among the several parameters, the most interesting seems to be the CO that is represented in Figure 20; in fact, it shows in half of 2010 (first peak on 25 June 2010), particularly anomalies never seen in the 30 years before, which continued to sparsely appear until the first months of 2020. Additionally, the other atmospheric parameters show some anomalous activity in these 11 years, but it is not unique, as they also showed some previous activity. The CO could be linked to the magma flow in the mantle [90], i.e., the anomalous CO emission in 2010, 2012–2013, 2016, and 2020 could suggest some activity in the mantle that brought toward the eruption. Parts of this anomaly could be due to the El Hierro volcano eruption of 10 October 2011, a very close volcano in the same archipelagos. Despite this, a previous study about El Hierro 2011 volcano eruption by Lópes et al. [26] identified the unrest of such a volcano starting in July 2011. Therefore, the start of the CO anomalies we depicted in this paper is still before, but we cannot discriminate which volcano eventually could be related to such phenomena. They could likely be considered a proxy of the whole volcanic archipelagos instead of a specific volcano. Finally, the 2010 CO anomalies, together with the soil deformation and deep (~25 km) seismicity reported by Fernández et al. [91], could be further evidence of the unrest of the magma in 2009–2010, which they claimed.
From this paper, the acceleration of the seismicity started 10 days before the 2021 eruption (see Figure 7C), is very evident, and underlines the magma uplift before the same eruption. Furthermore, it is compatible with GNSS measurements on the ground and deformation estimated from radar satellite by DInSAR (Differential Interferometric Synthetic Aperture Radar) technique by De Luca et al. [27], as they reported in their Figure 3I–L.
Our temporal result suggests a process that started from a depth of about 40 km, i.e., mantle depth, in November 2020 that gradually filled a deeper chamber at about 30 km, also identified by Klügel [74]. Then, only in the last days did the magma raise toward “La Cumbre Vieja” vent, in agreement with the geochemical investigation of the erupted magma conducted by Pankhurst et al. [92] that identified the erupted magma as originating from the melting of the mantle.

4.4. Investigation of the Possible Direction of Propagation of the Electromagnetic Waves by Calculating the Pointing Vector

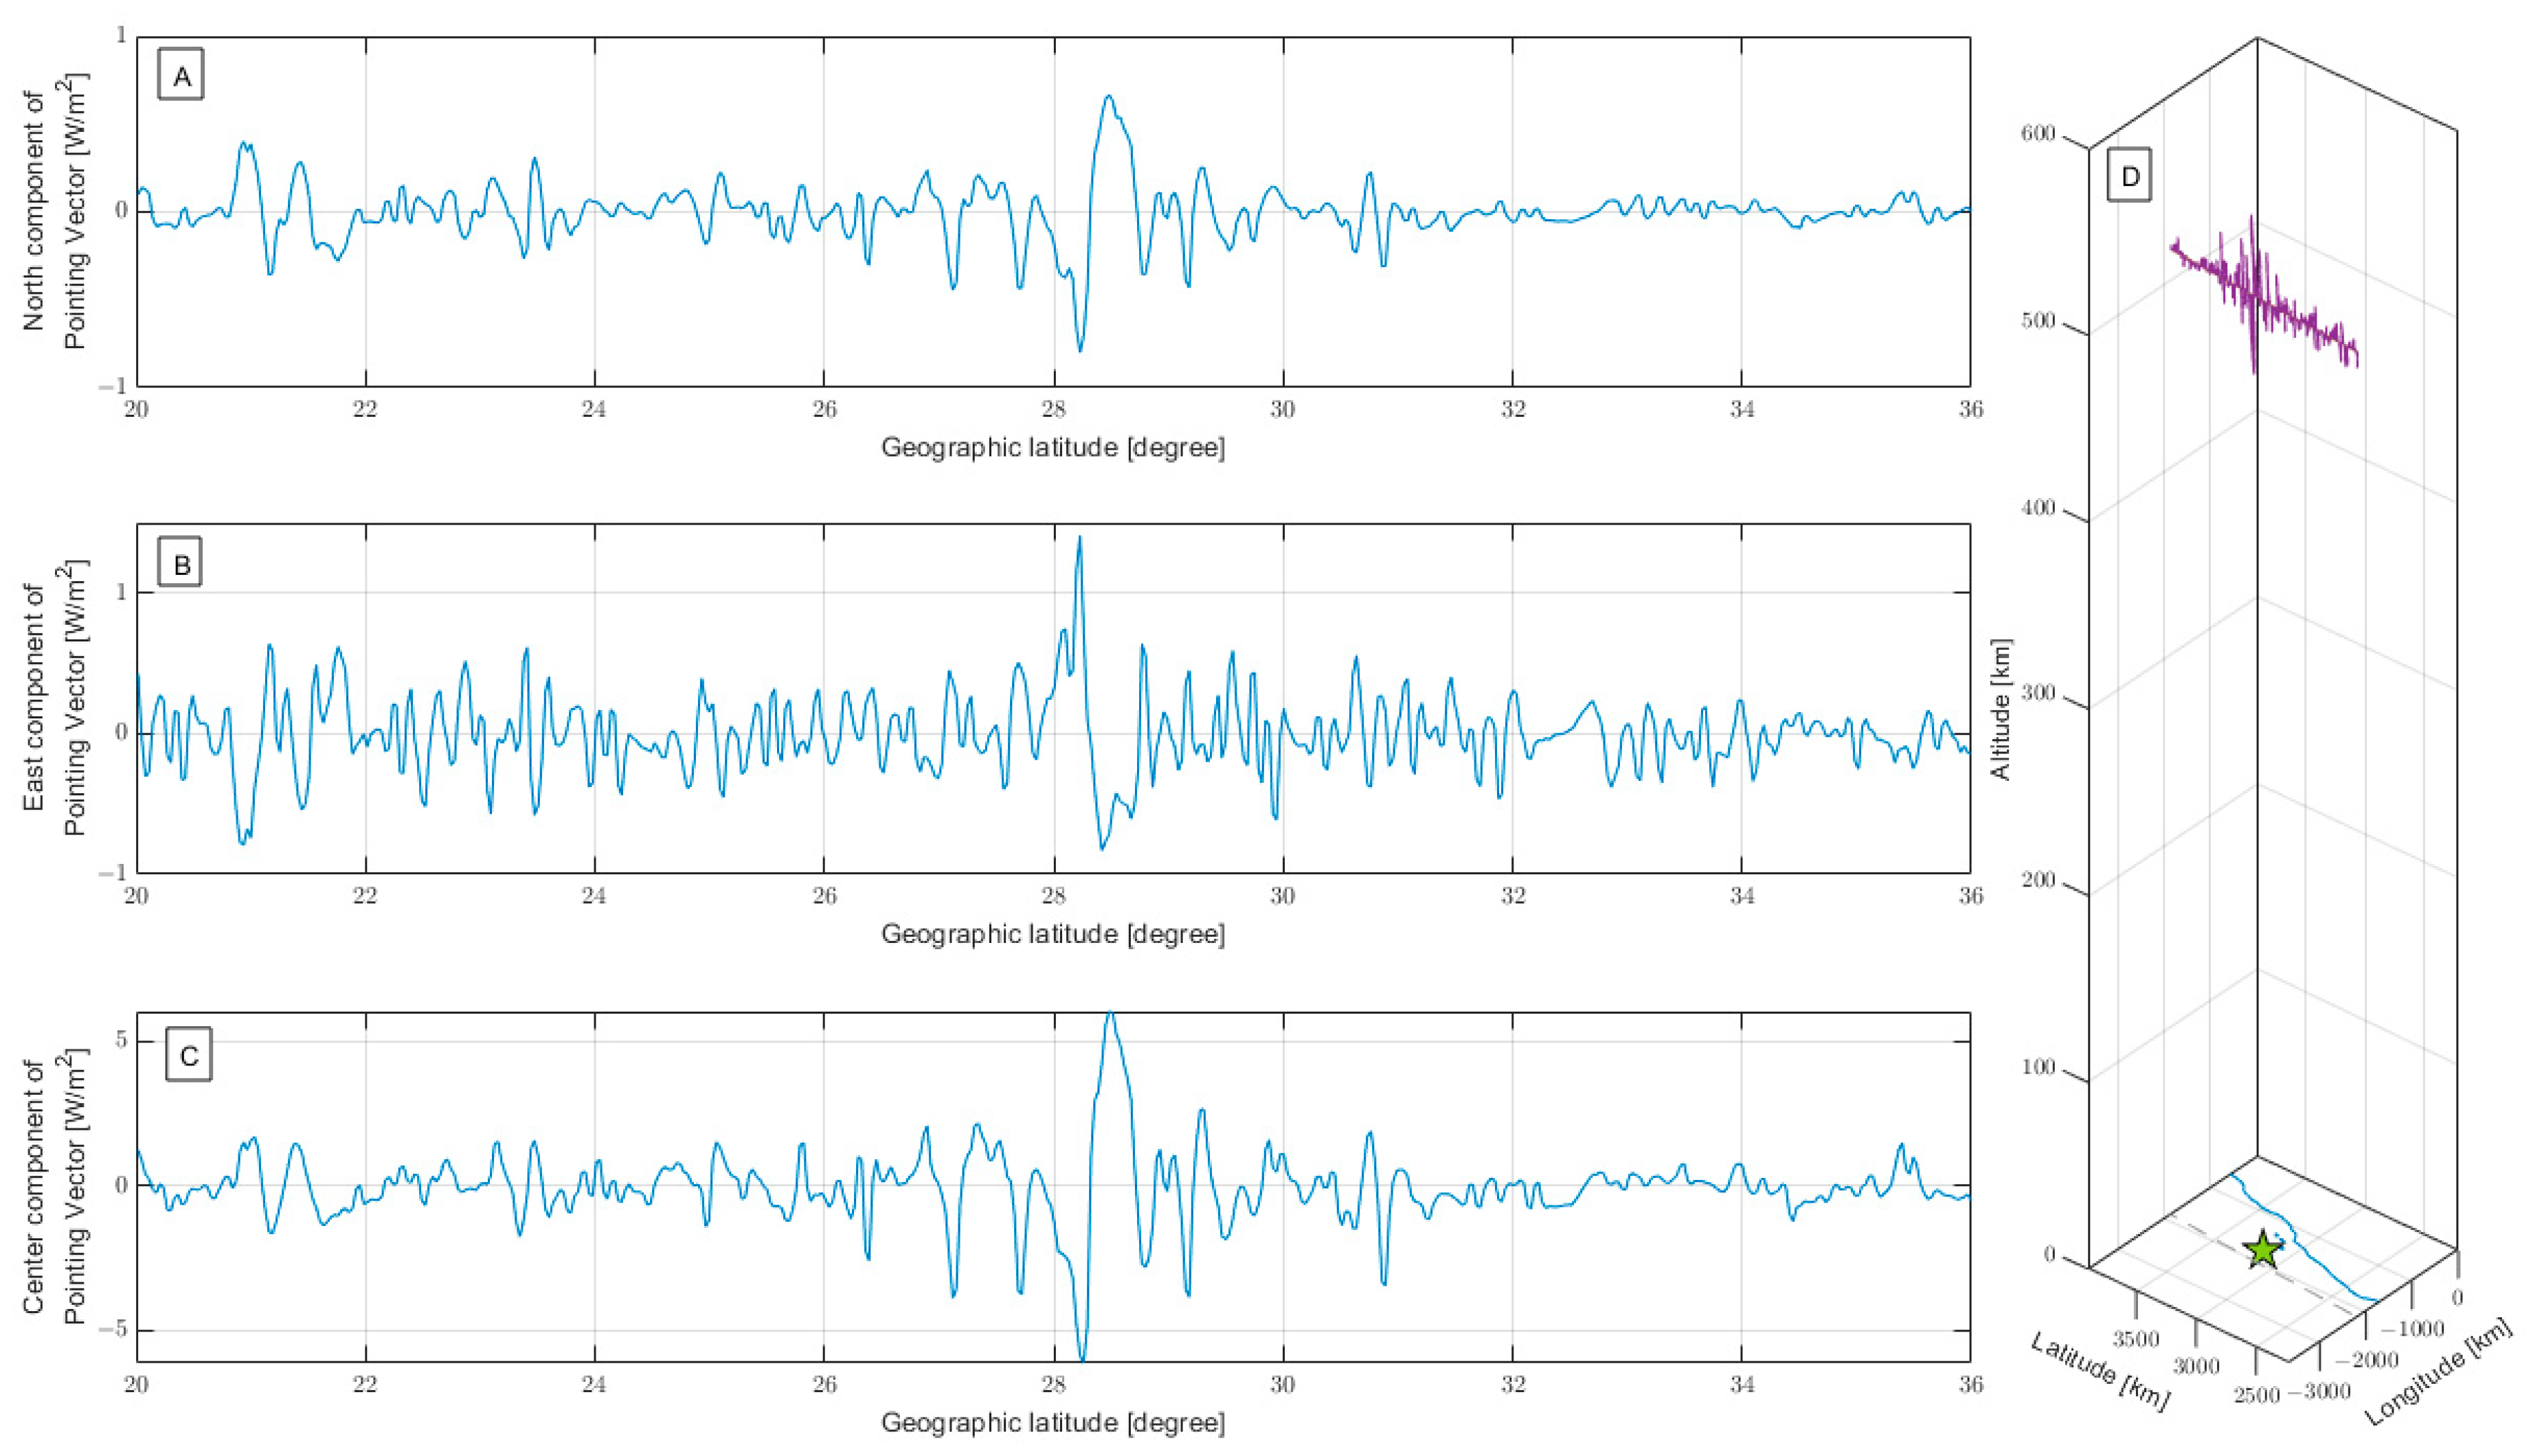
In order to confirm whether the detected ionospheric anomalies were produced by an electromagnetic wave propagating from bottom to top in the hypothesis of an electromagnetic propagation mechanism (Figure 2B), the pointing vector can help to provide an answer. The details of how the vector has been estimated are provided in Appendix E.
In Figure 29 and Figure 30, two examples applied to Swarm tracks above La Palma volcano are provided. The first one is selected in the period that has statistically been identified as an acceleration in the cumulative trend of the magnetic Y-East anomalies (see Figure 25), while the second one is more than one month after. In particular, the Swarm Alpha track, 10–17 June 2021 (Figure 29), identified a decrease of centre component relatively close to “La Palma” volcano, suggesting an outgoing (upward) electromagnetic wave as visible from the 3D reconstruction with a dominant upward direction. On the other hand, in the Swarm Bravo track 6, acquired on 26 July 2021, shown in Figure 30, there is not a clear indication of upward or downward direction. This could be due to a different physical mechanism that produced such an anomaly, for example, a plasma bubble, as simulated by Kuo et al. [64]. In fact, electron density on 26 July 2021 presented particular anomalous values as reported in Figure 23, even if a “contamination” from the high auroral activity recorded on this day cannot be totally excluded. Finally, these examples confirmed the statistical results about the increase of anomalies in June 2021, 3 months before the eruption, supporting the hypothesis that perhaps some of the magnetic anomalies in this period could have been produced by the preparation of “La Palma” volcano eruption of 19 September 2021. Further analyses of ion drift and pointing vectors in future studies are required to improve the anomaly detection, investigation of the source, and discrimination between the several physical mechanisms that ionospheric disturbances could originate from.

5. Conclusions

This paper analysed the lithosphere, atmosphere, and ionosphere, and their possible interactions before the La Palma Cumbre Vieja 19 September 2021 VEI = 3 volcano eruption.
We identified a migration of the seismicity from the deepest sources at about 40 km to superficial seismicity, which follows a temporal order, strongly suggesting a magma migration from about October 2020 that gradually fills a probable deep magma reservoir identified by a gap of seismicity between 13 km and 20 km depth that could coincide with the one already identified by Torres-Gonzáles [89], which was completely filled in February 2021. In the 10 days before the eruption on 19 September 2021, the magma uplifted in the magmatic volcano chamber was located at less than 5 km depth, which can be seen as another seismicity gap already described by Fernández et al. [91].
We identified several atmospheric and ionospheric anomalies from CSES-01 and Swarm satellites from 130 days to 90 days before the eruption, suggesting a bottom-up interaction between the two layers, even if other explanations are possible or the disturbances could be even independent. About two months before the eruption, electron density profiles depicted an anomalous electron density peak close to the volcano (confirmed by TEC maps). At a similar time, minor seismicity was recorded.
A final increase of carbon monoxide started about 1.5 months before the eruption suggesting CO as a strong proxy of the magma’s uplifting, i.e., the explosion’s preparation. In particular, CO mean value was always above the historical mean in the last month, and a final strong acceleration of seismicity in the last 10 days clearly preceded the event. At the same time, the TEC also shows anomalies from 2 months before the eruption with synchronicity with the release of CO and the seismicity acceleration. This could suggest an interaction between the geo-layers even if it cannot demonstrate that the synchronicity was a cause–effect relationship, or that it occurred only by chance.
This research not only confirmed previous investigations of pre-eruptive activity of La Palma volcano that investigated seismicity, CO2 and helium, and land deformation from radar satellites [89,91], but it is also complementary in terms of other investigated parameters and new lithospheric activity discovered from this study helping to understand the complex possible mantle–lithosphere–atmosphere–ionosphere interactions. Future studies need to provide more substantial proof of such interactions between lithosphere atmosphere and ionosphere as in the present study; the interactions are proposed as our best interpretation of the results. Still, we cannot exclude other interpretations or sources of the identified anomalies.
Such a study underlines how crucial global monitoring of geophysical hazards such as volcano and earthquakes is, with a wide network of sensors on the ground and satellites. Their integration not only permits better understanding of the nature of our planet, but also could potentially help in the future to predict dangerous events, contributing to saving human life and reducing economic losses.

Supplementary Materials

The following supporting information can be downloaded at: https://www.mdpi.com/article/10.3390/rs14195001/s1, Supplementary Materials File S1with additional figures (Figure S1: Geomagnetic ground observatory X—North component; Figure S2: Correlation coefficients of Geomagnetic ground observatories; Figure S3: Cumulative graphs for geomagnetic ground observatories; Figure S4: DMS and aerosol maps on the day of the eruption; Figure S5: SO2 long time series after removing seasonal trend; Figure S6: DMS long time series after removing seasonal trend; Figure S7: Aerosol long time series after removing seasonal trend). Supplementary Materials File S2 with the Swarm magnetic residuals for all the identified anomalies reported in Figure 25 is also provided. Animated GIF of the SO2 propagation from Pinatubo 1991 volcano explosion all over the equatorial places composed by daily worldwide pictures of SO2 at 23 UT in June and July 1991.

Author Contributions

Conceptualisation, methodology, software, formal analysis, visualisation, writing—original draft preparation, D.M.; investigation D.M. and H.Z.; data curation, D.M., R.Y., Z.Z. and X.S.; resources, K.Z.; writing—review and editing, D.M., K.Z., H.Z., W.C., Y.C., X.H., T.W., J.W., D.Z. and Y.Z.; supervision, K.Z.; project administration, K.Z.; funding acquisition, K.Z. and D.M. All authors have read and agreed to the published version of the manuscript.

Funding

This research was funded by the National Natural Science Foundation of China, grant number 41974084; the China Postdoctoral Science Foundation, grant number 2021M691190; the International Cooperation Project of the Department of Science and Technology of Jilin Province, grant number 20200801036GH; and the Italian Ministry of University and Research, grant number D53J19000170001 (Pianeta Dinamico—Working Earth). The APC has been funded by China Postdoctoral Science Foundation, grant number 2021M691190.

Institutional Review Board Statement

Not applicable.

Informed Consent Statement

Not applicable.

Data Availability Statement

Seismic data are freely available from “Instituto Geográfico Nacional” of Spain on their web portal (https://www.ign.es/web/ign/portal/sis-area-sismicidad last access 19 July 2022). MERRA-2 data can be downloaded from https://disc.gsfc.nasa.gov/datasets?project=MERRA-2 (last access on 23 July 2022) with Earth Observation NASA free credential. Swarm data are freely available via ftp and http at swarm-diss.eo.esa.int server (last access on 27 July 2022). China Seismo Electromagnetic Satellite data are freely available at www.leos.ac.cn (last access on 15 December 2020) upon registration and approval. Some results presented in this paper rely on the data collected at “Guimar” (GUI) and “Tamanrasset” (TAM). We thank “Instituto Geografico Nacional (IGNS)”, “Institut de Physique du Globe de Paris (IPGP)” and “Centre de Recherche en Astronomie, Astrophysique et Geophysique (CRAAG)”, for supporting its operation and INTERMAGNET for promoting high standards of magnetic observatory practice (www.intermagnet.org, last access on 12 September 2022).

Acknowledgments

We would acknowledge Guido Ventura for his suggestions and help and Alessandro Piscini, Francisco Javier Pavón-Carrasco, Saioa Arquero Campuzano, Maurizio Soldani and Angelo De Santis for their contributions in the preparation, writing and optimisation of some codes re-used in this work originally developed for some of the cited papers.

Conflicts of Interest

The authors declare no conflict of interest. The funders had no role in the design of the study; in the collection, analyses, or interpretation of data; in the writing of the manuscript; or in the decision to publish the results.

Appendix A. Detailed Description of CSES Electron Density Data Processing
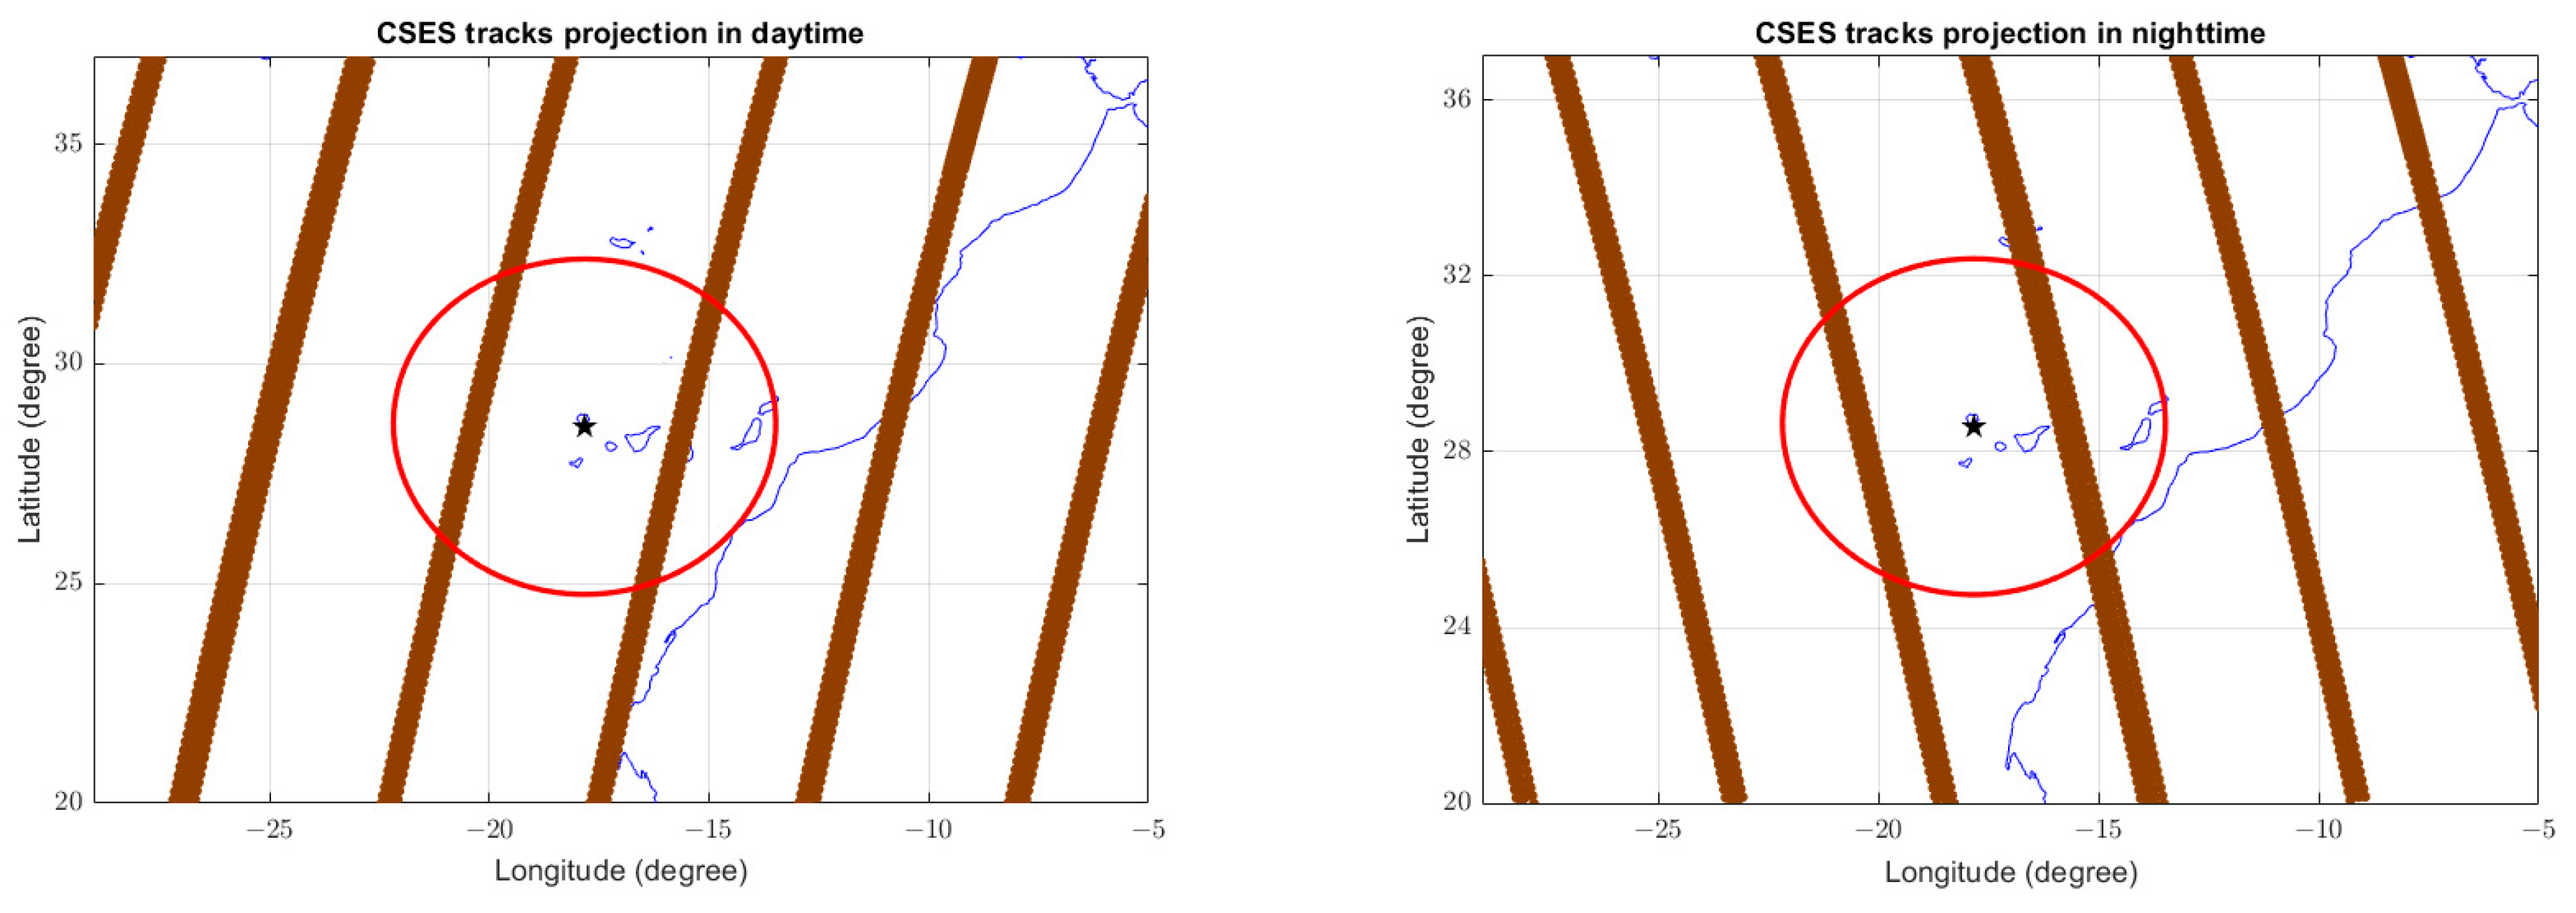
In this appendix, we describe the CSES electron density data analysis in detail. The first step is the extraction of all the data acquired by the CSES-01 satellite in quiet geomagnetic conditions (|Dst| ≤ 20 nT and ap ≤ 10 nT) inside a circle centred on the volcano and with a radius of 420 km (see Figure A1). Such a radius has been selected, taking into account the extension of La Canarias caldera volcano system, and also that a too-small area is not appropriate due to the altitude of the satellite (about 510 km above sea level).
Figure A1. CSES-01 track projection (brown lines) in day-time and night-time. The position of “La Palma” volcano is represented by a black star. The investigated area is limited by the red circle.
Remotesensing 14 05001 g0a1
A first time-series of CSES Ne was obtained with the daily median of the data collected inside the research area for day-time or night-time, which was analysed separately. The median has been selected instead of the mean, as it is less affected by eventual spikes in the original data. Figure A2 shows such time series for night-time, as well as Figure A3 for day-time. Due to the standard seasonal variation of the ionosphere, the obtained time series are affected by seasonal trends [93]. In order to detrend the time series from the seasonal trend, a polynomial curve has been fitted to the data. The order of the polynomial has been selected as 5 for night-time and 7 for day-time. The reason for a different selection is due to the more complex structure of the ionosphere during day-time for the direct input of the solar irradiance that, for example, creates the “fountain” effect of the electron charges that move upward at the geomagnetic equator and downflows Southern and Northern, but only when the Solar irradiation is present (or in the following hours for the inertia of the phenomenon [94]).
Figure A2. CSES-01 Ne night-time series before detrending. The green line is the polynomial curve fitted on the data.
Remotesensing 14 05001 g0a2
Figure A3. CSES-01 Ne day-time series before detrending. The green line is the polynomial curve fitted on the data.
Remotesensing 14 05001 g0a3
The final time series is obtained after polynomial detrending, and it is presented in the result section of the paper. The median and interquartile range are computed on such time-series, defining the threshold to detect eventual anomalies as the median plus 1.5 times the interquartile range corresponds to two standard deviations in case the residuals follow a Gaussian distribution.

Appendix B. Detailed Description of Swarm Magnetic Data Analysis

In this appendix, we describe the Swarm magnetic data analysis and processing in detail. The same procedure is applied to each component of the magnetic field in NEC (North-East-Centre) frame and to the scalar intensity (F) of the Earth Magnetic Field measured by three Swarm satellites (Alpha, Bravo, and Charlie). The raw data used for this analysis is the LR (Low resolution) data from ESA and we show an example of the step-by-step processing in Figure A4 of track 25 of Swarm Bravo acquired on 18 June 2021. This is the one shown in the main text in Figure 26. The figure shows the example of Y-East component of the magnetic field. The algorithm used to process the data is called MASS and was used for the first time to analyse the M7.8 Nepal 2015 earthquake by De Santis et al. [66]. Following that, it has been widely applied to study several earthquakes in the world with a magnitude between 5.5 and 8.3 [4,5,40,67,68,95]. The operation made by the algorithm on the magnetic signal B(t) consists of the following:
  • Estimation of the numerical first order derivative of the original data B ( t ) . This step is done by calculating the differences sample by sample (S) and dividing the result by the time “t” (i.e., the time difference between the two consecutive data):
    d B d t B S B S 1 t S t S 1 = B ( t )
  • In order to remove the further trend from the data, a cubic spline S(t) was fitted on B ( t ) , setting the knock points every 20 samples:
    r e s i d u a l   ( t ) = B ( t ) S ( t )
  • The geomagnetic latitude of each sample was computed considering the position of the magnetic pole provided by the IGRF-13 geomagnetic model [96], and the samples outside the range [−50, +50] of geomagnetic latitude were rejected.
  • The Root Mean Square “RMS” of the whole track is calculated and compared with the root mean square “rms” of a moving window with a length for this work of 2.0° latitude. If
    r m s > k t · R M S
    the window is defined as anomalous. “kt” is a threshold to define the anomalies and, in this work, has been set to 2.5.
  • A track is classified as anomalous if it contains at least one anomalous window whose centre falls inside the research area (a circle of 420 km of radius), and geomagnetic conditions were quiet (|Dst| ≤ 20 nT and ap ≤ 10 nT).
  • The cumulative curve of all the identified anomalous tracks was computed for each component of the geomagnetic field, combining the three satellites together.
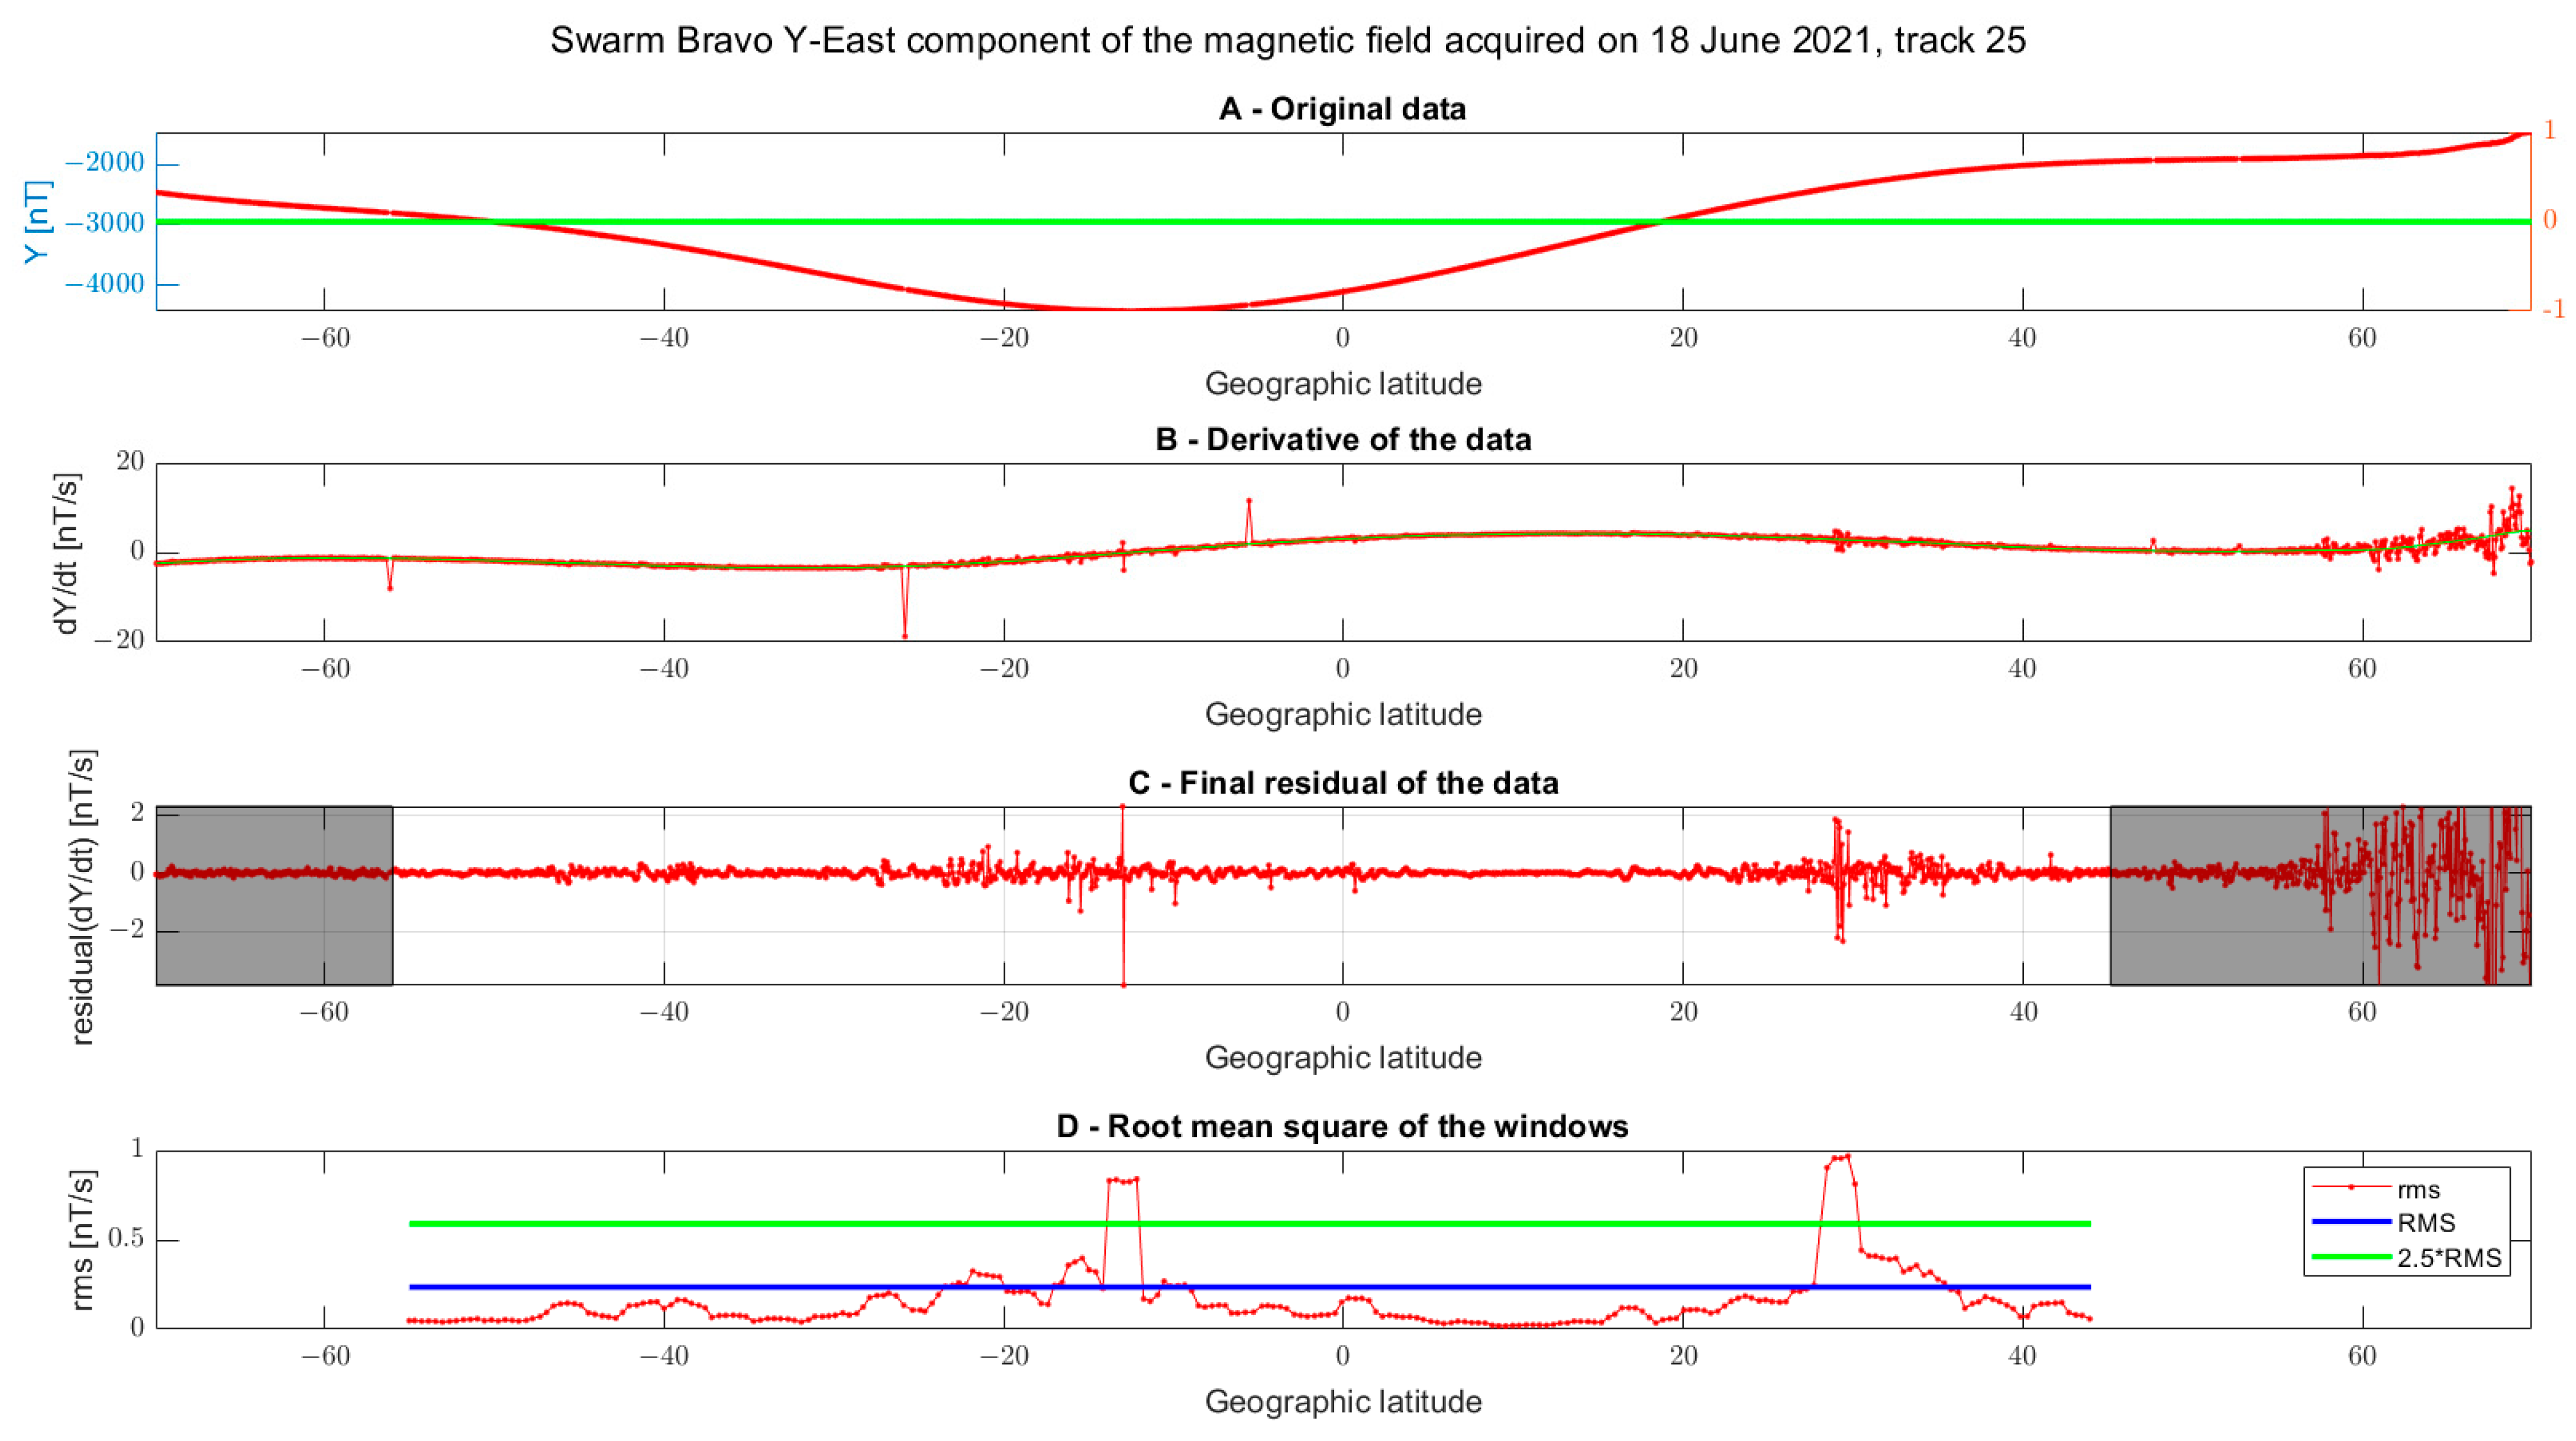
In order to establish if the cumulative trend is anomalous, a deviation from a linear increase is searched. In fact, this algorithm identifies anomalous signals in the ionosphere during quiet geomagnetic time and a background of anomalies is also expected without the geophysical event as for example simulated in [67]. On the other hand, a deviation in terms of acceleration from the linear trend can indicate that a critical process, such as an earthquake or volcano eruption, is approaching [97,98].
Figure A4. Swarm Bravo magnetic field detailed analysis step-by-step of track 25, acquired on 18 June 2021 from the original signal (A) that has been derived (B), a cubic spline was further removed (C) and analysed the root mean square by a moving window (D).
Remotesensing 14 05001 g0a4

Appendix C. Global Distributions of TEC and Electron Density from CSES-01 Satellite

In this section, we present the global distributions of TEC obtained from GIM data. Instead of showing the TEC at a defined UT (the original data), we preferred to interpolate the data at 2:00 AM local time for all the longitudes of the world. Not all the values are interpolated if the data at 2 LT is available for the specific longitude. Otherwise, it is linearly interpolated from the previous and following GIM map, including the last value of the day before (22 UT) and first value (0 UT) for the following day.
The reason to choose 2 LT is that CSES-01 satellite has this time at the equator fixed for all of the world at night-time, so the obtained TEC map will be easily comparable with the CSES-01 data. Furthermore, the global distribution of TEC and Ne permits discrimination if the identified anomaly is a global phenomenon or local, with more chances to be produced by the volcano activity even if other proof is needed to demonstrate such a geophysical source.
In the following figures, we show the days that are depicted with an outlier in electron density by satellite CSES-01 in Figure 23, and we resume the days represented and some notes in the following Table A1.
Table A1. List of the maps of Ne and TEC that are compared in this appendix.
FigureDay [2021]ParameterNotes
Figure A52 JulyTECTEC and CSES Ne are well in agreement.
The high value of Ne over La Palma seems more a global disturbance.
Figure A6Ne (CSES-01)
Figure A77 JulyTECGlobal distribution of TEC and Ne from CSES present the same structures. The disturbance seems global.
Figure A8Ne (CSES-01)
Figure A922 JulyTECThe structures in TEC and CSES Ne are compatible, even if the localizations of maximum are different
Figure A10Ne (CSES-01)
Figure A111 and 2 AugustTECThe distributions of TEC and CSES Ne are well in agreement. The enhancement above “La Palma” volcano seems a local anomaly.
Figure A12
Figure A13Ne (CSES-01)
Figure A14
Figure A1526 AugustTECIonospheric structures are more complex and they are well depicted by both TEC and CSES Ne satellite. Disturbance seems global phenomenon
Figure A16Ne (CSES-01)
In conclusion, by the comparison of TEC data from GIM with in situ Ne observation made by CSES-01, a well and overall agreement was identified detecting the same ionosphere structures, including a peak in the Southern hemisphere between Australia and New Zealand on 26 August which was an unusual structure with respect to the other presented day. This confirms the scientific reliability of CSES Ne data, and furthermore, CSES provided very important measurements as it is made in situ and on the topside.
In fact, the difference sometimes underlined by the comparison of TEC and CSES Ne in the localization of the maximum could reflect a different vertical stratification of Ne, as the measure of CSES is punctual (in-situ) observation at about 510 km of altitude, while TEC is more representative of a lower altitude, as the maximum concentration of electron density is located between 250 km and 400 km depending on the season, longitude, geomagnetic activity, and local time (here fixed), and it is known as hmF2 [99].
Figure A5. TEC map of 2 July 2021 at 2 LT.
Remotesensing 14 05001 g0a5
Figure A6. CSES-Ne measurements of 2 July 2021 at about 2 LT. The bold black numbers represent the UT time of the centre of each shown track.
Remotesensing 14 05001 g0a6
Figure A7. TEC map of 7 July 2021 at 2 LT.
Remotesensing 14 05001 g0a7
Figure A8. CSES-Ne measurements of 7 July 2021 at about 2 LT. The bold black numbers represent the UT time of the centre of each shown track.
Remotesensing 14 05001 g0a8
Figure A9. TEC map of 22 July 2021 at 2 LT.
Remotesensing 14 05001 g0a9
Figure A10. CSES-01 Ne measurements of 22 July 2021. The bold black numbers represent the UT time of the centre of each shown track.
Remotesensing 14 05001 g0a10
Figure A11. TEC map of 1 August 2021 at 2 LT.
Remotesensing 14 05001 g0a11
Figure A12. TEC map of 2 August 2021 at 2 LT.
Remotesensing 14 05001 g0a12
Figure A13. CSES-01 Ne distribution of 1 August 2021. The bold black numbers represent the UT time of the centre of each shown track.
Remotesensing 14 05001 g0a13
Figure A14. CSES-01 Ne distribution of 2 August 2021. The bold black numbers represent the UT time of the centre of each shown track.
Remotesensing 14 05001 g0a14
Figure A15. TEC map of 26 August 2021 at 2 LT.
Remotesensing 14 05001 g0a15
Figure A16. CSES-01 Ne distribution of 1 August 2021. The bold black numbers represent the UT time of the centre of each shown track. The track at 2.9 UT has a gap in original data that is also visible in Figure 29 as a straight horizontal dashed line.
Remotesensing 14 05001 g0a16

Appendix D. Comparison of Carbon Monoxide Measured from Ground Station IZO and the Value Obtained from the MERRA-2 Archive

In order to validate the data used in this paper, we performed a comparison of the CO available from the station IZO (Izana, Tenerife), located on the close island of Tenerife at an elevation of 2372.9 m above sea level (28.309°N, 16.499°W). The measurements at the observatories were collected between 8:42 UT (7:36 LT) and 10:30 UT (9:24 LT), and we reported this in Figure A17. The CO data from the MERRA2 archive are the same as shown in the main text, but here the standard deviation of the values used to calculate the mean in the area (square box of 3° side) is added.
Even if not all values are in agreement (i.e., some of them differ for more than one standard deviation), we noted a general concordance overall in the trend that was mostly the same. The value at the IZO station is typically higher, and we attribute this to a couple of factors: the most important is that the observatory is placed on land while the value from MERRA-2 archive is partially (and mostly) over the oceanic surface and the land can experience higher concentrations of CO due to anthropogenic sources, and secondly for the different local time of the two measurements.
Finally, taking into account spatial different factors, we can consider the data from the MERRA-2 archive highly reliable for scientific purposes, with the advantages of global coverage and uniform sampling in time and space, even if a measurement from a station is surely more accurate for the local situation, but is not always available.
Figure A17. Comparison of the time series obtained from the MERRA-2 archive with the mean value and the standard deviation of the pixels used to calculate the mean with the values measured at IZO station in Tenerife island.
Remotesensing 14 05001 g0a17

Appendix E. Calculus of the Point Vector with Swarm Data

Swarm satellite was equipped with an instrument, the Thermal Ion Imager (TII), that was able to measure the ion drift speed along the track of the satellite perpendicular and almost vertical directions [100]. The instrument is composed of two perpendicular detectors—one vertical and the second horizontal—which produce a distribution of the low-Energy ions in terms of angle and energy recorded by a Charged Coupled Device (CCD) [100]. ESA from the ion velocity and magnetic field measurement provided an estimation of the electric field along the track (Ex), perpendicular to the satellite direction speed (Ey) and almost vertical (Ez) in the advanced data products of Swarm, plasma Section 2 Hz TII. The speed vector (SN, SE, SC) for each sample in NEC (North-East-Centre) frame is also provided and has been used in this work to rotate the electric field in the NEC frame, i.e., the same as the magnetic field:
| E N E E E C | = | cos ( φ ) 0 sin ( φ ) 0 1 0 sin ( φ ) 0 cos ( φ ) | · | cos ( θ ) sin ( θ ) 0 sin ( θ ) cos ( θ ) 0 0 0 1 | · | E x E y E z |
where θ is the horizontal rotation angle, therefore cos ( θ ) = S N l ,   l = S N 2 + S E 2 and φ is the vertical one, therefore cos ( φ ) = l v where v is the speed intensity ( ,   v = S N 2 + S E 2 + S C 2 ). Substituting the above quantities, the two rotation matrixes are simplified as:
| E N E E E C | = | l v 0 S C v 0 1 0 S C v 0 l v | · | S N l S E l 0 S E l S N l 0 0 0 1 | · | E x E y E z |
After the rotation of the electric field, the pointing vector “S” was calculated using the residual value of the magnetic field (BN, BE, BC; shown for each track in Supplementary pdf file) by its definition with the vectorial product of electrical and magnetic vector fields:
S = E × B μ 0 = 1 μ 0 · | E E · B C E C · B E E C · B N E N · B C E N · B E E E · B N |
Before applying the above multiplication, the magnetic field was interpolated with PCHIP [75] technique at the same point of the electric field by the comparison of their latitude.

References

  1. Parrot, M.; Tramutoli, V.; Liu, T.J.Y.; Pulinets, S.; Ouzounov, D.; Genzano, N.; Lisi, M.; Hattori, K.; Namgaladze, A. Atmospheric and Ionospheric Coupling Phenomena Associated with Large Earthquakes. Eur. Phys. J. Spec. Top. 2021, 230, 197–225. [Google Scholar] [CrossRef]
  2. Pulinets, S.; Ouzounov, D. Lithosphere–Atmosphere–Ionosphere Coupling (LAIC) Model—An Unified Concept for Earthquake Precursors Validation. J. Asian Earth Sci. 2011, 41, 371–382. [Google Scholar] [CrossRef]
  3. American Geophysical Union. Pre-Earthquake Processes: A Multidisciplinary Approach to Earthquake Prediction Studies; Geophysical Monograph Series; American Geophysical Union: Washington, DC, USA; Hoboken, NJ, USA, 2018; ISBN 978-1-119-15694-9. [Google Scholar]
  4. De Santis, A.; Marchetti, D.; Pavón-Carrasco, F.J.; Cianchini, G.; Perrone, L.; Abbattista, C.; Alfonsi, L.; Amoruso, L.; Campuzano, S.A.; Carbone, M.; et al. Precursory Worldwide Signatures of Earthquake Occurrences on Swarm Satellite Data. Sci. Rep. 2019, 9, 20287. [Google Scholar] [CrossRef] [Green Version]
  5. Marchetti, D.; De Santis, A.; Campuzano, S.A.; Zhu, K.; Soldani, M.; D’Arcangelo, S.; Orlando, M.; Wang, T.; Cianchini, G.; Di Mauro, D.; et al. Worldwide Statistical Correlation of Eight Years of Swarm Satellite Data with M5.5+ Earthquakes: New Hints about the Preseismic Phenomena from Space. Remote Sens. 2022, 14, 2649. [Google Scholar] [CrossRef]
  6. Pergola, N.; Marchese, F.; Tramutoli, V. Automated Detection of Thermal Features of Active Volcanoes by Means of Infrared AVHRR Records. Remote Sens. Environ. 2004, 93, 311–327. [Google Scholar] [CrossRef]
  7. Filizzola, C.; Corrado, A.; Genzano, N.; Lisi, M.; Pergola, N.; Colonna, R.; Tramutoli, V. RST Analysis of Anomalous TIR Sequences in Relation with Earthquakes Occurred in Turkey in the Period 2004–2015. Remote Sens. 2022, 14, 381. [Google Scholar] [CrossRef]
  8. Crisp, N.H.; Roberts, P.C.E.; Livadiotti, S.; Oiko, V.T.A.; Edmondson, S.; Haigh, S.J.; Huyton, C.; Sinpetru, L.A.; Smith, K.L.; Worrall, S.D.; et al. The Benefits of Very Low Earth Orbit for Earth Observation Missions. Prog. Aerosp. Sci. 2020, 117, 100619. [Google Scholar] [CrossRef]
  9. Scarino, B.; Minnis, P.; Palikonda, R.; Reichle, R.; Morstad, D.; Yost, C.; Shan, B.; Liu, Q. Retrieving Clear-Sky Surface Skin Temperature for Numerical Weather Prediction Applications from Geostationary Satellite Data. Remote Sens. 2013, 5, 342–366. [Google Scholar] [CrossRef] [Green Version]
  10. Uyeda, S.; Hayakawa, M.; Nagao, T.; Molchanov, O.; Hattori, K.; Orihara, Y.; Gotoh, K.; Akinaga, Y.; Tanaka, H. Electric and Magnetic Phenomena Observed before the Volcano-Seismic Activity in 2000 in the Izu Island Region, Japan. Proc. Natl. Acad. Sci. USA 2002, 99, 7352–7355. [Google Scholar] [CrossRef] [Green Version]
  11. Marchese, F.; Filizzola, C.; Mazzeo, G.; Paciello, R.; Pergola, N.; Tramutoli, V. Robust Satellite Techniques for Thermal Volcanic Activity Monitoring, Early Warning and Possible Prediction of New Eruptive Events. In Proceedings of the 2009 IEEE International Geoscience and Remote Sensing Symposium, Cape Town, South Africa, 12–17 July 2009; IEEE: Cape Town, South Africa, 2009; Volume II, pp. 953–956. [Google Scholar]
  12. Marchese, F.; Filizzola, C.; Lacava, T.; Falconieri, A.; Faruolo, M.; Genzano, N.; Mazzeo, G.; Pietrapertosa, C.; Pergola, N.; Tramutoli, V.; et al. Mt. Etna Paroxysms of February–April 2021 Monitored and Quantified through a Multi-Platform Satellite Observing System. Remote Sens. 2021, 13, 3074. [Google Scholar] [CrossRef]
  13. Pulinets, S.; Davidenko, D. Ionospheric Precursors of Earthquakes and Global Electric Circuit. Adv. Space Res. 2014, 53, 709–723. [Google Scholar] [CrossRef]
  14. Pulinets, S.; Khachikyan, G. The Global Electric Circuit and Global Seismicity. Geosciences 2021, 11, 491. [Google Scholar] [CrossRef]
  15. Parrot, M. Events Linked to the Lithosphere-Atmosphere-Ionosphere Coupling Observed by DEMETER. URSI Radio Sci. Bull. 2017, 2017, 75–79. [Google Scholar] [CrossRef]
  16. Tramutoli, V.; Marchese, F.; Falconieri, A.; Filizzola, C.; Genzano, N.; Hattori, K.; Lisi, M.; Liu, J.-Y.; Ouzounov, D.; Parrot, M.; et al. Tropospheric and Ionospheric Anomalies Induced by Volcanic and Saharan Dust Events as Part of Geosphere Interaction Phenomena. Geosciences 2019, 9, 177. [Google Scholar] [CrossRef] [Green Version]
  17. Pulinets, S.; Davidenko, D.; Pulinets, M. Atmosphere-Ionosphere Coupling Induced by Volcanoes Eruption and Dust Storms and Role of GEC as the Agent of Geospheres Interaction. Adv. Space Res. 2022, 69, 4319–4334. [Google Scholar] [CrossRef]
  18. Voight, B. A Method for Prediction of Volcanic Eruptions. Nature 1988, 332, 125–130. [Google Scholar] [CrossRef]
  19. Matoza, R.S.; Fee, D.; Assink, J.D.; Iezzi, A.M.; Green, D.N.; Kim, K.; Toney, L.; Lecocq, T.; Krishnamoorthy, S.; Lalande, J.-M.; et al. Atmospheric Waves and Global Seismoacoustic Observations of the January 2022 Hunga Eruption, Tonga. Science 2022, 377, 95–100. [Google Scholar] [CrossRef]
  20. Heki, K. Ionospheric Signatures of Repeated Passages of Atmospheric Waves by the 2022 Jan. 15 Hunga Tonga Eruption Detected by QZSS-TEC Observations in Japan. Earth Planets Space 2022, 74, 112. [Google Scholar] [CrossRef]
  21. D’Arcangelo, S.; Bonforte, A.; De Santis, A.; Maugeri, S.R.; Perrone, L.; Soldani, M.; Arena, G.; Brogi, F.; Calcara, M.; Campuzano, S.A.; et al. A Multi-Parametric and Multi-Layer Study to Investigate the Largest 2022 Hunga Tonga–Hunga Ha’apai Eruptions. Remote Sens. 2022, 14, 3649. [Google Scholar] [CrossRef]
  22. Barbieri, C. The Galileo Italian National Telescope and Its Instrumentation. Exp. Astron. 1997, 7, 257–279. [Google Scholar] [CrossRef]
  23. Aleksić, J.; Ansoldi, S.; Antonelli, L.A.; Antoranz, P.; Babic, A.; Bangale, P.; Barceló, M.; Barrio, J.A.; Becerra González, J.; Bednarek, W.; et al. The Major Upgrade of the MAGIC Telescopes, Part I: The Hardware Improvements and the Commissioning of the System. Astropart. Phys. 2016, 72, 61–75. [Google Scholar] [CrossRef] [Green Version]
  24. Martí, J.; Pinel, V.; López, C.; Geyer, A.; Abella, R.; Tárraga, M.; Blanco, M.J.; Castro, A.; Rodríguez, C. Causes and Mechanisms of the 2011–2012 El Hierro (Canary Islands) Submarine Eruption: EL HIERRO ERUPTION. J. Geophys. Res. Solid Earth 2013, 118, 823–839. [Google Scholar] [CrossRef] [Green Version]
  25. Venzke, E.; Smithsonian Institution. Volcanoes of the World, v. 4.3.4; Smithsonian Institution: Washington, DC, USA, 2013. [Google Scholar]
  26. López, C.; Blanco, M.J.; Abella, R.; Brenes, B.; Cabrera Rodríguez, V.M.; Casas, B.; Domínguez Cerdeña, I.; Felpeto, A.; de Villalta, M.F.; del Fresno, C.; et al. Monitoring the Volcanic Unrest of El Hierro (Canary Islands) before the Onset of the 2011–2012 Submarine Eruption: Monitoring El Hierro prior 2001 eruption. Geophys. Res. Lett. 2012, 39, L13303. [Google Scholar] [CrossRef]
  27. De Luca, C.; Valerio, E.; Giudicepietro, F.; Macedonio, G.; Casu, F.; Lanari, R. Pre- and Co-Eruptive Analysis of the September 2021 Eruption at Cumbre Vieja Volcano (La Palma, Canary Islands) Through DInSAR Measurements and Analytical Modeling. Geophys. Res. Lett. 2022, 49, e2021GL097293. [Google Scholar] [CrossRef]
  28. Schekotov, A.; Hayakawa, M.; Potirakis, S.M. Does Air Ionization by Radon Cause Low-Frequency Atmospheric Electromagnetic Earthquake Precursors? Nat. Hazards 2021, 106, 701–714. [Google Scholar] [CrossRef]
  29. Liperovsky, V.A.; Pokhotelov, O.A.; Meister, C.-V.; Liperovskaya, E.V. Physical Models of Coupling in the Lithosphere-Atmosphere-Ionosphere System before Earthquakes. Geomagn. Aeron. 2008, 48, 795–806. [Google Scholar] [CrossRef]
  30. Yi, J.; Wang, P.; Shan, X.; Ventura, G.; Wu, C.; Guo, J.; Liu, P.; Li, J. Modeling the Multi-Level Plumbing System of the Changbaishan Caldera from Geochemical, Mineralogical, Sr-Nd Isotopic and Integrated Geophysical Data. Geosci. Front. 2021, 12, 101171. [Google Scholar] [CrossRef]
  31. Di Paolo, F.; Ledo, J.; Ślęzak, K.; Martínez van Dorth, D.; Cabrera-Pérez, I.; Pérez, N.M. La Palma Island (Spain) Geothermal System Revealed by 3D Magnetotelluric Data Inversion. Sci. Rep. 2020, 10, 18181. [Google Scholar] [CrossRef] [PubMed]
  32. Kanda, W.; Utsugi, M.; Tanaka, Y.; Hashimoto, T.; Fujii, I.; Hasenaka, T.; Shigeno, N. A Heating Process of Kuchi-Erabu-Jima Volcano, Japan, as Inferred from Geomagnetic Field Variations and Electrical Structure. J. Volcanol. Geotherm. Res. 2010, 189, 158–171. [Google Scholar] [CrossRef] [Green Version]
  33. Alcolombri, U.; Ben-Dor, S.; Feldmesser, E.; Levin, Y.; Tawfik, D.S.; Vardi, A. Identification of the Algal Dimethyl Sulfide–Releasing Enzyme: A Missing Link in the Marine Sulfur Cycle. Science 2015, 348, 1466–1469. [Google Scholar] [CrossRef] [PubMed]
  34. Nguyen, B.C.; Gaudry, A.; Bonsang, B.; Lambert, G. Reevaluation of the Role of Dimethyl Sulphide in the Sulphur Budget. Nature 1978, 275, 637–639. [Google Scholar] [CrossRef]
  35. Loyola, D.; van Geffen, J.; Valks, P.; Erbertseder, T.; Van Roozendael, M.; Thomas, W.; Zimmer, W.; Wißkirchen, K. Satellite-Based Detection of Volcanic Sulphur Dioxide from Recent Eruptions in Central and South America. Adv. Geosci. 2008, 14, 35–40. [Google Scholar] [CrossRef] [Green Version]
  36. Wallace, J.M.; Hobbs, P.V. Atmospheric Chemistry. In Atmospheric Science; Elsevier: Amsterdam, The Netherlands, 2006; pp. 153–207. ISBN 978-0-12-732951-2. [Google Scholar]
  37. Cadle, R.D. A Comparison of Volcanic with Other Fluxes of Atmospheric Trace Gas Constituents. Rev. Geophys. 1980, 18, 746. [Google Scholar] [CrossRef]
  38. Pulinets, S.A. Physical Mechanism of the Vertical Electric Field Generation over Active Tectonic Faults. Adv. Space Res. 2009, 44, 767–773. [Google Scholar] [CrossRef]
  39. Ouzounov, D.; Pulinets, S.; Davidenko, D.; Rozhnoi, A.; Solovieva, M.; Fedun, V.; Dwivedi, B.N.; Rybin, A.; Kafatos, M.; Taylor, P. Transient Effects in Atmosphere and Ionosphere Preceding the 2015 M7.8 and M7.3 Gorkha–Nepal Earthquakes. Front. Earth Sci. 2021, 9, 757358. [Google Scholar] [CrossRef]
  40. Marchetti, D.; De Santis, A.; Shen, X.; Campuzano, S.A.; Perrone, L.; Piscini, A.; Di Giovambattista, R.; Jin, S.; Ippolito, A.; Cianchini, G.; et al. Possible Lithosphere-Atmosphere-Ionosphere Coupling Effects Prior to the 2018 Mw = 7.5 Indonesia Earthquake from Seismic, Atmospheric and Ionospheric Data. J. Asian Earth Sci. 2020, 188, 104097. [Google Scholar] [CrossRef]
  41. Molchanov, O.A.; Hayakawa, M. Generation of ULF Electromagnetic Emissions by Microfracturing. Geophys. Res. Lett. 1995, 22, 3091–3094. [Google Scholar] [CrossRef]
  42. Molchanov, O.A.; Hayakawa, M. On the Generation Mechanism of ULF Seismogenic Electromagnetic Emissions. Phys. Earth Planet. Inter. 1998, 105, 201–210. [Google Scholar] [CrossRef]
  43. Hattori, K.; Han, P.; Yoshino, C.; Febriani, F.; Yamaguchi, H.; Chen, C.-H. Investigation of ULF Seismo-Magnetic Phenomena in Kanto, Japan During 2000–2010: Case Studies and Statistical Studies. Surv. Geophys. 2013, 34, 293–316. [Google Scholar] [CrossRef]
  44. Hattori, K.; Serita, A.; Gotoh, K.; Yoshino, C.; Harada, M.; Isezaki, N.; Hayakawa, M. ULF Geomagnetic Anomaly Associated with 2000 Izu Islands Earthquake Swarm, Japan. Phys. Chem. Earth Parts A/B/C 2004, 29, 425–435. [Google Scholar] [CrossRef]
  45. Ouyang, X.Y.; Parrot, M.; Bortnik, J. ULF Wave Activity Observed in the Nighttime Ionosphere Above and Some Hours Before Strong Earthquakes. J. Geophys. Res. Space Phys. 2020, 125, e2020JA028396. [Google Scholar] [CrossRef]
  46. Ouyang, X.-Y.; Wang, Y.-F.; Zhang, X.-M.; Wang, Y.-L.; Wu, Y.-Y. A New Analysis Method for Magnetic Disturbances Possibly Related to Earthquakes Observed by Satellites. Remote Sens. 2022, 14, 2709. [Google Scholar] [CrossRef]
  47. Enomoto, Y. Coupled Interaction of Earthquake Nucleation with Deep Earth Gases: A Possible Mechanism for Seismo-Electromagnetic Phenomena: Coupled Interaction of Earthquake Nucleation. Geophys. J. Int. 2012, 191, 1210–1214. [Google Scholar] [CrossRef] [Green Version]
  48. Korepanov, V.; Hayakawa, M.; Yampolski, Y.; Lizunov, G. AGW as a Seismo-Ionospheric Coupling Responsible Agent. Phys. Chem. Earth Parts A/B/C 2009, 34, 485–495. [Google Scholar] [CrossRef]
  49. Wiemer, S. A Software Package to Analyze Seismicity: ZMAP. Seismol. Res. Lett. 2001, 72, 373–382. [Google Scholar] [CrossRef]
  50. Mignan, A.; King, G.C.P.; Bowman, D. A Mathematical Formulation of Accelerating Moment Release Based on the Stress Accumulation Model. J. Geophys. Res. 2007, 112, B07308. [Google Scholar] [CrossRef] [Green Version]
  51. Gelaro, R.; McCarty, W.; Suárez, M.J.; Todling, R.; Molod, A.; Takacs, L.; Randles, C.A.; Darmenov, A.; Bosilovich, M.G.; Reichle, R.; et al. The Modern-Era Retrospective Analysis for Research and Applications, Version 2 (MERRA-2). J. Clim. 2017, 30, 5419–5454. [Google Scholar] [CrossRef]
  52. Piscini, A.; Marchetti, D.; De Santis, A. Multi-Parametric Climatological Analysis Associated with Global Significant Volcanic Eruptions During 2002–2017. Pure Appl. Geophys. 2019, 176, 3629–3647. [Google Scholar] [CrossRef]
  53. Whitcher, B.; Guttorp, P.; Percival, D.B. Wavelet Analysis of Covariance with Application to Atmospheric Time Series. J. Geophys. Res. 2000, 105, 14941–14962. [Google Scholar] [CrossRef] [Green Version]
  54. Shen, X.; Zong, Q.-G.; Zhang, X. Introduction to Special Section on the China Seismo-Electromagnetic Satellite and Initial Results. Earth Planet. Phys. 2018, 2, 439–443. [Google Scholar] [CrossRef]
  55. Yang, Y.; Hulot, G.; Vigneron, P.; Shen, X.; Zhima, Z.; Zhou, B.; Magnes, W.; Olsen, N.; Tøffner-Clausen, L.; Huang, J.; et al. The CSES Global Geomagnetic Field Model (CGGM): An IGRF-Type Global Geomagnetic Field Model Based on Data from the China Seismo-Electromagnetic Satellite. Earth Planets Space 2021, 73, 45. [Google Scholar] [CrossRef]
  56. Friis-Christensen, E.; Lühr, H.; Knudsen, D.; Haagmans, R. Swarm—An Earth Observation Mission Investigating Geospace. Adv. Space Res. 2008, 41, 210–216. [Google Scholar] [CrossRef]
  57. Regi, M.; Di Mauro, D.; Lepidi, S. The Location of the Earth’s Magnetic Poles From Circum-Terrestrial Observations. J. Geophys. Res. Space Phys. 2021, 126, e2020JA028513. [Google Scholar] [CrossRef]
  58. Matzka, J.; Stolle, C.; Yamazaki, Y.; Bronkalla, O.; Morschhauser, A. The Geomagnetic Kp Index and Derived Indices of Geomagnetic Activity. Space Weather 2021, 19, e2020SW002641. [Google Scholar] [CrossRef]
  59. Nose, M.; Sugiura, M.; Kamei, T.; Iyemori, T.; Koyama, Y. Dst Index; WDC Geomagnetism: Kyoto, Japan, 2015. [Google Scholar]
  60. Cianchini, G.; Piscini, A.; De Santis, A.; Campuzano, S.A. Fast Dst Computation by Applying Deep Learning to Swarm Satellite Magnetic Data. Adv. Space Res. 2022, 69, 837–855. [Google Scholar] [CrossRef]
  61. Yang, Y.; Zhou, B.; Hulot, G.; Olsen, N.; Wu, Y.; Xiong, C.; Stolle, C.; Zhima, Z.; Huang, J.; Zhu, X.; et al. CSES High Precision Magnetometer Data Products and Example Study of an Intense Geomagnetic Storm. JGR Space Phys. 2021, 126, e2020JB020466. [Google Scholar] [CrossRef]
  62. Akhoondzadeh, M.; De Santis, A.; Marchetti, D.; Shen, X. Swarm-TEC Satellite Measurements as a Potential Earthquake Precursor Together with Other Swarm and CSES Data: The Case of Mw7.6 2019 Papua New Guinea Seismic Event. Front. Earth Sci. 2022, 10, 820189. [Google Scholar] [CrossRef]
  63. Kuo, C.L.; Huba, J.D.; Joyce, G.; Lee, L.C. Ionosphere Plasma Bubbles and Density Variations Induced by Pre-Earthquake Rock Currents and Associated Surface Charges: Pre-Earthquake Ionospheric Effect. J. Geophys. Res. 2011, 116, A10. [Google Scholar] [CrossRef] [Green Version]
  64. Kuo, C.L.; Lee, L.C.; Huba, J.D. An Improved Coupling Model for the Lithosphere-Atmosphere-Ionosphere System. J. Geophys. Res. Space Phys. 2014, 119, 3189–3205. [Google Scholar] [CrossRef]
  65. Tornatore, V.; Cesaroni, C.; Pezzopane, M.; Alizadeh, M.M.; Schuh, H. Performance Evaluation of VTEC GIMs for Regional Applications during Different Solar Activity Periods, Using RING TEC Values. Remote Sens. 2021, 13, 1470. [Google Scholar] [CrossRef]
  66. De Santis, A.; Balasis, G.; Pavón-Carrasco, F.J.; Cianchini, G.; Mandea, M. Potential Earthquake Precursory Pattern from Space: The 2015 Nepal Event as Seen by Magnetic Swarm Satellites. Earth Planet. Sci. Lett. 2017, 461, 119–126. [Google Scholar] [CrossRef] [Green Version]
  67. De Santis, A.; Marchetti, D.; Spogli, L.; Cianchini, G.; Pavón-Carrasco, F.J.; Franceschi, G.D.; Di Giovambattista, R.; Perrone, L.; Qamili, E.; Cesaroni, C.; et al. Magnetic Field and Electron Density Data Analysis from Swarm Satellites Searching for Ionospheric Effects by Great Earthquakes: 12 Case Studies from 2014 to 2016. Atmosphere 2019, 10, 371. [Google Scholar] [CrossRef] [Green Version]
  68. Marchetti, D.; De Santis, A.; Campuzano, S.A.; Soldani, M.; Piscini, A.; Sabbagh, D.; Cianchini, G.; Perrone, L.; Orlando, M. Swarm Satellite Magnetic Field Data Analysis Prior to 2019 Mw = 7.1 Ridgecrest (California, USA) Earthquake. Geosciences 2020, 10, 502. [Google Scholar] [CrossRef]
  69. Prado, F.B.A. Traveling between the Lagrangian Points and the Earth. Acta Astronaut. 1996, 39, 483–486. [Google Scholar] [CrossRef]
  70. Stone, E.C.; Frandsen, A.M.; Mewaldt, R.A.; Christian, E.R.; Margolies, D.; Ormes, J.F.; Snow, F. The Advanced Composition Explorer. Space Sci. Rev. 1998, 86, 1–22. [Google Scholar] [CrossRef]
  71. Burt, J.; Smith, B. Deep Space Climate Observatory: The DSCOVR Mission. In Proceedings of the 2012 IEEE Aerospace Conference, Big Sky, MT, USA, 3–10 March 2012; pp. 1–13. [Google Scholar]
  72. Endo, E.T.; Murray, T. Real-Time Seismic Amplitude Measurement (RSAM): A Volcano Monitoring and Prediction Tool. Bull. Volcanol. 1991, 53, 533–545. [Google Scholar] [CrossRef]
  73. Tan, Y.J.; Waldhauser, F.; Ellsworth, W.L.; Zhang, M.; Zhu, W.; Michele, M.; Chiaraluce, L.; Beroza, G.C.; Segou, M. Machine-Learning-Based High-Resolution Earthquake Catalog Reveals How Complex Fault Structures Were Activated during the 2016–2017 Central Italy Sequence. Seism. Rec. 2021, 1, 11–19. [Google Scholar] [CrossRef]
  74. Klügel, A.; Hansteen, T.H.; Schmincke, H.-U. Rates of Magma Ascent and Depths of Magma Reservoirs beneath La Palma (Canary Islands). Terra Nova 1997, 9, 117–121. [Google Scholar] [CrossRef]
  75. Fritsch, F.N.; Carlson, R.E. Monotone Piecewise Cubic Interpolation. SIAM J. Numer. Anal. 1980, 17, 238–246. [Google Scholar] [CrossRef]
  76. Vaidyanathan, P.P. Generalizations of the Sampling Theorem: Seven Decades after Nyquist. IEEE Trans. Circuits Syst. I 2001, 48, 1094–1109. [Google Scholar] [CrossRef]
  77. Yamazaki, Y.; Maute, A. Sq and EEJ—A Review on the Daily Variation of the Geomagnetic Field Caused by Ionospheric Dynamo Currents. Space Sci. Rev. 2017, 206, 299–405. [Google Scholar] [CrossRef] [Green Version]
  78. Marchetti, D.; De Santis, A.; D’Arcangelo, S.; Poggio, F.; Piscini, A.; Campuzano, S.A.; De Carvalho, W.V.J.O. Pre-Earthquake Chain Processes Detected from Ground to Satellite Altitude in Preparation of the 2016–2017 Seismic Sequence in Central Italy. Remote Sens. Environ. 2019, 229, 93–99. [Google Scholar] [CrossRef]
  79. Andreae, M.O.; Raemdonck, H. Dimethyl Sulfide in the Surface Ocean and the Marine Atmosphere: A Global View. Science 1983, 221, 744–747. [Google Scholar] [CrossRef] [Green Version]
  80. Prospero, J.M. Saharan Dust Transport Over the North Atlantic Ocean and Mediterranean: An Overview. In The Impact of Desert Dust Across the Mediterranean; Guerzoni, S., Chester, R., Eds.; Springer: Dordrecht, The Netherlands, 1996; Volume 11, pp. 133–151. ISBN 978-90-481-4764-9. [Google Scholar]
  81. Piscini, A.; De Santis, A.; Marchetti, D.; Cianchini, G. A Multi-Parametric Climatological Approach to Study the 2016 Amatrice–Norcia (Central Italy) Earthquake Preparatory Phase. Pure Appl. Geophys. 2017, 174, 3673–3688. [Google Scholar] [CrossRef]
  82. De Santis, A.; Cianchini, G.; Marchetti, D.; Piscini, A.; Sabbagh, D.; Perrone, L.; Campuzano, S.A.; Inan, S. A Multiparametric Approach to Study the Preparation Phase of the 2019 M7.1 Ridgecrest (California, United States) Earthquake. Front. Earth Sci. 2020, 8, 540398. [Google Scholar] [CrossRef]
  83. Akhoondzadeh, M.; De Santis, A.; Marchetti, D.; Wang, T. Developing a Deep Learning-Based Detector of Magnetic, Ne, Te and TEC Anomalies from Swarm Satellites: The Case of Mw 7.1 2021 Japan Earthquake. Remote Sens. 2022, 14, 1582. [Google Scholar] [CrossRef]
  84. Lu, G.; Huba, J.D.; Valladares, C. Modeling Ionospheric Super-Fountain Effect Based on the Coupled TIMEGCM-SAMI3: Ionospheric Super-Fountain Effect. J. Geophys. Res. Space Phys. 2013, 118, 2527–2535. [Google Scholar] [CrossRef]
  85. Pitari, G.; Mancini, E. Short-Term Climatic Impact of the 1991 Volcanic Eruption of Mt. Pinatubo and Effects on Atmospheric Tracers. Nat. Hazards Earth Syst. Sci. 2002, 2, 91–108. [Google Scholar] [CrossRef] [Green Version]
  86. Torres, R.; Mouginis-Mark, P.; Self, S.; Garbeil, H.; Kallianpur, K.; Quiambao, R. Monitoring the Evolution of the Pasig–Potrero Alluvial Fan, Pinatubo Volcano, Using a Decade of Remote Sensing Data. J. Volcanol. Geotherm. Res. 2004, 138, 371–392. [Google Scholar] [CrossRef]
  87. Bluth, G.J.S.; Doiron, S.D.; Schnetzler, C.C.; Krueger, A.J.; Walter, L.S. Global Tracking of the SO 2 Clouds from the June, 1991 Mount Pinatubo Eruptions. Geophys. Res. Lett. 1992, 19, 151–154. [Google Scholar] [CrossRef]
  88. Ghamry, E.; Marchetti, D.; Yoshikawa, A.; Uozumi, T.; De Santis, A.; Perrone, L.; Shen, X.; Fathy, A. The First Pi2 Pulsation Observed by China Seismo-Electromagnetic Satellite. Remote Sens. 2020, 12, 2300. [Google Scholar] [CrossRef]
  89. Torres-González, P.A.; Luengo-Oroz, N.; Lamolda, H.; D’Alessandro, W.; Albert, H.; Iribarren, I.; Moure-García, D.; Soler, V. Unrest Signals after 46 Years of Quiescence at Cumbre Vieja, La Palma, Canary Islands. J. Volcanol. Geotherm. Res. 2020, 392, 106757. [Google Scholar] [CrossRef]
  90. Aiuppa, A.; Casetta, F.; Coltorti, M.; Stagno, V.; Tamburello, G. Carbon Concentration Increases with Depth of Melting in Earth’s Upper Mantle. Nat. Geosci. 2021, 14, 697–703. [Google Scholar] [CrossRef]
  91. Fernández, J.; Escayo, J.; Hu, Z.; Camacho, A.G.; Samsonov, S.V.; Prieto, J.F.; Tiampo, K.F.; Palano, M.; Mallorquí, J.J.; Ancochea, E. Detection of Volcanic Unrest Onset in La Palma, Canary Islands, Evolution and Implications. Sci. Rep. 2021, 11, 2540. [Google Scholar] [CrossRef] [PubMed]
  92. Pankhurst, M.J.; Scarrow, J.H.; Barbee, O.A.; Hickey, J.; Coldwell, B.C.; Rollinson, G.K.; Rodríguez-Losada, J.A.; Martín Lorenzo, A.; Rodríguez, F.; Hernández, W.; et al. Rapid Response Petrology for the Opening Eruptive Phase of the 2021 Cumbre Vieja Eruption, La Palma, Canary Islands. Volcanica 2022, 5, 1–10. [Google Scholar] [CrossRef]
  93. Rees, D.; Fuller-Rowell, T.J.; Quegan, S.; Moffett, R.J.; Bailey, G.J. Simulations of the Seasonal Variations of the Thermosphere and Ionosphere Using a Coupled, Three-Dimensional, Global Model, Including Variations of the Interplanetary Magnetic Field. J. Atmos. Terr. Phys. 1988, 50, 903–930. [Google Scholar] [CrossRef]
  94. Balan, N.; Bailey, G.J. Equatorial Plasma Fountain and Its Effects: Possibility of an Additional Layer. J. Geophys. Res. 1995, 100, 21421–21432. [Google Scholar] [CrossRef]
  95. Marchetti, D.; De Santis, A.; D’Arcangelo, S.; Poggio, F.; Jin, S.; Piscini, A.; Campuzano, S.A. Magnetic Field and Electron Density Anomalies from Swarm Satellites Preceding the Major Earthquakes of the 2016–2017 Amatrice-Norcia (Central Italy) Seismic Sequence. Pure Appl. Geophys. 2020, 177, 305–319. [Google Scholar] [CrossRef]
  96. Alken, P.; Thébault, E.; Beggan, C.D.; Amit, H.; Aubert, J.; Baerenzung, J.; Bondar, T.N.; Brown, W.J.; Califf, S.; Chambodut, A.; et al. International Geomagnetic Reference Field: The Thirteenth Generation. Earth Planets Space 2021, 73, 49. [Google Scholar] [CrossRef]
  97. De Santis, A.; De Franceschi, G.; Spogli, L.; Perrone, L.; Alfonsi, L.; Qamili, E.; Cianchini, G.; Di Giovambattista, R.; Salvi, S.; Filippi, E.; et al. Geospace Perturbations Induced by the Earth: The State of the Art and Future Trends. Phys. Chem. Earth Parts A/B/C 2015, 85–86, 17–33. [Google Scholar] [CrossRef]
  98. De Santis, A.; Abbattista, C.; Alfonsi, L.; Amoruso, L.; Campuzano, S.A.; Carbone, M.; Cesaroni, C.; Cianchini, G.; De Franceschi, G.; De Santis, A.; et al. Geosystemics View of Earthquakes. Entropy 2019, 21, 412. [Google Scholar] [CrossRef] [PubMed] [Green Version]
  99. Bilitza, D. Comparison of Measured and Predicted F2 Peak Altitude. Adv. Space Res. 1985, 5, 29–32. [Google Scholar] [CrossRef]
  100. Knudsen, D.J.; Burchill, J.K.; Buchert, S.C.; Eriksson, A.I.; Gill, R.; Wahlund, J.-E.; Åhlen, L.; Smith, M.; Moffat, B. Thermal Ion Imagers and Langmuir Probes in the Swarm Electric Field Instruments. J. Geophys. Res. Space Phys. 2017, 122, 2655–2673. [Google Scholar] [CrossRef]
Figure 1. Location of La Palma Volcano. (A) Global view showing the position in the North Atlantic Ocean of Canarias Islands with respect to African and European continents. (B) Details of Las Canarias archipelagos. (C) La Palma Island. The position of the Cumbre Vieja volcanic edifice responsible for the eruption on 19 September 2021 is underlined. The figure is an original composition of views obtained by GoogleEarth Pro software (version 7.3.4.8642, freely provided by Google LLC.).
Remotesensing 14 05001 g001
Figure 2. Possible ways of bottom-up lithosphere–atmosphere–ionosphere effects in the contest of La Palma volcano. The drawing is just a sketch of the possible phenomena, and the dimensions are not in scale. Grey lines represent the conceptual interactions chain. Two main scenarios are illustrated: (A) the first hypothesis based on the temperature increase and corresponding demagnetization due to the uplift of magma; (B) the second hypothesis based on the microfractures or rock resistivity changes produced by the uplift of magma.
Remotesensing 14 05001 g002
Figure 3. Yearly mean TEC for the period from 2000 to 2021. The error bar is the standard deviation of the values used to calculate the mean (i.e., the TEC from 23 March to 19 September of each year). A sinusoidal fit has been performed and shown as a green curve with the fit parameter in the embedded table.
Remotesensing 14 05001 g003
Figure 4. Solar conditions during the investigated period from 23 March 2021 until 19 September 2021. The two horizontal red lines represent thresholds calculated as mean ± 2.0 standard deviations of the time series.
Remotesensing 14 05001 g004
Figure 5. The magnitude of completeness (Mc) in the function of the time.
Remotesensing 14 05001 g005
Figure 6. Earthquakes map and time series with magnitude and depth of the seismicity (M ≥ Mc) recorded around La Palma island from one year before “La Palma” volcano eruption of 19 September 2021.
Remotesensing 14 05001 g006
Figure 7. (A) Earthquakes 3D distribution from 19 September 2020 until 18 September 2021 (the day before the eruption). The colour represents the time the seismic event occurred. (B) Distribution of magnitude of the represented earthquakes. (C) Graph of the cumulative Benioff Strain of the earthquake that occurred only in La Palma Island. Earthquakes are represented as circles. The indication of a specific date highlights particular increases in seismicity.
Remotesensing 14 05001 g007
Figure 8. Geomagnetic Y (East) component of geomagnetic field measured by GUI and TAM ground observatories. The signal has been filtered into 5 bands.
Remotesensing 14 05001 g008
Figure 9. Geomagnetic Z (Centre) component of geomagnetic field measured by GUI and TAM ground observatories. The signal has been filtered into 5. A linear fit is reported in E as a dashed line. The linear fit equations are also provided inside panel E where “t” is the time in days.
Remotesensing 14 05001 g009
Figure 10. SO2 time series in the six months before La Palma volcano eruption of values estimated at 23 UT. The years 1982 and 1991 have been automatically excluded from the analysis due to the presence of outliers.
Remotesensing 14 05001 g010
Figure 11. Distribution maps of the SO2 most anomalous days around La Palma volcano (represented by a white star). The values are extracted at 23 UT.
Remotesensing 14 05001 g011
Figure 12. Dimethyl Sulphide (DMS) time series in the six months before La Palma volcano eruption. The values are extracted at 23 UT.
Remotesensing 14 05001 g012
Figure 13. Distribution maps of the DMS for one of each of the three groups of anomalous days depicted by the time series around La Palma volcano (represented by a white star). The values are extracted at 23 UT.
Remotesensing 14 05001 g013
Figure 14. Aerosol time series in the six months before La Palma volcano eruption. The values are extracted at 23 UT. 1990, 2002, and 2020 have been automatically excluded from the analysis due to the presence of outliers.
Remotesensing 14 05001 g014
Figure 15. Distribution maps of the aerosol for some representative days of the various groups of anomalies depicted by the time series: (A) 25 March 2021, 23 UT, (B) 18 May 2021, 23 UT, (C) 9 June 2021, 23 UT, (D) 12 July 2021, 13 UT, (E) 12 July 2021, 23 UT, and (F) 15 August 2021, 23 UT.
Remotesensing 14 05001 g015
Figure 16. Carbon monoxide time series in the six months before La Palma volcano eruption. The values are extracted at 23 UT. The years 2010, 2012, and 2016 have been automatically excluded from the analysis due to the presence of outliers.
Remotesensing 14 05001 g016
Figure 17. Distribution maps of the CO for some representative days of the various groups of anomalies depicted by the time series. The values are extracted at 23 UT.
Remotesensing 14 05001 g017
Figure 18. Distribution maps of SO2 and CO on the day of the eruption: 19 September 2021.
Remotesensing 14 05001 g018
Figure 19. Time series from 1980 to La Palma 19 Sep 2021 volcano eruption of original values of SO2, dimethyl Sulphide, Aerosol, and CO. The daily value is the mean inside a 3 degrees side square box centred on the volcano.
Remotesensing 14 05001 g019
Figure 20. CO long time series investigation, after removing seasonal trend, from 1980 until La Palma 2021 volcano eruption.
Remotesensing 14 05001 g020
Figure 21. Time series of median daily values of CSES-01 Ne measured in night-time inside the circled area of 420 km radius centred on La Palma volcano. A detrend of the time series has been applied, as explained in Appendix A. Time series median plus or minus 1.5 times the interquartile range are overplotted as thresholds to define the anomalous days in terms of night-time Ne.
Remotesensing 14 05001 g021
Figure 22. Time series of median daily values of CSES-01 Ne measured in day-time inside circled area of 420 km radius centred on La Palma volcano. A detrend of the time series has been applied, as explained in Appendix A. Time series median plus or minus 1.5 times the interquartile range are overplotted as thresholds to define the anomalous days in terms of day-time Ne.
Remotesensing 14 05001 g022
Figure 23. (A) Ne latitudinal profiles measured by CSES-01 on the same orbit shown in (B) revisited every 5 days. Only the tracks acquired during quiet geomagnetic conditions (|Dst| ≤ 20 nT and ap ≤ 10 nT) are plotted. The interquartile range is a box, extreme values are dotted grey, and outliers are plotted as red crosses and calculated every 1° latitude.
Remotesensing 14 05001 g023
Figure 24. (A) Normalized TEC time series in the year of “La Palma” volcano eruption (2021) compared with mean and standard deviation computed on historical values from 2000 to 2020. The geomagnetically disturbed time has been marked with transparent red bars and has been defined on Dst and ap, whose trend is shown in the lower panel (B).
Remotesensing 14 05001 g024
Figure 25. The cumulative number of Swarm magnetic anomalies was extracted with a threshold of kt = 2.5 within a radius of 380 km from the volcano. Subpanels (AC) represent the analysis of X-North, Y-East, and Z-Centre (vertical) components of the geomagnetic field. The analysis of the total intensity of the geomagnetic field is shown in (D), even if only five tracks are extracted as anomalous.
Remotesensing 14 05001 g025
Figure 26. Swarm Bravo track 25 with magnetic anomaly that was recorded on 18 June 2021 above La Palma volcano at 18:50:29 UT (17:37:02 LT). Geomagnetic indices were Dst = −10 nT and ap = 5 nT. Subpanels (AC) represent the residuals of X-North, Y-East, and Z-Centre (vertical) components of the geomagnetic field. The residual of the total intensity of the geomagnetic field is shown in (D), The research area with a radius of 380 km centred on the volcano (the green star) is represented by a yellow circle. The brown line is the satellite orbit projection over the ground map provided in (E).
Remotesensing 14 05001 g026
Figure 27. World SO2 map distributions for 6 selected days of June and July 1991 at 23 UT. For 11 July 1991, the distribution was a typical one, while from 12 June 1991 the Pinatubo volcano emitted a large amount of SO2 into the atmosphere, and the maximum concentration in these analyses was found on 17 June 1991. In the following weeks, the large SO2 plume was distributed in all equatorial regions with lower concentrations but larger than standard distribution, and around 12 July 1991 it reached the La Palma location, recording the highest ever value measured from 1980 to 2021 for this area. An animated gif with the daily evolution of SO2 map distributions in June and July is available in the online Supplementary Materials.
Remotesensing 14 05001 g027
Figure 28. Cumulative trends in the lithosphere, atmosphere, and ionosphere of the anomalies or events. The lithosphere layer is represented by the seismic events (cross) and their cumulative Benioff strain. The atmosphere is represented by the cumulative amount in terms of sigmas of the ground magnetic uncorrelated windows (one band for each component) and the confirmed SO2, DMS, AOT, and CO anomalies. The ionosphere shows the cumulative number of anomalies identified by CSES (Ne), Swarm (Y-East magnetic field component), and TEC. The ionospheric trend started at about −130 days because no anomalies had been identified before.
Remotesensing 14 05001 g028
Figure 29. Pointing vector of Swarm Alpha data acquired on 17 June 2021, track 10. The three components in the North, East, and Centre reference frame are represented in (AC), respectively. A 3D reconstruction of the vector is provided in panel (D), together with the green star with the position of the “La Palma” volcano, and the dashed grey line is the ground projection of the satellite track.
Remotesensing 14 05001 g029
Figure 30. Pointing vector of Swarm Bravo data acquired on 26 July 2021, track 6. The three components in the North, East, and Centre reference frame are represented in (AC), respectively. A 3D reconstruction of the vector is provided in panel (D), together with the green star with the position of the “La Palma” volcano, and the dashed grey line is the ground projection of the satellite track.
Remotesensing 14 05001 g030
Table 1. List of the anomalous atmospheric days. For each day, the evaluation of the amount of exceedance of atmospheric parameters in terms of standard deviations is provided. A comment based on the map of the specific day or group of days is also inserted.
ParameterAnomalous Day [2021]Amount of the Anomaly 1Visual Check of the Anomaly
SO215 August50.00%They seem emitted by the volcano (anomaly clearly above volcano)
16 August120.55%
DMS17 May79.76%Not emitted by the volcano.
It could be a secondary effect.
18 May20.81%
19 May97.22%
20 May95.44%
21 May484.99%
22 May400.04%
23 May130.18%
8 June66.11%Not emitted by the volcano, but value closer to the island. It could be a secondary effect.
9 June484.08%
10 June417.27%
11 June270.24%
12 June246.10%
15 August80.31%Not emitted by the volcano.
It could be a secondary effect.
16 August190.41%
17 August291.80%
18 August231.11%
19 August174.06%
Aerosol25 March103.88%Spatially coincide with the caldera of the Canarias volcano system
27 March19.38%
17 May19.38%Spatially coincide with the caldera of the Canarias volcano system
18 May325.26%
21 May38.09%
8 June346.98%It seems to be a sandstorm from the Sahara desert.
9 June834.43%
10 June180.31%
11 June285.23%
12 June4.29%
12 July164.26%It is not centred on the volcano, but an indirect effect cannot be totally excluded.
13 July86.10%
15 August105.87%It seems not related to the volcano
16 August76.08%
CO24 March16.85%Emission close to the volcano
25 March84.75%
19 April16.61%It seems to be due to another source and later transported over the research area
15 May3.59%Not clear as there is another phenomenon but also emission potentially related to the volcano
1 August7.30%The emission seems to come from the volcano.
2 August30.76%Not related to the volcano.
9 August93.07%It could be related to the volcano.
10 August13.09%
19 August2.88%It does not seem to be related to the volcano
20 August24.88%
26 August38.37%Spatially not localised above the volcano.
4 September32.02%It could be related to other volcanoes in the area.
7 September143.52%It could be related to the volcano even if it is a very wide anomaly
8 September100.41%
9 September85.10%
10 September29.40%
13 September91.86%Some days are spatially well related to the volcano.
14 September174.76%
15 September232.07%
16 September50.25%
18 September33.58%
19 September 215.27%“Co-eruption” emission.
1 The value is expressed on how many sigmas the parameter exceeded two standard deviations. 2 This is the day of the La Palma eruption.
Publisher’s Note: MDPI stays neutral with regard to jurisdictional claims in published maps and institutional affiliations.