Article

Integration of Remote Sensing and Offshore Geophysical Data for Monitoring the Short-Term Morphological Evolution of an Active Volcanic Flank: A Case Study from Stromboli Island

by
Daniele Casalbore
1,2,*,
Federico Di Traglia
3,
Claudia Romagnoli
4,
Massimiliano Favalli
5,
Teresa Gracchi
6,
Carlo Tacconi Stefanelli
7,
Teresa Nolesini
7,
Guglielmo Rossi
7,
Matteo Del Soldato
6,
Irene Manzella
8,9,
Paul Cole
9,
Nicola Casagli
3,6 and
Francesco Latino Chiocci
1,2
1
Department of Earth Sciences, Sapienza University of Rome, Piazzale Aldo Moro 5, 00155 Rome, Italy
2
Institute of Environmental Geology and Geo-Engineering, UOs Sapienza University of Rome, National Research Council, Piazzale Aldo Moro 5, 00155 Rome, Italy
3
Istituto Nazionale di Oceanografia e di Geofisica Sperimentale—OGS, Borgo Grotta Gigante 42/C, 34010 Sgonico, Italy
4
Department of Biological, Geological and Environmental Sciences, University of Bologna, 40121 Bologna, Italy
5
Istituto Nazionale di Geofisica e Vulcanologia, Sezione di Pisa, Via Cesare Battisti, 53-56125 Pisa, Italy
6
Dipartimento di Scienze della Terra, Università degli Studi di Firenze, Via La Pira 4, 50121 Florence, Italy
7
Centro per la Protezione Civile, Università degli Studi di Firenze, Piazza San Marco 4, 50121 Florence, Italy
8
Department of Applied Earth Sciences (AES), Faculty of Geo-Information Science and Earth Observation (ITC), University of Twente, 7522 NB Enschede, The Netherlands
9
School of Geography, Earth and Environmental Sciences, University of Plymouth, Drake Circus, Plymouth PL4 8AA, UK
*
Author to whom correspondence should be addressed.
Remote Sens. 2022, 14(18), 4605; https://doi.org/10.3390/rs14184605
Submission received: 13 July 2022 / Revised: 5 September 2022 / Accepted: 12 September 2022 / Published: 15 September 2022
(This article belongs to the Special Issue Multi-Sensor Remote Sensing Data for Volcanic Hazards Monitoring)

Abstract

:
The Sciara del Fuoco (SdF) collapse scar at Stromboli is an active volcanic area affected by rapid morphological changes due to explosive/effusive eruptions and mass-wasting processes. The aim of this paper is to demonstrate the importance of an integrated analysis of multi-temporal remote sensing (photogrammetry, COSMO-SkyMed Synthetic Aperture Radar amplitude image) and marine geophysical data (multibeam and side scan sonar data) to characterize the main morphological, textural, and volumetric changes that occurred along the SdF slope in the 2020–2021 period. The analysis showed the marked erosive potential of the 19 May 2021 pyroclastic density current generated by a crater rim collapse, which mobilized a minimum volume of 44,000 m3 in the upper Sciara del Fuoco slope and eroded 350,000–400,000 m3 of material just considering the shallow-water setting. The analysis allowed us also to constrain the main factors controlling the emplacement of different lava flows and overflows during the monitored period. Despite the morphological continuity between the subaerial and submarine slope, textural variations in the SdF primarily depend on different processes and characteristics of the subaerial slope, the coastal area, the nearshore, and “deeper” marine areas.

Graphical Abstract

1. Introduction

Volcanoes are highly dynamic environments, whose evolution is affected by the alternance between constructive and destructive processes acting at different spatial and temporal scales [1,2,3]. These processes continuously reshape volcanic flanks, making their monitoring and linking with eruptive and/or erosive phenomena through time fundamental for understanding both the morphological evolution of volcanic edifices and the genesis of specific morphological features, which can be used as “geomorphological markers” in other volcanic settings. Furthermore, morphological changes are often related to sudden and catastrophic phenomena (pyroclastic flows or landslides), which represent a main geohazard for the surrounding communities. This issue is particularly relevant in the case of insular volcanoes, where these phenomena can directly impact subaerial/submarine infrastructures or indirectly generate tsunami waves, as recently observed for the 2002 landslide at Stromboli [4,5] or the 2018 Anak Krakatau collapse [6].
Notwithstanding the direct link between the morphogenesis of subaerial and submarine volcanic flanks, integrated studies dealing with land-sea correlations are rare and have been mainly limited to large sector collapses involving the entire volcanic edifice [7,8,9]. In the last few decades, some attempts have been carried out in this framework where shallow-water morphologies (e.g., insular shelf) were correlated with the facing island geology, providing useful insights on the island’s vertical movements, the identification of paleo-centres or the mechanisms occurring when lava flows enter the sea [10,11,12,13]. Even fewer studies have tried to integrate subaerial and submarine morphological changes during eruptive events affecting volcanic flanks [14,15,16,17,18]. At Stromboli, the latter studies were mainly focused on the Sciara del Fuoco depression (Figure 1), representing the last of repeated lateral collapses that affected the NW flank in the last 13 ka [19,20].
Since its formation, the steep SdF slope has funneled towards the sea a large amount of volcaniclastic material produced by the persistent Strombolian activity [21] emitted by the summit crater terrace (Figure 1b). This persistent activity is occasionally interrupted by paroxysmal or effusive eruptions [22], during which the stress-strain conditions of the SdF slope can be modified, leading to the development of mass-wasting processes that range over different spatial scales [4,23,24,25,26]. During the 2002 eruptive crisis, two landslides (mobilized volumes in the order of 10 × 106 m3) were triggered by dyke intrusion in the upper part of the edifice. These almost simultaneously affected both the submarine and subaerial part of the SdF and generated tsunami waves with run-up values up to 10 m [4,26,27], highlighting the geohazard related to these processes. Since then, the morphological evolution of the SdF slope has been carefully monitored through repeated topo-bathymetric surveys, which are part of a more complex monitoring network encompassing ground-based devices as well as satellite monitoring systems [28].
In this study, we show the results of the integrated land-sea morphological monitoring of the SdF slope in the period encompassing two different topo-bathymetric acquisitions in February 2020 and July 2021. During that period, Stromboli exhibited several phases of intense volcanic activity (Table 1), with strong explosions and frequent lava overflows [29]. Some of these overflows (31 March 2020 and 19 May 2021) were associated with the collapse of the rim of the NE crater area (NEC hereafter), which produced avalanches of glowing rocks down the SdF. Of these collapses, the one with the largest volume (~0.5 × 10⁶ m3) occurred on 19 May 2021. A similar phenomenon was also observed at the beginning of the 12 January 2013 lava overflow [30] and on the 6 August 2014 event [31]. The 19 May 2021 NEC rim collapse evolved into a small pyroclastic density current (PDC, hereafter). Once it reached the sea, the PDC generated a tsunami wave of approximately 20 cm in height [32], and its upper and more diluted part travelled over the sea surface for about 1 km [33]. The PDC was followed by the emission of lava flows both in the following five days and in June 2021 (Table 1 and Figure 2).
This provided the possibility of comparing high-resolution digital elevation models (DEMs), obtained by photogrammetry using images collected by PLÉIADES satellites and Unmanned Aerial Vehicle (UAV, hereafter), with repeated multibeam (MBES, hereafter) bathymetries collected before and after the 2021 event. This data allowed us to observe the downslope evolution of these phenomena and to reliably estimate the eroded and accreted volumes along the entire volcanic slope (both subaerial and submarine). This information provided useful insights for hazard assessment because the volume and behaviour of these flows strongly control their tsunamigenic potential, as highlighted by the PDCs which entered the sea in July and August 2019, producing tsunami waves approximately 1.5 m in height [16,24]. In this paper, we also show preliminary results of the first comparison between the COSMO-SkyMed Synthetic Aperture Radar (CSK-SAR) amplitude image of the SdF subaerial flank with MBES and Side Scan Sonar (SSS, hereafter) backscatter of the submarine flank with the aim of better constraining the main superficial textural changes associated with the emplacement of different volcanic deposits along the SdF slope.

2. Materials and Methods

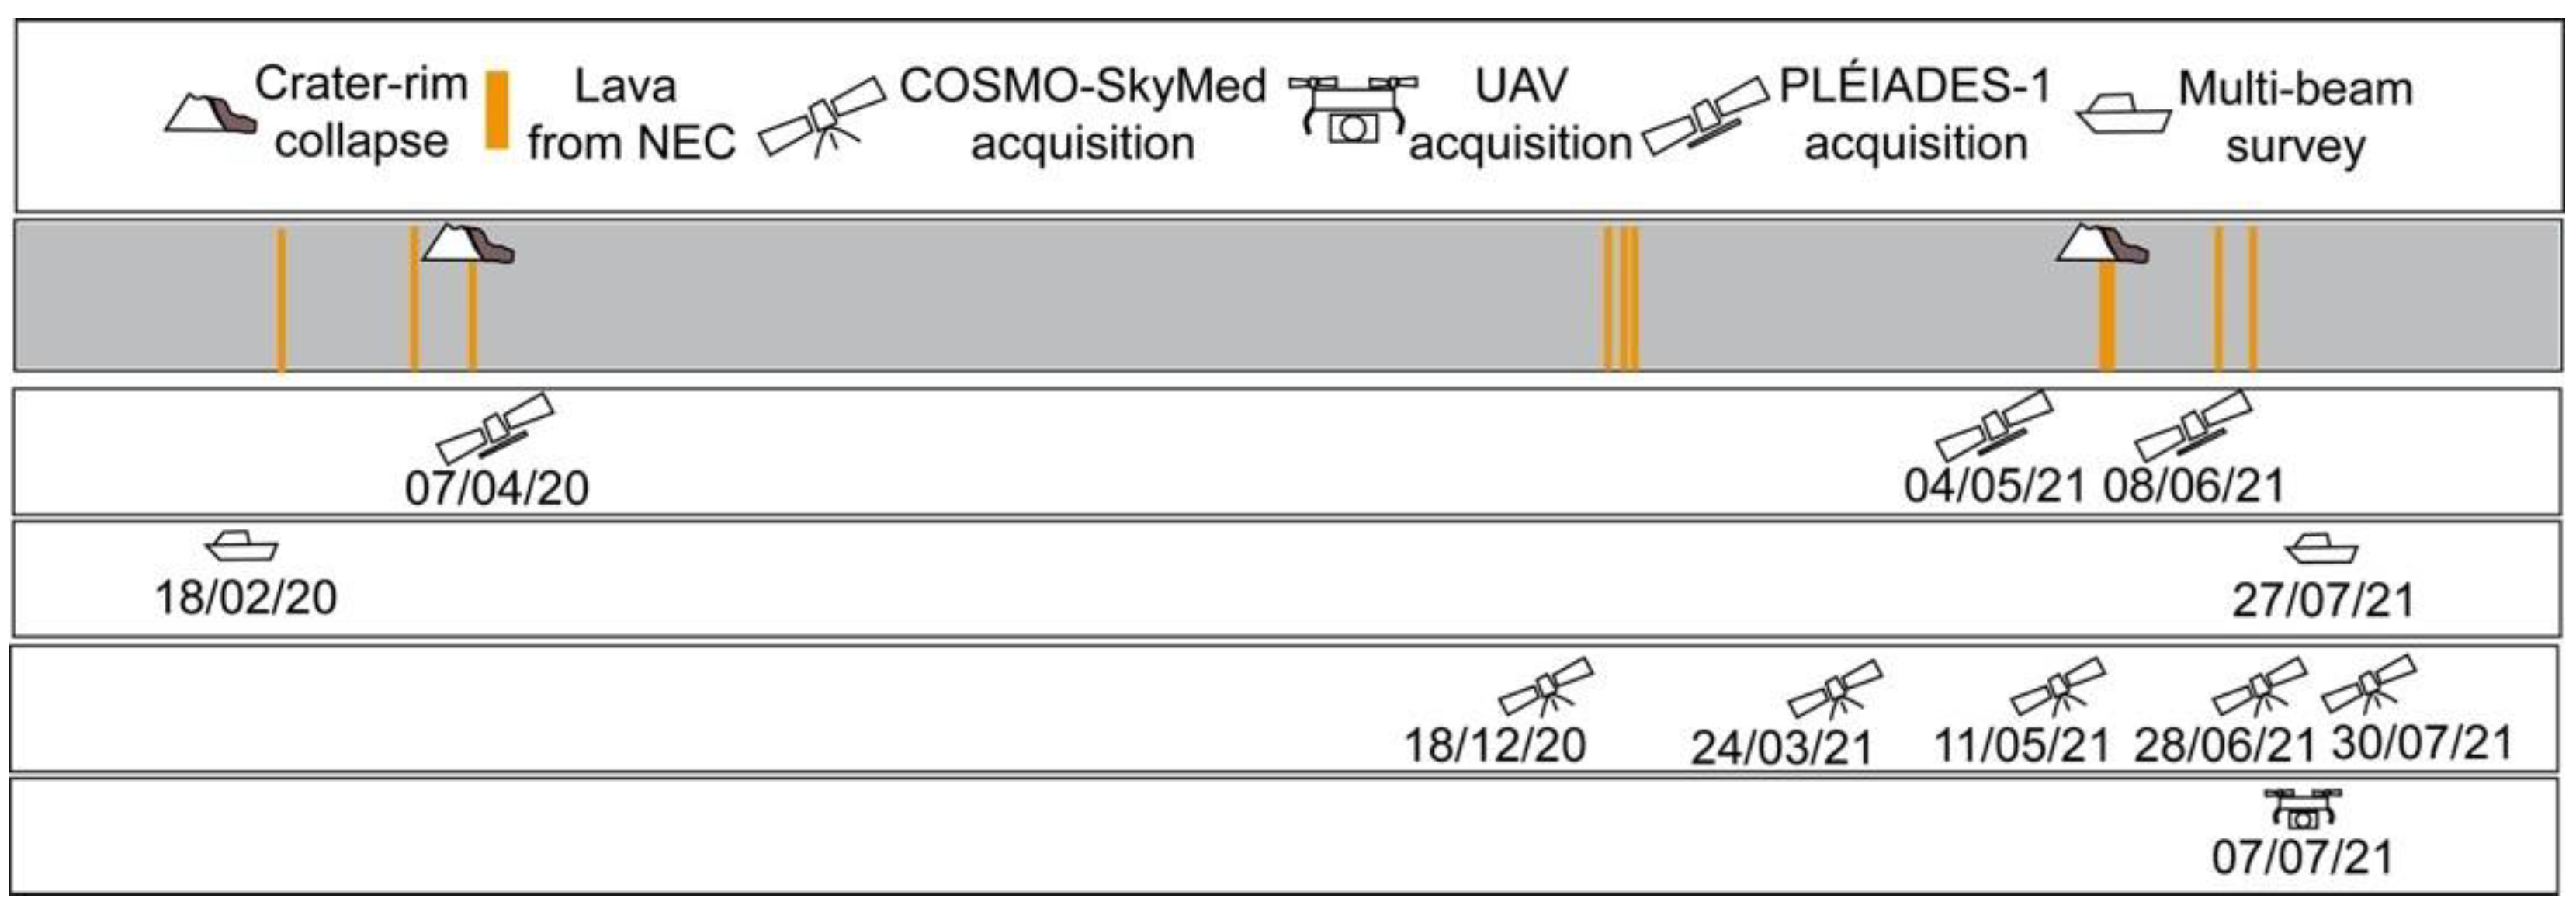
The study was mainly based on the topo-bathymetric comparison of the subaerial and shallow-water submarine part of the SdF slope in the period between February 2020 and July 2021. All the available remote sensing and geophysical data were analyzed and integrated (Table 2 and Figure 3).

2.1. Topo-Bathymetric Monitoring of the SdF Slope and CKS-SAR Amplitude Image

The topographic change detection of the SdF subaerial slope was obtained by comparing DEMs generated both from PLÉIADES-1 tri-stereo satellite imagery [35] and a UAV survey. PLÉIADES-1 data were acquired on 7 April 2020, 4 May 2021, and 8 June 2021, while the UAV survey was performed on 7 July 2021 (Table 2 and Figure 3). To assess the accuracy of the heights and their horizontal position in the PLÉIADES-1 DEM, ground control points (GCPs) were collected (cartographic XY standard deviation: 0.15 m).
The photogrammetric UAV surveys were carried out with a Saturn-mini drone, patented by the Department of Earth Sciences of the University of Florence and specifically developed for extreme environmental uses [36]. The drone was equipped with a GNSS receiver with a single frequency, multi-constellation, non-RTK capable device and carried a Canon IXUS 160 camera with 20 Megapixel resolution. The flight was performed on 7 July 2021 by acquiring 7 strips parallel to the slope at a height of about 80 m AGL (above ground level) with nadiral camera position. Previous flights carried out over the same area showed deformation of several meters in the centre of the SdF slope [37] due to intrinsic limitations of the photogrammetric technique and to the absence of GCPs in the central part of the slope. To overcome these issues and correct the photogrammetric surveys, 15 points from a LiDAR survey carried out in 2012 were used as virtual GCPs to co-register all the UAV surveys (see also Section 2.3). To further improve the results, point clouds obtained by the Structure-from-Motion technique were finally realigned to enhance the georeferencing accuracy using the Fine Registration tool, Iterative Closest Point (ICP), available within the CloudCompare software. After all the processing steps, the generated DEM had a resolution of 4.8 cm/pixel with a GCP georeferencing average error of 1.2 m.
CSK X-band (3.1 cm of wavelength) SAR images were acquired five times from 18 December 2020 to 30 July 2021 in descending orbit (Table 3 and Figure 3) for both the analysis of SAR change detection (from December 2020 to June 2021) and the backscattering SAR signal (30 July 2021). Data from SAR sensors in volcanic environments have often been used to map areas affected by lithological and morphological changes, such as areas impacted by eruptive and post-eruptive (landslides or floods) phenomena [23,38,39,40].
The SAR backscattering is determined by several factors, such as the local morphology and the surface microrelief related to the grain-size and the dielectric constant of the material at the surface [41,42]. To define which roughness scale affects the backscatter properties, the Rayleigh criterion [43] was applied. In this way, the root mean squared height (hrms) variation on horizontal surfaces was evaluated following [41], and, for the CSK-SAR images used in this study, the hrms was approximately 4 mm. In an area with volcaniclastic sedimentation, this indicates that it is possible to identify the variation of the sedimented material between fine-grained (i.e., ash-dominated deposits) and coarse-grained (i.e., blocks and bombs-dominated deposits, such as grain flows or ‘a’ā lava surfaces). Local morphology produces irregularities with wavelengths at least twice as large as the satellite resolution cell due to changes in the local incidence angles, and it is not directly possible to separate the local morphological effects from the grain-size influence. Therefore, the term “roughness” is used to represent a combination of both factors [41]. The CSK-SAR images were processed using the free SNAP software [44] both for the SAR change detection analysis and for the comparison with the SSS backscattering signal. The elaboration of the SAR images in SNAP consisted of: (i) the co-registration of all the images using the offset refinement based on the Shuttle Radar Topography Mission (SRTM) DEM at 1 arc second (made available by the United State Geological Survey) forming one unique stack and (ii) cropping around the target area. The cropped stack was then geocoded for correcting SAR geometric distortions using SRTM DEM to produce SAR orthorectified map-projected images. The backscattered intensity of each image was transformed into an amplitude image and then decibel-scaled, converting the data into a virtual band with the expression 10 × log10 (amplitude). In addition, speckle filtering was applied to improve the quality of the images, reducing the salt-pepper texture (speckle) [45].
RGB colour composites using multitemporal CSK-SAR images enabled the detection and interpretation of surface changes of the SdF slope. The use of the colour composition using the band and its ratio is a simple and fast approach to highlight strong changes [41]. The colour composition was created taking into consideration a couple of images and inserting the oldest in the red band, the newer in the green band, and its ratio (old/new) in the blue band.

2.2. Bathymetric Monitoring of the SdF Slope and MBES/SSS Backscatter Data

Seafloor changes were computed through the difference between multibeam bathymetries collected in February 2020 and July 2021 (Table 2 and Figure 3; for details see Section 2.3). The first bathymetric survey was realized between 1 and 400 m water depth on 18 February 2020 by “Arena Sub SRL” onboard the small vessel “Valerio” using the multibeam system Reson Seabat 7125 working at a frequency of 200 kHz. The second bathymetric survey was realized between 5 and 420 m water depth on 27 July 2021 by “PRISMA SRL” onboard the 16 m-long “Euribia” vessel using the multibeam system Teledyne Reason SeaBat T50-P working at a frequency of 200 kHz. In both surveys, data were positioned through Trimble Applanix Pos Mv Wave Master II to guarantee a spatial positioning on the order of few decimeters at maximum. Each survey was preceded by the collection of sound velocity profile data through a Sontek CastAway probe. During the surveys, a mini SVS Valeport probe was used to update in real-time the sound velocity values close to the flat face of the multibeam transducer, because any error in this value would introduce an angular error both in the beam angle and the ray-tracing. For both surveys, tidal corrections were applied using Strombolicchio and Ginostra tide gauge data recorded by I.S.P.R.A, and data processing was performed using Teledyne PDS 2000 through the application of geometrical/statistical filters and the manual editing of fake soundings. Data were gridded with a cell size of 3 m for the entire dataset, and a grid with a cell size of 1 m was realized at depths <100 m. Gridded data were visualized as shaded relief maps, isobaths, perspective images, or slope gradient maps through the Global Mapper 15 software (Hallowell, ME, USA).
Backscatter data were collected both with MBES and SSS systems; the latter is a towed device, emitting an acoustic impulse from its side [46]. In both systems, the backscattered energy is the result of the interaction between the emitted acoustic energy and the seafloor. Multi-directional scattering occurs at the interface, and some of the scattered energies are scattered back to the instrument. The backscatter strength depends on several factors, including the angle of incidence, the roughness of the seafloor, and the scattering behaviour of the material at the seafloor [47]. Depending on the frequency of the acoustic signal, some acoustic energy is refracted into the sediments and scattered at deeper interfaces, resulting in the registration of volume backscatter. This effect increases with decreasing sonar frequency; thus, in our case, this effect can be considered negligible considering the very high frequency used in both systems, i.e., 200 and 600 kHz for MBES and SSS devices, respectively.
During the 2021 bathymetric survey, MBES backscatter data were collected and visualized through Global Mapper 15 in grey-colour scale. In addition, SSS data were collected in the first 200 m water depth along 4 lines using the towed EDGETECH 4125 system working at a frequency of 600–1600 kHz. The collected SSS device generally flew 10–20 m above the seafloor, with 125 m-wide channels on each side. SSS data were merged to obtain a single mosaic in geotiff format, then imported in Global Mapper 15 and co-registered to the bathymetry using homologous features (scarps, prominent blocks, and so on) identified in the two datasets.

2.3. DEM Co-Registration, Error Estimation, and Topographic Change Detection

Topographic change detection using multi-temporal DEMs was performed by differencing two DEMs of the same area derived from data acquired at different times to create elevation difference maps. This calculation is typically affected by errors associated with mismatches between the two DEMs, which leads to artefacts in elevation differences (Δh) [48]. These errors can be quantified by measuring the DEM differences in areas where the two DEMs are expected to display no relevant change. In this work, the RMS displacement errors of the subaerial DEMs were calculated, taking as reference a 1-m-resolution DEM with high vertical and horizontal accuracy. The used reference DEM is a LiDAR-derived DEM elaborated from data acquired during an airborne survey that was carried out in May 2012 using a Leica ADS80 sensor, which has an instrumental vertical and horizontal accuracy of 0.10–0.20 and 0.25 m, respectively [23]. The resulting RMS displacement errors (RMSE0 in Table 4) for the PLÉIADES-derived DEMs before the co-registration procedure were very high, being of 4.35 m, 4.81 m, and 4.01 m for the April 2020, the May 2021, and the June 2021 DEMs, respectively. The resulting RMS displacement error for the UAV-derived July 2021 DEM was 1.39 m.
These errors can be greatly reduced by accurately co-registering these DEMs to the 2012 reference DEM in the benchmark areas, i.e., areas without significant morphological changes. In this work, the co-registration was based on the minimization of the root mean square (RMS) difference between each DEM and the 2012 DEM by iteratively varying the three angles of rotation, the translation, and the magnification or reduction factor of the DEM by using a custom-made algorithm based on the MINUIT numerical minimization software library (e.g., [49]). The MINUIT co-registration procedure lowered the RMS displacement errors for the PLÉIADES DEMs from values above 4 m to values around 1 m, i.e., 0.61 m, 1.26 m, and 0.89 m for the April 2020, the May 2021, and the June 2021 DEMs, respectively (RMSE1 in Table 4). The RMS displacement error for the UAV-derived July 2021 DEM was reduced from 1.39 m to 0.9 m.
In this work, the following differences between the co-registered DEMs were calculated for the subaerial part: (i) May 2021- April 2020 DEMs; (ii) June 2021–May 2021 DEMs; (iii) July 2021–June 2021 DEMs; (iv) July 2021–April 2020 DEMs, which covered the whole period of data acquisitions. The RMS difference in areas not affected by changes (σΔZ) for these differences were, respectively, 1.07 m, 1.03 m, 1.52 m, and 1.93 m (Table 5).
The bathymetric data were processed using the same method, but the displacement error did not lower significantly after the co-registration procedure, so no corrections were applied. The bathymetric differences between July 2021 and February 2020 had a σΔZ of 0.41 m, which is lower than those of the co-registered subaerial DEMs (Table 5).
The differences between two successive co-registered DEMs were used to detect and outline the extent of areas that were affected by topographic changes (Figure 4 and Figure 5) and to calculate their volume. The volume (V) emplaced or lost between two acquisitions was calculated from the DEM difference according to the equation: V = ΣiΔx2Δzi, where Δx is the cell size and Δzi is the height variation within the grid cell i. These values were then summed for all the cells in the selected areas in which the volume changes were calculated. An upper bound on the error for the volume estimate was given by assigning to each pixel the maximum possible error, i.e., ErrV, high = A σΔZ, where A is the investigated area [48].

3. Results

3.1. Topo-Bathymetric Changes

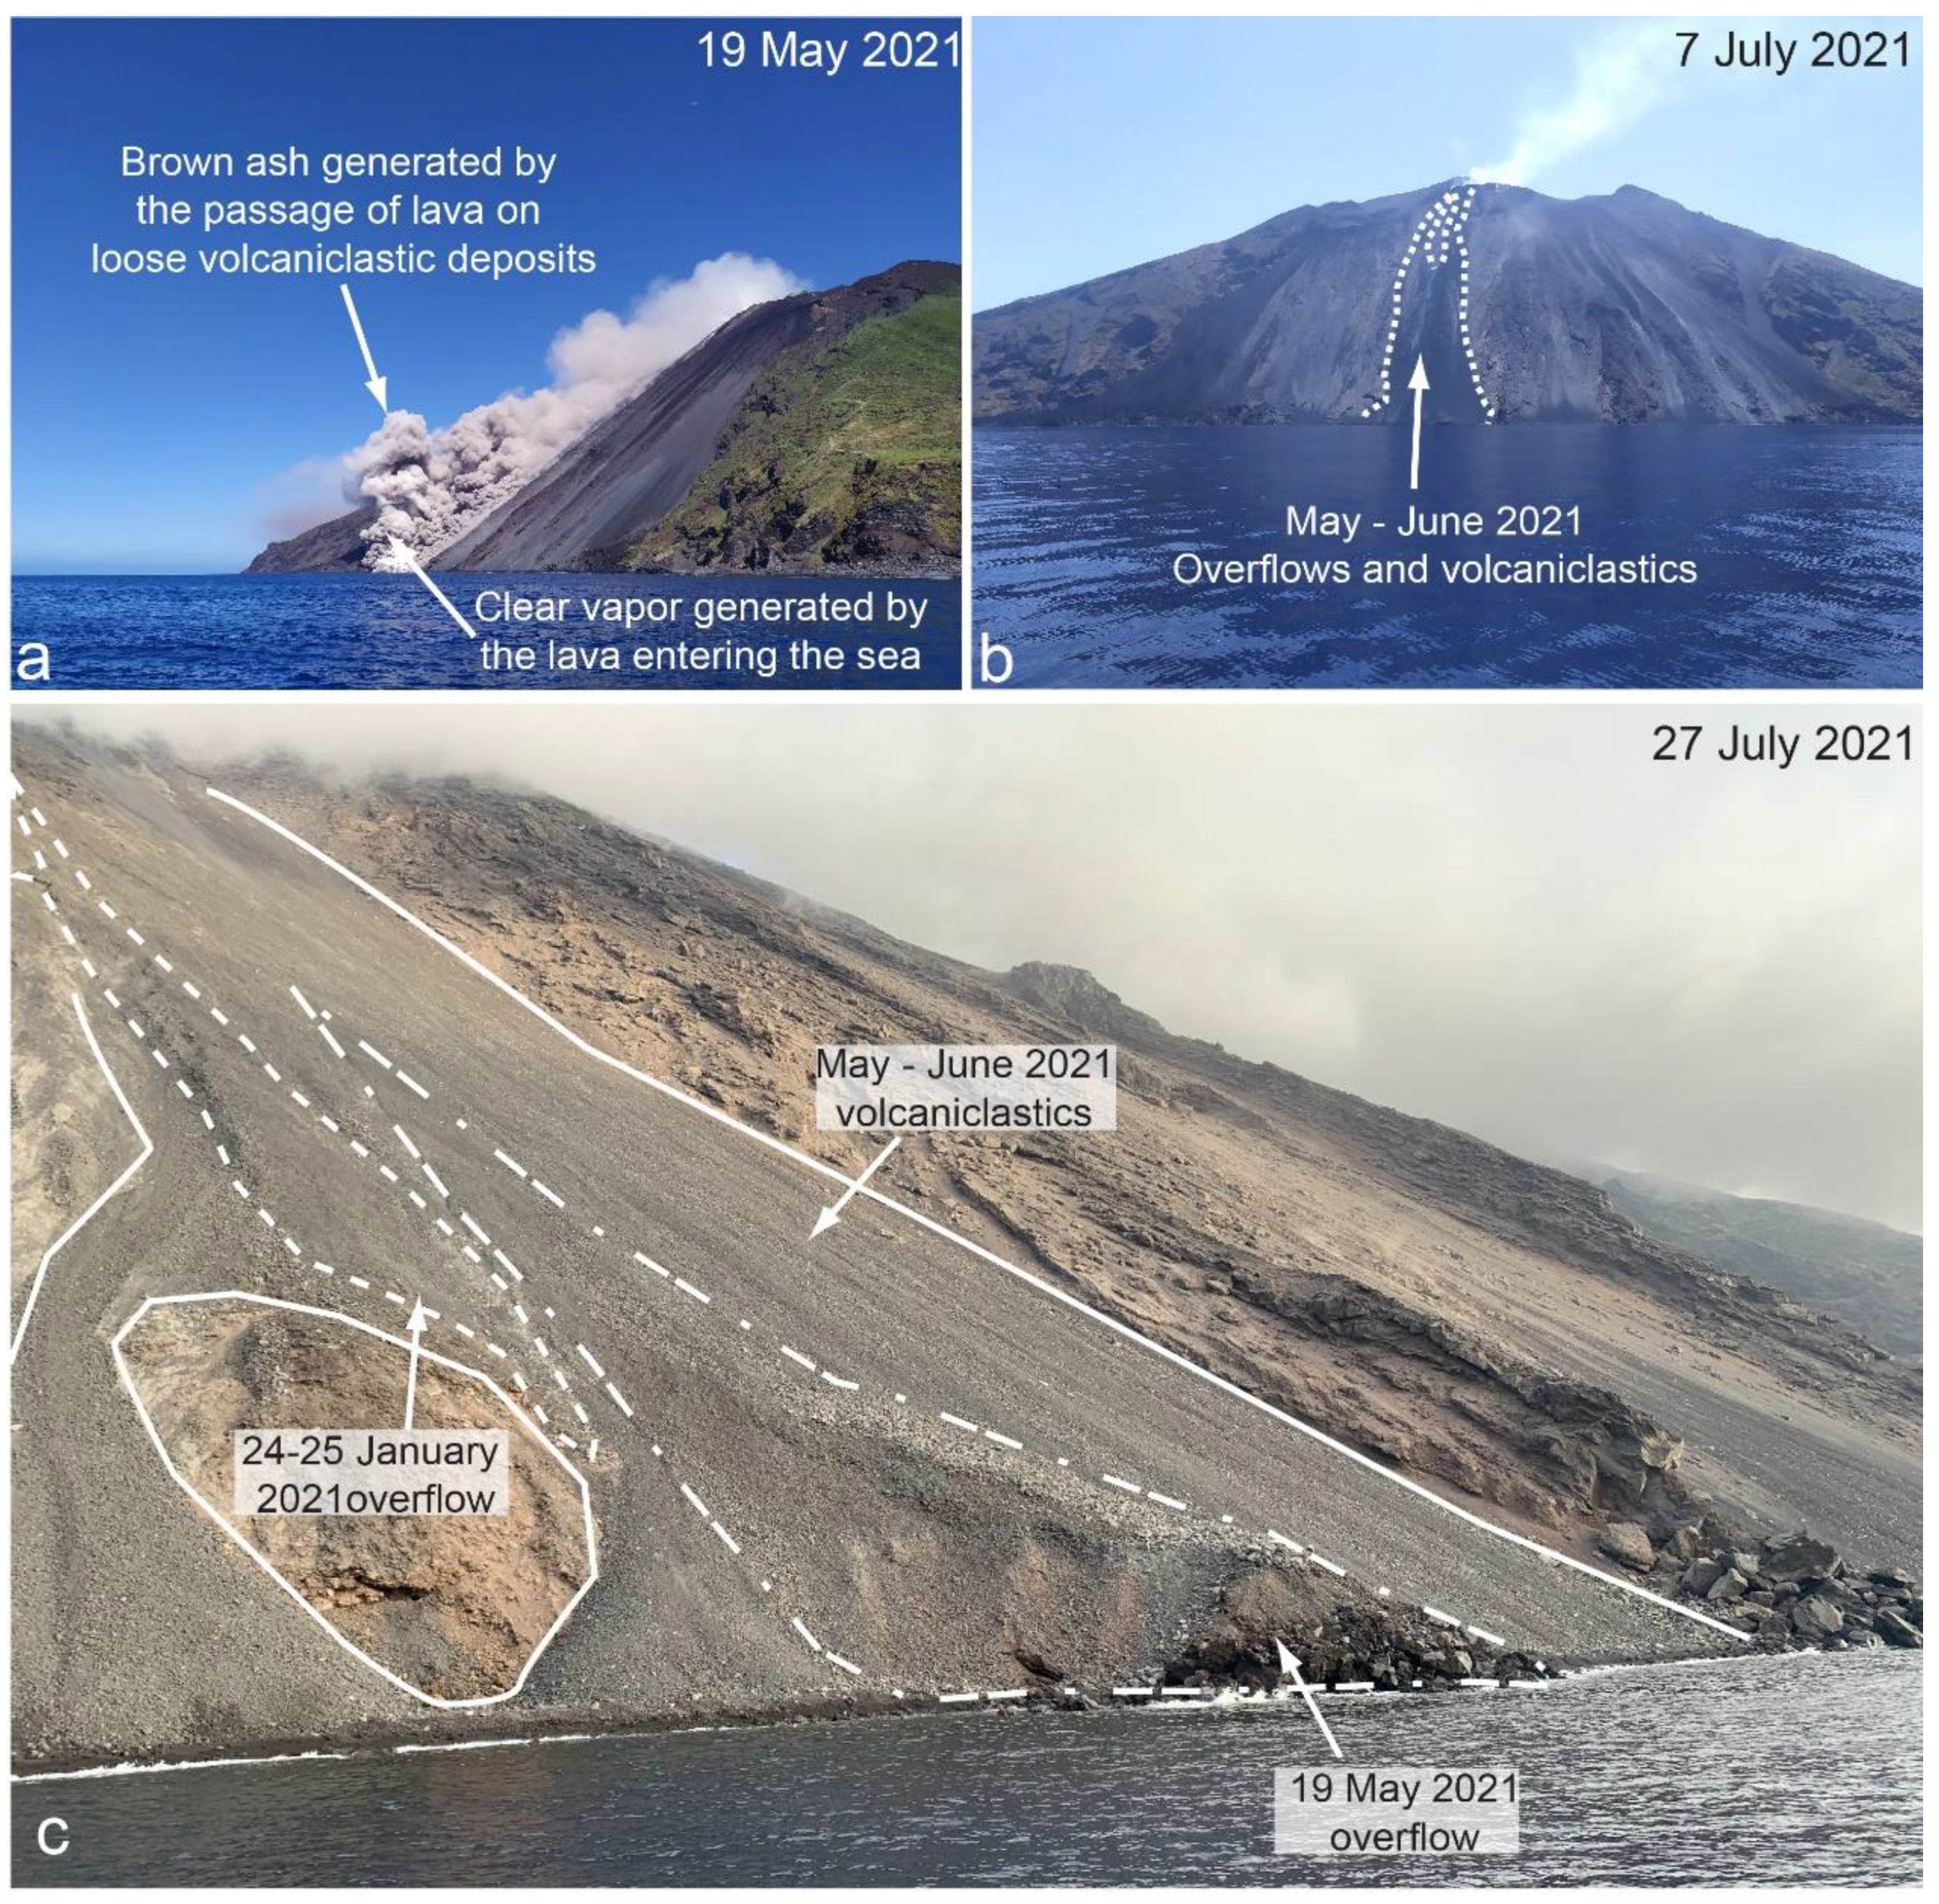
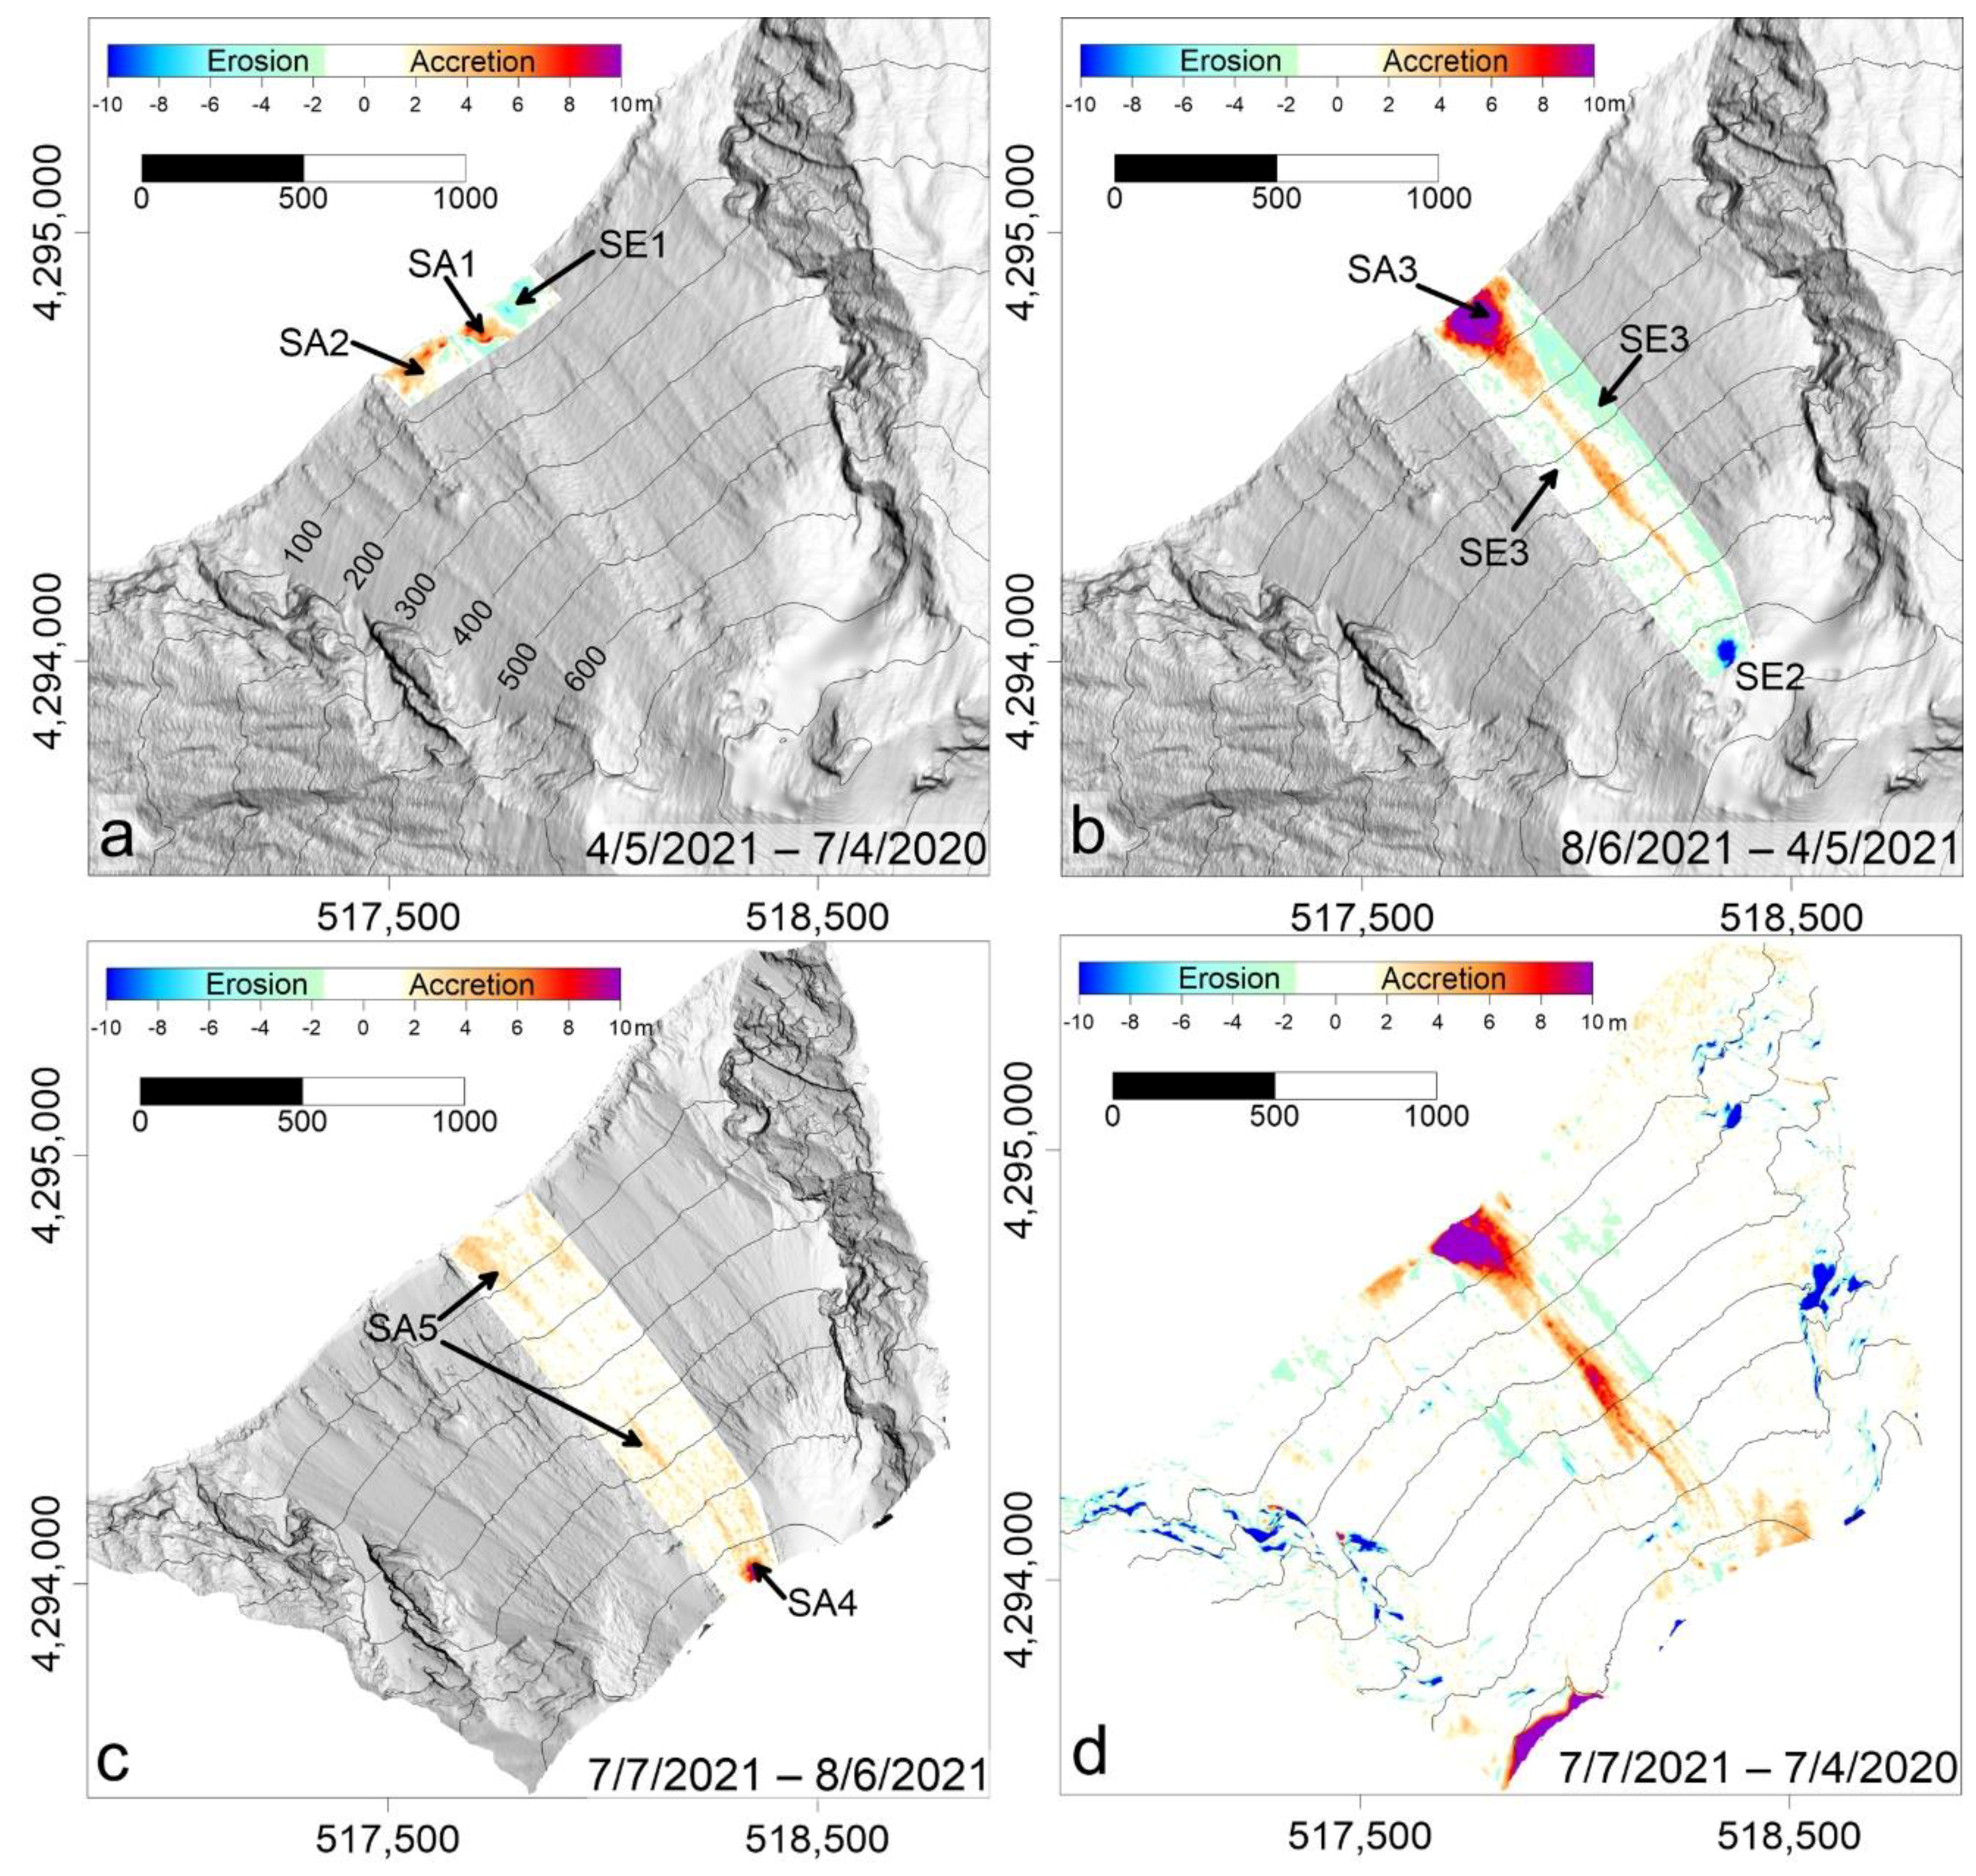
The availability of four DEMs generated from subsequent PLÉIADES-1 tri-stereo satellite imagery and UAV surveys (in April 2020 and May, June, and July 2021; see Table 2 and Figure 3) allowed the detection of the main changes that occurred along the SdF subaerial slope at the various time intervals. The first elevation difference map obtained between May 2021 (before the NE crater rim collapse) and April 2020 DEMs showed minor morphological changes throughout the SdF (Figure 4a). Changes mainly occurred in the central SdF coastal sector, with minor slope erosion (area SE1) or with two areas of accretion (SA1 and SA2), accounting for volumes of −30,000 ± 10,000 m3, +25,000 ± 8000 m3, +37,000 ± 13,000 m3, respectively (Table 6). In contrast, the elevation difference map obtained between June 2021 and May 2021 DEMs showed significant changes both in the outer rim of the NE crater and along the central part of the SdF slope (Figure 4b). In the first site, slope erosion (SE2) dominated with a maximum eroded thickness of approximately 30 m, accounting for a volume of −44,000 ± 3000 m3 (Table 6). Along the central part of the SdF, the main morphological changes were associated with slope accretion (SA3), which extended from 630 m asl down to the coastline, accounting for +325,000 ± 83,000 m3. In detail, a narrow and thin (2–4 m) stripe of slope accretion was present in the upper part of the slope, thickening up to 12 m in the coastal sector and enlarging in a fan-shaped geometry downslope of 200 m asl (Figure 4b). This slope accretion was also associated with the formation of a convex-seaward coastline, which prograded for approximately 35 m with respect to the previous (4 May) coastline. This convex-seaward coastline is made up of massive lava flows at the base, now partly eroded and overlain by brecciated lavas and coarse-grained volcaniclastic material, as visible from oblique photos (Figure 2c). Differently, the surrounding areas were dominated by small-scale fan-shaped features related to the emplacement of lava breccias and volcaniclastic coarse-grained material, as recognizable in the June 2021 DEM (Figure 5a and Figure 6b). It is noteworthy that slope accretion shifted laterally to slope erosion (SE3), especially in the upper part of the slope (above 200 m asl), giving way to a 200 m-wide erosive stripe linked upslope with the main SE2 area (Figure 4b). The volume related to SE3 was difficult to estimate as the slope erosion was very thin (on average 1.16 m) slightly above the σΔZ (Table 6).
The elevation difference map obtained between the July 2021 and June 2021 DEMs (Figure 4c) showed very minor morphological changes with respect to the previous map and was mainly characterized by slope accretion both in the summit crater area (SA4) and along the central part of the SdF (SA5), especially close to the coastal sector. The volumes estimated were of +20,000 ± 6000 m3 and +50,000 ± 39,000 m3 for SA4 and SA5, respectively (Table 6).
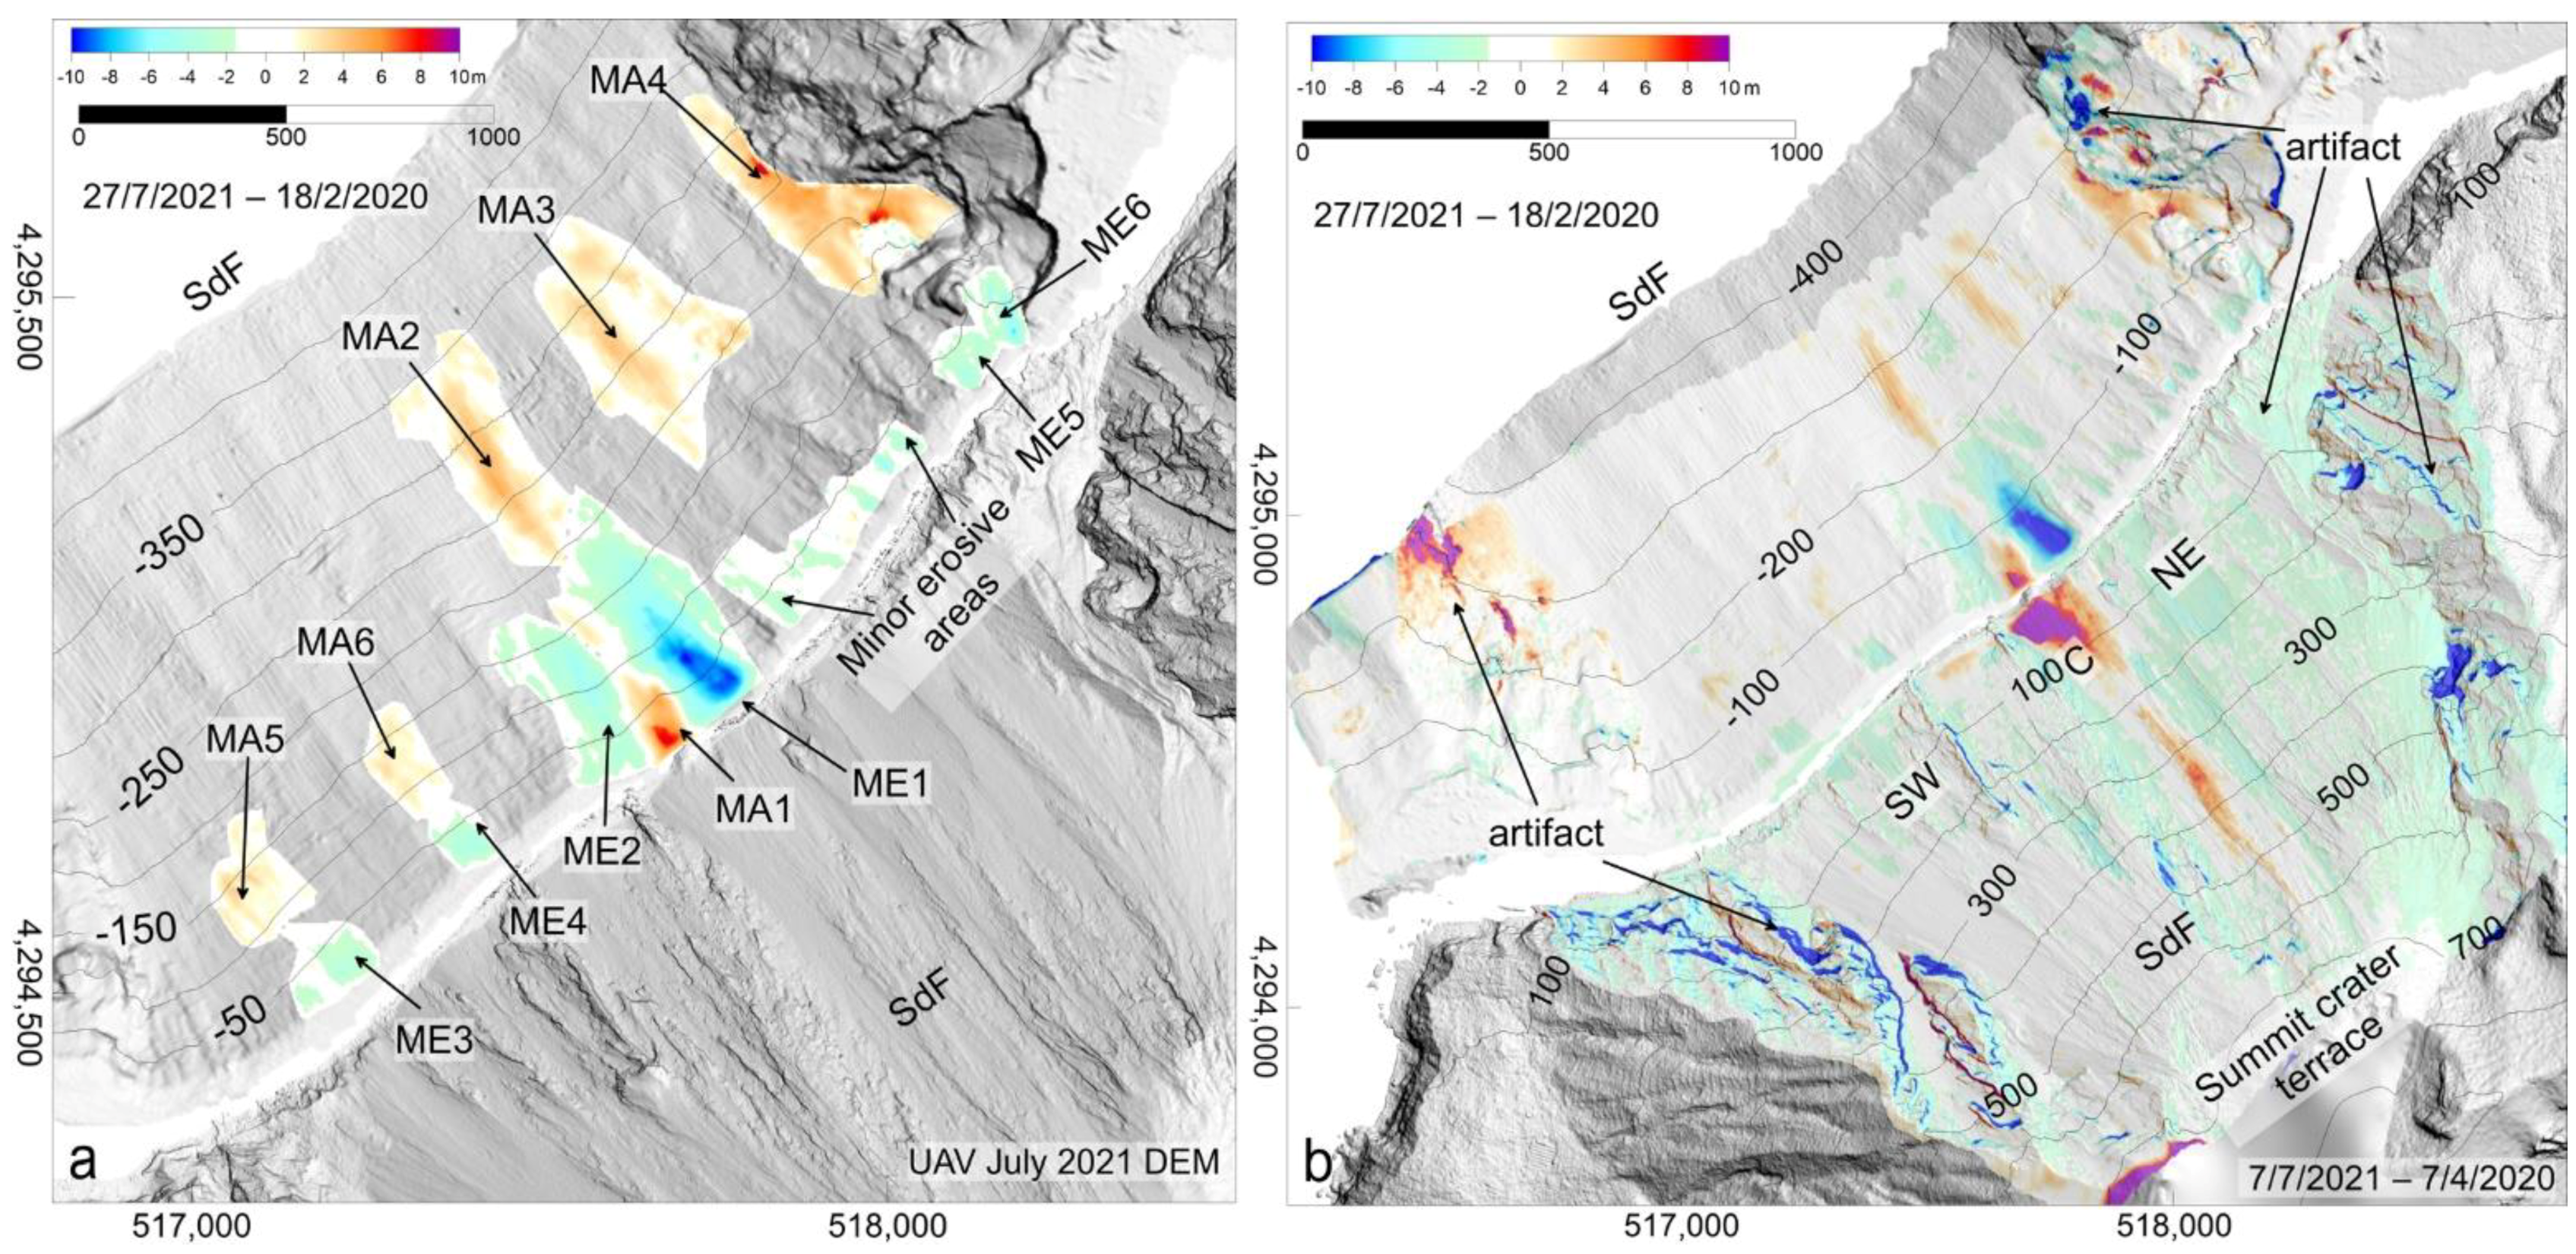
Regarding the submarine part of the SdF, the elevation difference map obtained between the February 2020 and July 2021 bathymetries (Figure 5a) showed that the main morphological changes occurred in the first 200 m of the water depth (wd, herafter), dominated by seafloor erosion (ME) and alternated with smaller areas of seafloor accretion (MA).
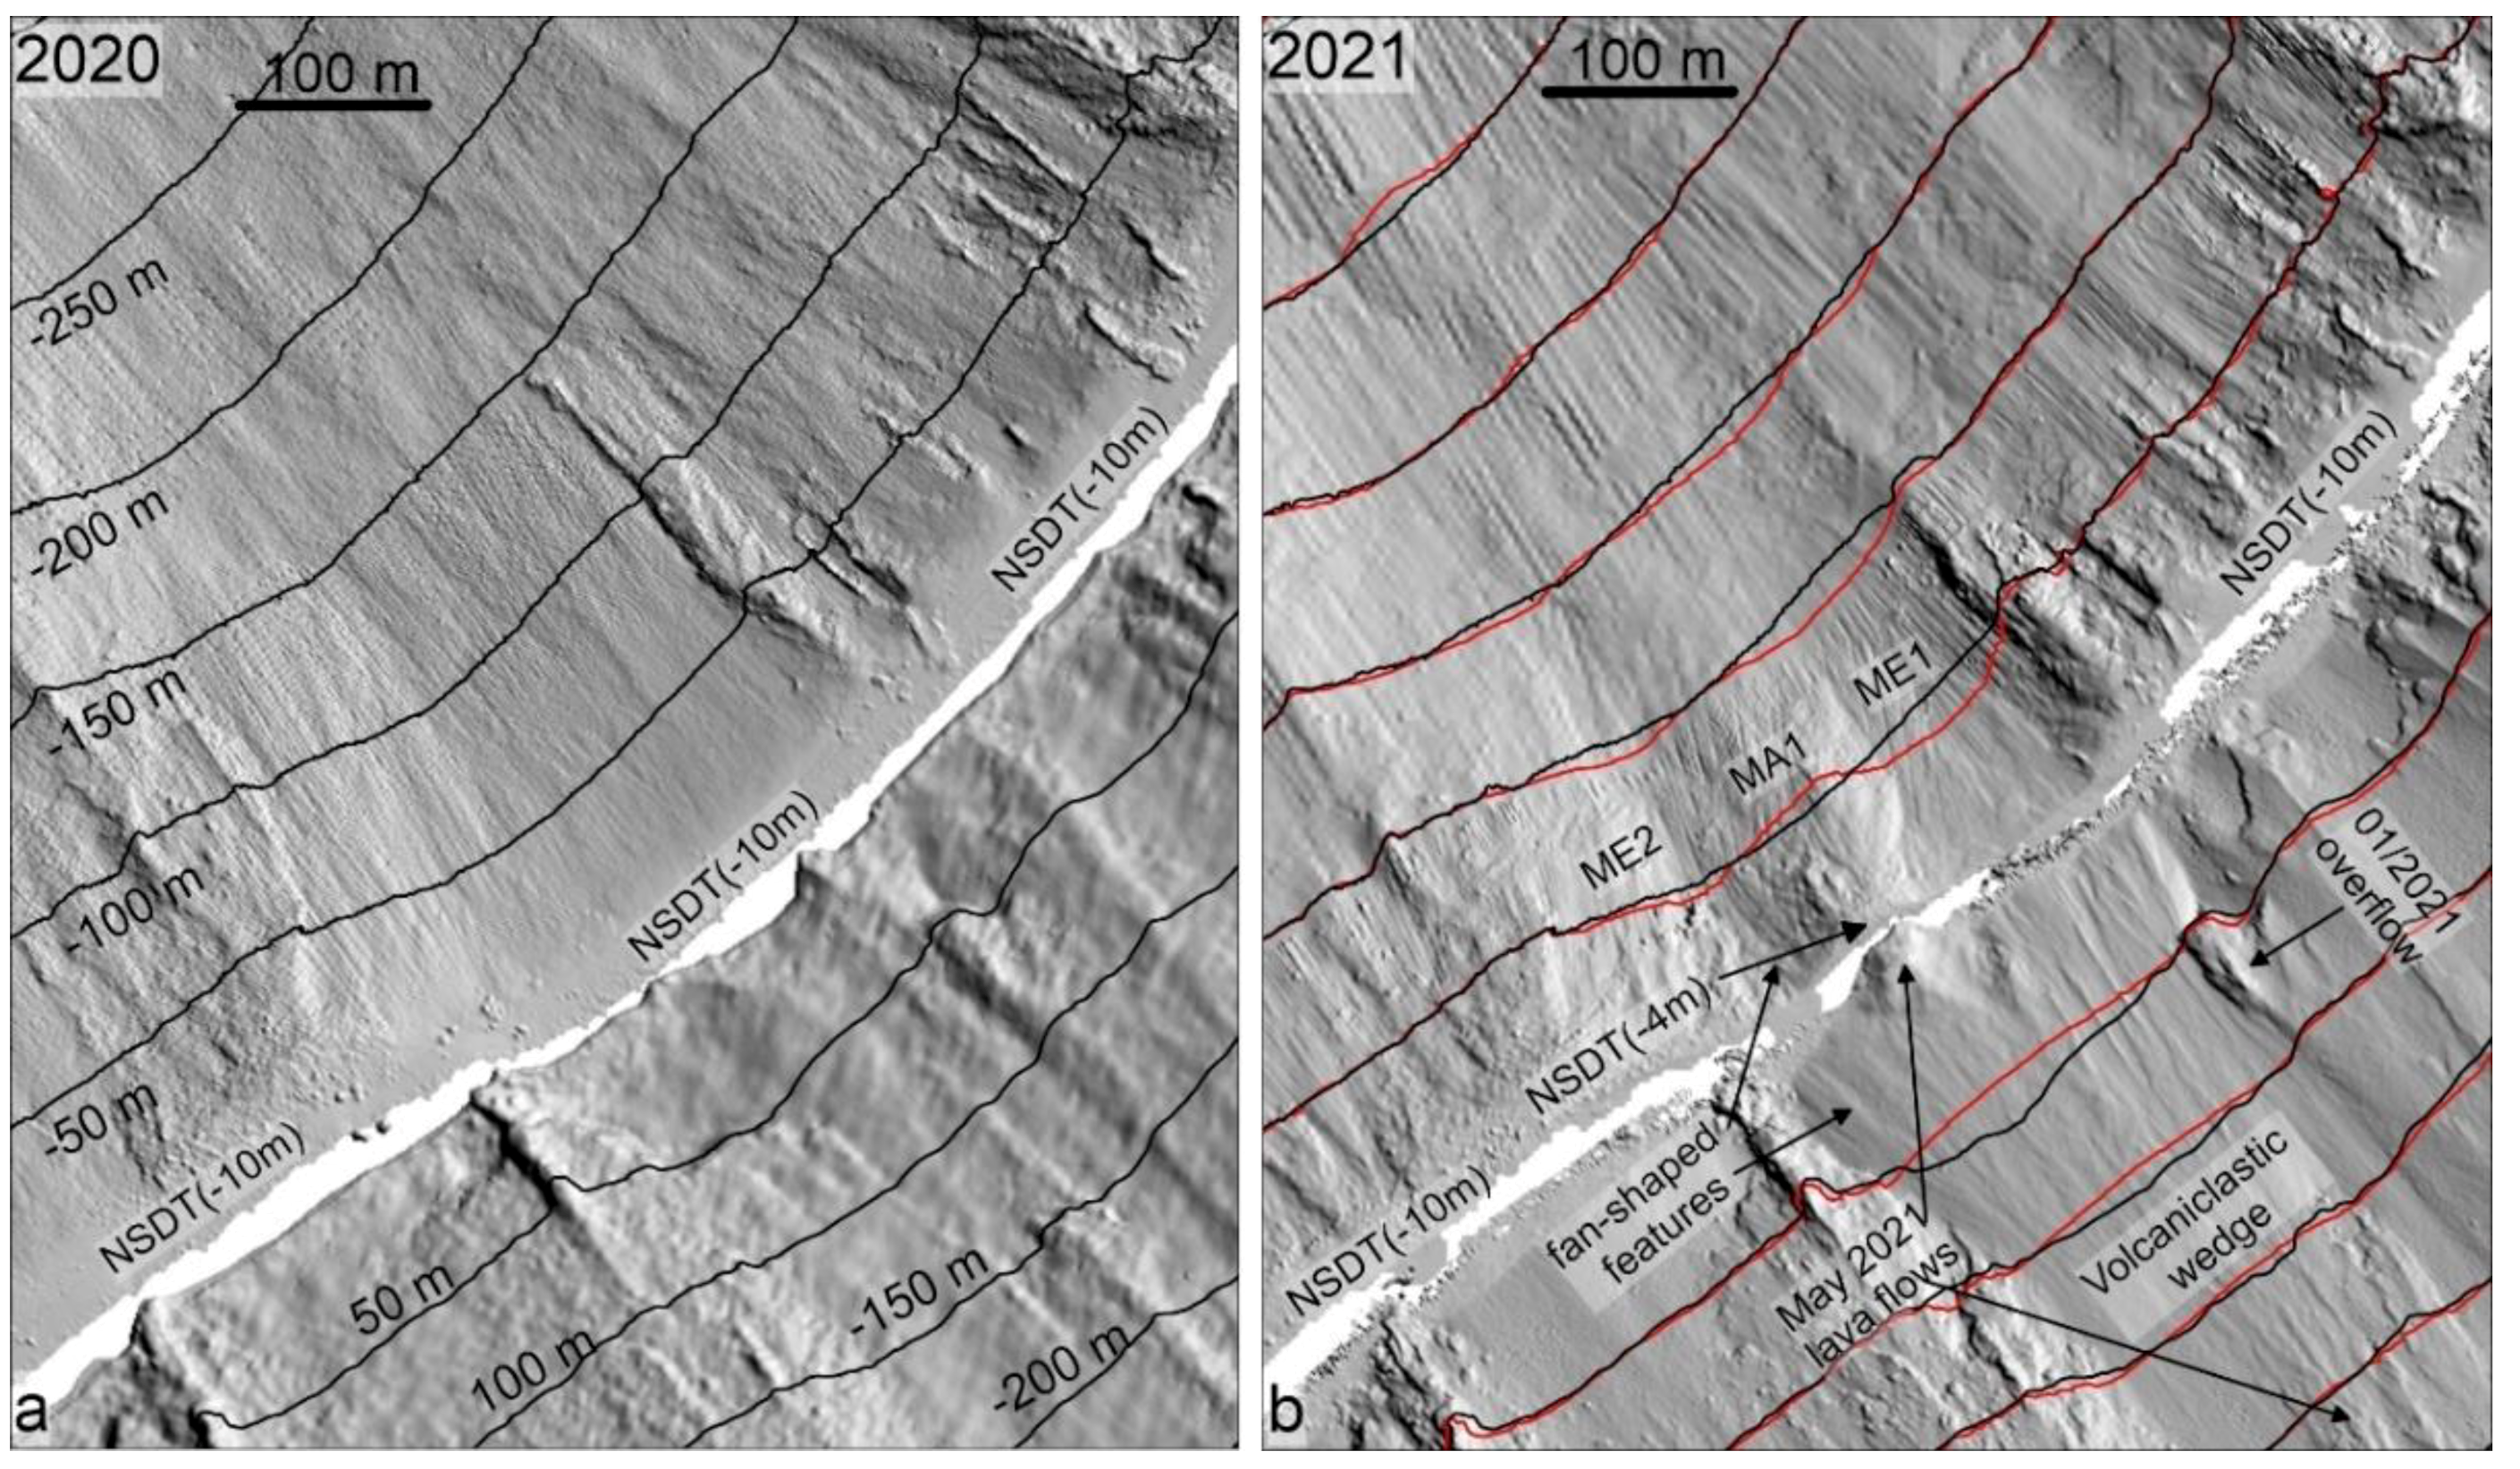
In detail, two main erosive areas (ME1 and ME2) are present in the central part of the SdF: (i) ME1 affects a surface of approximately 48,500 m2 between 5 and 175 m wd, with a maximum eroded material of 13 m, accounting for a volume of approximately 213,000 ± 20,000 m3, and (ii) ME2 affects a surface of approximately 28,700 m2 between 10 and 160 m wd, with a maximum eroded material of 7 m, accounting for a volume of approximately 68,000 ± 12,000 m3 (Table 6). Both erosive areas are related to the formation of downslope-elongated depressions on the 2021 bathymetry, which are partially floored by small-scale fan-shaped features (Figure 6b). The two erosive areas are divided by a small area of marked seafloor accretion (MA1), which encompasses a surface of approximately 13,000 m2 between 3 and 180 m wd. MA1 shows a maximum accreted thickness of 10 m, accounting for a volume of approximately 35,000 ± 5000 m3. In the 2021 bathymetry, MA1 corresponded to the development of an 80–100 m wide morphological high, elongated downslope for approximately 300 m (Figure 6b). This ridge was characterized by relatively steep (ranging between 15° and 30°) flanks, while its upper surface showed an uneven morphology, mostly made up of minor ridges (with local slope gradients up to 60°), metric blocks, and small fan-shaped lobes. The shallower part of the ridge was instead cut by a terraced feature (NSDT in Figure 6b), whose outer edge is located here around 4 m wd.
Small erosive areas were also recognizable both in the SW (ME3 and ME4) and NE part (mostly ME5 and ME6) of the SdF submarine slope. They affect variable from about 7000 m2 to 13,000 m2, with a maximum eroded thickness of 6 m. The computed mobilized volumes were approximately comprised of between approximately −10,000 and −20,000 m3 (Table 6). Even smaller (1000–2000 m2) and thinner (generally 1–3 m deep, at the limit of data resolution) erosive areas were present in the sector encompassed between ME1 and ME5–6 (minor erosive areas in Figure 5), mobilizing a total cumulative volume of −24,000 ± 12,000 (Table 6). All the erosive areas reflect the occurrence of shallow and small-scale landslide scars in the 2021 bathymetry, whose headwalls are mostly located around 10 m wd, affecting the edge of a terraced feature (NSDT in Figure 6b), recognizable along most of the submarine SdF slope.
At greater depths, the morphological changes are mostly associated with seafloor accretion, concentrated in three main areas (MA2, 3, and 4) located between 200 and 400 m wd in the central and NE part of the SdF; they developed downslope of the erosive areas ME1 and ME5–6. These sectors involve surfaces ranging from 42,000 to 58,000 m2, with a maximum accreted thickness of 5–8 m; estimated volumes for MA2, MA3, and MA4 account for +69,000 ± 17,000, +84,000 ± 24,000, and +115,000 ± 17,000 m3, respectively (Table 6). Two smaller areas (MA5–6) of seafloor accretion are also recognizable in the SW part of the SdF between 80 and 170 m wd, downslope of the erosive areas ME3 and ME4 (Figure 5a). MA5 and MA6 have surfaces of approximately 13,000–18,000 m2, an average thickness slightly over 1 m, accounting for a volume of +22,000 ± 8000 m3 and +16,000 ± 5000 m3, respectively.

3.2. CSK-SAR Amplitude Image and MBES/SSS Backscatter Data

The investigation of SAR amplitude changes was performed considering the variation of amplitude between March 2021 and December 2020 (Figure 7a), May 2021 and March 2021 (Figure 7b), and June 2021 and May 2021 (Figure 7c) images. In the first period considered (image of March 2021 versus image of December 2020), it was possible to identify the overflow that occurred on 24–25 January 2021 in the central portion of the SdF, highlighted by a narrow stripe with a markedly rougher surface (Figure 7a). In the following period (image of May 2021 versus image of March 2021, Figure 7b), no further relevant changes were identified. In particular, the area affected by lava overflow in January 2021 was mostly unchanged, apart from a slight tendency to smoothing only in the upper portion. After that, between June 2021 and May 2021, the area affected by the January 2021 lava overflow showed no detectable changes (light grey colour in the amplitude image of Figure 7c) but is contoured by evidently rougher portions on both sides, due to the rolling of coarse-grained volcaniclastic material and partially superimposing on the lava overflow (see also Figure 2c).
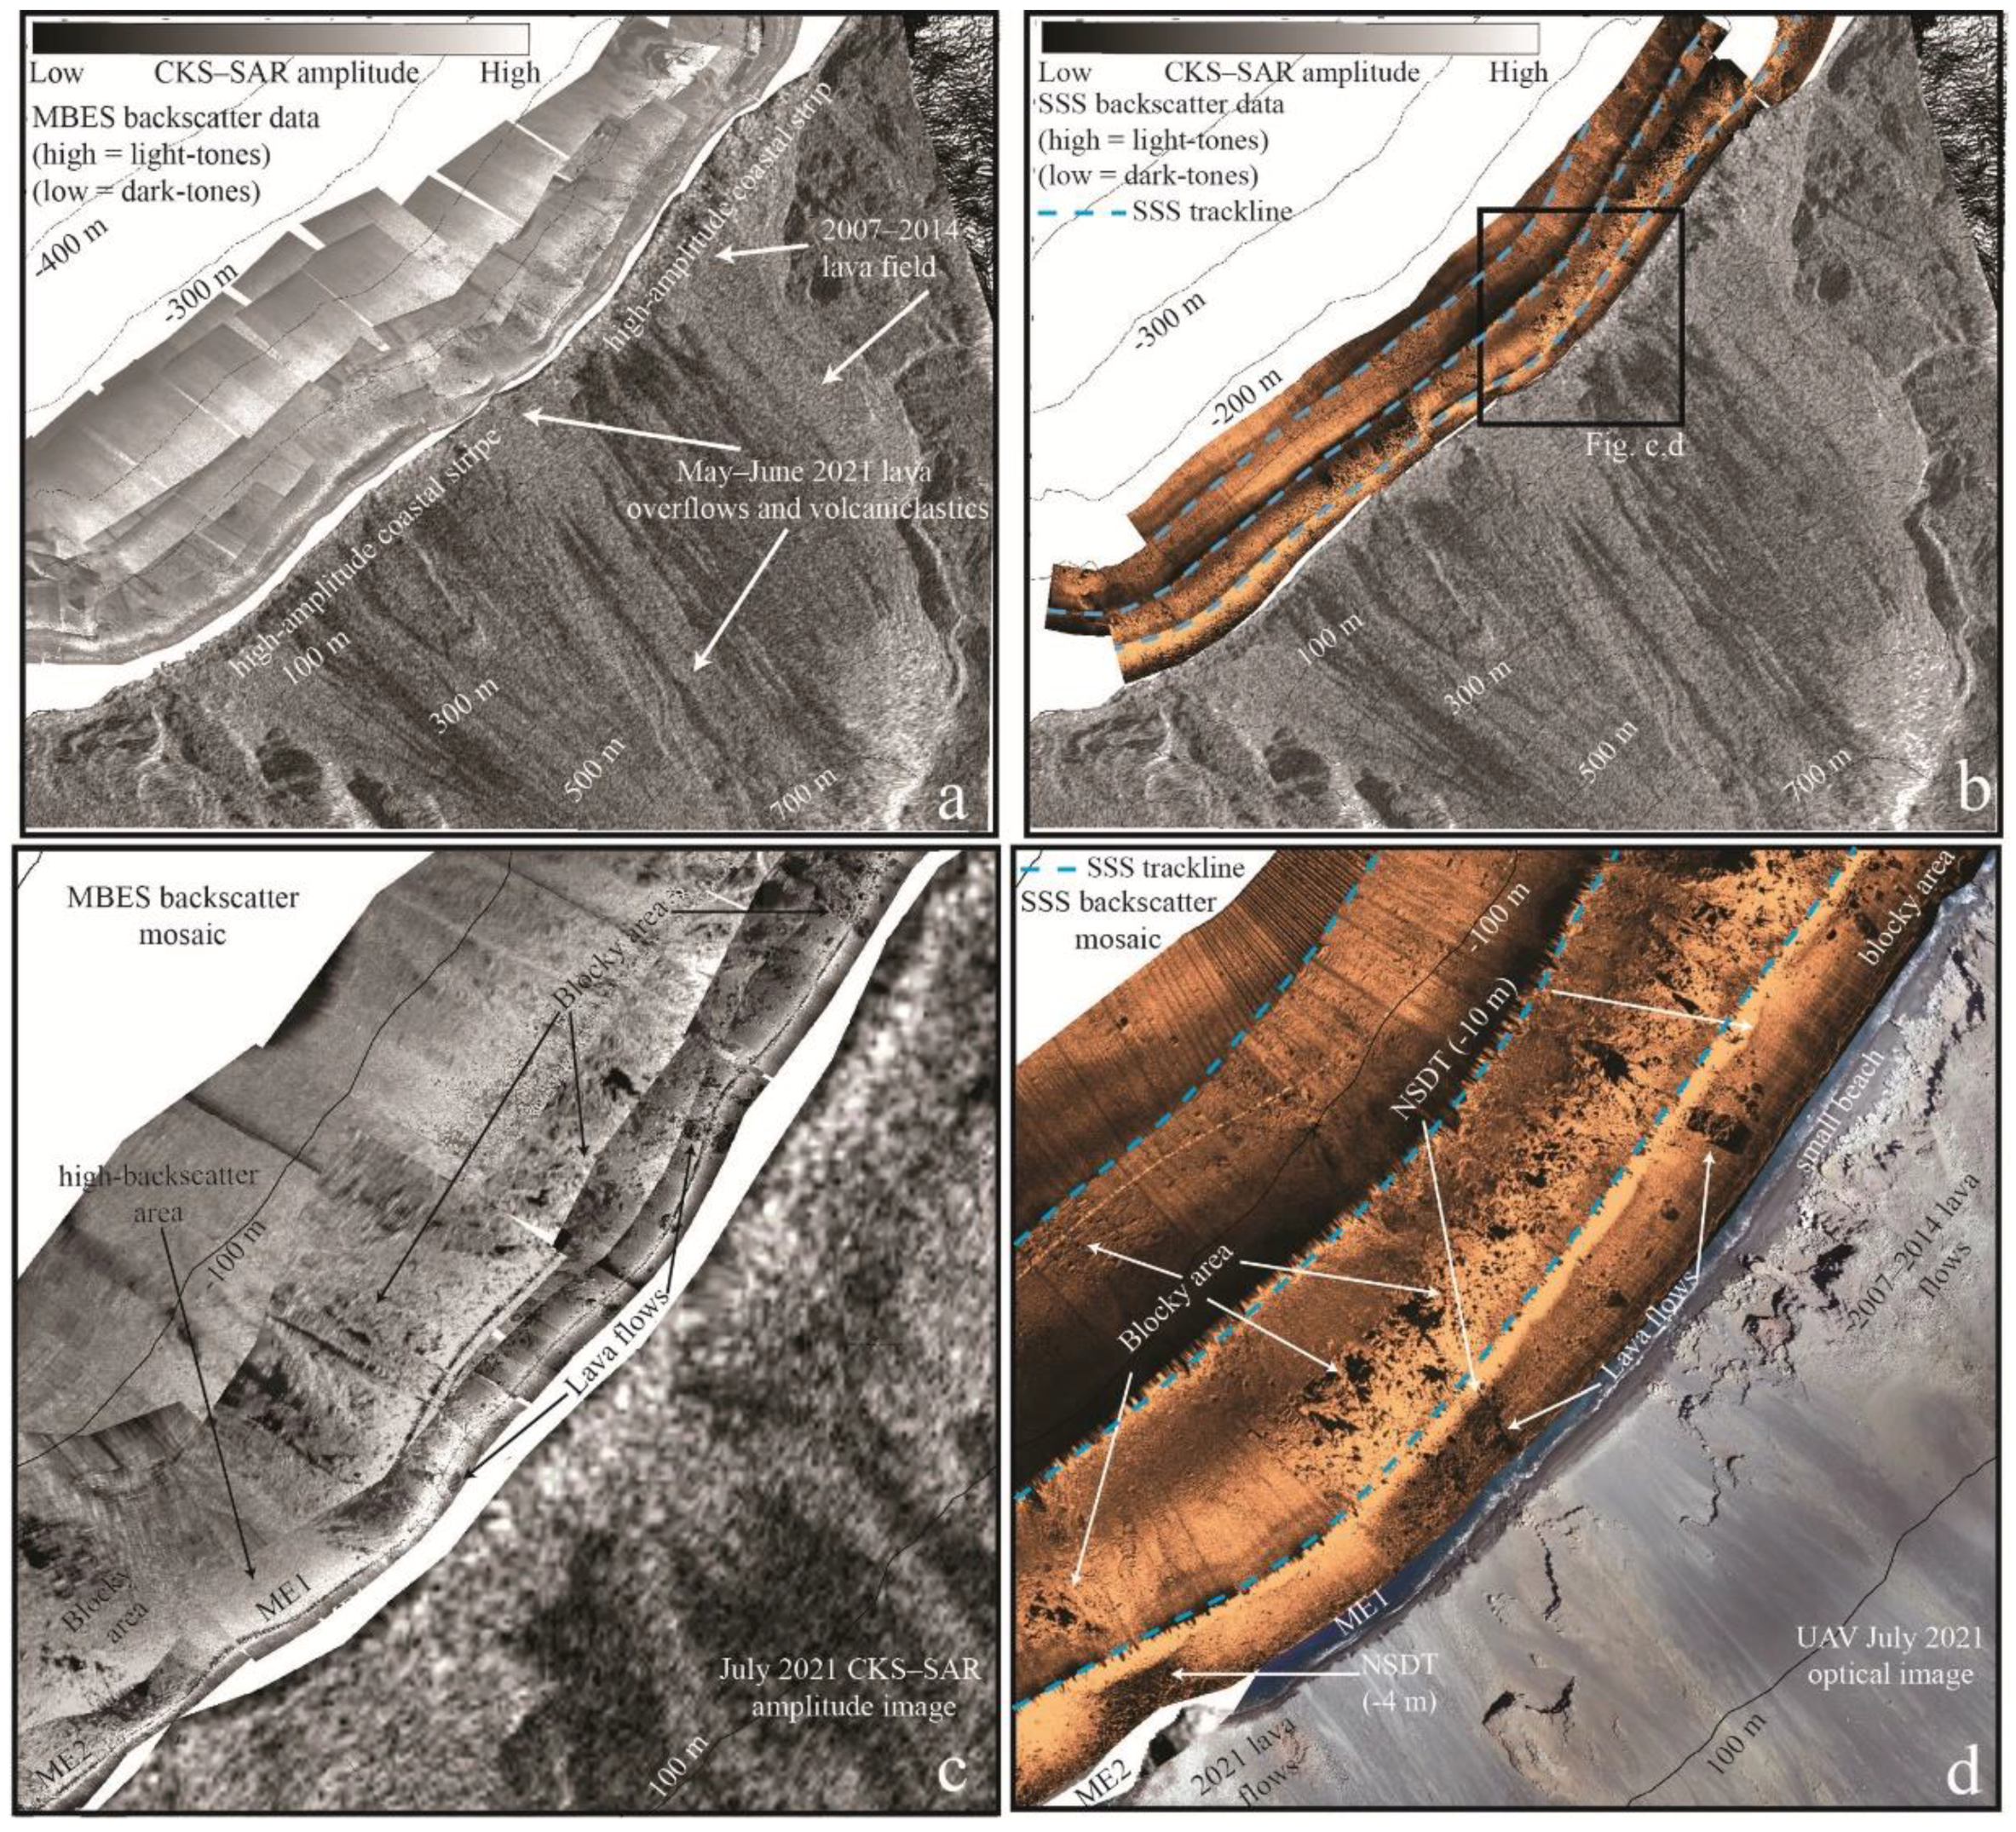
The analysis of the 30 July 2021 CSK-SAR image (Figure 8a) showed the alternation between areas with low and high amplitudes throughout the SdF slope. The high-amplitude areas (lighter tones) correspond to the following locations: (i) the summit crater terrace, (ii) the 2007–2014 lava flow field in the NE part of the SdF, (iii) the various lava flows emplaced along the SW part of the SdF during the last decades, and (iv) the central part of the SdF, where they match the slope accretion area recorded between June 2021–May 2021 and July 2021–June 2021 elevation difference maps (Figure 4b,c). More interestingly, high CSK-SAR amplitude values were recorded all along the coastal strip of the SdF. This high-amplitude area matches a sandy/gravelly accumulation at the foot of the slope, with sparse sub-metric and metric blocks alternated with more coherent lava flows recognizable in the 7 July 2021 UAV optical image (Figure 8d) and oblique photos (Figure 2c). Low-amplitude values are generally found within topographic lows encompassed between the main lava flows and are commonly floored by relatively finer-grained volcaniclastic material, as recognizable by optical images collected both by the PLÉIADES-1 satellites and UAV survey.
Regarding the submarine part, MBES/SSS backscatter data show the presence of medium-high backscatter values all along the nearshore sector, within the first 10 m wd (Figure 8). This area is bounded downslope by a high backscatter stripe (Figure 8d), roughly oriented parallel to the coastline, matching the marked break-in slope associated with the edge of the submarine terrace (NSDT in Figure 6 and Figure 8d). The flat terrace is characterized by overall smooth and medium-high backscatter values (Figure 8c,d), with the local accumulation of blocks ranging from sub-metric to metric in diameters or small lobate lava flows.
At greater depths, the quality of the SSS data increases with respect to the MBES backscatter, mainly because the former was acquired closer to the seafloor. On the other hand, the SSS data georeferencing was poorer and needed to be re-georeferenced with MBES bathymetry and backscatter through the matching of homologous morphologies. In the deeper areas, MBES and SSS data show the presence of areas with relatively medium backscatter above the main morphological highs, where downslope alignments of sub-metric or metric blocks are locally present (Figure 8c,d). The flanks of these morphological highs and the topographic lows/depressions are typically characterized by relatively higher backscatter values. Specifically, the two depressions related to ME1 and ME2 areas in the central part of the SdF (Figure 5a and Figure 8c,d) are characterized by homogenous and very high-backscatter facies.

4. Discussions

4.1. Reconstruction of the Main Eruptive and Erosive-Depositional Phenomena during the Monitoring Period

The topo-bathymetric changes observed by integrating remote sensing and geophysical analysis can be linked to specific eruptive or erosive-depositional processes that occurred in the SdF between February/April 2020 and July 2021. This link is quite clear for the subaerial slope, in relation to the high frequency of available DEMs (four in the investigated time span) and the direct observation of phenomena that occurred during the monitored period.
The limited morphological changes that occurred in the period April 2020–May 2021 (11 months) throughout the SdF are typical of the relatively slow morphological evolution of the SdF slope during “normal” eruptive stages with sporadic lava overflow events during phases of more intense/frequent activity (April 2022, January–February 2021), as already observed in previous monitoring activities [16]. The large time gap that occurred between the two DEMs and their relatively low resolution did not allow clear detection of the lava overflow that occurred between 24 and 25 January 2021 along the central portion of the SdF slope. It is, however, recognizable by a roughness band through the comparison of CKS-SAR amplitude images collected during this period (Figure 7). Analysis of these images up to the 11 May 2021 (Figure 7a,b) also showed an almost unchanged texture for the surrounding areas, in agreement with the minimal morphological changes that occurred during this period. These findings highlight the advantage of integrating different remote sensing techniques and frequent surveys for a more accurate assessment of the morphological evolution of the Sciara del Fuoco, otherwise some eruptive or landslide phenomena would have gone undetected, such as the January 2021 lava overflow.
The large morphological changes recognized in the central part of the SdF between May 2021–June 2021 (1 month) can be related to the NEC rim collapse, which occurred on 19 May 2021, and the subsequent lava flows. The rim collapse was clearly evidenced by the maximum eroded thickness in the elevation difference map (SE2 in Figure 4b) as well as by the rougher area in the SAR change amplitude analysis (Figure 7c). This collapse event generated a peculiar type of PDC (i.e., a hybrid phenomenon between a landslide and a PDC, witnessed at volcanoes fed by mafic magmas, e.g., [33]), with an estimated volume of material of between 10,000 and 70,000 m3 [32] that propagated down the SdF slope at a speed of approximately 50 km/h. Our volumetric estimation provided a minimum figure of approximately 44,000 m3 for this event (SE2 in Figure 4b), taking into account that the post-collapse survey was realized approximately 20 days after the event, so that the crater rim collapse had already been partially filled by the subsequent volcanic activity. This filling continued over time, as evidenced by the SA4 accretion recorded during the next month (Figure 4c), where a total volume of approximately 20,000 m3 was emplaced in the previous collapse depression.
According to [33], the ash-cloud deposit generated by the PDC was dominated by remobilized material ingested by the current during its movement down the SdF slope, thus indicating that significant erosion occurred. However, PDC erosion on the subaerial slope was barely recognizable on the June 2021-May 2021 elevation difference map (SE3 in Figure 4b). This can be again explained by the time gap between the collapse event and the DEM acquisition, which also recorded the infilling by lava flows and breccias in the subsequent five days (SA3 in Figure 4b) that propagated into the sea (MA1 in Figure 5a). Taking into account the spatial distribution of the slope erosion (SE3 in Figure 4b), we can tentatively reconstruct a 200 m-wide erosive strip, morphologically linked with the upslope crater rim collapse, but a reliable estimate of the eroded volume is very challenging and likely misleading, indicating the need for surveys immediately after the event. More interestingly, the spatial distribution of slope accretion, along with the textural analysis of optical and CKS-SAR images, provided insights for better constraining the emplacement of lava flows and volcaniclastic material in the SdF slope. The most interesting finding is the marked increase of slope accretion below 200 m asl, reaching its maximum at the coastline and forming an overall fan-shaped geometry (Figure 4b and Figure 6b). Such a geometry could be attributed to a difference in slope gradients between the upper and lower slope of the SdF, but the comparison of along-slope sections performed in the pre- and post-19 May DEMs did not show significant variations in slope gradients, with an almost constant gradient of around 35° for the entire slope. This observation could, however, be partially biased by the lack of a subaerial DEM just before the emplacement of the lava flows (possibly recording an original change in slope gradients due to the erosion exerted on the SdF slope by the NEC rim collapse-related PDC). It is (at least) suspicious that the post-collapse DEM recovered the same constant gradient profile observed in the pre-collapse DEM. An alternative explanation for the marked increase in thickness at the coastal area could be related to the abrupt decrease in velocity of the main lava flows once they reached the sea, thus enabling an increase in lava thickness due to inflation processes, similarly to that recognized in modern and ancient lava flows [50,51] as well as in analogue experiments [52]. This process could have been particularly efficient in the sector where the largest coastline progradation was observed and where oblique photos showed that massive and brecciated lava flows were able to reach the coastline (Figure 2c). The marked progradation of the coastline in a very small sector could have also been favoured by the slope topography at that time, mainly due to the emplacement of the 24–25 January 2021 overflows that might have acted as a lateral ridge confining the May–June 2021 overflows. This inference is supported by the comparison of elevation difference maps (Figure 4b–d), CKS-SAR amplitude images (Figure 7b,c), and by the oblique photo taken on 27 July 2021 (Figure 2c).
In contrast, the surrounding areas are dominated by small-scale fan-shaped features and narrow elongated ridges, overall creating a composite volcaniclastic wedge (Figure 6b), a feature typically observed in the lower and middle part of the SdF slope during eruptions fed by high-elevation vents, as those that occurred in 2002–2003, 2014, and 2019 events [15,16,53]. This volcaniclastic wedge was fed by lava breccias related to lava flows or overflows, remaining mostly confined in the upper slope due to low effusion rates, and by a higher input of volcaniclastic material due to the brecciated NEC rim, increasing the frequency of debris/rock fall processes occurring along the SdF and making them able to reach the coastline (Figure 2c and Figure 6b). The emplacement of this material is also responsible for the marked variation in SAR amplitude observed in Figure 7c as well as for high-amplitude values recorded in the central part of the SdF on the 30 July CKS-SAR image (Figure 8a).
The last elevation difference map, reconstructed for the period June 2021–July 2021 (1 month), shows the occurrence of minor morphological changes in the central part of the SdF. These can be related to minor lava overflows emitted during June as well as to less recurrent debris/rock fall events along the SdF slope due to the formation of a new crater rim.
The interpretation of the bathymetric changes is more complex because the two marine surveys were realized in February 2020 and July 2021, with a time gap of 1 year and 6 months, thus encompassing multiple eruptive and erosive-depositional phenomena. However, the integration of submarine data with the previous results from the subaerial slope and the 20 years’ experience on submarine monitoring of the SdF allowed us to make reliable inferences on the main processes associated with the observed seafloor variations. Indeed, previous monitoring activities showed that the main morphological changes in the submarine SdF were observed during an eruptive crisis or increased periods of Strombolian activity. The “ordinary” slope evolution was, however, limited to minor seafloor accretion related to the partial dismantling of the volcaniclastic wedge after the end of stronger eruptive periods [16] and/or small landslide/erosive processes affecting the shallowest part of the SdF. In the 2020–2021 difference map (Figure 5), the latter processes were testified by the small erosive areas recognized along the SW (ME3–4) and NE (ME5–6 and minor erosive areas) sectors of the SdF, where the slope failures were likely triggered by major storms that struck the NW flank of Stromboli during the winter period. The shallow part of the SdF submarine slope is mainly made up by a chaotic arrangement of coarse-grained volcaniclastic material (volcaniclastic sand and gravel, lava breccias, and blocks, [54]), and stability analyses showed that this slope is prone to small-scale shallow landslide processes [25,55]. Particularly, the nearshore submarine depositional terrace edge (NSDT in Figure 6 and Figure 8d), located around 10 m water depth, is an area prone to the development of small-scale slope instabilities, similarly to what was observed along the shallow submarine part of other volcanic islands [56,57]. This nearshore terrace is a common feature developed along volcanic islands, representing the morphological expression of a depositional body with prograding geometry, whose edge depth can be related to the local storm-wave base level [2,58,59,60]. The terrace edge represents an area where slope gradients markedly increase and a change from sediments repeatedly reworked by wave action to a slope dominated by avalanching process, thus favouring the development of small-scale slope instabilities. It is noteworthy that the runout of the mobilized material is generally low (see MA2–6 in Figure 5a) considering the steep submarine slope, but it is likely related to the fact that this gravity instability mobilized the shallow part of the SdF, made up by coarse-grained volcaniclastic material, with movement ceasing when the slope recovers its angle of repose, similar to what was observed in the previous monitoring activities at Stromboli and at the submarine slope of Hawaiian ‘a’ā lava-fed deltas [18].
The two larger and deeper erosive areas (ME1–2) observed in the central part of the SdF exactly match the topographic changes of the subaerial slope associated with the 19 May 2021 NEC rim collapse (Figure 5b), highlighting a cause-effect relationship between them and supporting the erosive potential of these processes, as indirectly suggested by [33]. This relationship is also in agreement with the lack of a submarine depositional terrace in the ME1–2 depressions down to 6 m of water depth (limit of the bathymetric survey), in contrast to the surrounding areas, which were not affected by localized erosion (Figure 6b and Figure 8c,d). Marked erosion was also generated in the central part of the SdF due to the entry into the sea of the 3 July 2019 PDC [16]. In the latter case, the survey was realized just a few days after the event, clearly recording the original erosive signature of the current once it entered the sea. In the present study, the marine survey was undertaken two months after the event, thus also recording the morphological changes associated with the emplacement of subsequent lava flows and breccias, as well as of recurrent small-scale debris/rock fall events. This is clearly evidenced by the seafloor accretion MA1 interposed between the two erosive areas ME1–2, the former exactly matching the main coastline progradation due to the May 2021 lava flows. It is noteworthy that the MA1 small ridge (Figure 6b) is similar to other morphological highs formed during the 2007 and 2014 lava entrance to the sea and lava delta formation [15,61], made up by variable percentages of coherent lavas and chaotic breccias. In the 2021 case, the small size of the MA1 ridge coupled with its relatively smooth morphology and slope gradients of up to 30° (except for very narrow ridges with gradients up to 60°) suggests the prevalence of lava breccias and volcaniclastic materials rather than coherent lava flows. It is also noteworthy that a submarine terrace developed on top of the MA1 ridge at water depths (around 4 m) shallower than the surrounding terrace edge, and coastal platforms developed at the SdF shoulders. This lower depth is likely in agreement with the lack of significant storm events between the ridge formation and the survey. The shallower slope erosion in ME2 with respect to ME1 could be explained by the accretion recorded in the subaerial sector between the June and July 2021 DEMs (Figure 4c). Particularly, the cumulate elevation difference map obtained between the first and last available DEMs (February 2020–July 2021) clearly highlights a preferential accretion in the westernmost part of the central SdF (Figure 4d and Figure 5b).
This interpretation suggests a possible significant underestimation of the total volume mobilized in the central part of the SdF during the 2021 collapse event, which could be estimated as between 350,000 and 400,000 m3 of mobilized material against the 280,000 computed from the elevation difference map. This value was obtained by reconstructing a post-collapse surface without the subsequent slope accretion and enlarging the erosive area coastward. On the other hand, the integration of subaerial and submarine data enables us to provide a minimum volume of volcanic material emplaced during the May overflows, accounting for approximately 360,000 m3. This value does not consider both the volcanic material that filled the two erosive depressions ME1 and ME2 and the material emplaced between the coast and the limit of the bathymetric survey. However, the volume emplaced in the submarine setting is much lower than the one emplaced in the subaerial slope, as typically occurs in cases of effusive eruptions fed by a high-elevation vent and with rapidly declining eruptive rates [15 and reference therein].

4.2. Textural Variations along the SdF Slope by Integreating CKS-SAR Image and Marine Backscatter Data

The qualitative comparison between CKS-SAR amplitude images and marine backscatter data carried out for the first time in this study indicates that, despite the morphological continuity between the subaerial and submarine slopes observed in the previous section, textural variations along the SdF slope primarily depend on the different processes and characteristics of the subaerial slope, the coastal area, the nearshore, and “deeper” marine areas.
The textural variations of the subaerial slope mainly depend on the type, frequency, and intensity of volcanic activity. Low CKS-SAR amplitude values are commonly observed during periods of low volcanic activity at the summit craters, when relatively fine-grained volcaniclastic material tend to floor the main topographic low, as was locally recognizable in the 30 July 2021 CKS-SAR image (Figure 8a,b). The only exception is the central depressed area of the SdF, which is aligned with the brecciated NE crater rim, where most of the coarse-grained material emitted by this crater was directly funneled seaward through the steep SdF slope. Similarly, the superficial texture of the lava flows, which is, in turn, dependent on the vent location, effusive rates, local steep gradients, and successive erosive-depositional processes, affects the final amplitude response. In general, at Stromboli, lava flows are mainly characterized by rugged superficial textures; thus, they are generally characterized by high-amplitude values, as observed in the SW and NE part of the SdF on the 30 July CKS-SAR image (Figure 8a).
The coastal area is surprisingly characterized by an almost continuous and homogenous stripe of high-amplitude values. This behaviour could be caused by several factors and their combinations. Indeed, the SAR amplitude value can be influenced by [62]: (i) the height of the sea wave, with the X-band being more sensitive with respect to longer wavelengths; (ii) the material size, with the coarser material showing a higher backscattering potential mainly in shoreline detection; (iii) the polarization, with the HH-polarized images (as the used CSK-SAR) usually generating larger contrast along the shoreline; and (iv) incidence angle with respect to the target. In addition, the dielectric constant enhances the radar backscattering signal in non-submerged areas [63]. In fact, in a soil–water mixture, such as the shoreline, a dielectric constant is a function of the soil grain dimension and the volume of the moisture content [64]. The highest amplitude values along the shoreline can be observed in correspondence with the areas where massive/brecciated lava flows or the accumulation of larger clasts and blocks are present.
The nearshore area is quite variable in terms of backscatter intensity (i.e., somewhat corresponding to the SAR amplitude), being a dynamic area resulting from the continuous interaction between subaerial and marine processes. This sector is mainly affected by wave-action processes that largely rework the volcanic material present, giving rise to a submarine depositional terrace all along the coastal area (Section 4.1). This terrace is generally characterized by smooth and medium-high backscatter areas, related to sandy and gravelly sediments, as ground-truthed by ROV footage (unpublished data), alternating with areas characterized by higher backscatter values linked with the local accumulation of metric and sub-metric blocks or remnants of lava flows. The blocks are mainly due to brecciation or successive erosion of the most recent or largest lava flows (Figure 8c,d) or, more sporadically, to larger avalanching processes occurring on the subaerial slope. In some cases, the largest events can temporarily dismantle part of the terrace, as was also observed during the 19 May 2021 NEC rim collapse, which formed two erosive depressions characterized by homogenous and high backscatter values (ME1 and ME2 in Figure 8c,d) representing a by-pass area for successive avalanching processes.
Textural variations in the deeper area are more variable and strongly dependent on the topography. They mainly reflect the interaction at different temporal and spatial scales between local dynamics associated with small-scale subaerial/submarine avalanching processes and larger events (i.e., effusive eruptions, such as those observed in 2007 and 2014, PDC generated from strong paroxysms in 2019, or crater rim collapses in 2021). These can significantly modify the submarine morphology in the first few hundreds of meters. This area is characterized by medium-high backscatter sectors, with the local accumulation of blocks alternating with smooth and higher backscatter sectors. The former sectors correspond to the morphological ridges formed at the entry point of lava flows into the sea, i.e., remnants of lava deltas, which are often dismantled in metric or sub-metric blocks by lava brecciation and are progressively covered by finer-grained material with respect to the adjacent topographic lows. These latter areas funnel downslope the coarse-grained volcaniclastic material remobilized from coastal and near-shore areas during storm-waves or that are directly transported into the sea by avalanching processes along the subaerial slope, especially during increased periods of Strombolian activity.

5. Conclusions

This study clearly demonstrated the importance of a multi-methods and multi-temporal land–sea approach through frequent surveys of highly dynamic environments, such as the SdF collapse scar at Stromboli, to reconstruct the submarine/subaerial morphological slope evolution, as well as to estimate the erupted/remobilized volumes with a significant level of detail. This approach has important implications both for better understanding the main eruptive and erosive/landslide processes that continuously reshape active volcanic flanks and in providing insights for geohazard assessment. In particular, considering that these phenomena can generate local but significant tsunami waves and that data on tsunamigenic flows are scarce and difficult to collect, the present work gains further relevance. In fact, in the case of Stromboli, the presence of different buoys in front of the Sciara del Fuoco allows the detection of possible tsunamigenic waves. This combined with the accurate volume assessment carried out here for events of different sizes constitutes a rather unique dataset, which is of the utmost importance in the validation and calibration of tsunami models. This approach also allowed for the assessment of the impacts in terms of seafloor erosion and tsunamigenic potential caused by the hybrid PDC associated with the NEC rim collapse in 2021 and the ones due to the 2019 PDC generated during a strong paroxysmal event. The 2021 event eroded a volume (350,000–400,000 m3) significantly lower than the 2019 PDC (1,300,000 m3 [16]). In accordance, the larger 2019 PDC generated tsunami waves up to 1.5 m, and they were less than 1 km for the Sciara del Fuoco event in 2019 [16], whereas negligible tsunami waves (maximum height of 0.20 cm, [32]) were detected for the 2021 event. Furthermore, this study has highlighted the need for frequent (i.e., from 1 to 3 surveys per year, based on the state of activity of the volcano), timely (i.e., just after the main eruptive or mass-wasting events), and simultaneous collection of topo-bathymetric surveys as well as their integration with other remote sensing data (CKS-SAR amplitude images or side scan sonar backscatter data). These should be combined with the continuous monitoring of ground deformation along subaerial volcanic flanks through seismic networks, time-lapse SAR imageries, Interferometric SAR data, and other geodetic methods [65]. On submarine flanks, the bathymetric surveys can be combined with different monitoring systems for the detection of eruptive activity and/or mass-wasting processes, such as ocean bottom seismometers, hydroacoustic arrays, and smart cables [66,67].
In conclusion, such an accurate and holistic characterization can only be possible if there is the collaboration of an interdisciplinary group of researchers combined with the use of multiple traditional and innovative techniques. In the present case, this holistic approach was fully adopted and implemented, leading to a more comprehensive understanding of the main morphological and textural variations that occur on the entire SdF slope and ultimately to highlight further the complexity of this hazardous and fascinating volcano.

Author Contributions

Conceptualization, D.C. and F.D.T.; methodology, D.C., F.D.T., M.F. and G.R.; data collection: D.C., C.R., F.L.C., I.M., P.C., T.G., C.T.S., G.R., F.D.T. and T.N.; data analysis: D.C., F.D.T., M.D.S., T.G., C.T.S. and G.R.; resources, F.L.C., N.C., I.M. and D.C.; writing, D.C., F.D.T., M.F., C.R., T.G. and M.D.S.; review and editing, D.C., F.D.T., C.R., I.M., P.C., T.G., C.T.S., G.R. and M.D.S.; project administration, N.C., I.M., F.L.C. and D.C. All authors have read and agreed to the published version of the manuscript.

Funding

This research was mainly funded by the National Research Council and “Presidenza del Consiglio dei Ministri–Dipartimento della Protezione Civile” (Presidency of the Council of Ministers– Department of Civil Protection), through CNR-DPC and UniFi-DPC respective agreements, however, does not reflect the position and the official policies of the Department. The research activities were also funded by the NERC Project NE/T009438/1; Scientific Responsibility: I.M and by Progetto di Ateneo 2021, University Sapienza of Rome, P.I. Daniele Casalbore.

Data Availability Statement

The data presented in this study are available on request from the corresponding author. The data are not publicly available due to their acquisitional for institutional purposes.

Acknowledgments

Crew of the small vessel “Valerio” belonging to the “Arena Sub SRL” and the 16 m-long “Euribia” vessel belonging to “PRISMA SRL” are gratefully acknowledged together with the Coast Guard of Lipari and Milazzo. We also acknowledge three anonymous reviewers for their insightful comments that improved the quality of the manuscript.

Conflicts of Interest

The authors declare no conflict of interest or other interests that might be perceived to influence the results and/or discussion reported in this article.

References

  1. Thouret, J.C. Volcanic geomorphology—An overview. Earth-Sci. Rev. 1999, 47, 95–131. [Google Scholar] [CrossRef]
  2. Romagnoli, C.; Jakobsson, S.P. Post-eruptive morphological evolution of island volcanoes: Surtsey as a modern case study. Geomorphology 2015, 250, 384–396. [Google Scholar] [CrossRef]
  3. Civico, R.; Ricci, T.; Scarlato, P.; Andronico, D.; Cantarero, M.; Carr, B.B.; De Beni, E.; Del Bello, E.; Johnson, J.B.; Kueppers, U.; et al. Unoccupied Aircraft Systems (UASs) Reveal the Morphological Changes at Stromboli Volcano (Italy) before, between, and after the 3 July and 28 August 2019 Paroxysmal Eruptions. Remote Sens. 2021, 13, 2870. [Google Scholar] [CrossRef]
  4. Chiocci, F.L.; Romagnoli, C.; Tommasi, P.; Bosman, A. The Stromboli 2002 tsunamigenic submarine slide: Characteristics and possible failure mechanisms. J. Geophys. Res. Solid Earth 2008, 113. [Google Scholar] [CrossRef]
  5. Tinti, S.; Manucci, A.; Pagnoni, G.; Armigliato, A.; Zaniboni, F. The 30 December 2002 landslide-induced tsunamis in Stromboli: Sequence of the events reconstructed from the eyewitness accounts. Nat. Hazards Earth Syst. Sci. 2005, 5, 763–775. [Google Scholar] [CrossRef]
  6. Grilli, S.T.; Tappin, D.R.; Carey, S.; Watt, S.F.L.; Ward, S.N.; Grilli, A.R.; Engwell, S.L.; Zhang, C.; Kirby, J.T.; Schambach, L.; et al. Modelling of the tsunami from the December 22, 2018 lateral collapse of Anak Krakatau volcano in the Sunda Straits, Indonesia. Sci. Rep. 2019, 9, 11946. [Google Scholar] [CrossRef]
  7. Mitchell, N.C.; Quartau, R.; Madeira, J. Assessing landslide movements in volcanic islands using near-shore marine geophysical data: South Pico island, Azores. Bull. Volcanol. 2012, 74, 483–496. [Google Scholar] [CrossRef]
  8. Le Friant, A.; Harford, C.L.; Deplus, C.; Boudon, G.; Sparks, R.S.J.; Herd, R.A.; Komorowski, J.C. Geomorphological evolution of Montserrat (West Indies): Importance of flank collapse and erosional processes. J. Geol. Soc. Lond. 2004, 161, 147–160. [Google Scholar] [CrossRef]
  9. Tibaldi, A.; Pasquarè, F.A.; Papanikolaou, D.; Nomikou, P. Discovery of a huge sector collapse at the Nisyros volcano, Greece, by on-land and offshore geological-structural data. J. Volcanol. Geotherm. Res. 2008, 177, 485–499. [Google Scholar] [CrossRef]
  10. Mitchell, N.C.; Beier, C.; Rosin, P.L.; Quartau, R.; Tempera, F. Lava penetrating water: Submarine lava flows around the coasts of Pico Island, Azores. Geochem. Geophys. Geosyst. 2008, 9. [Google Scholar] [CrossRef] [Green Version]
  11. Quartau, R.; Hipólito, A.; Romagnoli, C.; Casalbore, D.; Madeira, J.; Tempera, F.; Roque, C.; Chiocci, F.L. The morphology of insular shelves as a key for understanding the geological evolution of volcanic islands: Insights from Terceira Island (Azores). Geochem. Geophys. Geosyst. 2014, 15, 1801–1826. [Google Scholar] [CrossRef]
  12. Romagnoli, C.; Casalbore, D.; Ricchi, A.; Lucchi, F.; Quartau, R.; Bosman, A.; Tranne, C.A.; Chiocci, F.L. Morpho-bathymetric and seismo-stratigraphic analysis of the insular shelf of Salina (Aeolian archipelago) to unveil its Late-Quaternary geological evolution. Mar. Geol. 2018, 395, 133–151. [Google Scholar] [CrossRef]
  13. Clare, M.A.; Le Bas, T.; Price, D.M.; Hunt, J.E.; Sear, D.; Cartigny, M.J.B.; Vellinga, A.; Symons, W.; Firth, C.; Cronin, S. Complex and cascading triggering of submarine landslides and turbidity currents at volcanic islands revealed from integration of high-resolution onshore and offshore surveys. Front. Earth Sci. 2018, 6, 223. [Google Scholar] [CrossRef]
  14. Baldi, P.; Bosman, A.; Chiocci, F.L.; Marsella, M.; Romagnoli, C.; Sonnessa, A. Integrated subaerial-submarine morphological evolution of the Sciara del Fuoco after the 2002 landslide. The Stromboli Volcano: An Integrated Study of the 2002–2003 Eruption. Am. Geophys. Union Geophys. Monogr. Ser. 2018, 171–182. [Google Scholar] [CrossRef]
  15. Casalbore, D.; Di Traglia, F.; Bosman, A.; Romagnoli, C.; Casagli, N.; Chiocci, F.L. Submarine and subaerial morphological changes associated with the 2014 eruption at Stromboli Island. Remote Sens. 2021, 13, 2043. [Google Scholar] [CrossRef]
  16. Di Traglia, F.; Fornaciai, A.; Casalbore, D.; Favalli, M.; Manzella, I.; Romagnoli, C.; Chiocci, F.L.; Cole, P.; Nolesini, T.; Casagli, N. Subaerial-submarine morphological changes at Stromboli volcano (Italy) induced by the 2019–2020 eruptive activity. Geomorphology 2022, 400, 108093. [Google Scholar] [CrossRef]
  17. Trofimovs, J.; Amy, L.; Boudon, G.; Deplus, C.; Doyle, E.; Fournier, N.; Hart, M.B.; Komorowski, J.C.; Le Friant, A.; Lock, E.J.; et al. Submarine pyroclastic deposits formed at the Soufrière Hills volcano, Montserrat (1995–2003): What happens when pyroclastic flows enter the ocean? Geology 2006, 34, 549–552. [Google Scholar] [CrossRef]
  18. Soule, S.A.; Zoeller, M.; Parcheta, C. Submarine lava deltas of the 2018 eruption of Kīlauea volcano. Bull. Volcanol. 2021, 83, 23. [Google Scholar] [CrossRef]
  19. Tibaldi, A. Multiple sector collapses at Stromboli volcano, Italy: How they work. Bull. Volcanol. 2001, 63, 112–125. [Google Scholar] [CrossRef]
  20. Francalanci, L.; Lucchi, F.; Keller, J.; De Astis, G.; Tranne, C.A. Eruptive, volcano-tectonic and magmatic history of the Stromboli volcano (north-eastern Aeolian archipelago). Geol. Soc. Lond. Mem. 2013, 37, 397–471. [Google Scholar] [CrossRef]
  21. Kokelaar, P.; Romagnoli, C. Sector collapse, sedimentation and clast population evolution at an active island-arc volcano: Stromboli, Italy. Bull. Volcanol. 1995, 57, 240–262. [Google Scholar] [CrossRef]
  22. Rosi, M.; Bertagnini, A.; Landi, P. Onset of the persistent activity at Stromboli volcano (Italy). Bull. Volcanol. 2000, 62, 294–300. [Google Scholar] [CrossRef]
  23. Di Traglia, F.; Nolesini, T.; Ciampalini, A.; Solari, L.; Frodella, W.; Bellotti, F.; Fumagalli, A.; De Rosa, G.; Casagli, N. Tracking morphological changes and slope instability using spaceborne and ground-based SAR data. Geomorphology 2018, 300, 95–112. [Google Scholar] [CrossRef]
  24. Giordano, G.; De Astis, G. The summer 2019 basaltic Vulcanian eruptions (paroxysms) of Stromboli. Bull. Volcanol. 2021, 83, 1. [Google Scholar] [CrossRef]
  25. Casalbore, D.; Passeri, F.; Tommasi, P.; Verrucci, L.; Bosman, A.; Romagnoli, C.; Chiocci, F.L. Small-scale slope instability on the submarine flanks of insular volcanoes: The case-study of the Sciara del Fuoco slope (Stromboli). Int. J. Earth Sci. 2020, 109, 2643–2658. [Google Scholar] [CrossRef]
  26. Bonaccorso, A.; Calvari, S.; Garfì, G.; Lodato, L.; Patanè, D. Dynamics of the December 2002 flank failure and tsunami at Stromboli volcano inferred by volcanological and geophysical observations. Geophys. Res. Lett. 2003, 30. [Google Scholar] [CrossRef]
  27. Marani, M.P.; Gamberi, F.; Rosi, M.; Bertagnini, A.; Di Roberto, A. Subaqueous density flow processes and deposits of an island volcano landslide (Stromboli Island, Italy). Sedimentology 2009, 56, 1488–1504. [Google Scholar] [CrossRef]
  28. Barberi, F.; Civetta, L.; Rosi, M.; Scandone, R. Chronology of the 2007 eruption of Stromboli and the activity of the Scientific Synthesis Group. J. Volcanol. Geotherm. Res. 2009, 182, 123–130. [Google Scholar] [CrossRef]
  29. Calvari, S.; Di Traglia, F.; Ganci, G.; Giudicepietro, F.; Macedonio, G.; Cappello, A.; Nolesini, T.; Pecora, E.; Bilotta, G.; Centorrino, V.; et al. Overflows and pyroclastic density currents in March–April 2020 at Stromboli volcano detected by remote sensing and seismic monitoring data. Remote Sens. 2020, 12, 3010. [Google Scholar] [CrossRef]
  30. Calvari, S.; Intrieri, E.; Di Traglia, F.; Bonaccorso, A.; Casagli, N.; Cristaldi, A. Monitoring crater-wall collapse at active volcanoes: A study of the 12 January 2013 event at Stromboli. Bull. Volcanol. 2016, 78, 39. [Google Scholar] [CrossRef]
  31. Di Traglia, F.; Calvari, S.; D’Auria, L.; Nolesini, T.; Bonaccorso, A.; Fornaciai, A.; Esposito, A.; Cristaldi, A.; Favalli, M.; Casagli, N. The 2014 Effusive Eruption at Stromboli: New Insights from In Situ and Remote-Sensing Measurements. Remote Sens. 2018, 10, 2035. [Google Scholar] [CrossRef]
  32. LGS—Università di Firenze. Bollettino Settimanale Dell’Attività del Vulcano Stromboli (13–20 Maggio 2021). 2021. Available online: http://lgs.geo.unifi.it/stromboli/bollettini/2021/05/Bollettino_UNIFI-LGS_Stromboli_20210520.pdf (accessed on 30 August 2022).
  33. Re, G.; Pompillio, M.; Del Carlo, P.; Di Roberto, A. Physical and morphological characterization of the 19 May 2021 ash cloud deposit at Stromboli (Italy). Sci. Rep. 2022, 12, 10777. [Google Scholar] [CrossRef] [PubMed]
  34. Calvari, S.; Di Traglia, F.; Ganci, G.; Bruno, V.; Ciancitto, F.; Di Lieto, B.; Gambino, S.; Garcia, A.; Giudicepietro, F.; Inguaggiato, S.; et al. Multi-parametric study of an eruptive phase comprising unrest, major explosions, crater failure, pyroclastic density currents and lava flows: Stromboli volcano, 1 December 2020–30 June 2021. Front. Earth Sci. 2022, 10, 899635. [Google Scholar] [CrossRef]
  35. Bagnardi, M.; González, P.J.; Hooper, A. High-resolution digital elevation model from tri-stereo Pleiades-1 satellite imagery for lava flow volume estimates at Fogo Volcano. Geophys. Res. Lett. 2016, 43, 6267–6275. [Google Scholar] [CrossRef]
  36. Gracchi, T.; Rossi, G.; Tacconi Stefanelli, C.; Tanteri, L.; Pozzani, R.; Moretti, S. Tracking the Evolution of Riverbed Morphology on the Basis of UAV Photogrammetry. Remote Sens. 2021, 13, 829. [Google Scholar] [CrossRef]
  37. Gracchi, T.; Tacconi Stefanelli, C.; Rossi, G.; Di Traglia, F.; Nolesini, T.; Tanteri, L.; Casagli, N. UAV-Based Multitemporal Remote Sensing Surveys of Volcano Unstable Flanks: A Case Study from Stromboli. Remote Sens. 2022, 14, 2489. [Google Scholar] [CrossRef]
  38. Arnold, D.; Biggs, J.; Wadge, G.; Ebmeier, S.; Odbert, H.; Poland, M. Dome growth, collapse, and valley fill at Soufrière Hills Volcano, Montserrat, from 1995 to 2013: Contributions from satellite radar measurements of topographic change. Geosphere 2016, 12, 1300–1315. [Google Scholar] [CrossRef]
  39. Chaussard, E. A low-cost method applicable worldwide for remotely mapping lava dome growth. J. Volcanol. Geotherm. Resour. 2017, 341, 33–41. [Google Scholar] [CrossRef]
  40. Poland, M.P. Synthetic aperture radar volcanic flow maps (SAR VFMs): A simple method for rapid identification and mapping of volcanic mass flows. Bull. Volcanol. 2022, 84, 32. [Google Scholar] [CrossRef]
  41. Wadge, G.; Cole, P.; Stinton, A.; Komorowski, J.-C.; Stewart, R.; Toombs, A.C.; Legendre, Y. Rapid topographic change measured by high-resolution satellite radar at Soufriere Hills Volcano, Montserrat, 2008–2010. J. Volcanol. Geotherm. Resour. 2011, 199, 142–152. [Google Scholar] [CrossRef]
  42. Ebmeier, S.K.; Biggs, J.; Muller, C.; Avard, G. Thin-skinned mass-wasting responsible for widespread deformation at Arenal volcano. Front. Earth Sci. 2014, 2, 35. [Google Scholar] [CrossRef]
  43. Pinel, N.; Bourlier, C.; Saillard, J. Degree of roughness of rough layers: Extensions of the Rayleigh roughness criterion and some applications. Prog. Electromagn. Res. 2010, 19, 41–63. [Google Scholar] [CrossRef]
  44. Foumelis, M.; Blasco, J.M.D.; Brito, F.; Pacini, F.; Pishehvar, P. Snapping for Sentinel-1 Mission on Geohazards Exploitation Platform: An Online Medium Resolution Surface Motion Mapping Service. In Proceedings of the 2021 IEEE International Geoscience and Remote Sensing Symposium IGARSS, Brussels, Belgium, 11–16 July 2021; IEEE: Piscataway, NJ, USA, 2021; pp. 3991–3994. [Google Scholar]
  45. Dekker, R.J. Speckle filtering in satellite SAR change detection imagery. Int. J. Remote Sens. 1998, 19, 1133–1146. [Google Scholar] [CrossRef]
  46. Blondel, P. The Handbook of Sidescan Sonar; Springer Science & Business Media: Berlin/Heidelberg, Germany, 2010. [Google Scholar]
  47. Klaucke, I. Sidescan sonar. In Submarine Geomorphology; Springer: Cham, Switzerland, 2018; pp. 13–24. [Google Scholar]
  48. Favalli, M.; Fornaciai, A.; Mazzarini, F.; Harris, A.; Neri, M.; Behncke, B.; Pareschi, M.T.; Tarquini, S.; Boschi, E. Evolution of an active lava flow field using a multitemporal LIDAR acquisition. J. Geophys. Res. Solid Earth 2010, 115. [Google Scholar] [CrossRef]
  49. Favalli, M.; Fornaciai, A.; Nannipieri, L.; Harris, A.; Calvari, S.; Lormand, C. UAV-based remote sensing surveys of lava flow fields: A case study from Etna’s 1974 channel-fed lava flows. Bull. Volcanol. 2018, 80, 29. [Google Scholar] [CrossRef]
  50. Moore, J.; Phillips, R.L.; Grigg, R.W.; Peterson, D.W.; Swanson, D.A. Flow of lava into the sea, 1969–1971, Kilauea volcano, Hawaii. GSA Bull. 1973, 84, 537–546. [Google Scholar] [CrossRef]
  51. Obata, S.; Umino, S. Morphology of AD 864 Aokigahara lava flow exposed on the coast of Motosuko Lake, Fuji Volcano. Kazan 1999, 44, 201–216. [Google Scholar]
  52. Rader, E.; Vanderkluysen, L.; Clarke, A. The role of unsteady effusion rates on inflation in long-lived lava flow fields. Earth Planet. Sci. Lett. 2017, 477, 73–83. [Google Scholar] [CrossRef]
  53. Lodato, L.; Spampinato, L.; Harris, A.; Calvari, S.; Dehn, J.; Patrick, M. Themorphology and evolution of the Stromboli 2002–2003 lava flow field: An example of a basaltic flow field emplaced on a steep slope. Bull. Volcanol. 2007, 69, 661–679. [Google Scholar] [CrossRef]
  54. Casalbore, D.; Romagnoli, C.; Chiocci, F.; Frezza, V. Morpho-sedimentary characteristics of the volcaniclastic apron around Stromboli volcano (Italy). Mar. Geol. 2010, 269, 132–148. [Google Scholar] [CrossRef]
  55. Di Traglia, F.; Nolesini, T.; Solari, L.; Ciampalini, A.; Frodella, W.; Steri, D.; Allotta, B.; Rindi, A.; Monni, N.; Marini, L.; et al. Lava delta deformation as a proxy for submarine slope instability. Earth Planet. Sci. Lett. 2018, 488, 46–58. [Google Scholar] [CrossRef]
  56. Babonneau, N.; Delacourt, C.; Cancouët, R.; Sisavath, E.; Bachèlery, P.; Mazuel, A.; Jorry, S.J.; Deschamps, A.; Ammann, J.; Villeneuve, N. Direct sediment transfer from land to deep-sea: Insights into shallow multibeam bathymetry at La Réunion Island. Mar. Geol. 2013, 346, 47–57. [Google Scholar] [CrossRef]
  57. Innocentini, S.; Quartau, R.; Casalbore, D.; Roque, C.; Vinhas, A.; Santos, R.; Rodrigues, A. Morpho-stratigraphic characterization of the southern shelf of Porto Santo Island (Madeira Archipelago): Insights for small-scale instability processes and post-LGM sedimentary architecture. Mar. Geol. 2022, 444, 106729. [Google Scholar] [CrossRef]
  58. Hernández-Molina, F.J.; Fernández-Salas, L.M.; Lobo, F.; Somoza, L.; Díaz-del-Río, V.; Alveirinho Dias, J.M. The infralittoral prograding wedge: A new large-scale progradational sedimentary body in shallow marine environments. Geo-Mar. Lett. 2000, 20, 109–117. [Google Scholar] [CrossRef]
  59. Mitchell, N.C. Modeling the rollovers of sandy clinoforms from the gravity effect on wave-agitated sand. J. Sediment. Res. 2012, 82, 464–468. [Google Scholar] [CrossRef]
  60. Casalbore, D.; Falese, F.; Martorelli, E.; Romagnoli, C.; Chiocci, F.L. Submarine depositional terraces in the Tyrrhenian Sea as a proxy for paleo-sea level reconstruction: Problems and perspective. Quat. Int. 2017, 439, 169–180. [Google Scholar] [CrossRef]
  61. Bosman, A.; Casalbore, D.; Romagnoli, C.; Chiocci, F.L. Formation of an ‘a’ā lava delta: Insights from time-lapse multibeam bathymetry and direct observations during the Stromboli 2007 eruption. Bull. Volcanol. 2014, 76, 838. [Google Scholar] [CrossRef]
  62. Wu, L.; Tajima, Y.; Yamanaka, Y.; Shimozono, T.; Sato, S. Study on characteristics of SAR imagery around the coast for shoreline detection. Coast. Eng. J. 2019, 61, 152–170. [Google Scholar]
  63. Ottinger, M.; Kuenzer, C. Spaceborne L-Band Synthetic Aperture Radar Data for Geoscientific Analyses in Coastal Land Applications: A Review. Remote Sens. 2020, 12, 2228. [Google Scholar] [CrossRef]
  64. Zribi, M.; Le Morvan, A.; Baghdadi, N. Dielectric constant modelling with soil–air composition and its effect on SAR radar signal backscattered over soil surface. Sensors 2008, 8, 6810–6824. [Google Scholar] [CrossRef]
  65. Schaefer, L.N.; Di Traglia, F.; Chaussard, E.; Lu, Z.; Nolesini, T.; Casagli, N. Monitoring volcano slope instability with Synthetic Aperture Radar: A review and new data from Pacaya (Guatemala) and Stromboli (Italy) volcanoes. Earth-Sci. Rev. 2019, 192, 236–257. [Google Scholar] [CrossRef]
  66. Caplan-Auerbach, J.; Fox, C.G.; Duennebier, F.K. Hydroacoustic detection of submarine landslides on Kilauea volcano. Geophys. Res. Lett. 2001, 28, 1811–1813. [Google Scholar] [CrossRef] [Green Version]
  67. Ercilla, G.; Casas, D.; Alonso, B.; Casalbore, D.; Galindo-Zaldívar, J.; García-Gil, S.; Martorelli, E.; Vásquez, J.-T.; Azpiroz-Zabala, M.; DoCouto, D.; et al. Offshore geological hazards: Charting the course of progress and future directions. Oceans 2021, 2, 393–428. [Google Scholar] [CrossRef]
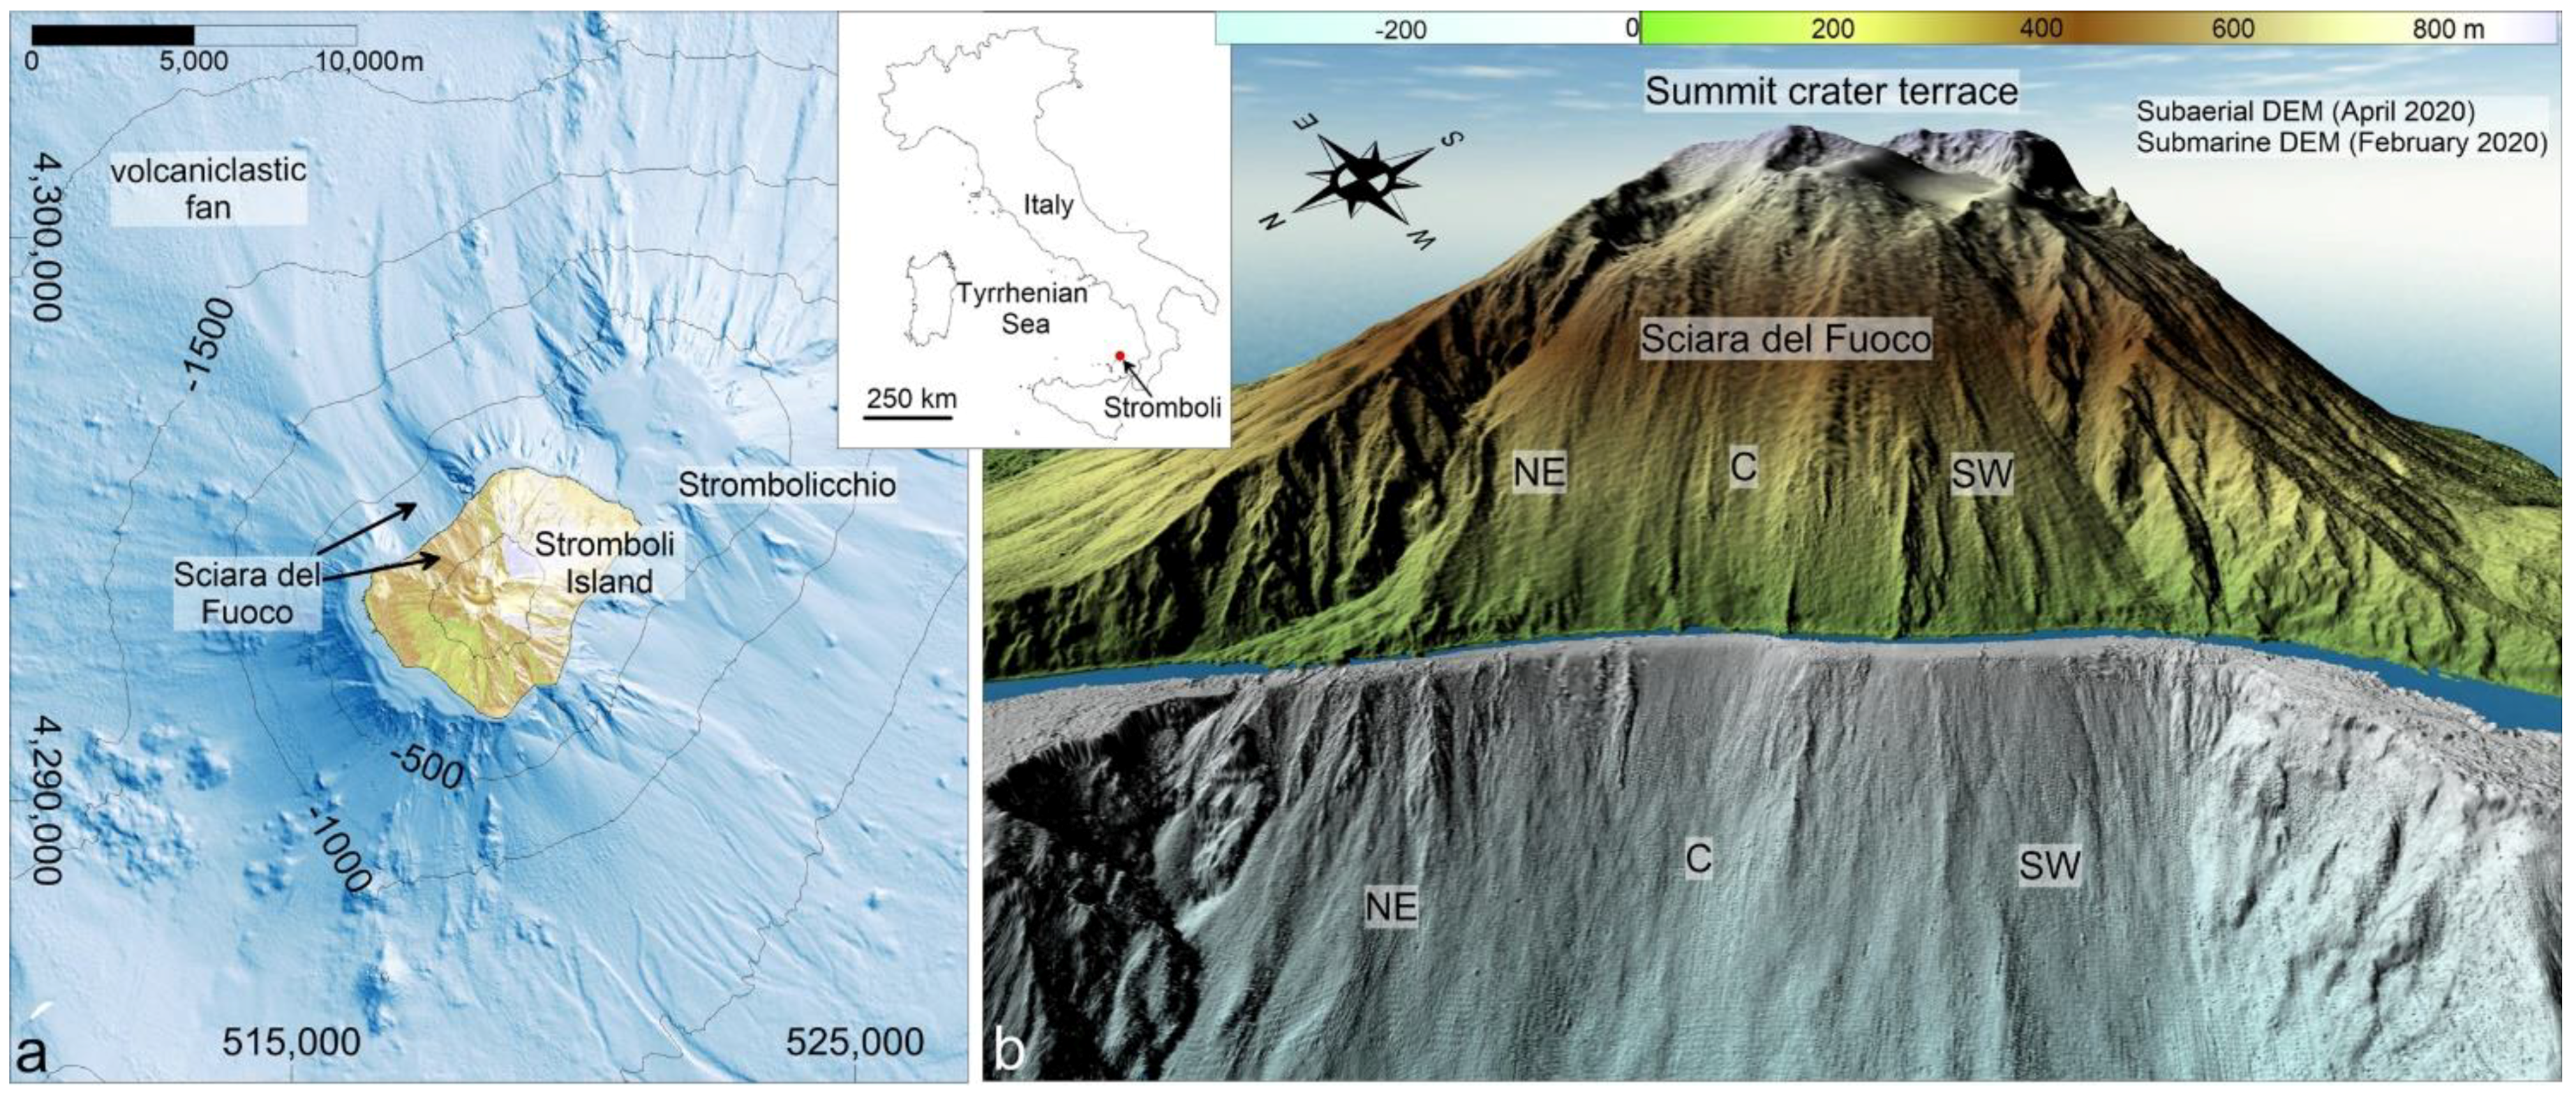
Figure 1. (a) Shaded relief and contour map (equidistance 500 m) of Stromboli volcano, with location of the Sciara del Fuoco using the April 2020 and February 2020 digital elevation models for the subaerial and submarine parts, respectively; the inset shows the location of Stromboli volcano (red point) in the Tyrrhenian Sea. (b) This is a 3-D image of the Sciara del Fuoco collapse scar, which can be morphologically divided in the north-eastern (NE), central (C), and south-western (SW) sectors and in the subaerial (coloured) and submarine (grey) parts.
Remotesensing 14 04605 g001
Figure 2. (a) 19 May 2021 oblique photo of the SdF showing the lava flows that reached the sea after the start of the overflows that caused the collapse of the NE crater-rim; (b) 7 July 2021 photo of the SdF showing the accumulation of lava and volcaniclastic deposits related to the eruptive activity of May and June 2021; (c) 27 July 2021 oblique photo of the central part of the SdF showing the remnants of the 24–25 January 2021 and the 19 May 2021 overflows, partially draped by the successive May–June 2021 volcaniclastic material.
Remotesensing 14 04605 g002
Figure 3. Chronology of data acquisition between February 2020 and July 2021 and main eruptive events in the same period (see also Table 2).
Remotesensing 14 04605 g003
Figure 4. Sciara del Fuoco topographic changes recognized between April 2020 and July 2021 through DEM comparisons; SE and SA stand for subaerial erosion and accretion, respectively. (a) May 2021 vs. April 2020 elevation difference map draped over the May 2021 DEM; (b) June 2021 vs. May 2021 elevation difference map draped over the June 2021 DEM. The main morphological changes were due to the 19 May 2021 NEC-rim collapse PDC and subsequent lava flows; (c) July 2021 vs. June 2021 elevation difference map draped over the July 2021 DEM; (d) July 2021 vs. April 2020 comparison shows the morphological changes of the subaerial SdF during the complete investigation period. The frames (ac) were cleaned for the residual mismatching between DEMs after the co-registration. Frame (d) was not cleaned to show the distribution and the magnitude of the residual mismatching between the first and the last DEMs.
Remotesensing 14 04605 g004
Figure 5. (a) Elevation difference map (cleaned for the residual mismatching between DEMs) between the July 2021 and February 2020 bathymetries draped over the 2021 DEM; ME and MA for marine erosion and accretion, respectively. (b) Elevation difference map for the subaerial (July 2021–April 2020) and submarine (July 2021–February 2020) SdF draped in semi-transparency over the July 2021 submarine and subaerial DEMS; note that the elevation difference maps were not cleaned to show the distribution and the magnitude of the residual mismatching between the first and the last DEMs.
Remotesensing 14 04605 g005
Figure 6. (a) The 2020 shaded relief map and contours (equidistance 50 m) of the central part of the SdF, where a main depression is recognizable, partially filled by small ridges and fan-shaped features; NSDT: nearshore submarine depositional terrace and related average depth of the outer edge. (b) The 2021 shaded relief map and contours (equidistance as in (a)); black and red contour lines refer to the 2020 and 2021 DEMs, respectively. MA1 and ME1–2 as in Figure 5.
Remotesensing 14 04605 g006
Figure 7. RGB colour composite of amplitude CSK images: (a) 24 March 2021–18 December 2020; (b) 25 May 2021–24 March 2021; (c) 28 June 2021–25 May 2021.
Remotesensing 14 04605 g007
Figure 8. (a) 30 July 2021 CSK-SAR amplitude image of the subaerial SdF slope combined with the 27 July 2021 multibeam (MBES in (a)) and side scan sonar (SSS in (b)) backscatter data of the shallow submarine portion of the SdF; black lines are contours (equidistance 100 m), and blue dashed lines are the SSS track lines. (c) Zoom of MBES backscatter and CKS-SAR image; (d) Zoom of the SSS backscatter with the 7 July 2021 AUV optical image; ME1, ME2, and NSDT are as in in the previous figures. Note that SSS data ensonified seafloor areas more proximal to the coast with respect to MBES data due to the different acquisition geometry of the two systems.
Remotesensing 14 04605 g008
Table 1. The February 2020–June 2021 effusive activity at Stromboli volcano and related crater-rim (NEC) collapses.
DateDescriptionReferences
28 February 2020Lava overflow from NEC[29]
28 March 2020–1 April 2020Sporadic lava overflows from NEC; NEC-rim collapse[29]
14 April 2020Lava overflow from NECThis work
15 April 2020Lava overflow from NECThis work
18 January 2021Lava overflow from NEC[34]
21 January 2021Lava overflow from NEC[34]
24 January 2021Lava overflow from NEC[34]
19–24 May 2021Lava overflow from NEC lasting for 5 days; NEC-rim collapse; PDC[34]
17 June 2021Lava overflow from NEC[34]
25 June 2021Lava overflow from NEC[34]
Table 2. Timetable of the topo-bathymetric surveys used for monitoring the morphological evolution of the SdF during the February 2020–July 2021 period; mwd: metre water depth.
SurveyDateElevation RangeCell-Size
Photogrammetric
PLÉIADES tri-stereo
7/4/2020; 4/5/2021; 8/6/20210–981 m asl1 m
UAV Photogrammetric
Saturn-mini SAPR
7/7/20210–700 m asl0.48 cm
SAR backscattering
COSMO-SkyMed
from 18/12/2020
to 30/7/2021
0–981 m asl~3 m
Bathymetry
Reson Seabat 7125 (200 kHz)
18/2/20201–400 mwd1–3 m
Bathymetry
Teledyne Reson SeaBat T50-P (200 kHz)
27/7/20215–420 mwd1–3 m
Side Scan Sonar
Edgetech 4125
27/7/20210–200 mwd0.35 m
Table 3. Information about the COSMO-SkyMed SAR images and their use in the morphological evolution analysis, with the date of related images.
Aim of the AnalysisInvestigated Parameter
SAR change detectionR: 18/12/2020
G: 24/3/2021
B: 24/3/2021–18/12/2020
R: 24/3/2021
G: 11/5/2021
B: 11/5/2021–24/3/2021
R: 11/5/2021
G: 28/6/2021
B: 28/6/2021–11/5/2021
Backscattering analysisAmplitude
Table 4. Results of the PLÉIADES and UAV survey DEM adjustments, with respect to the 2012 LIDAR DEM. RMSE0 and RMSE1 are root mean square errors computed between the 2020–2021 DEMS and the 2012 DEM before and after the co-registering procedure, respectively.
DateTypeCell-Size (m)RMSE0 (m)RMSE1 (m)
7/4/2020PLÉIADES14.350.61
4/5/2021PLÉIADES14.811.26
8/6/2021PLÉIADES14.010.89
7/7/2021UAV survey0.0481.390.90
Table 5. Cell-size and σΔZ of the different elevation difference maps used for this study.
Sciara Del FuocoElevation Difference MapCell-Size (m)σΔZ (m)
Subaerial slope4/5/2021–7/4/202011.07
8/6/2021–4/5/202111.03
7/7/2021–8/6/202111.52
7/7/2021–7/4/202011.93
Submarine slope18/2/2020–27/7/202130.41
Table 6. Area, volume, average thickness, and associated σΔZ for the main topo-bathymetric changes recorded on the Sciara del Fuoco slope during the overall monitoring period, including the subaerial and the submarine analysis (July 2021–February 2020).
SdFTypeZoneArea (m2)Volume (m3)Av. Thick (m)σΔZ
Subaerial slopeErosionSE19800−30,000 ± 10,000−3.081.07
SE26900−44,000 ± 3000−6.330.41
SE3148,000−172,000 ± 153,000−1.161.03
AccretionSA17100+25,000 ± 80003.571.07
SA212,000+37,000 ± 13,0003.141.07
SA381,000+325,000 ± 83,0004.011.03
SA43900+20,000 ± 60005.171.45
SA527,000+50,000 ± 39,0001.841.45
Submarine slopeErosionME149,000−213,000 ± 20,000−4.400.41
ME229,000−68,000 ± 12,000−2.360.41
ME313,000−18,000 ± 5000−1.370.41
ME46900−13,000 ± 3000−1.940.41
ME57000−13,000 ± 3000−1.920.41
ME67600−19,000 ± 3000−2.440.41
Minor ME30,000−24,000 ± 12,000−0.810.41
AccretionMA113,000+35,000 ± 50002.710.41
MA243,000+69,000 ± 17,0001.630.41
MA358,000+84,000 ± 24,0001.450.41
MA442,000+115,000 ± 17,0002.760.41
MA518,000+22,000 ± 80001.210.41
MA613,000+16,000 ± 50001.210.41
Publisher’s Note: MDPI stays neutral with regard to jurisdictional claims in published maps and institutional affiliations.