Abstract
This paper presented a review on the capabilities of machine learning algorithms toward Earth observation data modelling and information extraction. The main purpose was to identify new trends in the application of or research on machine learning and Earth observation—as well as to help researchers positioning new development in these domains, considering the latest peer-reviewed articles. A review of Earth observation concepts was presented, as well as current approaches and available data, followed by different machine learning applications and algorithms. Special attention was given to the contribution, potential and capabilities of Earth observation-machine learning approaches. The findings suggested that the combination of Earth observation and machine learning was successfully applied in several different fields across the world. Additionally, it was observed that all machine learning categories could be used to analyse Earth observation data or to improve acquisition processes and that RF, SVM, K-Means, NN (CNN and GAN) and A2C were among the most-used techniques. In conclusion, the combination of these technologies could prove to be crucial in a wide range of fields (e.g., agriculture, climate and biology) and should be further explored for each specific domain.
1. Introduction
Humanity has been pushing the Earth and its inherent subsystems (e.g., climate, biosphere) to their limit. Therefore, there is a real risk of moving our planet outside a safe operating space, which could lead to severe problems in a near future [1,2,3]. According to Calvin et al. [4], the majority of the research on the Human-Earth system has occurred individually. Hence, it became crucial to seek new ways or optimize the existing ones to build an enduring future for humanity [5].
In order to understand and assess the dynamics of the Human-Earth system [6], the planet has been continuously monitored through Earth observation (EO) satellites [7]. Since 1972, several hundred satellites have been launched, and as of this writing, there are more than 2000 active EO satellites [8,9], and their data already exceed the petabyte scale [7]. According to Murthy et al. [10], Xie et al. [11] and Ferreira et al. [12], the main reason behind this is the fact that EO is possibly the only cost-effective technology able to continuously provide global data at different scales. Additionally, the diversity of EO technology allows for the acquisition of data through different sensors (e.g., optical, infrared, thermal, radar and LiDAR) at different spatial, spectral and temporal resolutions. Although its benefits are myriad, the volume of data produced by EO sources (commonly represented by means of multispectral imagery) can trigger a number of problems [7]; therefore, appropriate methods and tools (e.g., Machine Learning (ML) [9,13]) are required to analyze enormous quantities of data and provide important insights regarding embedded information [12].
The term machine learning (ML) was coined in 1959 and defined as “the field of study that provides to computers the ability to learn without being explicitly programmed for that” [14]. Hence, ML has focused on the development of algorithms that allow researchers to optimize a performance criterion using historical data and experience. Over the years, the ML field has been growing, mainly due to its ability to handle huge amounts of data and extract relevant information from it, its unique characteristics pertaining to classification and forecasting, and the growth of computational power. Therefore, it has been creating new opportunities for several fields and applications (e.g., climate change [15], biodiversity deterioration [16], land-use change (e.g., deforestation), natural disasters [17], emerging diseases and other health risks [18] and management of natural resources [19]), including areas that use EO data [12]. In fact, according to Andries et al. [9] and Landry et al. [13], the majority of methods used for processing EO data are based on ML techniques.
The main research question of this work corresponds to “How does EO data and ML techniques contribute and influence the monitorization and analysis of human-earth interaction across different fields and domains?”. Therefore, this work was intended to explore the EO and ML fields to better understand their importance in today’s world. To accomplish this, a systematic review of the topics and interactions of Earth observation and machine learning was conducted. Thus, as depicted in Figure 1, this review analyzed the relationship between these areas, highlighting major approaches and applications of different types of ML techniques applied, successfully, to EO data.
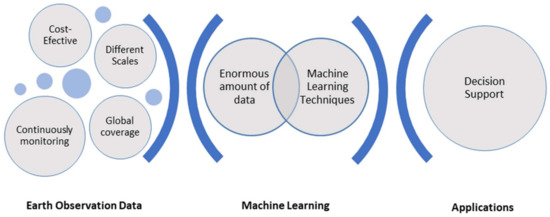
Figure 1.
Overview of a decision support system based on machine learning techniques and Earth observation data.
The paper’s structure has been divided as follows: in Section 2, we described how the research was conducted and presented the history, concepts, description, and contributions of EO. In addition, the necessity of using ML techniques to analyze data, was detailed as well as its workflow and types. Afterward, in Section 3, a review on the importance of ML and EO was presented, highlighted by case studies of different ML categories applied to EO data in benefit of different knowledge areas. In addition, in Section 4 and Section 5, further considerations were addressed and discussed concerning EO, ML, their relation and new paths and approaches to increase the applicability and knowledge concerning these subjects.
2. Literature Review
To lay the foundations and the theoretical basis for this paper, a systematic review was conducted using Google Scholar [20] and ScienceDirect [21], considering published articles in peer-reviewed journals. In this research, the topics “Earth observation” and “machine learning” were the core search criteria. To ensure the identification of relevant case studies for each ML category and type, expressions such as “classification”, “regression”, “clustering” and “dimension reduction techniques/models”, as well as “supervised”, “unsupervised”, “semi-supervised” and “reinforcement learning” were used in conjunction with “Earth observation” and/or a specific area name (e.g., “agriculture”, “mining” and “renewable energy”). The search was refined to retain state of the art results by taking into consideration the latest studies while retaining historical reports and agreements.
2.1. Earth Observation
Earth observation (EO) is a technology that provides a unique perspective on our world [22] by covering different approaches; it can include the use of drones, aircrafts and satellites. The era of satellite EO began in 1959 with the launch of Explorer 7 [23]. Currently, there are more than 2000 active EO satellites operated by different institutions (i.e., space agencies, governments and commercial operators) [8,9], creating increased availability of information and, consequently, relevant researches and applications involving EO data [24].
EO can be seen as the gathering of information concerning the planet’s physical, chemical and biological systems [18]. Therefore, EO data is considered an example of a Big Data source—in fact, the term Big Earth Data was coined by Guo et al. [25] to describe massive EO datasets. EO data can be acquired at low cost, over long periods of time, and used to monitor, assess and comprehend the entire Earth system, while addressing negative impacts inflicted by the human civilization. The United Nations report [26] confirmed the viability of using EO data to produce official SDGs statistics for several applications, such as in agriculture [27], urban and land planning [28] and food security [29].
2.1.1. Earth Observation Data
EO satellite imagery can be classified based on the sensors used. They can be either passive, receiving emitted or reflected natural radiation by the Earth’s atmosphere and surface, or active, receiving echoes from signals transmitted by the sensor, reflected or refracted by the Earth’s atmosphere and surface [9]. Aside from differences related to the type of EO sensors, the data provided by satellites can also be distinguished by their orbits. A geostationary orbit (GEO) means that the satellite tracks the same area by following the Earth’s rotation at an altitude of 35,786 km. Low Earth orbit (LEO) means that the satellite orbit is relatively close to Earth’s surface (usually at an altitude below 1000 km), and medium Earth orbit comprises a range of orbits between LEO and GEO [30].
EO sensors provide data in four resolutions: (i) spectral: the ability to define/distinguish wavelengths and ranges of radiation (hence, different spectral bands provide a spectral signature for specific land cover types [9], such as: soil [31], water [32] or buildings) [33]; (ii) spatial: refers to the area that each pixel represents on the surface; (iii) radiometric: indicates the degree of light intensities the sensor is able to distinguish [34]; and (iv) temporal: the revisit time, namely the frequency with which sensors cross a specific area on Earth. EO images can be used to identify characteristics of interest, based on how images are presented and their inherent properties, in several fields (as presented in Figure 2) such as agriculture [35], forestry [36], water [37] and urban areas [36].
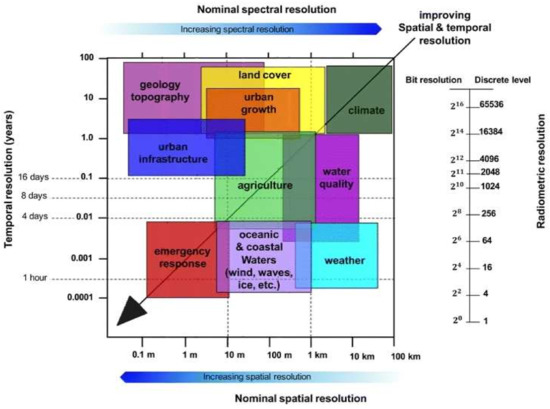
Figure 2.
Resolution requirements for specific applications, adapted from Kadhim et al. [38].
Figure 2 presents the resolution requirements (i.e., spatial, spectral, radiometric and temporal) for several fields such as agriculture, land cover and water quality. The climate field is the least demanding regarding spatial and temporal resolutions, yet it has a higher demand for spectral resolution. On the opposite side is the emergency response field, which requires the finest spatial resolution possible and a higher revisit time; however, it has the lowest spectral resolution requirement.
2.1.2. Earth Observation Limitations
Despite the advantages and applications of EO, there are also limitations associated with it, such as:
- the impossibility of having very high spectral and spatial resolution in the same data [39];
- the higher the spatial resolution, the longer the time between images of a specific area [40];
- the more advanced the sensor, the less likely one is to find historical data [40];
- the higher the spatial resolution, the higher the cost of that data [40];
- image obstruction may occur (i.e., clouds and vegetation) [26];
- the impossibility of direct observation of the bottom of bodies of water such as oceans, rivers and lakes.
2.1.3. Earth Observation Applications
Despite the disadvantages above, EO has been widely used in several fields, mainly due to its cost-effective contributions and continuous data acquisition over large areas and periods of time. According to COPERNICUS [41], areas such as: agriculture [35], which plays a crucial role in our society [42]; climate [43], where the effects of its changes (i.e., storms, droughts, fires and flooding) are becoming more recurrent and stronger, having a huge impact in essential global ecosystems such as agriculture and natural resources [44]; forests [36], in which resources are continuously depleting [45]; marine habitats [46], which represent more than 70% of Earth’s surface and generate 50% of the oxygen, 97% of the water and 1/6 of the animal protein that our society needs [47]; mining [48], where metals and minerals that are essential for modern applications (e.g., high-tech products, renewable energy, buildings) are obtained [49]; and renewable energy [50], where there is a global agreement to increase the use and support of renewable sources (e.g., solar energy, wind power, hydropower, biomass energy, waves, tides, and geothermal energy) [51] are among those with higher relevance. Moreover, EO can also be used to exploit new opportunities (i.e., management of natural resources) [19], as well as to produce relevant statistics and indicators to analyze and quantify the SD [9,26,52]. However, given the amount of data generated through EO sources, it is essential to employ methodologies focused on intelligent techniques (e.g., machine learning) to preprocess the data, extract hidden insights and predict or classify future events or samples.
2.2. Machine Learning
Machine learning (ML) is a subdomain of artificial intelligence (AI), which, according to Samuel [14], aims to provide machines with the ability to learn from data without being explicitly programmed [53]. The study and development of algorithms has played a major role in ML, aiming to train the machines to learn and make decisions based on the data and algorithms provided [54,55]. The popularity of ML is vast and increasing, which, over time, has originated many subdomains [56], including statistical learning methods [57], data mining [58], image recognition [59], natural language processing [60] and deep learning [61]. Moreover, ML applications cover a wide range of fields, including agriculture [62], renewable energies [63], disasters [64], climate [65], construction [66], human living conditions [67] and health systems [68]. This is a result of ML’s reliability, cost-effectiveness, ability to address uncertainty and speed and ability to solve problems and reach decisions.
2.2.1. Machine Learning Workflow
The process of using ML begins with raw data (e.g., EO data). These data are critically important for the success of an ML solution, and thus, should be highly representative of the intended process or case study. The more quality, quantity and diversity of data, the better the results will likely be. Additionally, raw data can be parsed, cleaned, transformed, and preprocessed [69]. Next, a review and analysis of similar case studies or applications may be performed in order to preselect a number of ML algorithms that could be suitable. Then, those algorithms are applied to the data, where it is possible to use a combination of algorithms (e.g., using a feature selection algorithm followed by a classification one [70]), compare and evaluate performances or optimize the algorithms. As a result of this learning procedure, the ML algorithm will be able to categorize or catalogue, predict actions or outcomes, detect anomalous or unexpected behaviors and identify unknown patterns and relationships [71]. Figure 3 represents a simple ML workflow approach.
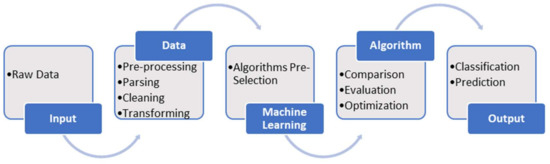
Figure 3.
ML workflow, adapted from Liakos at al. [72] and Patel & Thakkar [73].
Apart from the generic ML approach and all its inherent steps, it is also important to select the most appropriate ML algorithm based on the desired outcome [74].
2.2.2. Machine Learning Algorithms Categorization
Machine learning algorithms (MLAs), as mentioned, play a major role in the ML workflow. According to Gurevich [75], Dourish [76] and Yanofsky [77], there is some debate about the definition of an algorithm and even if it can be defined. Despite that, several entities and researchers have their definitions; for example, Merriam-Webster [78] defined an algorithm as “a step-by-step procedure for solving a problem or accomplishing some end”, while Hill [79] defined it as “a finite, abstract, effective, compound control structure, imperatively given, accomplishing a given purpose under given provisions” and Kaartinen [80] proposed an informal definition reading “any well-defined computational procedure that takes some value, or set of values, as input and produces some value, or set of values, as output”. Therefore, an MLA should be represented by a pseudo-code in which each step of the MLA implementation is well defined. As an example, Figure 4 presents the pseudo-code of a Decision Tree (i.e., ID3).
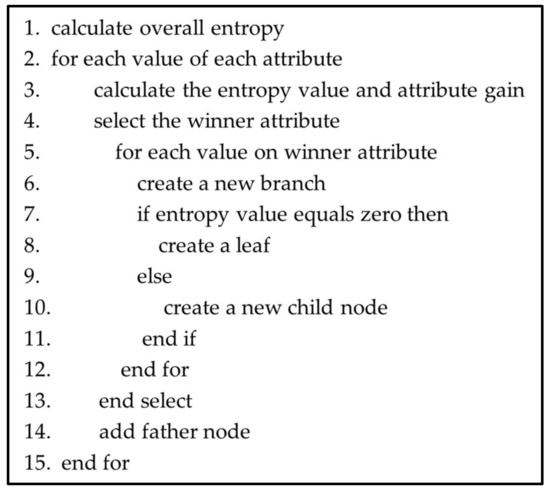
Figure 4.
Pseudo-code example (Decision Tree—ID3), adapted from Ferreira et al. [70].
There are different types of MLAs, categorized according to their learning strategy and capable of performing different tasks. Figure 5 presents the types of ML, following studies presented by Dey [53], Dutta et al. [81] and Moubayed et al. [82]. These are: supervised, unsupervised, semi-supervised and reinforcement, followed by the tasks of each ML type (i.e., classification, regression, clustering and dimensionality reduction), as well as examples of use cases and ML algorithms for each task.
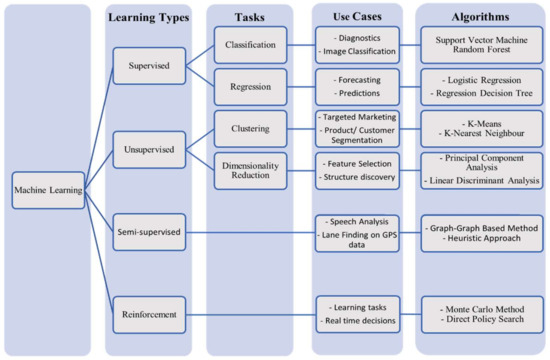
Figure 5.
MLA learning types, use cases and algorithms, adapted from Dutta et al. [81], Kim & Tagkopoulos [83], Kumar et al. [84] and Moubayed et al. [82].
2.2.3. Machine Learning Algorithm Selection
Choosing the right MLA depends on several factors, including data size, quality and diversity, as well as the application purpose. Additional considerations include accuracy, training time, output interpretability, and much more. Therefore, the choice of the right MLA is a combination of business needs, specification, experimentation and time available [71,85]. It is important to notice that each technique has its strengths and limitations, and in any application, the use of more than one technique can provide a greater perception compared to the isolated use. This was further explored in the subsequent section.
3. Machine Learning Algorithms Applied to Earth Observation Data
As mentioned above, ML algorithms are extremely useful and offer numerous benefits. A substantial number of ML algorithms have been used and described in the literature, performing a wide range of tasks in a variety of domains (e.g., agriculture [62], renewable energies [63], disasters [64], climate [65], construction [66], human living conditions [67] and health systems [68]).
In the following subsections, the authors detailed the different learning types and tasks presented in Section 2.2.2 and included examples of their application in conjunction with EO data.
3.1. Supervised Learning
Supervised learning techniques learn from a labeled training data set, where the output (variable to be classified or predicted) is known. Categorized as classification (Section 3.1.1) or regression algorithms (Section 3.1.2), they use patterns found in the training dataset to classify or predict the output on unlabeled data/observations [86,87].
3.1.1. Classification Algorithms
A classification algorithm is applicable when the overall aim is to accurately assign an observation to a class [70,88,89]. There are a broad range of classification approaches, as presented in Table 1, which also demonstrates the impact and potential use of these techniques in conjunction with EO data.

Table 1.
Examples of classification algorithms using EO data.
3.1.2. Regression Algorithms
A regression algorithm is applicable in cases where the main goal is to predict/estimate a continuous output variable of a given observation [88,101]. Table 2 synthetizes the findings within the scope of regression algorithms used in combination with EO data.
Table 2.
Examples of regression algorithms using EO data.
3.2. Unsupervised Learning
Unsupervised learning techniques use an unlabeled training dataset, where the output variable is unknown, to learn. Categorized as clustering or dimensional reduction algorithms, these learn by exploring and finding patterns or relationships in the training data set [86,87,114].
3.2.1. Clustering Algorithms
A clustering algorithm is appropriate when the purpose is to associate or divide observations into clusters [88,115]. There are a broad range of clustering approaches, as presented in Table 3, which also clearly shows the impact and potential use of these techniques in conjunction with EO data.
Table 3.
Examples of clustering algorithms using EO data.
3.2.2. Dimensionality Reduction
Dimension reductions typically follow two main approaches: feature selection (FS), applicable when there is the necessity to select fewer characteristics [126,127], and feature extraction, when the information needs to be synthesized through transformation. The aim is to create a small set of features covering much of the detail of the initial dataset [70,128,129]. Then, these features/characteristics can be fed into other techniques or otherwise used as an end result [88]. Table 4 synthetizes the findings within the scope of dimensionality reduction approaches used in combination with EO data.
Table 4.
Examples of application of dimensionality reduction approaches using EO data.
3.3. Semi-Supervised Learning
Semi-supervised learning techniques fall in between supervised and unsupervised ones since they use labeled and unlabeled data for training. Their major goal is to overcome the limitations of supervised (i.e., cost associated with labeling) and unsupervised learning (i.e., difficulty to accurately cluster unknown data) [87,143,144]. As shown in Table 5, semi-supervised techniques have a wide range of applications related to the use of EO data.
Table 5.
Examples of application of semi-supervised learning techniques using EO data.
3.4. Reinforcement Learning
Reinforcement learning techniques learn by interacting with an environment. They have no knowledge concerning which actions they should take until given a situation, and then they discover through trial and error which actions yield the greatest rewards. Their main objective is to choose actions that maximize the expected reward and minimize punishments over a given amount of time [86,87,114]. Due to the nature of these techniques, the case studies found in the literature that combined these techniques with EO data were not directly applied to a specific field. Instead, it was found that they played a key role in EO data acquisition (e.g., scheduling, optimization, image retrieval and autonomous navigation). Table 6 synthetizes the findings within the scope of reinforcement techniques used to optimized and improve the acquisition of EO data.
Table 6.
Examples of application of reinforcement learning techniques using EO data.
4. Discussion
Monitoring the human-Earth system has huge relevance to raising awareness and understanding the impact of human actions. Thus, combining Earth observation and machine learning technologies could leverage the processes of monitoring, analyzing and comprehending Earth’s subsystems.
The EO data can be used in different fields and for different purposes. However to select the most appropriate EO data source, resolution parameters (i.e., spatial, spectral, temporal and radiometric) must be taken into account. Given the amount and richness of generated EO data, it is crucial to use effective and efficient techniques (e.g., ML algorithms) to analyze this data. The ML workflow approach requires raw data (e.g., EO data) to be, for example, cleaned, transformed and preprocessed. Furthermore, the selected ML algorithms (tasks that depend on several factors, such as data size, quality and diversity, as well as the application purpose) are trained with a portion (e.g., 80%) of the data available (training dataset) and then validated with the remaining data (test dataset). After that, the applied algorithms should be compared and/or optimized in order to select the most suitable one with the best hyperparameters. As a result of this learning procedure, the ML algorithm will be able to produce the final results.
This work comprised a collection of studies, concerning the application of different techniques of EO and ML on different fields, which helped to increase the knowledge and comprehension on those domains. Despite the accomplishment of the proposed objective, several potential improvements were identified for further work that could take place (e.g., the exploration of different EO data sources, development and implementation of other ML techniques, understanding of the relationship between different data types and the choice of ML techniques and exploration of the application of EO-ML on other domains and fields).
5. Conclusions
EO is a technology able to provide data at a global scale over long periods of time and at a low cost, providing a natural ground for data mining techniques such as machine learning. This paper highlighted the role and application of Earth observation (EO)- and machine learning (ML)-related technologies. This comprehensive review considered a wide range of research studies that employed several categories of ML (i.e., supervised, unsupervised, semi-supervised and reinforcement learning) to handle EO data and address a variety of challenges across different fields. Overall, given the advantages of EO technology (i.e., cost-effective and continuous data acquisition over large areas and periods of time) and ML techniques (i.e., ability to analyze huge volumes of data, infer new knowledge and find hidden patterns), as well as the recent advances in these domains, such technologies have been creating new opportunities to analyze, monitor and solve challenges in a wide range of fields.
From the studies reviewed, it was possible to infer that the combination of EO-ML was successfully applied in several different fields and domains across the world. All the ML categories could effectively be used to analyze EO data; however, reinforcement learning is most often used to optimize and improve EO data collection/acquisition processes. Among all the categories, the most-used techniques were RF, SVM, K-Means, NN (CNN and GAN) and A2C. Findings confirmed the importance of EO and ML in today’s challenges in efforts to solve problems, optimize processes and even acquire new knowledge on specific matters. Additionally, the development and application of different and new ML approaches should be explored further, along with extensive studies concerning the comparison and analysis of different techniques to help researchers positioning new developments and studies in these domains—as well as their fields of interest.
Author Contributions
Conceptualization, B.F.; methodology, B.F.; investigation, B.F.; writing—original draft preparation, B.F.; writing—review and editing, B.F., M.I. and R.G.S.; supervision, M.I. and R.G.S. All authors have read and agreed to the published version of the manuscript.
Funding
This work has been partially supported by FCT—Fundação para a Ciência e a Tecnologia, Portugal, Project Reference UIDB/04005/2020.
Data Availability Statement
Not applicable.
Conflicts of Interest
The authors declare no conflict of interest.
References
- Donges, J.F.; Winkelmann, R.; Lucht, W.; Cornell, S.E.; Dyke, J.G.; Rockström, J.; Heitzig, J.; Schellnhuber, H.J. Closing the Loop: Reconnecting Human Dynamics to Earth System Science. Anthr. Rev. 2017, 4, 151–157. [Google Scholar] [CrossRef]
- United Nations. Framework Convention on Climate Change (2015) Adoption of the Paris Agreement, 21st Conference of the Parties; United Nations: Paris, France, 2015. [Google Scholar]
- United Nations. Transforming Our World: The 2030 Agenda for Sustainable Development. N. Era Glob. Health 2015, 1–64. [Google Scholar] [CrossRef]
- Calvin, K.; Bond-Lamberty, B. Integrated Human-Earth System Modeling—State of the Science and Future Directions. Environ. Res. Lett. 2018, 13, 063006. [Google Scholar] [CrossRef]
- Shi, W. Entropy Analysis of the Coupled Human-Earth System: Implications for Sustainable Development. Sustainability 2017, 9, 1264. [Google Scholar] [CrossRef]
- Sudmanns, M.; Tiede, D.; Lang, S.; Bergstedt, H.; Trost, G.; Augustin, H.; Baraldi, A.; Blaschke, T. Big Earth Data: Disruptive Changes in Earth Observation Data Management and Analysis? Int. J. Digit. Earth 2020, 13, 832–850. [Google Scholar] [CrossRef] [PubMed]
- Giuliani, G.; Camara, G.; Killough, B.; Minchin, S. Earth Observation Open Science: Enhancing Reproducible Science Using Data Cubes. Data 2019, 4, 147. [Google Scholar] [CrossRef]
- ESA. Space Debris by the Numbers. Available online: https://www.esa.int/Our_Activities/Operations/Space_Debris (accessed on 4 May 2020).
- Andries, A.; Morse, S.; Murphy, R.; Lynch, J.; Woolliams, E.; Fonweban, J. Translation of Earth Observation Data into Sustainable Development Indicators: An Analytical Framework. Sustain. Dev. 2019, 27, 366–376. [Google Scholar] [CrossRef]
- Murthy, K.; Shearn, M.; Smiley, B.D.; Chau, A.H.; Levine, J.; Robinson, D. SkySat-1: Very High-Resolution Imagery from a Small Satellite; Meynart, R., Neeck, S.P., Shimoda, H., Eds.; International Society for Optics and Photonics: Bellingham, WA, USA, 2014. [Google Scholar]
- Xie, M.; Jean, N.; Burke, M.; Lobell, D.; Ermon, S. Testing the Race Model Inequality in Redundant Stimuli with Variable Onset Asynchrony. J. Exp. Psychol. Hum. Percept. Perform. 2016, 35, 575–579. [Google Scholar] [CrossRef][Green Version]
- Ferreira, B.; Iten, M.; Silva, R.G. Monitoring Sustainable Development by Means of Earth Observation Data and Machine Learning: A Review. Environ. Sci. Eur. 2020, 32, 120. [Google Scholar] [CrossRef]
- Landry, T.; Sotir, M.; Rajotte, J.-F.; Byrns, D.; Charette-Migneault, F.; Beaulieu, M.; St-Charles, P.-L.; Foucher, S.; Chapdelaine, C.; Tlili, A.; et al. Applying Machine Learning to Earth Observations In A Standards Based Workflow. In Proceedings of the IGARSS 2019—2019 IEEE International Geoscience and Remote Sensing Symposium, Yokohama, Japan, 28 July 2019–2 August 2019; pp. 5567–5570. [Google Scholar]
- Samuel, A.L. Some Studies in Machine Learning Using the Game of Checkers. IBM J. Res. Dev. 1959, 3, 210–229. [Google Scholar] [CrossRef]
- Faghmous, J.H.; Kumar, V. A Big Data Guide to Understanding Climate Change: The Case for Theory-Guided Data Science. Big Data 2014, 2, 155–163. [Google Scholar] [CrossRef]
- Jeltsch, F.; Bonte, D.; Pe’er, G.; Reineking, B.; Leimgruber, P.; Balkenhol, N.; Schröder, B.; Buchmann, C.M.; Mueller, T.; Blaum, N.; et al. Integrating Movement Ecology with Biodiversity Research—Exploring New Avenues to Address Spatiotemporal Biodiversity Dynamics. Mov. Ecol. 2013, 1, 6. [Google Scholar] [CrossRef]
- Schumann, G.; Brakenridge, G.; Kettner, A.; Kashif, R.; Niebuhr, E. Assisting Flood Disaster Response with Earth Observation Data and Products: A Critical Assessment. Remote Sens. 2018, 10, 1230. [Google Scholar] [CrossRef]
- Jia, P.; Stein, A.; James, P.; Brownson, R.C.; Wu, T.; Xiao, Q.; Wang, L.; Sabel, C.E.; Wang, Y. Earth Observation: Investigating Noncommunicable Diseases from Space. Annu. Rev. Public Health 2019, 40, 85–104. [Google Scholar] [CrossRef]
- Verma, P.; Singh, P.; Srivastava, S.K. Impact of Land Use Change Dynamics on Sustainability of Groundwater Resources Using Earth Observation Data. Environ. Dev. Sustain. 2020, 22, 5185–5198. [Google Scholar] [CrossRef]
- Google Scholar. Available online: https://scholar.google.com/ (accessed on 3 September 2020).
- ScienceDirect. ScienceDirect.Com|Science, Health and Medical Journals, Full Text Articles and Books. Available online: https://www.sciencedirect.com/ (accessed on 4 September 2020).
- Onoda, M.; Young, O.R. Satellite Earth Observations and Their Impact on Society and Policy; Springer: Singapore, 2017. [Google Scholar]
- Kim, B.Y.; Lee, K.T. Radiation Component Calculation and Energy Budget Analysis for the Korean Peninsula Region. Remote Sens. 2018, 10, 1147. [Google Scholar] [CrossRef]
- NASA. EarthData. Available online: https://earthdata.nasa.gov/ (accessed on 25 October 2019).
- Guo, H.; Liu, Z.; Jiang, H.; Wang, C.; Liu, J.; Liang, D. Big Earth Data: A New Challenge and Opportunity for Digital Earth’s Development. Int. J. Digit. Earth 2017, 10, 1–12. [Google Scholar] [CrossRef]
- United Nations. Satellite Imagery and Geo-Spatial Data Task Team. Earth Observations for Official Statistics Satellite Imagery and Geospatial Data Task Team Report. 2017, p. 170. Available online: https://unstats.un.org/bigdata/task-teams/earth-observation/UNGWG_Satellite_Task_Team_Report_WhiteCover.pdf (accessed on 11 February 2021).
- Holloway, J.; Mengersen, K.; Helmstedt, K. Spatial and Machine Learning Methods of Satellite Imagery Analysis for Sustainable Development Goals. In Proceedings of the 16th Conference of International Association for Official Statistics (IAOS); Zeelenberg, K., Ed.; International Association for Official Statistics (IAOS): Paris, France, 2018. [Google Scholar]
- Yu, B.; Liu, H.; Wu, J.; Hu, Y.; Zhang, L. Automated Derivation of Urban Building Density Information Using Airborne LiDAR Data and Object-Based Method. Landsc. Urban Plan. 2010, 98, 210–219. [Google Scholar] [CrossRef]
- Ottinger, M.; Clauss, K.; Kuenzer, C. Opportunities and Challenges for the Estimation of Aquaculture Production Based on Earth Observation Data. Remote Sens. 2018, 10, 1076. [Google Scholar] [CrossRef]
- ESA. Types of Orbits. Available online: https://www.esa.int/Enabling_Support/Space_Transportation/Types_of_orbits (accessed on 11 February 2021).
- Fabre, S.; Briottet, X.; Lesaignoux, A. Estimation of Soil Moisture Content from the Spectral Reflectance of Bare Soils in the 0.4–2.5 Μm Domain. Sensors 2015, 15, 3262–3281. [Google Scholar] [CrossRef]
- Govender, M.; Chetty, K.; Bulcock, H. A Review of Hyperspectral Remote Sensing and Its Application in Vegetation and Water Resource Studies. Water Sa 2007, 33, 145–151. [Google Scholar] [CrossRef]
- Zhang, G.; Strøm, J.S.; Blanke, M.; Braithwaite, I. Spectral Signatures of Surface Materials in Pig Buildings. Biosyst. Eng. 2006, 94, 495–504. [Google Scholar] [CrossRef]
- Ose, K.; Corpetti, T.; Demagistri, L. Multispectral Satellite Image Processing. In Optical Remote Sensing of Land Surface; Elsevier: San Diego, CA, USA, 2016; pp. 57–124. [Google Scholar]
- Food and Agriculture Organization. The State of Food and Agriculture: Climate Change, Agriculture and Food Security; Food and Agriculture Organization: Rome, Italy, 2016; ISBN 9789251062159. [Google Scholar]
- Group on Earth Observations (GEO). Earth Observations and Geospatial Information: Supporting Official Statistics in Monitoring and Achieving the 2030 Agenda. 2019. Available online: https://earthobservations.org/documents/publications/201704_geo_unggim_4pager.pdf (accessed on 15 February 2021).
- García, L.; Rodríguez, D.; Wijnen, M.; Pakulski, I. Earth Observation for Water Resources Management: Current Use and Future Opportunities for the Water Sector; World Bank: Washington, DC, USA, 2016. [Google Scholar]
- Kadhim, N.; Mourshed, M.; Bray, M. Advances in Remote Sensing Applications for Urban Sustainability. Euro-Mediterr. J. Environ. Integr. 2016, 1, 7. [Google Scholar] [CrossRef]
- Al-Wassai, F.A.; Kalyankar, N.V. Major Limitations of Satellite Images. arXiv 2013, arXiv:1307.2434. [Google Scholar]
- Mitchard, E. A Review of Earth Observation Methods for Detecting and Measuring Forest Change in the Tropics; Ecometrica: Edinburgh, UK, 2016. [Google Scholar]
- European Commission. Directorate-General for Internal Market, Industry, Entrepreneurship and SMEs. Copernicus Market Report: February 2019. Issue 2. Publications Office, 2019. Available online: https://data.europa.eu/doi/10.2873/011961 (accessed on 10 June 2022).
- Mohiuddin, K.; Alam, M.M. A Short Review on Agriculture Based on Machine Learning and Image Processing. Acta Sci. Agric. 2019, 3, 55–59. [Google Scholar]
- Sathiaraj, D.; Huang, X.; Chen, J. Predicting Climate Types for the Continental United States Using Unsupervised Clustering Techniques. In Proceedings of the Environmetrics; John Wiley and Sons Ltd.: Medford, MA, USA, 2019; Volume 30. [Google Scholar]
- Rolnick, D.; Donti, P.L.; Kaack, L.H.; Kochanski, K.; Lacoste, A.; Sankaran, K.; Ross, A.S.; Milojevic-Dupont, N.; Jaques, N.; Waldman-Brown, A.; et al. Tackling Climate Change with Machine Learning. arXiv 2019, arXiv:1906.05433. [Google Scholar] [CrossRef]
- Mekonnen, M.; Sewunet, T.; Gebeyehu, M.; Azene, B.; Melesse, A.M. Gis and Remote Sensing-Based Forest Resource Assessment, Quantification, and Mapping in Amhara Region, Ethiopia. In Springer Geography; Springer: Cham, Switzerland, 2016; pp. 9–29. ISBN 9783319187877. [Google Scholar]
- Poursanidis, D.; Topouzelis, K.; Chrysoulakis, N. Mapping Coastal Marine Habitats and Delineating the Deep Limits of the Neptune’s Seagrass Meadows Using Very High Resolution Earth Observation Data. Int. J. Remote Sens. 2018, 39, 8670–8687. [Google Scholar] [CrossRef]
- Xu, L.; Bennamoun, M.; An, S.; Sohel, F.; Boussaid, F. Deep Learning for Marine Species Recognition. In Handbook of Deep Learning Applications. Smart Innovation, Systems and Technologies; Springer: Cham, Switzerland, 2019; pp. 129–145. [Google Scholar]
- Wang, J.; Zuo, R.; Xiong, Y. Mapping Mineral Prospectivity via Semi-Supervised Random Forest. Nat. Resour. Res. 2020, 29, 189–202. [Google Scholar] [CrossRef]
- Schoepfer, E.; Spröhnle, K.; Kranz, O.; Blaes, X.; Kolomaznik, J.; Hilgert, F.; Bartalos, T.; Kemper, T. Towards a Multi-Scale Approach for an Earth Observation-Based Assessment of Natural Resource Exploitation in Conflict Regions. Geocarto Int. 2017, 32, 1139–1158. [Google Scholar] [CrossRef]
- Benali, L.; Notton, G.; Fouilloy, A.; Voyant, C.; Dizene, R. Solar Radiation Forecasting Using Artificial Neural Network and Random Forest Methods: Application to Normal Beam, Horizontal Diffuse and Global Components. Renew. Energy 2019, 132, 871–884. [Google Scholar] [CrossRef]
- Lai, J.-P.; Chang, Y.-M.; Chen, C.-H.; Pai, P.-F. A Survey of Machine Learning Models in Renewable Energy Predictions. Appl. Sci. 2020, 10, 5975. [Google Scholar] [CrossRef]
- Ferreira, B.A.S.; Silva, R.G. A Review of Optimization Techniques for Supplier Selection and Order Allocation. In Competitive Drivers for Improving Future Business Performance; IGI Global: Hershey, PA, USA, 2021; pp. 114–129. [Google Scholar]
- Dey, A. Machine Learning Algorithms: A Review. Int. J. Comput. Sci. Inf. Technol. 2016, 7, 1174–1179. [Google Scholar]
- Ongsulee, P. Artificial Intelligence, Machine Learning and Deep Learning. In Proceedings of the 2017 15th International Conference on ICT and Knowledge Engineering (ICT&KE), Bangkok, Thailand, 22–24 November 2017; pp. 1–6. [Google Scholar]
- Jakhar, D.; Kaur, I. Artificial Intelligence, Machine Learning and Deep Learning: Definitions and Differences. Clin. Exp. Dermatol. 2020, 45, 131–132. [Google Scholar] [CrossRef]
- Luxton, D.D. An Introduction to Artificial Intelligence in Behavioral and Mental Health Care. In Artificial Intelligence in Behavioral and Mental Health Care; Elsevier: Amsterdam, The Netherlands, 2016; pp. 1–26. ISBN 9780128007921. [Google Scholar]
- James, G.; Witten, D.; Hastie, T.; Tibshirani, R. An Introduction to Statistical Learning; Springer: New York, NY, USA, 2013. [Google Scholar]
- Rajaraman, A.; Ullman, J.D. Data Mining. In Mining of Massive Datasets; Cambridge University Press: Cambridge, CA, USA, 2011; Volume 2, pp. 1–17. [Google Scholar]
- Singh, V.; Girish, D.; Ralescu, A. Image Understanding—A Brief Review of Scene Classification and Recognition. MAICS 2017, 2017, 85–91. [Google Scholar]
- Chowdhary, K.R. Natural Language Processing; Springer: New Delhi, India, 2020; Volume 39. [Google Scholar]
- Goodfellow, I.; Bengio, Y.; Courville, A. Deep Learning; MIT Press: Cambridge, MA, USA, 2016. [Google Scholar]
- Kamir, E.; Waldner, F.; Hochman, Z. Estimating Wheat Yields in Australia Using Climate Records, Satellite Image Time Series and Machine Learning Methods. ISPRS J. Photogramm. Remote Sens. 2020, 160, 124–135. [Google Scholar] [CrossRef]
- Adedeji, P.A.; Akinlabi, S.; Madushele, N.; Olatunji, O.O. Wind Turbine Power Output Very Short-Term Forecast: A Comparative Study of Data Clustering Techniques in a PSO-ANFIS Model. J. Clean. Prod. 2020, 254, 120135. [Google Scholar] [CrossRef]
- Lizundia-Loiola, J.; Otón, G.; Ramo, R.; Chuvieco, E. A Spatio-Temporal Active-Fire Clustering Approach for Global Burned Area Mapping at 250 m from MODIS Data. Remote Sens. Environ. 2020, 236, 111493. [Google Scholar] [CrossRef]
- Zhang, G.; Ghamisi, P.; Zhu, X.X. Fusion of Heterogeneous Earth Observation Data for the Classification of Local Climate Zones. IEEE Trans. Geosci. Remote Sens. 2019, 57, 7623–7642. [Google Scholar] [CrossRef]
- Huang, X.; Cao, R.; Cao, Y. A Density-Based Clustering Method for the Segmentation of Individual Buildings from Filtered Airborne LiDAR Point Clouds. J. Indian Soc. Remote Sens. 2019, 47, 907–921. [Google Scholar] [CrossRef]
- Foody, G.M.; Ling, F.; Boyd, D.S.; Li, X.; Wardlaw, J.; Foody, G.M.; Ling, F.; Boyd, D.S.; Li, X.; Wardlaw, J. Earth Observation and Machine Learning to Meet Sustainable Development Goal 8.7: Mapping Sites Associated with Slavery from Space. Remote Sens. 2019, 11, 266. [Google Scholar] [CrossRef]
- Damgacioglu, H.; Celik, E.; Celik, N. Estimating Gene Expression from High-Dimensional DNA Methylation Levels in Cancer Data: A Bimodal Unsupervised Dimension Reduction Algorithm. Comput. Ind. Eng. 2019, 130, 348–357. [Google Scholar] [CrossRef]
- Oladipupo, T. Introduction to Machine Learning. In New Advances in Machine Learning; IntechOpen: London, UK, 2010. [Google Scholar] [CrossRef]
- Ferreira, B.; Silva, R.G.; Pereira, V. Feature Selection Using Non-Binary Decision Trees Applied to Condition Monitoring. In Proceedings of the 2017 22nd IEEE International Conference on Emerging Technologies and Factory Automation (ETFA), Limassol, Cyprus, 12–15 September 2017; pp. 1–7. [Google Scholar] [CrossRef]
- Attaran, M.; Deb, P. Machine Learning: The New “Big Thing” for Competitive Advantage. Int. J. Knowl. Eng. Data Min. 2018, 5, 1. [Google Scholar] [CrossRef]
- Liakos, K.G.; Busato, P.; Moshou, D.; Pearson, S.; Bochtis, D. Machine Learning in Agriculture: A Review. Sensors 2018, 18, 2674. [Google Scholar] [CrossRef]
- Patel, P.; Thakkar, A. The Upsurge of Deep Learning for Computer Vision Applications. Int. J. Electr. Comput. Eng. 2020, 10, 538. [Google Scholar] [CrossRef]
- Zhang, Y. New Advances in Machine Learning; Zhang, Y., Ed.; InTech: London, UK, 2010; ISBN 978-953-307-034-6. [Google Scholar] [CrossRef]
- Gurevich, Y. What Is an Algorithm? In Lecture Notes in Computer Science (Including Subseries Lecture Notes in Artificial Intelligence and Lecture Notes in Bioinformatics); Springer: Berlin/Heidelberg, Germany, 2012; Volume 7147, ISBN 9783642276590. [Google Scholar]
- Dourish, P. Algorithms and Their Others: Algorithmic Culture in Context. Big Data Soc. 2016, 3, 2053951716665128. [Google Scholar] [CrossRef]
- Yanofsky, N.S. Towards a Definition of an Algorithm. J. Log. Comput. 2011, 21, 253–286. [Google Scholar] [CrossRef]
- Merriam-Webster. Algorithm. Available online: https://www.merriam-webster.com/dictionary/algorithm (accessed on 21 August 2020).
- Hill, R.K. What an Algorithm Is. Philos. Technol. 2016, 29, 35–59. [Google Scholar] [CrossRef]
- Kaartinen, M.T. Introduction to Research Introduction to Science and Academic; Book Zone Publication: Chittagong, Bangladesh, 2009; ISBN 9780262033848. [Google Scholar]
- Dutta, N.; Umashankar, S.; Shankar, V.K.A.; Padmanaban, S.; Leonowicz, Z.; Wheeler, P. Centrifugal Pump Cavitation Detection Using Machine Learning Algorithm Technique. In Proceedings of the 2018 IEEE International Conference on Environment and Electrical Engineering and 2018 IEEE Industrial and Commercial Power Systems Europe (EEEIC/I&CPS Europe), Palermo, Italy, 12–15 June 2018; pp. 1–6. [Google Scholar]
- Moubayed, A.; Injadat, M.; Nassif, A.B.; Lutfiyya, H.; Shami, A. E-Learning: Challenges and Research Opportunities Using Machine Learning & Data Analytics. IEEE Access 2018, 6, 39117–39138. [Google Scholar] [CrossRef]
- Kim, K.-J.; Tagkopoulos, I. Application of Machine Learning in Rheumatic Disease Research. Korean J. Intern. Med. 2019, 34, 708–722. [Google Scholar] [CrossRef]
- Kumar, A.R.; Salau, A.O.; Gupta, S.; Arora, S. A Survey of Machine Learning Methods for IoT and Their Future Applications. Amity J. Comput. Sci. 2018, 2, 1–5. [Google Scholar]
- Raschka, S. Model Evaluation, Model Selection, and Algorithm Selection in Machine Learning. arXiv 2018, arXiv:1811.12808. [Google Scholar]
- Kumar, N.; Sharma, D. A Review on Machine Learning Algorithms, Tasks and Applications. Int. J. Adv. Res. Comput. Eng. Technol. (IJARCET) 2017, 6, 1548–1552. [Google Scholar]
- Reddy, P.; Viswanath, P.; Reddy B, E. Semi-Supervised Learning: A Brief Review. Int. J. Eng. Technol. 2018, 7, 81. [Google Scholar] [CrossRef]
- Holloway, J.; Mengersen, K. Statistical Machine Learning Methods and Remote Sensing for Sustainable Development Goals: A Review. Remote Sens. 2018, 10, 1365. [Google Scholar] [CrossRef]
- Chandrashekar, G.; Sahin, F. A Survey on Feature Selection Methods. Comput. Electr. Eng. 2014, 40, 16–28. [Google Scholar] [CrossRef]
- Firozjaei, M.K.; Sedighi, A.; Argany, M.; Jelokhani-Niaraki, M.; Arsanjani, J.J. A Geographical Direction-Based Approach for Capturing the Local Variation of Urban Expansion in the Application of CA-Markov Model. Cities 2019, 93, 120–135. [Google Scholar] [CrossRef]
- Helber, P.; Bischke, B.; Dengel, A.; Borth, D. EuroSAT: A Novel Dataset and Deep Learning Benchmark for Land Use and Land Cover Classification. IEEE J. Sel. Top. Appl. Earth Obs. Remote Sens. 2019, 12, 2217–2226. [Google Scholar] [CrossRef]
- Kuffer, M.; Wang, J.; Nagenborg, M.; Pfeffer, K.; Kohli, D.; Sliuzas, R.; Persello, C. The Scope of Earth-Observation to Improve the Consistency of the SDG Slum Indicator. ISPRS Int. J. Geo-Inf. 2018, 7, 428. [Google Scholar] [CrossRef]
- Zhong, L.; Hu, L.; Zhou, H. Deep Learning Based Multi-Temporal Crop Classification. Remote Sens. Environ. 2019, 221, 430–443. [Google Scholar] [CrossRef]
- Wang, L.; Dong, Q.; Yang, L.; Gao, J.; Liu, J. Crop Classification Based on a Novel Feature Filtering and Enhancement Method. Remote Sens. 2019, 11, 455. [Google Scholar] [CrossRef]
- Ahmed, A.M.; Ibrahim, S.K.; Yacout, S. Hyperspectral Image Classification Based on Logical Analysis of Data. In Proceedings of the 2019 IEEE Aerospace Conference, Big Sky, MT, USA, 2–9 March 2019; pp. 1–9. [Google Scholar] [CrossRef]
- Vuolo, F.; Neuwirth, M.; Immitzer, M.; Atzberger, C.; Ng, W.-T. How Much Does Multi-Temporal Sentinel-2 Data Improve Crop Type Classification? Int. J. Appl. Earth Obs. Geoinf. 2018, 72, 122–130. [Google Scholar] [CrossRef]
- Puletti, N.; Chianucci, F.; Castaldi, C. Use of Sentinel-2 for Forest Classification in Mediterranean Environments. Ann. Silvic. Res. 2018, 42, 32–38. [Google Scholar] [CrossRef]
- Dos Reis, A.A.; Carvalho, M.C.; de Mello, J.M.; Gomide, L.R.; Ferraz Filho, A.C.; Acerbi Junior, F.W. Spatial Prediction of Basal Area and Volume in Eucalyptus Stands Using Landsat TM Data: An Assessment of Prediction Methods. N. Z. J. For. Sci. 2018, 48, 1. [Google Scholar] [CrossRef]
- Zhang, M.; Chen, F.; Tian, B.; Liang, D. Multi-Temporal SAR Image Classification of Coastal Plain Wetlands Using a New Feature Selection Method and Random Forests. Remote Sens. Lett. 2019, 10, 312–321. [Google Scholar] [CrossRef]
- Schäfer, P.; Pflugmacher, D.; Hostert, P.; Leser, U. Classifying Land Cover from Satellite Images Using Time Series Analytics. CEUR Workshop Proc. 2018, 2083, 10–15. [Google Scholar]
- Hinton, G.E.; Salakhutdinov, R.R. Reducing the Dimensionality of Data with Neural Networks. Science 2006, 313, 504–507. [Google Scholar] [CrossRef]
- Aghighi, H.; Azadbakht, M.; Ashourloo, D.; Shahrabi, H.S.; Radiom, S. Machine Learning Regression Techniques for the Silage Maize Yield Prediction Using Time-Series Images of Landsat 8 OLI. IEEE J. Sel. Top. Appl. Earth Obs. Remote Sens. 2018, 11, 4563–4577. [Google Scholar] [CrossRef]
- Carter, C.; Liang, S. Evaluation of Ten Machine Learning Methods for Estimating Terrestrial Evapotranspiration from Remote Sensing. Int. J. Appl. Earth Obs. Geoinf. 2019, 78, 86–92. [Google Scholar] [CrossRef]
- Fang, D.; Zhang, X.; Yu, Q.; Jin, T.C.; Tian, L. A Novel Method for Carbon Dioxide Emission Forecasting Based on Improved Gaussian Processes Regression. J. Clean. Prod. 2018, 173, 143–150. [Google Scholar] [CrossRef]
- Kim, J.S.; Baek, D.; Seo, I.W.; Shin, J. Retrieving Shallow Stream Bathymetry from UAV-Assisted RGB Imagery Using a Geospatial Regression Method. Geomorphology 2019, 341, 102–114. [Google Scholar] [CrossRef]
- Mao, H.; Meng, J.; Ji, F.; Zhang, Q.; Fang, H. Comparison of Machine Learning Regression Algorithms for Cotton Leaf Area Index Retrieval Using Sentinel-2 Spectral Bands. Appl. Sci. 2019, 9, 1459. [Google Scholar] [CrossRef]
- Guerini Filho, M.; Kuplich, T.M.; Quadros, F.L.F. De Estimating Natural Grassland Biomass by Vegetation Indices Using Sentinel 2 Remote Sensing Data. Int. J. Remote Sens. 2020, 41, 2861–2876. [Google Scholar] [CrossRef]
- Sharma, B.; Kumar, M.; Denis, D.M.; Singh, S.K. Appraisal of River Water Quality Using Open-Access Earth Observation Data Set: A Study of River Ganga at Allahabad (India). Sustain. Water Resour. Manag. 2019, 5, 755–765. [Google Scholar] [CrossRef]
- Yuan, Q.; Li, S.; Yue, L.; Li, T.; Shen, H.; Zhang, L. Monitoring the Variation of Vegetation Water Content with Machine Learning Methods: Point-Surface Fusion of MODIS Products and GNSS-IR Observations. Remote Sens. 2019, 11, 1440. [Google Scholar] [CrossRef]
- Haase, D.; Jänicke, C.; Wellmann, T. Front and Back Yard Green Analysis with Subpixel Vegetation Fractions from Earth Observation Data in a City. Landsc. Urban Plan. 2019, 182, 44–54. [Google Scholar] [CrossRef]
- Chu, L.; Wang, L.-J.; Jiang, J.; Liu, X.; Sawada, K.; Zhang, J. Comparison of Landslide Susceptibility Maps Using Random Forest and Multivariate Adaptive Regression Spline Models in Combination with Catchment Map Units. Geosci. J. 2019, 23, 341–355. [Google Scholar] [CrossRef]
- Mudele, O.; Bayer, F.M.; Zanandrez, L.F.R.; Eiras, A.E.; Gamba, P. Modeling the Temporal Population Distribution of Ae. Mosquito Using Big Earth Observation Data. IEEE Access 2020, 8, 14182–14194. [Google Scholar] [CrossRef]
- Boyte, S.P.; Wylie, B.K.; Howard, D.M.; Dahal, D.; Gilmanov, T. Estimating Carbon and Showing Impacts of Drought Using Satellite Data in Regression-Tree Models. Int. J. Remote Sens. 2018, 39, 374–398. [Google Scholar] [CrossRef]
- Rashidi, H.H.; Tran, N.K.; Betts, E.V.; Howell, L.P.; Green, R. Artificial Intelligence and Machine Learning in Pathology: The Present Landscape of Supervised Methods. Acad. Pathol. 2019, 6, 2374289519873088. [Google Scholar] [CrossRef]
- Hastie, T.; Tibshirani, R.; Friedman, J. The Elements of Statistical Learning: Data Mining, Inference, and Prediction. J. Am. Stat. Assoc. 2009, 99, 567. [Google Scholar] [CrossRef]
- Micheletti, N.; Tonini, M.; Lane, S.N. Geomorphological Activity at a Rock Glacier Front Detected with a 3D Density-Based Clustering Algorithm. Geomorphology 2017, 278, 287–297. [Google Scholar] [CrossRef]
- Rezapour, M.J.; Abedi, M.; Bahroudi, A.; Rahimi, H. A Clustering Approach for Mineral Potential Mapping: A Deposit-Scale Porphyry Copper Exploration Targeting. GEOPERSIA 2019, 10, 149–163. [Google Scholar] [CrossRef]
- Verma, R.R.; Manjunath, B.L.; Singh, N.P.; Kumar, A.; Asolkar, T.; Chavan, V.; Srivastava, T.K.; Singh, P. Soil Mapping and Delineation of Management Zones in the Western Ghats of Coastal India. Land Degrad. Dev. 2018, 29, 4313–4322. [Google Scholar] [CrossRef]
- Drastichová, M.; Filzmoser, P. Assessment of Sustainable Development Using Cluster Analysis and Principal Component Analysis. Probl. Ekorozwoju 2019, 14, 7–24. [Google Scholar]
- Reza, M.N.; Na, I.S.; Baek, S.W.; Lee, K.H. Rice Yield Estimation Based on K-Means Clustering with Graph-Cut Segmentation Using Low-Altitude UAV Images. Biosyst. Eng. 2019, 177, 109–121. [Google Scholar] [CrossRef]
- Lv, Z.; Liu, T.; Shi, C.; Benediktsson, J.A.; Du, H. Novel Land Cover Change Detection Method Based on K-Means Clustering and Adaptive Majority Voting Using Bitemporal Remote Sensing Images. IEEE Access 2019, 7, 34425–34437. [Google Scholar] [CrossRef]
- Peresan, A.; Gentili, S. Seismic Clusters Analysis in Northeastern Italy by the Nearest-Neighbor Approach. Phys. Earth Planet. Inter. 2018, 274, 87–104. [Google Scholar] [CrossRef]
- Tamiminia, H.; Homayouni, S.; McNairn, H.; Safari, A. A Particle Swarm Optimized Kernel-Based Clustering Method for Crop Mapping from Multi-Temporal Polarimetric L-Band SAR Observations. Int. J. Appl. Earth Obs. Geoinf. 2017, 58, 201–212. [Google Scholar] [CrossRef]
- Chen, S.; Sun, T.; Yang, F.; Sun, H.; Guan, Y. An Improved Optimum-Path Forest Clustering Algorithm for Remote Sensing Image Segmentation. Comput. Geosci. 2018, 112, 38–46. [Google Scholar] [CrossRef]
- Tatui, F.; Constantin, S. Nearshore Sandbar Crest Position Dynamics Analysed Based on Earth Observation Data. Remote Sens. Environ. 2020, 237, 111555. [Google Scholar] [CrossRef]
- Bharti, K.K.; Singh, P.K. Hybrid Dimension Reduction by Integrating Feature Selection with Feature Extraction Method for Text Clustering. Expert Syst. Appl. 2015, 42, 3105–3114. [Google Scholar] [CrossRef]
- Hira, Z.M.; Gillies, D.F. A Review of Feature Selection and Feature Extraction Methods Applied on Microarray Data. Adv. Bioinform. 2015, 2015, 198363. [Google Scholar] [CrossRef]
- Silva, R.G.; Wilcox, S.J. Feature Evaluation and Selection for Condition Monitoring Using a Self-Organizing Map and Spatial Statistics. Artif. Intell. Eng. Des. Anal. Manuf. 2019, 33, 1–10. [Google Scholar] [CrossRef]
- Van Der Maaten, L.J.P.; Postma, E.O.; Van Den Herik, H.J. Dimensionality Reduction: A Comparative Review. J. Mach. Learn. Res. 2009, 10, 13. [Google Scholar] [CrossRef]
- Washington, P.; Paskov, K.M.; Kalantarian, H.; Stockham, N.; Voss, C.; Kline, A.; Patnaik, R.; Chrisman, B.; Varma, M.; Tariq, Q.; et al. Feature Selection and Dimension Reduction of Social Autism Data. In Biocomputing 2020; World Scientific: Singapore, 2019; pp. 707–718. [Google Scholar]
- Wang, D.; Gu, J. VASC: Dimension Reduction and Visualization of Single-Cell RNA-Seq Data by Deep Variational Autoencoder. Genom. Proteom. Bioinform. 2018, 16, 320–331. [Google Scholar] [CrossRef]
- Owen, N.E.; Liuzzo, L. Impact of Land Use on Water Resources via a Gaussian Process Emulator with Dimension Reduction. J. Hydroinform. 2019, 21, 411–426. [Google Scholar] [CrossRef]
- Hou, E.; Wen, Q.; Che, X.; Chen, W.; Wei, J.; Ye, Z. Study on Recognition of Mine Water Sources Based on Statistical Analysis. Arab. J. Geosci. 2020, 13, 5. [Google Scholar] [CrossRef]
- Jahangir, H.; Tayarani, H.; Baghali, S.; Ahmadian, A.; Elkamel, A.; Aliakbar Golkar, M.; Castilla, M. A Novel Electricity Price Forecasting Approach Based on Dimension Reduction Strategy and Rough Artificial Neural Networks. IEEE Trans. Ind. Inform. 2019, 16, 2369–2381. [Google Scholar] [CrossRef]
- Bai, Y.; Sun, Z.; Zeng, B.; Long, J.; Li, L.; de Oliveira, J.V.; Li, C. A Comparison of Dimension Reduction Techniques for Support Vector Machine Modeling of Multi-Parameter Manufacturing Quality Prediction. J. Intell. Manuf. 2019, 30, 2245–2256. [Google Scholar] [CrossRef]
- Xu, J.; Dang, C. A New Bivariate Dimension Reduction Method for Efficient Structural Reliability Analysis. Mech. Syst. Signal Process. 2019, 115, 281–300. [Google Scholar] [CrossRef]
- Yang, S.; Yang, S.; Fang, Z.; Yu, X.; Rui, L.; Ma, Y. Fault Prediction for Software System in Industrial Internet: A Deep Learning Algorithm via Effective Dimension Reduction. In Proceedings of the Communications in Computer and Information Science; Springer: Singapore, 2019; Volume 1137, pp. 572–580. [Google Scholar]
- Dogan, T.; Uysal, A.K. The Impact of Feature Selection on Urban Land Cover Classification. Int. J. Intell. Syst. Appl. Eng. 2018, 6, 59–64. [Google Scholar] [CrossRef]
- Bui, Q.T.; Pham, M.V.; Nguyen, Q.H.; Nguyen, L.X.; Pham, H.M. Whale Optimization Algorithm and Adaptive Neuro-Fuzzy Inference System: A Hybrid Method for Feature Selection and Land Pattern Classification. Int. J. Remote Sens. 2019, 40, 5078–5093. [Google Scholar] [CrossRef]
- Georganos, S.; Grippa, T.; Vanhuysse, S.; Lennert, M.; Shimoni, M.; Kalogirou, S.; Wolff, E. Less Is More: Optimizing Classification Performance through Feature Selection in a Very-High-Resolution Remote Sensing Object-Based Urban Application. GIScience Remote Sens. 2018, 55, 221–242. [Google Scholar] [CrossRef]
- Wells, K.C.; Millet, D.B.; Bousserez, N.; Henze, D.K.; Griffis, T.J.; Chaliyakunnel, S.; Dlugokencky, E.J.; Saikawa, E.; Xiang, G.; Prinn, R.G.; et al. Top-down Constraints on Global N2O Emissions at Optimal Resolution: Application of a New Dimension Reduction Technique. Atmos. Chem. Phys. 2018, 18, 735–756. [Google Scholar] [CrossRef]
- Kiala, Z.; Mutanga, O.; Odindi, J.; Peerbhay, K. Feature Selection on Sentinel-2 Multispectral Imagery for Mapping a Landscape Infested by Parthenium Weed. Remote Sens. 2019, 11, 1892. [Google Scholar] [CrossRef]
- Van Engelen, J.E.; Hoos, H.H.; Fawcett Jesper E van Engelen, T.B.; Hoos hh, H.H. A Survey on Semi-Supervised Learning. Mach. Learn. 2020, 109, 373–440. [Google Scholar] [CrossRef]
- Hajighorbani, M.; Mohammad, S.; Hashemi, R.; Broumandnia, A.; Faridpour, M. A Review of Some Semi-Supervised Learning Methods. J. Knowl.-Based Eng. Innov. 2016, 2, 250–259. [Google Scholar]
- Djuric, N.; Kansakar, L.; Vucetic, S. Semi-Supervised Learning for Integration of Aerosol Predictions from Multiple Satellite Instruments. Available online: https://www.researchgate.net/publication/262321959_Semi-supervised_learning_for_integration_of_aerosol_predictions_from_multiple_satellite_instruments (accessed on 28 August 2020).
- Li, Z.; Gurgel, H.; Dessay, N.; Hu, L.; Xu, L.; Gong, P. Semi-Supervised Text Classification Framework: An Overview of Dengue Landscape Factors and Satellite Earth Observation. Int. J. Environ. Res. Public Health 2020, 17, 4509. [Google Scholar] [CrossRef]
- Liu, B.; Yu, X.; Zhang, P.; Tan, X.; Yu, A.; Xue, Z. A Semi-Supervised Convolutional Neural Network for Hyperspectral Image Classification. Remote Sens. Lett. 2017, 8, 839–848. [Google Scholar] [CrossRef]
- Ling, Z.; Li, X.; Zou, W.; Guo, S. Semi-Supervised Learning via Convolutional Neural Network for Hyperspectral Image Classification. In Proceedings of the 2018 24th International Conference on Pattern Recognition (ICPR), Beijing, China, 20–24 August 2018; pp. 1–6. [Google Scholar]
- Qin, X.; Yu, W.; Wang, P.; Chen, T.; Zou, H. Semi-Supervised Classification of PolSAR Image Based on Self-Training Convolutional Neural Network. In Proceedings of the Lecture Notes in Electrical Engineering; Springer: Singapore, 2020; Volume 657, pp. 405–417. [Google Scholar]
- Beauchemin, M. Semi-Supervised Map Regionalization for Categorical Data. Int. J. Remote Sens. 2019, 40, 9401–9411. [Google Scholar] [CrossRef]
- Liu, J.; Chen, K.; Xu, G.; Li, H.; Yan, M.; DIao, W.; Sun, X. Semi-Supervised Change Detection Based on Graphs with Generative Adversarial Networks. In Proceedings of the International Geoscience and Remote Sensing Symposium (IGARSS), Yokohama, Japan, 28 July–2 August 2019; pp. 74–77. [Google Scholar]
- Gao, F.; Yang, Y.; Wang, J.; Sun, J.; Yang, E.; Zhou, H. A Deep Convolutional Generative Adversarial Networks (DCGANs)-Based Semi-Supervised Method for Object Recognition in Synthetic Aperture Radar (SAR) Images. Remote Sens. 2018, 10, 846. [Google Scholar] [CrossRef]
- Weinstein, B.G.; Marconi, S.; Bohlman, S.; Zare, A.; White, E. Individual Tree-Crown Detection in Rgb Imagery Using Semi-Supervised Deep Learning Neural Networks. Remote Sens. 2019, 11, 1309. [Google Scholar] [CrossRef]
- Zhang, Y.; Cao, G.; Li, X.; Wang, B.; Fu, P. Active Semi-Supervised Random Forest for Hyperspectral Image Classification. Remote Sens. 2019, 11, 2974. [Google Scholar] [CrossRef]
- Pandey, A.C.; Kulhari, A. Semi-Supervised Spatiotemporal Classification and Trend Analysis of Satellite Images. In Advances in Intelligent Systems and Computing; Springer: Singapore, 2018; Volume 554, pp. 353–363. [Google Scholar]
- Camargo, G.; Bugatti, P.H.; Saito, P.T.M. Active Semi-Supervised Learning for Biological Data Classification. PLoS ONE 2020, 15, e0237428. [Google Scholar] [CrossRef]
- Chen, M.; Chen, Y.; Chen, Y.; Qi, W. Deep Reinforcement Learning for Agile Satellite Scheduling Problem. In Proceedings of the 2019 IEEE Symposium Series on Computational Intelligence, SSCI 2019, Xiamen, China, 6–9 December 2019; pp. 126–132. [Google Scholar]
- Hadj-Salah, A.; Verdier, R.; Caron, C.; Picard, M.; Capelle, M. Schedule Earth Observation Satellites with Deep Reinforcement Learning. arXiv 2019, arXiv:1911.05696. [Google Scholar]
- Meng, X.; Wu, L.; Yu, S. Research on Resource Allocation Method of Space Information Networks Based on Deep Reinforcement Learning. Remote Sens. 2019, 11, 448. [Google Scholar] [CrossRef]
- Du, Y.; Wang, T.; Xin, B.; Wang, L.; Chen, Y.; Xing, L. A Data-Driven Parallel Scheduling Approach for Multiple Agile Earth Observation Satellites. IEEE Trans. Evol. Comput. 2019, 24, 679–693. [Google Scholar] [CrossRef]
- Lam, J.T.; Rivest, F.; Berger, J. Deep Reinforcement Learning for Multi-Satellite Collection Scheduling. In Lecture Notes in Computer Science (Including Subseries Lecture Notes in Artificial Intelligence and Lecture Notes in Bioinformatics); Springer: London, UK, 2019; Volume 11934, pp. 184–196. [Google Scholar]
- Wang, C.; Wang, J.; Shen, Y.; Zhang, X. Autonomous Navigation of UAVs in Large-Scale Complex Environments: A Deep Reinforcement Learning Approach. IEEE Trans. Veh. Technol. 2019, 68, 2124–2136. [Google Scholar] [CrossRef]
- Peng, S.; Chen, H.; Du, C.; Li, J.; Jing, N. Onboard Observation Task Planning for an Autonomous Earth Observation Satellite Using Long Short-Term Memory. IEEE Access 2018, 6, 65118–65129. [Google Scholar] [CrossRef]
- Arai, K. Pursuit Reinforcement Competitive Learning: PRCL Based Online Clustering with Learning Automata. Int. J. Adv. Res. Artif. Intell. 2016, 5, 9–16. [Google Scholar] [CrossRef]
- Mou, L.; Saha, S.; Hua, Y.; Bovolo, F.; Bruzzone, L.; Zhu, X.X. Deep Reinforcement Learning for Band Selection in Hyperspectral Image Classification. IEEE Trans. Geosci. Remote Sens. 2022, 60, 5504414. [Google Scholar] [CrossRef]
- Ahn, H.S.; Jung, O.; Choi, S.; Son, J.H.; Chung, D.; Kim, G. An Optimal Satellite Antenna Profile Using Reinforcement Learning. IEEE Trans. Syst. Man Cybern. Part C Appl. Rev. 2011, 41, 393–406. [Google Scholar] [CrossRef]
- Xiong, Y.; Guo, L.; Huang, Y.; Chen, L. Intelligent Thermal Control Strategy Based on Reinforcement Learning for Space Telescope. J. Thermophys. Heat Transf. 2020, 34, 37–44. [Google Scholar] [CrossRef]
- Wang, H.; Yang, Z.; Zhou, W.; Li, D. Online Scheduling of Image Satellites Based on Neural Networks and Deep Reinforcement Learning. Chin. J. Aeronaut. 2019, 32, 1011–1019. [Google Scholar] [CrossRef]
- Zhao, X.; Wang, Z.; Zheng, G. Two-Phase Neural Combinatorial Optimization with Reinforcement Learning for Agile Satellite Scheduling. J. Aerosp. Inf. Syst. 2020, 17, 346–357. [Google Scholar] [CrossRef]
- Shen, X.; Liu, B.; Zhou, Y.; Zhao, J.; Liu, M. Remote Sensing Image Captioning via Variational Autoencoder and Reinforcement Learning. Knowl.-Based Syst. 2020, 203, 105920. [Google Scholar] [CrossRef]
Publisher’s Note: MDPI stays neutral with regard to jurisdictional claims in published maps and institutional affiliations. |
© 2022 by the authors. Licensee MDPI, Basel, Switzerland. This article is an open access article distributed under the terms and conditions of the Creative Commons Attribution (CC BY) license (https://creativecommons.org/licenses/by/4.0/).