Abstract
Dust storms are common in Mongolia and northern China, this is a serious threat to the ecological security and socioeconomic development of both countries and the surrounding areas. However, a complete quantitative study of the source area, affected area, and moving path of dust storm events (DSEs) in Mongolia and China is still lacking. In this study, we monitored and analyzed the spatiotemporal characteristics of the source area and affected areas of DSEs in Mongolia and China using the high-spatiotemporal-resolution images taken by the Himawari-8 satellite from March to June 2016–2020. In addition, we calculated the moving path of dusty weather using the HYSPLIT model. The results show that (1) temporality, a total of 605 DSEs occurred in the study area, with most of them occurring in April (232 DSEs), followed by May (173 DSEs). Spatially, the dust storm sources were concentrated in the arid inland areas such as the Taklimakan Desert (TK, 138 DSEs) and Badain Jaran Desert (BJ, 87 DSEs) in the western, and the Mongolian Gobi Desert (GD, 69 DSEs) in the central parts of the study area. (2) From the affected areas of the DSEs, about 60% of the DSEs in Mongolia started locally and then affected downwind China, as approximately 55% of the DSEs in the Inner Mongolia Desert Steppe and Hunshandake Sandy Land came from Mongolia. However, the DSEs in the TK located in the Tarim Basin of northwest China affected the entire study area, with only 31.3% belonging to the local dust. (3) From the moving path of the dusty weather, the dusty weather at the three meteorological stations (Dalanzadgad, Erlian, and Beijing), all located on the main transmission path of DSEs, was mainly transported from the windward area in the northwest, accounting for about 65.5% of the total path. This study provides a reliable scientific basis for disaster prevention and control, and has practical significance for protecting and improving human settlements.
1. Introduction
Dust storm events (DSEs) are severe weather phenomena that frequently occur in arid and semi-arid regions [1]. Their direct impact on human life and property can even lead to respiratory diseases [2,3,4]. Further, dust particles directly alter the radiation balance of the Earth’s atmosphere by absorbing and scattering solar short-wave radiation and changing the microphysical properties of clouds, which affects local weather and even the global climate [5,6]. Asian DSEs affect downwind areas, such as the Korean Peninsula and Japan, and even across the Pacific [7,8,9,10]. Mongolia and northern China are considered the leading source regions of dust storms in Asia [11,12]. Recently, there has been an increase in DSEs in parts of northern China and Mongolia [13]. In the spring of 2021, Mongolia and China were afflicted by the strongest dust storm in the past decade, killing 15 herdsmen and a five-year-old child. PM10 concentrations in Beijing exceeded 9753 μg/m3, suspending classes for some primary and secondary schools in Inner Mongolia [14,15,16]. However, quantitative studies of the source area, influence area, and moving paths of DSEs in Mongolia and China are lacking. At present, these inland arid regions are at risk of severe desertification due to global climate change and, consequently, are at risk of more intense dust storms [17], thus attracting close attention from various industries. The use of high spatiotemporal resolution to monitor the whole process of dust initiation to dust removal provides a basis for early warning DSE research.
DSE monitoring methods include meteorological station monitoring [1,18,19,20], dust-particle trajectory computation [21,22,23], lidar data [16,24,25], and remote-sensing image monitoring [26,27,28]. Meteorological station data is widely used due to its large time period and is used to calculate dust frequency or dust emission to determine the dust storm’s source, affected areas, and moving path [13,29]. These studies mainly determine the affected areas and moving paths of the dust storms based on the number of meteorological stations [1,18]. For example, Bao et al. [13] analyzed the spatiotemporal distribution characteristics of dust in east Asia using the ground meteorological station data. They found that the Mongolian Gobi Desert, the Taklimakan Desert, and the western desert of Inner Mongolia were particularly affected by dust. Qiu et al. [30] found that the severe dust storms affecting China could be divided into exogenous and endogenous types. In addition, some scholars used lidar data to monitor the DSE process. For example, Uno et al. [9] used the Cloud-Aerosol Lidar and Infrared Pathfinder Satellite Observations (CALIPSO) satellite and the Hybrid Single-Particle Lagrangian Integrated Trajectory (HYSPLIT) model to monitor DSEs from May 2007. They found that dust from the Taklimakan Desert was transported for more than one full trip around the globe in about 13 days. Guo et al. [24] used CALIPSO to monitor extreme DSEs from May 2017 and found that the dust came from northwestern Mongolia, and it was transported to the downwind areas of China.
Since the 1980s, remote sensing technology used to monitor a dust storm’s source area, influence range, and moving path has continued to mature and develop. For instance, Zhang et al. [31] used the National Oceanic and Atmospheric Administration’s (NOAA) Advanced Very-High-Resolution Radiometer (AVHRR) and Moderate Resolution Imaging Spectroradiometer (MODIS) satellites to analyze the dusty weather affecting Beijing, revealing two primary sources and three moving paths. Using the Fengyun (FY) series of satellites, Fang et al. [32] revealed the transmission paths of DSEs triggered in the Taklimakan Desert in April 2014, and achieved good results. The Himawari-8 Dust RGB is one of the latest and most successful dust-identification methods. This method takes advantage of the difference in reflection and transmission characteristics between dust storms and other substances, and obtains true-color synthetic images by processing three infrared channels, i.e., 11, 13, and 15. In addition, the high-spatiotemporal-resolution satellite Himawari-8, especially with its temporal resolution of 10 min, is very important for the identification of dust storms. Therefore, it is widely used in dust monitoring. Yumimoto et al. [28] used this method to accurately identify the process of a severe DSE in May 2017. Although these studies produced informative findings, most solely focused on investigating a single DSE [33,34,35].
The long-timescale ground meteorological station data is widely used, but the meteorological stations are unevenly distributed, as there are no observational stations in areas such as a desert’s center. Although remote sensing satellite data can make up for the limitations of meteorological stations, the time resolution is relatively low, making it difficult to monitor the whole process of dust accurately. Therefore, we systematically analyzed the sources, affected areas, and moving paths of DSEs in Mongolia and China using the high-spatiotemporal-resolution images from the Himawari-8 satellite. Thorough understanding of DSE sources, affected areas, and moving paths in Mongolia and China can provide a basis for early warning DSE research.
This study examined the different moving paths of DSEs in Mongolia and northern China using the Himawari-8 geostationary meteorological satellite data from 2016 to 2020. The primary objectives of this research were to (1) analyze the spatiotemporal characteristics of DSE’s sources in Mongolia and China, (2) illustrate the affected areas of DSEs in the study area, and (3) reveal the critical moving path of dusty weather through Mongolia and China.
2. Materials and Methods
2.1. Study Area
The study area mainly covers Mongolia and China (73°–136°E, 31°–54°N). As shown in Figure 1, it is bordered by Central Asia (arid region) to the west, southern Russia to the north, and the Pacific Ocean to the east. The research region is an arid and semi-arid setting with a vulnerable ecological ecosystem. Approximately 90% of Mongolia is in danger of desertification [17]. China’s land desertification has reached 2.61 million km2, accounting for one quarter of the country’s total area.
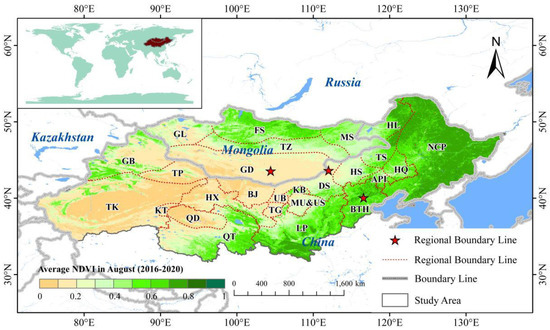
Figure 1.
Map of the study area (including 27 sub-regions). The background is the average NDVI in August during 2016–2020. GL: Mongolian Great Lakes Region, FS: Mongolian Forest Steppe, TZ: Mongolian Transition Zone from Gobi to Steppe, MS: Mongolian Steppe, GD: Mongolian Gobi Desert, GB: Gurbantunggut Desert, TP: Turpan Basin, TK: Taklimakan Desert, KT: Kumtag Desert, HX: Hexi Corridor, QD: Qaidam Desert, QT: North of Qinghai-Tibet Plateau, BJ: Badain Jaran Desert, TG: Tengger Desert, UB: Ulan Buh Desert, KB: Kubuqi Desert, MU&US: Mu Us Sandy Land, LP: Loess Plateau, DS: Inner Mongolia Desert Steppe, HS: Hunshandake Sandy Land, API: Inner Mongolia Agro-pastoral Interlaced Region, BTH: Beijing-Tianjin-Hebei Region, TS: Inner Mongolia Typical Steppe, HQ: Horqin Sandy Land, HL: Hulunbeier Sandy Land, NCP: Northeast China Plain.
In this region, the Normalized Difference Vegetation Index (NDVI) dispersion decreased from northeast to southwest [36]. The annual precipitation of the study area varies greatly, ranging from 0–800 mm, with 70% of precipitation occurring during summer (July–August) [37,38]. The frequency of strong wind (>10.8 m/s) days is higher in the northwest and lower in the southeast, with an average number of strong wind days of more than 45 days [39]. As the primary dust sources in East Asia, Mongolia and northern China experience frequent dust storms. For instance, in the Mongolian Gobi Desert (GD), Taklimakan Desert (TK), and Hunshandake Sandy Land (HS) in northern China, dusty weather frequently occurs from spring to early summer, accounting for 61% of the year [13]. We subdivided the DSEs into 27 sub-regions and investigated the DSEs’ source area, the affected area, and the moving path (Figure 1).
2.2. Statistics of DSEs Based on Himawari-8 Image Data
High-resolution spatiotemporal remote sensing satellite data from Himawari-8 were used to identify dust storms from March to June from 2016 to 2020. Our analysis focused on the spatiotemporal distribution of dust storm sources and the affected areas of the DSEs. Himawari-8 is a new-generation geostationary meteorological satellite (GMS) launched by the Japan Meteorological Agency, which officially began broadcasting Himawari-8 data in real time worldwide at 140.7°E on 7 July 2015. The altitude of the GMS orbit is ~35,800 km. Its Advanced Himawari Imager (AHI) sensor has 16 bands: 1–3 are visible, 4–6 are near-infrared, and 7–16 are far-infrared bands (Table 1). The monitoring range of Himawari-8 is 85°–225°E and 60°N–60°S. The spatial resolution is 2 km, and the temporal resolution is 10 min, but the latter can be tuned to 2.5 min in Japan or surrounding areas. Currently, the satellite data of Himawari-8 is widely applied to several monitoring fields and used to for identifying issues such as fires, floods, dust storms, air pollution, typhoons, precipitation, and drought [40], thus showing apparent advantages of real-time monitoring of Asian DSEs.

Table 1.
Himawari-8 AHI bands.
In this study, the dust storm was inverted by Himawari-8 far-infrared channel Dust RGB method, and the dust storm source and its affected areas were obtained [23,41]. This method takes advantage of the difference in reflection and transmission characteristics between dust storms and other substances and obtains true-color synthetic images by processing three infrared channels, i.e., 11, 13, and 15. The details are as follows: red (BT15-BT13), green (BT13-BT11), and blue (BT13), of which band 13 is more sensitive to dust identification. The areas with pink shading are recorded as dust storms, cyan is the warm desert, and ginger yellow is thick mid-level clouds (Figure 2).
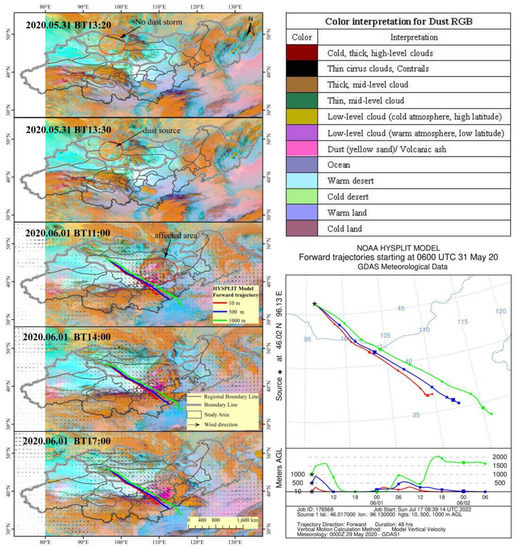
Figure 2.
Map of dust storm moving path on 1 June 2020. On the left, black arrow is the wind direction; pink shading is recorded as dust storms, cyan is the warm desert, and ginger yellow is thick mid-level clouds. On the lower right corner is the forward trajectory of dust storms simulated by HYSPLIT model (Red, green and blue colors represent airflow at 0, 500 and 1000 m respectively).
In terms of visibility, dusty weather is classified as either floating dust, blowing dust, dust storms, and severe dust storms (http://www.qxkp.net/zhfy/scb/202103/t20210302_2800341.html, accessed on 3 March 2021). In this paper, we focus on transported DSEs. Static images are regarded as floating or blowing dust, while the moving images are regarded as dust storms or severe dust storms. Therefore, we defined a dust storm event as a dust storm with a duration of 2 h or more and an effective range of 200 km2 or more (floating dust and blowing dust are not included). If the DSEs started in two or more different areas on the same day, they are recorded as two or more DSEs. For example, as shown in Figure 2, the moving process of dust storms from the GD to the Loess Plateau (LP) and the Beijing-Tianjin-Hebei (BTH) region continued for ~39 h. Among them, GD is the DSEs source region, and other DSE pass-through regions are the affected areas. Dust storm source refers to the area where DSEs begin, i.e., remote-sensing images begin to appear in pink areas. Correspondingly, dust source number (DSN) refers to the number of source regions of DSEs. The total dust storm events number (T-DEN) is the total number of DSEs occurring within the region. Regions that DSEs pass through are referred to as “affected areas”. It only affects the local area of the sub-region, and will not be transported to other wind down areas are called “local dust”.
2.3. Simulated and Validation of DSEs Process Based on GDAS Datasets
We used the global comprehensive Global Data Assimilation System (GDAS) data from the National Centers for Environmental Prediction (NCEP), wherein the spatial resolution is 1° × 1° (regular longitude and latitude grids) and the time resolution is 36 h [42]. To determine the affected areas of DSEs, the forward trajectories and wind field diagrams at 10 m height on the surface during the DSEs were simulated using the HYSPLIT model and GDAS (Figure 2). Finally, the dusty weather moving path was simulated by the HYSPLIT model.
The HYSPLIT model is a hybrid model that combines Lagrangian and Euler methods. It is a complete system developed by NOAA and the Australian Meteorology Bureau to calculate simple air-mass structures and simulate complex diffusion and deposition [43,44]. It is one of the most widely used atmospheric transport and diffusion models in atmospheric science. The moving speed of airflow can be judged according to the length of the trajectory line. Generally, the longer the trajectory line, the faster the movement of the air mass.
2.4. Clustering Analysis of DSEs Moving Path Based on GDAS Dataset
In this study, the Euclidean distance (also known as Euclidean metric) system cluster-analysis method was used to cluster the forward and backward trajectories of dusty weather (including floating dust, blowing dust, and dust storms). Euclidean distance refers to the true distance between two points in m-dimensional space or the natural length of the vector. The Euclidean distance in two- or three-dimensional space is the actual distance between two points. The Euclidean distance between two backward (or forward) trajectories was then given by:
where X1(Y1) and X2(Y2) reference to backward (or forward) trajectories 1 and 2, respectively (http://www.meteothink.org/docs/trajstat/cluster_cal.html, accessed on 1 May 2022).
3. Results
3.1. Spatio-Temporal Variations of DSEs
To examine the spatial distribution characteristics of dusty weather in detail, we analyzed DSEs in each sub-region. During this period, 605 DSEs occurred in the study area; among them, 166 occurred in Mongolia and 439 in northern China. The DSEs were most frequent in April (232 DSEs), followed by May (173 DSEs). During the study period, most of the DSEs occurred in 2016 and the least occurred in 2019, with an average of 121 DSEs per year between 2016 and 2020 (Figure 3). See Figure A1 in Appendix A for each sub-region for a detailed DSN.
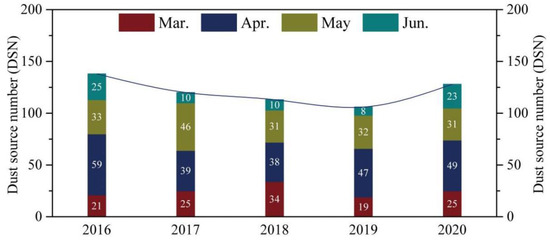
Figure 3.
Temporal variation characteristics of dust source number (DSN) from 2016 to 2020.
The regional statistics show that dust storms mainly occurred in the central and western arid inland areas (Figure 4 and Table 2). Among them, the highest T-DEN (161 times) occurred in the Badain Jaran Desert (BJ; middle of the study area), and almost half of them (87) originated locally. The TK and GD rank second with 141 DSEs. In contrast, 97.9% of DSEs in the TK were caused by local dust, while only 48.9% in the GD originated locally. In the Desert Steppe (DS) and the HS, which are relatively close to the semi-humid area, several DSEs (133 in the DS and 104 in the HS) occurred. However, most DSEs originated from outside regions, and only 27 in the DS and 23 in the HS occurred locally. However, with fewer DSEs in areas with high annual precipitation and NDVI, especially in the southwestern Qinghai-Tibet Plateau (QT) and eastern Inner Mongolia agro-pastoral interlaced region (API), there were only two DSNs.
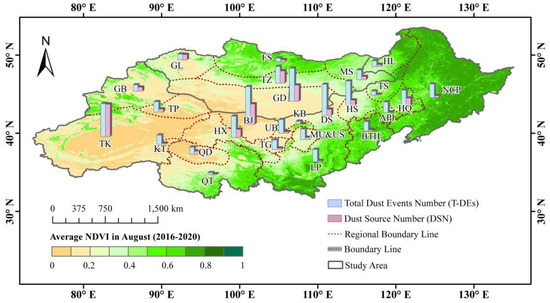
Figure 4.
Spatial distribution characteristics total dust events number (T-DEN) and dust source number (DSN) from 2016 to 2020. Abbr. The sub-region names are as same as in Figure 1.
Table 2.
Statistical table of total dust events number (T-DEN) and dust source number (DSN) in each sub-region. Abbr. The sub-region names are as same as in Figure 1.
3.2. Source Areas and Affecting Areas of DSEs Based on Himawari-8
We identified the dust source distributions for DSEs in each sub-region. The percentage of dust sources in Mongolia for DSEs in five sub-regions is displayed in Figure 5A and Table A1 in Appendix B. They were mainly caused by local dust in Mongolia but are also affected by windward dust. In the Mongolian Forest Steppe (FS), the Mongolian Great Lakes Region (GL), and the Mongolian Transition zone from the Gobi to Steppe (TZ), 56.3%, 92%, and 73.2% of DSEs were initiated by local dust, respectively. In the GD, 49% of the DSEs originated locally, DSEs from the BJ, and the TZ accounted for 15%. DSEs in the GD were also partially influenced by dust sources in other areas of northern China. In the MS, 40.5% of DSEs originated in the TZ, as 33.3% were caused by local dust sources.
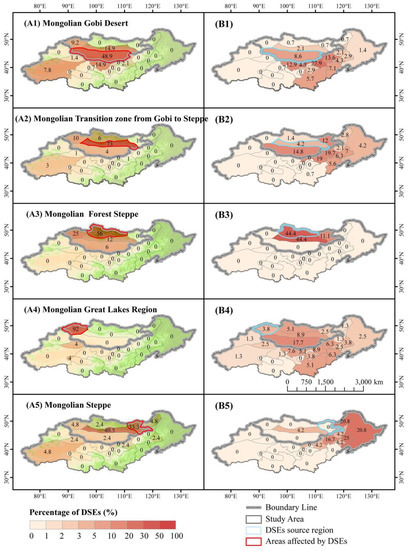
Figure 5.
Statistical map of the percentage of sources (A) and affected areas (B) of DSEs in Mongolia, 2016–2020. On the left (A), the areas enclosed by red boxes are the areas affected by the DSEs, and the numbers indicate the percentage of DSEs affecting the red box area. On the right (B), the areas enclosed by blue boxes are the DSEs’ source regions, and the numbers indicate the percentage of DSEs affected by the region in the blue box.
Figure 5B and Table A1 in Appendix B shows the impact scope of DSEs in each sub-region. The DSEs in Mongolia mainly affected the downwind regions, including southeastern Mongolia and northern China. The dust sources in most areas of Mongolia (i.e., GD, TZ, GL, MS) affect northern China, as the FS DSEs only affected central and eastern Mongolia.
As shown in Figure 6 and Table A2 in Appendix B, there are many dust source regions in northern China. During 2016–2020, there were 439 DSEs starting from northern China. Among them, 97.9% of DSEs in the TK formed from the local dust source, affecting surrounding areas. In the Gurbantunggut Desert (GB) and BJ, 63% and 54% of the DSEs originated locally, respectively. Most northwestern and northern regions of China are affected by dust storms from windward regions. It was noted that the DSEs in the Inner Mongolia Desert Steppe (DS), Inner Mongolia Typical Steppe (TS), HS, Hulunbeier Sandy Land (HL), and Beijing-Tianjin-Hebei Region (BTH) of North China mainly originated from Mongolia in the upwind regions and most of their dust sources are in the GD and TZ. For example, in DS and BTH, 30.1% and 25% of dust storms came from the GD of Mongolia. Most DSEs in the NCP, a semi-humid area, also came from the upwind regions (i.e., Horqin Sandy Land (HS) accounted for 34.5%).
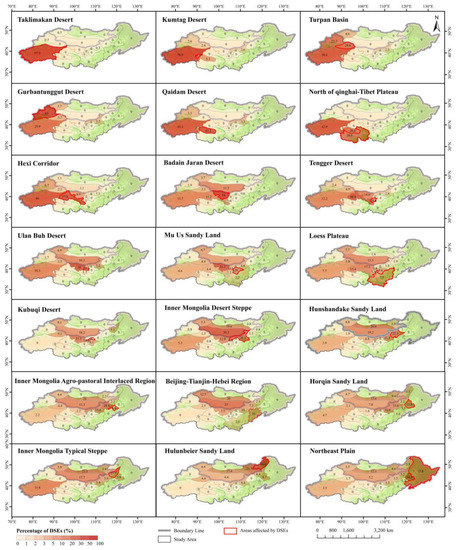
Figure 6.
Statistical map of the percentage of DSEs sources in China from 2016 to 2020. The areas enclosed by red boxes are the areas affected by the DSEs, and the numbers indicate the percentage of DSEs affect the red box area.
The impact scope of the DSEs in northern China, as shown in Figure 7 and Table A2 in Appendix B, like those in Mongolia, mainly affected the surrounding areas or the downwind areas. The DSEs’ influence range of the TK Basin and the Turpan Basin (TP), located in the northwest region, is wide, and their influences can reach the easternmost Northeast China Plain (NCP), accounting for 0.8% and 2.4%, respectively. Similarly, the DSEs in the GB can affect the HunShandake Sandy Land in central Inner Mongolia, accounting for 3.7%. Dust storms from the BTH region mainly affect the local area and the HS and may even affect other downwind areas. Although the Northeast China Plain in the humid eastern area has fewer DSEs, the latter can affect the downstream areas, such as North Korea, Japan, and South Korea.
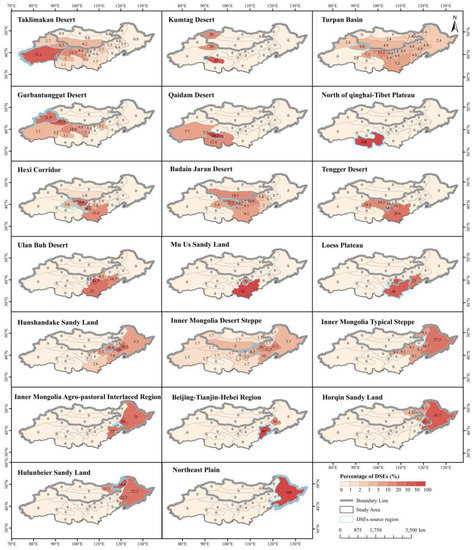
Figure 7.
Statistical map of the percentage of DSEs affected areas in China from 2016 to 2020. The areas enclosed by blue boxes are the DSEs’ source regions, and the numbers indicate the percentage of DSEs affected by the region in the blue box.
3.3. Dusty Weather Moving Path Based on HYSPLIT Model
To clarify the moving path of dusty weather, the HYSPLIT model was used to simulate the 72 h airflow trajectory before and after 1000 m height, and to generate a cluster analysis of dusty weather from March to June 2016 to 2020. We selected three meteorological stations on the main DSEs transmission path to analyze the DSEs’ moving path of dusty weather, which were Dalanzadgad (44373), Erlian (53068), and Beijing (54511).
The Dalanzadgad station is located in the South Gobi Province, the border area between China and Mongolia. It is one of the main moving paths for DSEs. Based on the consistency of the spatial distribution characteristics of airflow trajectory, the 98 dusty weather air mass trajectories at Dalanzadgad station are clustered (Figure 8A). At this station, the backward trajectory is divided into four main paths; among which, 38.28% of the dust comes mainly from GL, and the dust originates from eastern Kazakhstan in Central Asia. This station received 32.81% and 7.81% of its dust from GL and GD, respectively. The dust storms from or through Dalanzadgad mainly affected northern China, and northeast China in the downwind area. Of this dust, 38.04% and 28.26% reaches Japan (through DS, HS, TS, NCP) and Russia, respectively; 25% of the dust reaches North Korea via DS, HS, API, and NCP. Some of the dusty weather in Dalanzadgad station can affect the BTH (Figure 8A1).
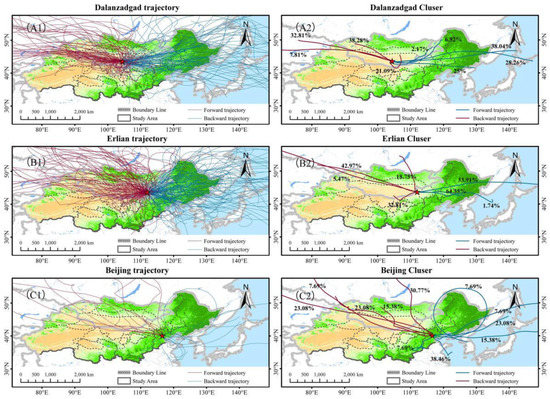
Figure 8.
72 h of forward and backward trajectory (A1,B1,C1) and trajectories clustering (A2,B2,C2) of dusty weather. Blue lines indicate the airflow forward trajectory, and red lines indicate the airflow backward trajectory.
As shown in Figure 8A2, the dusty weather from Dalanzadgad affects the Erlian station (Figure 8B) of the Inner Mongolia Desert Steppe. There are 127 forward and backward airflow trajectories at the Erlian station. The dust of the station mainly comes from the upwind central and western regions of Mongolia; 42.97% and 5.47% was transported from the Gobi Desert in the middle and south of Mongolia to Erlian; 32.81% of the dust came from the China–Mongolia border area in western Inner Mongolia and was transported to Erlian station in China; 64.35% of the dust from Erlian or passing through this area reached the Northeast Plain through HS, TS, and HS; 33.91% of the dust moved to Russia, Japan, and other regions. In addition, the dusty weather in Erlian station also affected the BTH regions.
The number of dusty weather days at the Beijing station was less, and there are only 13 forward and backward trajectories (Figure 8C). It can be seen from the airflow trajectory that the dust flow was transported across the border from the upwind area of overseas arid areas to northern China, mainly through five moving paths. Among them, 30.77% passed through FS, TZ, GD, DS, HS, and finally arrived at the Beijing station; 15.38% passed through the FS, TZ, and GD, entering from the DS area of western Inner Mongolia to China, arriving at the Beijing station. Others were transported to Beijing stations through GL, GD, and DS, accounting for 23.08%, 23.08%, and 7.69%, respectively. Dusty weather arriving in or from Beijing is transported overseas, with 38.46% going to the Yellow Sea in the southeast and others transported to North Korea, South Korea, Japan, and even the northeast of Russia.
4. Discussion
We identified the dust storm using the Dust RGB method and found the spatiotemporal distribution characteristics of the DSEs’ source. From March to June 2016 to 2020, 605 DSEs occurred in the research area; 166 of them occurred in Mongolia and 439 in Northern China, respectively. Most of the DSEs occurred in April (232 DSEs), followed by May (173 DSEs). This is similar to the findings of most previous studies [13] because, in April, there was almost no precipitation with low vegetation cover, temperatures rose rapidly, the soil was dry, loose, and bare, cold-warm air masses met, and strong winds were frequent; hence, it was easy to emit dust [45,46,47]. In addition, Mongolian cyclone intensity and frequency also have an important impact [48]. DSEs were mainly concentrated in inland arid areas on the spatial scale due to low precipitation and the extremely low vegetation cover in arid and semi-arid areas, providing abundant dust storm material. Strong winds in spring were under the control of the Mongolia–Siberia high-pressure system, which provided the necessary dynamic conditions for the emission and transport of DSEs [49,50]. However, in the humid region to the east and south of the study area, soil moisture caused by snow melting in spring and the surface coverage caused by vegetation residue in the previous year was higher than that west of inland arid areas; hence, the occurrence of DSEs can be effectively controlled [12,51,52].
Based on the spatiotemporal characteristic analysis of DSN, we further clarified its affected area. Dusty weather was primarily transported from northwest to southeast in this study area, which may be because the study area is located in the westerlies at mid-latitude, with frequent Mongolian cyclones in spring. Furthermore, due to the influence of the geostrophic force, the air was mainly transported from west (or northwest) to east (or southeast) [53,54]. This is consistent with the findings of Shao et al. [55]. Mongolia’s ecological environment is fragile and land degradation is evident [56], especially in the southern Gobi Desert, where the exposed surface and loose soil provide a rich material basis for DSEs. Furthermore, under the influence of Mongolian cyclones, the impact scope of DSEs expanded, especially in the DS, thus affecting BTH [49,57]. With the effective implementation of various ecological measures in China, the local DSEs have been significantly reduced [58,59]. Approximately 50% of the DSEs in the HS, DS, TS, BTH, and HL areas in north China and northeast China originated in Mongolia in the windward regions (Table A2). However, in the TK located in the Tarim Basin in northwest China, 97.9% of DSEs came from the local area and affected the surrounding areas.
In order to analyze the moving path of DSEs, we selected three weather stations, Dalanzadgad (44373), Erlian (53068), and Beijing (54511), on the main transmission path of dust storms. The results show that dusty weather in the three stations is mainly transported from the northwest windward region, accounting for about 65.5% of the total path, but their proportion is different. Within 72 h, 48.8% of the dusty weather was transported southeast to Japan, with Dalanzadgad stations being the largest total (66.3%), followed by Beijing (46.2%). In summary, the dusty weather in the study area is mainly transmitted from northwest to southeast. This is similar to the findings of previous research [19,30,60].
The Dust RGB method can capture the entire DSE process (i.e., formation, development, and movement). It objectively reveals spatiotemporal changes and affected areas of dust sources. The new generation of geostationary meteorological satellites (Himawari-8) with high spatiotemporal resolution is important for studying the mechanism of dust occurrence, and for the development, forecasting, and implementation of early warning systems. In addition, this study highlighted the affected area and moving path of each DSE, contributing to a better understanding of the impacts of dust on the local ecological environment.
5. Conclusions
Using Himawari-8 image data from 2016 to 2020, we statistically analyzed the spatiotemporal distribution characteristics and affected areas of the source of DSEs in Mongolia and China. The HYSPLIT model was used to calculate the 72 h forward and backward airflow trajectory of the typical area dust storm. Identifying and quantifying DSEs helps improve the performance of the dust prediction model. The main results can be summarized as follows:
(1) In terms of the temporal distribution, a total of 605 DSEs occurred in the study area over the 5-year period, with most of them occurring in April, followed by May. In terms of the spatial distribution, the dust storm sources were concentrated in the arid inland areas.
(2) From the affected areas of the DSEs, about 60% of the DSEs in Mongolia started locally and then affected downwind China.
(3) The dusty weather at the three meteorological stations (Dalanzadgad, Erlian, and Beijing), which are located on the main transmission path of DSEs, was mainly transported from the windward area in the northwest.
Author Contributions
Conceptualization, C.B. (Chunling Bao); Formal analysis, C.B. (Chunling Bao); Funding acquisition, M.Y. and Y.B. (Yuhai Bao); Methodology, Y.B. (Yulong Bao) and E.J.; Project administration, M.Y. and Y.B. (Yuhai Bao); Resources, M.Y.; Software, C.B. (Chunling Bao) and E.J.; Supervision, M.Y. and Y.B. (Yuhai Bao); Visualization, C.B. (Chunling Bao); Writing—original draft, C.B. (Chunling Bao); Writing—review & editing, C.B. (Chunling Bao), M.Y., C.B. (Cholaw Bueh) and G.P. All authors have read and agreed to the published version of the manuscript.
Funding
This research was funded by the National Nature Science Foundation of China (funder: Mei Yong, NO. 41867070 and funder: Yuhai Bao, NO. 61631011).
Data Availability Statement
The reanalysis data (GDAS data and HYSPLIT model) used to verify the accuracy of Himawari-8 was obtained from the following website: ftp://arlftp.arlhq.noaa.gov/.
Acknowledgments
The authors gratefully acknowledge the Japan Communication Research Institute’s scientific cloud (NICT), Chiba University Environmental Remote Sensing Research Center (CEReS), the University of Tokyo’s data comprehensive analysis system (DIAS), and the JXAX Earth Observation Research Center (EORC) for providing the Himawari-8 geostationary meteorological satellite data used in this study.
Conflicts of Interest
The authors declare no conflict of interest.
Appendix A. Statistics of the DSN for Each Sub-Region
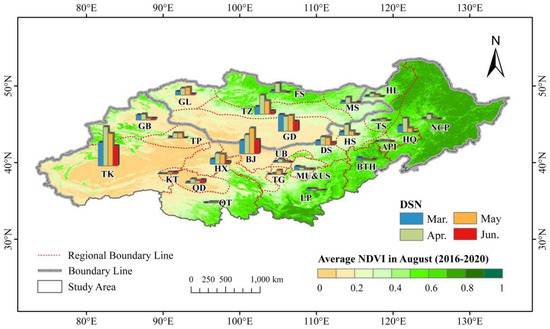
Figure A1.
Temporal variation characteristics of dust source number (DSN) for each sub-region from 2016 to 2020.
Appendix B. DSN Statistics
Table A1.
Mongolian DSN statistical result.
Table A1.
Mongolian DSN statistical result.
| Region | Windward Region (%) | Local Dust (%) | Downwind Region (%) | |
|---|---|---|---|---|
| Source Region | Mongolia | Northern China | ||
| GD | 24.1 | 48.9 | / | 27 |
| TZ | 15.5 | 73.2 | 5.6 | 5.7 |
| FS | 25 | 56.3 | 18.8 | / |
| GL | / | 92 | / | 8 |
| MS | 50.3 | 33.3 | / | 16.6 |
Table A2.
Northern China DSN statistical result.
Table A2.
Northern China DSN statistical result.
| Region | Windward Region (%) | Local Dust (%) | Downwind Region (%) | |
|---|---|---|---|---|
| Source Region | Mongolia | North China | ||
| TK | 0.7 | 0.7 | 97.9 | 0.7 |
| KT | / | 72 | 10.3 | 7.7 |
| TP | 4.6 | 54.6 | 29.6 | 2.3 |
| GB | 3.7 | / | 63 | 33.3 |
| HX | 2.2 | 57.8 | 37.8 | 2.2 |
| QD | / | 53.4 | 43.3 | 3.3 |
| QT | / | 71.4 | 28.6 | / |
| BJ | 15 | 29.8 | 54 | 1.2 |
| TG | / | 83 | 14.6 | 2.4 |
| UB | 17.2 | 60.3 | 10.3 | 5.2 |
| KB | 17.3 | 63.6 | 0 | 9.1 |
| Mu&Us | 15.6 | 57.8 | 20 | 6.6 |
| LP | 23.1 | 65.4 | 7.7 | 3.8 |
| HS | 54.9 | 22 | 22.1 | 1 |
| DS | 55.6 | 22 | 20.2 | 2.2 |
| API | 40 | 45.6 | 4.4 | / |
| TS | 52.9 | 23.5 | 17.7 | 5.9 |
| BTH | 57.5 | 32.5 | 10 | / |
| HQ | 37.5 | 43.8 | 15.6 | 3.1 |
| HL | 47.8 | 13.1 | 30.4 | 8.7 |
| NP | 19.3 | 56.9 | 13.8 | / |
References
- Gao, T.; Han, J.; Wang, Y.; Pei, H.; Lu, S. Impacts of climate abnormality on remarkable dust storm increase of the Hunshdak Sandy Lands in northern China during 2001–2008. Meteorol. Appl. 2012, 19, 265–278. [Google Scholar] [CrossRef]
- Onishi, K.; Kurosaki, Y.; Otani, S.; Yoshida, A.; Sugimoto, N.; Kurozawa, Y. Atmospheric transport route determines components of Asian dust and health effects in Japan. Atmos. Environ. 2012, 49, 94–102. [Google Scholar] [CrossRef]
- Heft-Neal, S.; Burney, J.; Bendavid, E.; Voss, K.K.; Burke, M. Dust pollution from the Sahara and African infant mortality. Nat. Sustain. 2020, 3, 863–871. [Google Scholar] [CrossRef]
- Hasunuma, H.; Takeuchi, A.; Ono, R.; Amimoto, Y.; Hwang, Y.H.; Uno, I.; Shimizu, A.; Nishiwaki, Y.; Hashizume, M.; Askew, D.J.; et al. Effect of Asian dust on respiratory symptoms among children with and without asthma, and their sensitivity. Sci. Total Environ. 2021, 753, 141585. [Google Scholar] [CrossRef]
- Huang, J.; Wang, T.; Wang, W.; Li, Z.; Yan, H. Climate effects of dust aerosols over East Asian arid and semiarid regions. J. Geophys. Res. Atmos. 2014, 119, 11398–11416. [Google Scholar] [CrossRef]
- Kok, J.F.; Ward, D.S.; Mahowald, N.M.; Evan, A.T. Global and regional importance of the direct dust-climate feedback. Nat. Commun. 2018, 9, 1–11. [Google Scholar] [CrossRef] [PubMed]
- McKendry, I.G.; Hacker, J.P.; Stull, R.; Sakiyama, S.; Mignacca, D.; Reid, K. Long-range transport of Asian dust to the Lower Fraser Valley, British Columbia, Canada. J. Geophys. Res. Earth Surf. 2001, 106, 18361–18370. [Google Scholar] [CrossRef]
- Huang, J.; Ge, J.; Weng, F. Detection of Asia dust storms using multisensor satellite measurements. Remote Sens. Environ. 2007, 110, 186–191. [Google Scholar] [CrossRef]
- Uno, I.; Eguchi, K.; Yumimoto, K.; Takemura, T.; Shimizu, A.; Uematsu, M.; Liu, Z.; Wang, Z.; Hara, Y.; Sugimoto, N. Asian dust transported one full circuit around the globe. Nat. Geosci. 2009, 2, 557–560. [Google Scholar] [CrossRef]
- Wang, F.; Pan, X.; Wang, D.; Shen, C.; Lu, Q. Combating desertification in China: Past, present and future. Land Use Policy 2013, 31, 311–313. [Google Scholar] [CrossRef]
- Shao, Y.; Wang, J. A climatology of Northeast Asian dust events. Meteorol. Z. 2003, 12, 187–196. [Google Scholar] [CrossRef] [Green Version]
- An, L.; Che, H.; Xue, M.; Zhang, T.; Wang, H.; Wang, Y.; Zhou, C.; Zhao, H.; Gui, K.; Zheng, Y.; et al. Temporal and spatial variations in sand and dust storm events in East Asia from 2007 to 2016: Relationships with surface conditions and climate change. Sci. Total Environ. 2018, 633, 452–462. [Google Scholar] [CrossRef]
- Bao, C.; Yong, M.; Jin, E.; Bao, Y.; Tubuxin, B.; Bao, Y. Regional spatial and temporal variation characteristics of dust in East Asia. Chin. J. Geogr. Res. 2021, 40, 14. [Google Scholar] [CrossRef]
- Liang, P.; Chen, B.; Yang, X.; Liu, Q.; Li, A.; Mackenzie, L.; Zhang, D. Revealing the dust transport processes of the 2021 mega dust storm event in northern China. Sci. Bull. 2021, 67, 21–24. [Google Scholar] [CrossRef]
- Wang, F.; Yang, T.; Wang, Z.; Cao, J.; Liu, B.; Liu, J.; Chen, S.; Liu, S.; Jia, B. A Comparison of the Different Stages of Dust Events over Beijing in March 2021: The Effects of the Vertical Structure on Near-Surface Particle Concentration. Remote Sens. 2021, 13, 3580. [Google Scholar] [CrossRef]
- Filonchyk, M. Characteristics of the severe March 2021 Gobi Desert dust storm and its impact on air pollution in China. Chemosphere 2021, 287, 132219. [Google Scholar] [CrossRef] [PubMed]
- Meng, X.; Gao, X.; Li, S.; Li, S.; Lei, J. Monitoring desertification in Mongolia based on Landsat images and Google Earth Engine from 1990 to 2020. Ecol. Indic. 2021, 129, 107908. [Google Scholar] [CrossRef]
- Bao, T.; Gao, T.; Nandintsetseg, B.; Yong, M.; Jin, E. Variations in Frequency and Intensity of Dust Events Crossing the Mongolia–China Border. SOLA 2021, 17, 145–150. [Google Scholar] [CrossRef]
- Qi, C. Analysis of Moving Path and Intensity Change of Sand Storm in Mongolia Plateau; Inner Mongolia Normal University: Hohhot, China, 2018. [Google Scholar]
- Yang, L.; Zhang, S.; Huang, Z.; Yang, Y.; Wang, L.; Han, W.; Li, X. Characteristics of Dust Events in China from 2015 to 2020. Atmosphere 2021, 12, 952. [Google Scholar] [CrossRef]
- Sunnu, A.; Resch, F.; Afeti, G. Back-trajectory model of the Saharan dust flux and particle mass distribution in West Africa. Aeolian Res. 2013, 9, 125–132. [Google Scholar] [CrossRef]
- Zhao-Bin, S.; Hua, W.; Chunwei, G.; Jin, W.; Tiantao, C.; Zi-Ming, L. Barrier effect of terrain on cold air and return flow of dust air masses. Atmospheric Res. 2019, 220, 81–91. [Google Scholar] [CrossRef]
- Bai, B.; Zhang, Q.; Chen, X.; Han, H. Moving Paths and Spatial Characteristics of Three Typical Dust Processes in East Asia. J. Arid. Meteorol. 2018, 36, 11–16. [Google Scholar] [CrossRef]
- Guo, P.; Yu, S.; Wang, L.; Li, P.; Li, Z.; Mehmood, K.; Chen, X.; Liu, W.; Zhu, Y.; Yu, X.; et al. High-altitude and long-range transport of aerosols causing regional severe haze during extreme dust storms explains why afforestation does not prevent storms. Environ. Chem. Lett. 2019, 17, 1333–1340. [Google Scholar] [CrossRef]
- Huang, Y.; Chen, B.; Dong, L.; Zhang, Z. Analysis of a Dust Weather Process over East Asia in May 2019 Based on Satellite and Ground-Based Lidar. Chin. J. Atmos. Sci. 2021, 45, 524–538. [Google Scholar] [CrossRef]
- Di, A.; Xue, Y.; Yang, X.; Leys, J.; Guang, J.; Mei, L.; Wang, J.; She, L.; Hu, Y.; He, X.; et al. Dust Aerosol Optical Depth Retrieval and Dust Storm Detection for Xinjiang Region Using Indian National Satellite Observations. Remote Sens. 2016, 8, 702. [Google Scholar] [CrossRef] [Green Version]
- Zhang, B.; Cheng, S. Aeolian dust sources and main synoptic systems in southern Mongolia. J. Arid. Land Resour. Environ. 2017, 31, 95–100. [Google Scholar]
- Yumimoto, K.; Kajino, M.; Tanaka, T.Y.; Uno, I. Dust Vortex in the Taklimakan Desert by Himawari-8 High Frequency and Resolution Observation. Sci. Rep. 2019, 9, 1–7. [Google Scholar] [CrossRef] [PubMed] [Green Version]
- Song, H.; Zhang, K.; Piao, S.; Wan, S. Spatial and temporal variations of spring dust emissions in northern China over the last 30 years. Atmospheric Environ. 2016, 126, 117–127. [Google Scholar] [CrossRef]
- Qiu, X.F.; Zheng, Y.; Miao, Q.L. Temporal-spatial Distribution as well as Tracks and Source Areas of Sand-Dust Storms in China. Acta Geogr. Sin. 2001, 56, 322–330. [Google Scholar]
- Zhang, Z.; Gao, Q.; Jiao, M.; Bi, B.G.; Yan, H.; Ren, Z.H. Analysis on Source Locations and Transportation Paths of Sand-Dusts Affecting Beijing. Res. Environ. Sci. 2007, 20, 21–27. [Google Scholar] [CrossRef]
- Fang, L.; Wang, S.; Yu, T.; Gu, X.; Zhang, X.; Wang, W.; Ren, S. Changes in Aerosol Optical and Micro-Physical Properties over Northeast Asia from a Severe Dust Storm in April 2014. Remote Sens. 2016, 8, 394. [Google Scholar] [CrossRef] [Green Version]
- She, L.; Xue, Y.; Guang, J.; Che, Y.; Fan, C.; Li, Y.; Xie, Y. Towards a comprehensive view of dust events from multiple satellite and ground measurements: Exemplified by the May 2017 East Asian dust storm. Nat. Hazards Earth Syst. Sci. 2018, 18, 3187–3201. [Google Scholar] [CrossRef] [Green Version]
- Yang, X.; Zhang, Q.; Ye, P.; Qin, H.; Xu, L.; Ma, L.; Gong, C. Characteristics and causes of persistent sand-dust weather in mid-March 2021 over Northern China. J. Desert Res. 2021, 41, 245–255. [Google Scholar] [CrossRef]
- Li, J.; Han, Z.; Zhang, R. Model study of atmospheric particulates during dust storm period in March 2010 over East Asia. Atmospheric Environ. 2011, 45, 3954–3964. [Google Scholar] [CrossRef]
- Yuan, R.Q. Analysis of the Response of Vegetabation NDVI on the Mongilian Plateau to Land Water Store; Inner Mongolia Normal University: Hohhot, China, 2021. [Google Scholar] [CrossRef]
- Liu, S.J.; Ochir, A.; Liu, H.J.; Liu, K.L.; Li, J.J.; Wan, X.; Chen, F. Relationship between ecological environment and desertification in Mongolia. Inn. Mong. Sci. Technol. Econ. 2020, 2, 56–57, 59. [Google Scholar]
- Liu, K.; Nie, G.G.; Zhang, S. Study on the spatiotemporal evolution of temperature and precipitation in China from 1951 to 2018. Adv. Earth Sci. 2020, 35, 1113–1126. [Google Scholar] [CrossRef]
- Bessho, K.; Date, K.; Hayashi, M.; Ikeda, A.; Imai, T.; Inoue, H.; Kumagai, Y.; Miyakawa, T.; Murata, H.; Ohno, T.; et al. An INtroduction to himawari-8/9— Japan’s new-generation geostationary meteorological satellites. J. Meteorol. Soc. Jpn. Ser. II 2016, 94, 151–183. [Google Scholar] [CrossRef] [Green Version]
- Kong, F.; Li, Y.; Wang, Y.F.; Lv, L.L.; Lin, L.; Liu, D.; Xing, Y. Spatial and Temporal Variation Characteristics of Near-surface Gale Days in China from 1961 to 2016. J. Anhui Agri 2017, 45, 188–196. [Google Scholar] [CrossRef]
- Akihiro, S. Outline of RGB Composite Imagery; Meteorological Satellite Center (MSC): Tokyo, Japan, 2015.
- Su, L.; Yuan, Z.; Fung, J.C.H.; Lau, A.K.H. A comparison of HYSPLIT backward trajectories generated from two GDAS datasets. Sci. Total Environ. 2015, 506–507, 527–537. [Google Scholar] [CrossRef]
- Wang, Y.Q.; Ariel, F.S.; Roland, R.D.; de la Rosad, J.D.; Zhanga, X. Global Dust Storms in 2008: Observation and HYSPLIT Model Validation. In Proceedings of the 28th Annual Meeting of China Meteorological Society, Xiamen, China, 1 November 2011. [Google Scholar]
- Stein, A.F.; Draxler, R.R.; Rolph, G.D.; Stunder, B.J.B.; Cohen, M.D.; Ngan, F. NOAA’s HYSPLIT Atmospheric Transport and Dispersion Modeling System. Bull. Am. Meteorol. Soc. 2015, 96, 2059–2077. [Google Scholar] [CrossRef]
- Liu, X.; Song, H.; Lei, T.; Liu, P.; Xu, C.; Wang, D.; Yang, Z.; Xia, H.; Wang, T.; Zhao, H. Effects of natural and anthropogenic factors and their interactions on dust events in Northern China. CATENA 2020, 196, 104919. [Google Scholar] [CrossRef]
- Wu, J.; Kurosaki, Y.; Shinoda, M.; Kai, K. Regional Characteristics of Recent Dust Occurrence and Its Controlling Factors in East Asia. SOLA 2016, 12, 187–191. [Google Scholar] [CrossRef] [Green Version]
- Bao, C.; Yong, M.; Bi, L.; Gao, H.; Li, J.; Bao, Y.; Gomboludev, P. Impacts of Underlying Surface on the Dusty Weather in Central Inner Mongolian Steppe, China. Earth Space Sci. 2021, 8, e2021EA001672. [Google Scholar] [CrossRef]
- Shao, Y.; Klose, M.; Wyrwoll, K.-H. Recent global dust trend and connections to climate forcing. J. Geophys. Res. Atmos. 2013, 118, 11–107. [Google Scholar] [CrossRef]
- Li, S.Y.; Lei, J.Q.; Xu, X.W. Genetic conditions of sandstorms in the hinterland of Taklimakan Desert. J. Appl. Meteorol. Sci. 2007, 18, 490–496. [Google Scholar] [CrossRef]
- Lee, E.-H.; Sohn, B.-J. Recent increasing trend in dust frequency over Mongolia and Inner Mongolia regions and its association with climate and surface condition change. Atmospheric Environ. 2011, 45, 4611–4616. [Google Scholar] [CrossRef]
- Fan, B.; Guo, L.; Li, N.; Chen, J.; Lin, H.; Zhang, X.; Shen, M.; Rao, Y.; Wang, C.; Ma, L. Earlier vegetation green-up has reduced spring dust storms. Sci. Rep. 2014, 4, 6749. [Google Scholar] [CrossRef] [PubMed]
- Kimura, R.; Bai, L.; Wang, J. Relationships among dust outbreaks, vegetation cover, and surface soil water content on the Loess Plateau of China, 1999–2000. CATENA 2009, 77, 292–296. [Google Scholar] [CrossRef]
- Wang, S.G.; Dong, G.R.; Chen, H.Z.; Li, X.L.; Jin, J. Advance in studying sand-dust storms of China. J. Desert Res. 2000, 20, 349–356. [Google Scholar] [CrossRef]
- Huang, J.; Minnis, P.; Chen, B.; Huang, Z.; Liu, Z.; Zhao, Q.; Yi, Y.; Ayers, J.K. Long-range transport and vertical structure of Asian dust from CALIPSO and surface measurements during PACDEX. J. Geophys. Res. Atmos. 2008, 113, 23212. [Google Scholar] [CrossRef]
- Shao, Y.; Wyrwoll, K.-H.; Chappell, A.; Huang, J.; Lin, Z.; McTainsh, G.H.; Mikami, M.; Tanaka, T.Y.; Wang, X.; Yoon, S. Dust cycle: An emerging core theme in Earth system science. Aeolian Res. 2011, 2, 181–204. [Google Scholar] [CrossRef]
- Nandintsetseg, B.; Boldgiv, B.; Chang, J.; Ciais, P.; Davaanyam, E.; Batbold, A.; Bat-Oyun, T.; Stenseth, N.C. Risk and vulnerability of Mongolian grasslands under climate change. Environ. Res. Lett. 2021, 16, 034035. [Google Scholar] [CrossRef]
- Tu, N.N.; Jiao, M.Y.; Zhao, L.N.; ZHU, W.J. Dynamical Characteristics for a Mongolia Cyclone Associated with Sand-Dust Storm in North China. J. Desert Res. 2007, 27, 8. [Google Scholar] [CrossRef]
- Cao, H.; Fu, C.; Zhang, W.; Liu, J. Characterizing Sand and Dust Storms (SDS) Intensity in China Based on Meteorological Data. Sustainability 2018, 10, 2372. [Google Scholar] [CrossRef] [Green Version]
- Tan, M.; Li, X. Does the Green Great Wall effectively decrease dust storm intensity in China? A study based on NOAA NDVI and weather station data. Land Use Policy 2015, 43, 42–47. [Google Scholar] [CrossRef]
- Kai, Z.; Huiwang, G. The characteristics of Asian-dust storms during 2000–2002: From the source to the sea. Atmospheric Environ. 2007, 41, 9136–9145. [Google Scholar] [CrossRef]
Publisher’s Note: MDPI stays neutral with regard to jurisdictional claims in published maps and institutional affiliations. |
© 2022 by the authors. Licensee MDPI, Basel, Switzerland. This article is an open access article distributed under the terms and conditions of the Creative Commons Attribution (CC BY) license (https://creativecommons.org/licenses/by/4.0/).