Abstract
Intercomparison of satellite-derived vegetation phenology is scarce in remote locations because of the limited coverage area and low temporal resolution of field observations. By their reliable near-ground observations and high-frequency data collection, PhenoCams can be a robust tool for intercomparison of land surface phenology derived from satellites. This study aims to investigate the transition dates of black spruce (Picea mariana (Mill.) B.S.P.) phenology by comparing fortnightly the MODIS normalized difference vegetation index (NDVI) and the enhanced vegetation index (EVI) extracted using the Google Earth Engine (GEE) platform with the daily PhenoCam-based green chromatic coordinate (GCC) index. Data were collected from 2016 to 2019 by PhenoCams installed in six mature stands along a latitudinal gradient of the boreal forests of Quebec, Canada. All time series were fitted by double-logistic functions, and the estimated parameters were compared between NDVI, EVI, and GCC. The onset of GCC occurred in the second week of May, whereas the ending of GCC occurred in the last week of September. We demonstrated that GCC was more correlated with EVI (R2 from 0.66 to 0.85) than NDVI (R2 from 0.52 to 0.68). In addition, the onset and ending of phenology were shown to differ by 3.5 and 5.4 days between EVI and GCC, respectively. Larger differences were detected between NDVI and GCC, 17.05 and 26.89 days for the onset and ending, respectively. EVI showed better estimations of the phenological dates than NDVI. This better performance is explained by the higher spectral sensitivity of EVI for multiple canopy leaf layers due to the presence of an additional blue band and an optimized soil factor value. Our study demonstrates that the phenological observations derived from PhenoCam are comparable with the EVI index. We conclude that EVI is more suitable than NDVI to assess phenology in evergreen species of the northern boreal region, where PhenoCam data are not available. The EVI index could be used as a reliable proxy of GCC for monitoring evergreen species phenology in areas with reduced access, or where repeated data collection from remote areas are logistically difficult due to the extreme weather.
1. Introduction
Vegetation phenology is an important indicator to study the timings of the seasonal progression of plant activities through stages of dormancy, active growth, senescence, and back to dormancy [1,2]. Freely available satellite earth observation data such as the Moderate-Resolution Imaging Spectroradiometer (MODIS), Landsat-8, and Sentinel-2 provide wider coverage with varying spatial, temporal, and spectral resolutions to understand the seasonal vegetation dynamics from local to global scales [3,4,5,6]. MODIS vegetation indices products such as the normalized difference vegetation index (NDVI) [7,8] and the enhanced vegetation index (EVI) [9] have been widely used for understanding the temporal behaviour of land surface vegetation phenology [10,11,12]. Previous studies have used the potential of these time-series vegetation indices as a robust metric for estimating the photosynthetic activity, developmental status, and productivity of vegetation and retrieved land surface phenology metrics such as the beginning of onset, end of senescence, and length of growing season for different vegetation types [13,14,15,16]. However, validation of satellite-derived phenology metrics remains uncertain and challenging due to the limited availability of field observations at high temporal and spatial resolutions, mainly for remote locations or areas with difficult accessibility.
Digital repeat photography has become a reliable tool for a wide range of ecological applications due to its low cost, easy set up, temporally frequent observations, and high-resolution data in red, green, and blue (RGB) channels [17,18]. Digital cameras used for phenological observation, also called PhenoCam, have enabled the detection of leaf phenological events through the analysis of RGB colour changes over time [19,20]. PhenoCam provides several clear advantages over human observations of phenology because of the ability to collect automatically repeated images at high temporal resolution (daily or hour scale) and across wide spatial scales (from the individual to the landscape). These cameras become useful specifically for remote areas or where the accessibility of sites is prevented by harsh climatic conditions [21,22]. Direct phenological observations of canopy vegetation using PhenoCams filled the “gap of observations” between satellite and the traditional on-the-ground data [17,18]. In recent decades, imagery from PhenoCam has been used as an alternative to field observations to provide a more straightforward solution to monitor vegetation growth from canopy to landscape scales at hourly or daily temporal resolutions [20,23,24,25,26]. Therefore, PhenoCam can be considered as a robust tool to evaluate and compare phenological metrics derived from satellite data [14,25,27,28].
Different PhenoCam indices, such as green chromatic coordinate (GCC), excess green index (ExG), normalized difference of the green and red bands (VIgreen), the red chromatic coordinate (RCC), or vegetation contrast index (VCI), can be derived using its red, green, and blue colour channels for vegetation phenology analysis [14,21,25,29]. Among these, GCC is the most widely used and reliable proxy to monitor the canopy phenology of coniferous species [25,26,30]. To our knowledge, only one study is available comparing field observations of bud phenology in black spruce (Picea mariana (Mill.) B.S.P.) with PhenoCam images. This study focused on a single site, thus lacking a global view of the performance of satellites in assessing vegetation indices across the latitudinal distribution of the boreal forest [26]. Our study is unique in terms of the spatial amplitude of the monitoring, which is based on a PhenoCam network measuring phenology of the most important boreal species in North America.
The relationship between PhenoCam and satellite data raises concerns, in particular for the lack of infrared bands in various PhenoCams. To compute the vegetation index from digital images, PhenoCams use visible sections of the electromagnetic spectrum compared to the satellite-based vegetation indices that use infrared light. Some previous studies tried to establish links between PhenoCam and the traditional vegetation indices (e.g., NDVI) and compared phenophase transition dates such as the start, end, and length of the growing season for various tree species [28,31]. These studies demonstrated the presence of significant correlations, although satellite estimated an earlier start and later ending of the growing season compared with PhenoCams. Yet, the relationship between PhenoCam and remote-sensing-derived vegetation indices (e.g., NDVI and EVI) remains unknown for species of the boreal ecosystem, the largest biome in the world in terms of extension and importance. Studies are available from semiarid tropical forests of Brazil, temperate deciduous forests of eastern North America, grasslands, and mixed land cover types of North America [14,27,32]. The results suggest that EVI is more performant than NDVI for assessing phenology. The question remains whether these results are true also at the higher latitudes of the Earth. The boreal biome experiences long winters with the soil covered by snow that can affect the temporal variation in vegetation greenness. The physical interaction between vegetation index, growth reactivation, and snow cover is not completely disentangled and is worthy of deeper studies [14,27,32].
We present a phenological study on a boreal species (black spruce) that combines the broad extent of a satellite-based platform with the fine spatial and temporal scale observations of a digital camera (PhenoCam) across the entire latitudinal gradient of the closed boreal forest in Quebec, Canada. Our study links satellite-derived vegetation indices, collected at a resolution of 16 days, with PhenoCam data, obtained at a daily resolution, to improve landscape-scale phenology understanding of the boreal region
We expect to detect significant differences between RGB PhenoCam-based and satellite-based vegetation indices that use infrared light in plant phenology measurements. Therefore, the main objective of this paper was to compare the RGB PhenoCam-based (GCC) phenology with multispectral MODIS satellite-based vegetation indices (NDVI and EVI), collected in six black spruce stands of Quebec, Canada. While previous studies have linked in situ or satellite data with digital camera data, for different types of vegetation or tree species [19,28], our investigation focus on a unique network of PhenoCam data installed in black spruce stands dominated by the more important boreal species of North America.
2. Materials and Methods
2.1. Study Area
We selected six stands along a latitudinal gradient between the 48th and 53rd parallels covering the boreal forest region of Quebec, Canada (Figure 1 and Table 1). All stands are dominated by black spruce. The climate of the area is typically boreal, with cool summers and very cold winters. Mean annual temperature varies between −1.6 and 4.1 °C, with the highest values recorded in the southern site. Winter temperatures attained a minimum ranging between −29.8 and −47.1 °C, while May–September mean temperature was 12.1 °C [33].
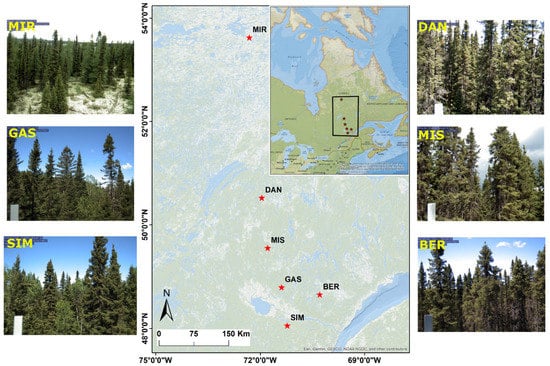
Figure 1.
Coverage area of PhenoCam sites: Simoncouche (abbreviated as SIM), Gaspard (GAS), Bernatchez (BER), Mistassibi (MIS), Camp Daniel (DAN), and Mirage (MIR) along the latitude in Quebec, Canada, and corresponding PhenoCam images of June for each site.

Table 1.
Summary of PhenoCam site characteristics for Simoncouche (abbreviated as SIM), Gaspard (GAS), Bernatchez (BER), Mistassibi (MIS), Camp Daniel (DAN), and Mirage (MIR).
2.2. Near-Surface Remote Sensing Data
A digital camera (Netcam XL, StarDot Technologies, Buena Park, CA, USA) was installed in each stand in 2014 or 2015 8 m from the ground, pointing north to minimize shadows and lens flare, connected to a CR10X datalogger (Campbell Scientific Corporation, Edmonton, AB, Canada).
Automatic settings were turned off to minimize the daily variability in scene illumination and exposure adjustment [20,23]. The digital camera reactivated each 30 min and collected and stored the images in a memory card connected to the datalogger. In this study, we selected images from 2016 to 2019, when the records during the year in the sites were possibly complete (Table 1). Except for the southern stands of SIM and GAS (Figure 1), the other sites are remote and only partially accessible during the growing season. Thus, gaps in data collection were still present during the study period due to technical problems with the cameras, which were detected only when access to the sites was possible during the snow-free season.
We selected images between 11 a.m. and 2 p.m. to maintain sunlight constantly. For each year, images were divided into different groups using the centre-line image (CLI) technique to detect potential field of view (FOV) shifts in the digital camera [34]. We used the built-in CLI processor of the xROI R package as a shift monitoring module for the regions of interest (ROI) of each group according to FOV shifts.
During data extraction, we defined 10 ROIs per image to collect data from the black spruce canopy and excluded other irrelevant phenomena from the surrounding areas such as other tree species, sky, and ground. The near-surface phenology data were derived using green chromatic coordinate (GCC) index [35,36] calculated as:
where RedDN, GreenDN, and BlueDN are the red, green, and blue colour channels of the PhenoCam digital camera and represent digital numbers (DN) stored in JPEG format. The chromatic coordinate index normalizes each individual colour band against the total pixel value of the three channels. GCC in particular is the most reliable index for phenological analysis [32], vegetation identification [37], plant health status [38], and biological conservation and restoration [39]. We used the xROI R package for extraction of the 90th percentile of the GCC index for each ROI separately [34].
2.3. MODIS Data
We acquired time series of 250 m Terra Moderate Resolution Imaging Spectroradiometer (MODIS) Vegetation Indices (MOD13Q1, version 6) NDVI [7] and EVI [9] from the NASA LP DAAC (https://lpdaac.usgs.gov/products/mod13q1v006/; accessed on 24 July 2020), which is archived in the GEE platform (https://earthengine.google.com/; accessed on 24 July 2020, Mountain View, CA, USA).
where , , and correspond to MODIS Band 1 (620–670 nm), Band 3 (459–479 nm), and Band 2 (841–871 nm) spectral reflectance values. MOD13Q1 is derived from atmospherically corrected bi-directional surface reflectance imagery and contains vegetation index data, as well as the pixel reliability layer needed for quality checking [40]. We computed 16-day NDVI and EVI maximum composite values for six sites using the JavaScript code editor in the GEE platform (see Supplementary Data) for similar PhenoCam image availability years (Table 1). We selected 40 forest polygons extracted from the 1:20,000 forest map [41] (Figure 1) within a buffer distance of 5 km from each selected site. The polygons used in this analysis corresponded to forest stands dominated by black spruce (>75%) and remained undisturbed for at least 30 years. We extracted NDVI and EVI for the selected polygons. Depending on the size of each polygon, some of them intersected with black spruce stands; thus, we ensured that the calculated vegetation indices only provided information on the greenness of black spruce trees.
2.4. Curve Fitting and Statistics
GCC, NDVI, and EVI were fitted with a double-logistic function (Figure S1),
where min and max are the minimum and maximum values measured in winter and summer, respectively, start of season (SOS) and end of season (EOS) are the inflection points when the curve rises and falls, and slope1 and slope2 are the rates of increase and decrease of the curve at the inflection points [15,42,43]. This function describes asymmetrical patterns, leading to a reliable estimation of the trajectory in canopy greenness [42].
The coefficients of the double-logistic function were compared among GCC, NDVI, and EVI using repeated measurements mixed models, where the site was considered a random factor [44]. We adopted a first-order autoregressive model for the random error accounting for the autocorrelation of errors. Length of growing season (LOS) was computed by calculating the difference between SOS and EOS. We assessed the relationship between indexes for SOS, EOS, and LOS using linear mixed models, where the site was considered a random factor. All statistics were performed using JMP 14 or SAS (SAS Institute Inc., Cary, NC, USA).
3. Results
3.1. Time Series of GCC, EVI, and NDVI
GCC, EVI, and NDVI showed a bell-shaped pattern, with a slow increase in spring, a rapid increase culminating with a plateau in July, and a decrease in autumn until reaching a minimum value in winter (Figure 2, Figure 3 and Figure 4). On average, GCC ranged from 0.36 in winter and spring to 0.47 in summer along the latitudinal gradient, NDVI ranged from 0.17 in winter and spring to 0.87 in summer, and EVI ranged from 0.13 in winter and spring to 0.65 in summer. The double-logistic function represented GCC, EVI, and NDVI well during the whole season, including asymmetry in the transitions between spring, summer, and autumn. There were some missing values due to the unavailability of PhenoCam images. However, the double-logistic function reduces the error caused by missing GCC values due to its weighted approach. The variability of NDVI and EVI within the same zone and date was based on the size of each polygon. Since the sizes of the 40 polygons within the 5 km buffer were different, the corresponding index was also different since the MODIS pixels varied for each polygon. The lower standard deviation was observed for parameters min (between 0.015 and 0.018), max (between 0.034 and 0.044), slope1 (between 0.007 and 0.012), slope2 (between 0.003 and 0.006), the 2019 SOS (between 3.56 and 10.26), and EOS (between 4.84 and 11.13). On the other hand, parameter estimates for spring increase (SOS) and autumnal decrease (EOS) showed variations among years. The standard deviation for SOS (3.56) and EOS (4.84) was lowest during 2019 and highest in 2018 (for SOS = 10.26 and EOS = 11.13).
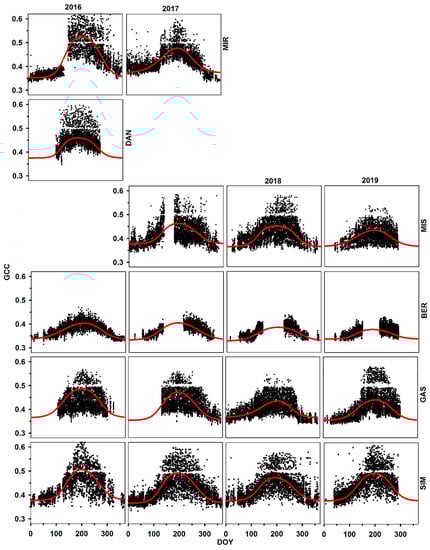
Figure 2.
Time series of PhenoCam GCC for different sites along the latitude in Quebec for black spruce trees. Provenances are listed according to increasing latitude of the stands of origin. The removal of hazy images caused a data gap of about 0.5 the value of GCC.
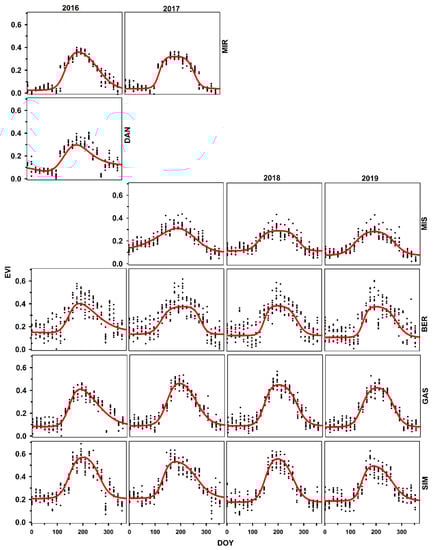
Figure 3.
Time series of MODIS-EVI for different sites along the latitude in Quebec for black spruce trees. Provenances are listed according to increasing latitude of the stands of origin.
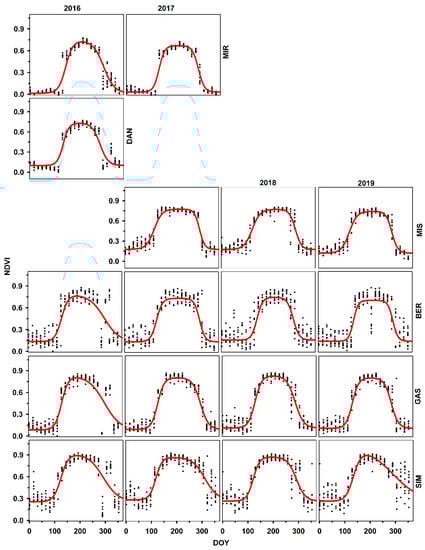
Figure 4.
Time series of MODIS-NDVI for different sites along the latitude in Quebec for black spruce trees. Provenances are listed according to increasing latitude of the stands of origin.
In all sites, SOS of GCC occurred in the second week of May (DOY 131), while EOS occurred at the end of September (DOY 269) (Supplementary Data; Table S1). = slope1 and slope2 were estimated at 0.0428 and 0.041, respectively, demonstrating that the autumnal reduction in GCC was very close to the spring increase when combining the effects of all sites together. SOS was observed in the second week of May for all years, with a difference of only two days between 2016–2017 (DOY 132) and 2018–2019 (DOY 129). EOS was observed at the beginning of the fourth week of September for 2017 (DOY 264) and 2019 (DOY 266), in the last week of September for 2018 (DOY 270), and in the first week of October for 2016 (DOY 275). There was no difference among years for slope1 (between 0.04 and 0.046) and slope2 (between −0.04 and −0.043), except for 2017 for slope2 (−0.035).
For NDVI, SOS occurred at the end of April (DOY 114) and EOS at the end of October (DOY 295). The slope1 and slope2 were estimated at 0.041 and 0.044, respectively, demonstrating that the autumnal reduction in NDVI was very close to the spring increase, when combining the effects of all sites together (Supplementary data; Table S2). SOS was observed in the last week of April for 2016 and 2019 and during mid-April 2017 (DOY 112) and 2018 (DOY 106). Overall, EOS was observed at the end of October for all the years. However, it was three days earlier for 2017 (DOY 294) and 2019 (DOY 293) than for 2016 (DOY 296) and 2018 (DOY 298). No difference was observed among years for slope2 (between –0.043 and –0.046). There were slight variations among years for slope1. The minimum value was observed for 2018 (0.038) and maximum for 2016 (0.045).
For EVI, SOS was observed in the first week of May (DOY 127) and EOS at the end of September (DOY 274) (Supplementary Data; Table S3). The slope1 and slope2 rates were estimated at 0.0274 and 0.0271, respectively (Table S3), demonstrating that the autumnal reduction in EVI was equivalent to the spring increase when the effects of all sites were combined. SOS was observed between the first (DOY 124) and second week (DOY 130) of May for all years. In addition, EOS was observed earlier in 2017 (DOY 272) and 2019 (DOY 269) than in 2016 (DOY 279) and 2018 (DOY 276). For slope1, the minimum value was observed for 2018 (0.023), and it was maximum for 2016 (0.03). However, slope2 showed minimal variations for all the years (between −0.024 and −0.029).
We quantified the linear relationships between GCC and MODIS vegetation indices during the different growing seasons. We found strong correlations between PhenoCam GCC and EVI (R2 = 0.66 in spring, R2 = 0.78 in autumn, and R2 = 0.85 during the entire growing season; p < 0.05; Table 2). Overall, the slopes of this relationship were similar for spring and autumn. For the GCC- and EVI-based model, 95% of data points exhibited studentized residuals of between −2 and 2 and were uniformly distributed around the predicted GCC values (Supplementary Data; Figures S2–S3), suggesting that the analysis was properly represented by the model. The GCC and NDVI linear relationship was very weak for spring, autumn, and the entire growing season (p > 0.05; Table 2).
Table 2.
Linear mixed model effect of GCC on the vegetation indices (NDVI and EVI) for onset (SOS), ending (EOS), and length of growing season (LOS). Significance level was at * = p < 0.05.
3.2. Comparison between Indices
We quantified mixed model relationships among GCC, NDVI, and EVI for different phenological parameters (SOS, EOS, slope1, slope2, mix, and max) and found significant differences among them (all p < 0.0001). For SOS, GCC and EVI showed a higher average and fewer variations than NDVI. It was not different between EVI and GCC (3.5 days; p < 0.0001), whereas a difference of 17.05 days was observed between NDVI and GCC. For EOS, GCC (267.61 DOY) was closer to EVI (273.67 DOY) but lower than NDVI (295.4 DOY). It did not differ between EVI and GCC (5.4 days; p < 0.0001), but a very large difference was observed between NDVI and GCC (26.89 days) (Table 3; Figure 5).
Table 3.
Statistical parameters of MIXED model procedure based on phenological parameters of GCC, EVI, and NDVI curve fitting. “a” superscript indicates values significantly similar to each other at p < 0.0001.
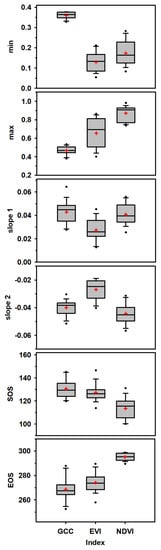
Figure 5.
Mixed-model-based comparison of GCC, NDVI, and EVI derived phenology parameters, Mixed-model-based comparison of GCC, NDVI, and EVI derived Phenological parameters of black spruce computed using Equation (4) for six PhenoCam sites along the latitude in Quebec, Canada. Boxes represent upper and lower quartiles, whiskers achieve the 10th and 90th percentiles, and the mean and median are drawn as red cross and horizontal black solid lines, respectively.
The min variable varied between 0.164 and 0.365, whereas the average value of the max variable was 0.691, with the minimum value observed for GCC and maximum variation recorded for EVI (Figure 5). Moreover, EVI estimates were significantly correlated with NDVI (p < 0.0001) for min and max variables (Table 2). GCC estimates for slope1 and slope2 were significantly matched with NDVI (p < 0.0001) and showed different rates to EVI (Table 3; Figure 5).
4. Discussion
4.1. Difference between Remote Sensing Phenology (NDVI and EVI) and Near-Surface Phenology (GCC)
In this study, we compared GCC derived from PhenoCam imagery with optical satellite-based vegetation indices by testing the hypothesis that EVI performs better than NDVI in defining black spruce phenology. Unlike previous studies, we used a PhenoCam network involving six mature stands dominated by the same species that covered most of the latitudinal distribution of black spruce in Quebec, Canada. In optical remote sensing, the variability in spectral signatures is considered a noise disturbance. In general, these noises are related to varying atmospheric conditions, the presence of snow on coniferous canopies, and the spatial and spectral variability of understorey vegetation [45,46]. The estimated winter NDVI and EVI (coefficient min of the function) were able to reduce the influence of snowmelt during winter, thus representing an effective greening up of coniferous trees during spring, which resulted in higher slopes of the double-logistic function in spring compared with autumn [42].
Our results were in accordance with previous boreal forest studies, which used a double-logistic function and reported that this function does not overestimate the duration of the growing season, and it handles outliers effectively and estimates parameters that are related to phenological events, such as the timing of spring and autumn. This makes the method most suitable for monitoring vegetation phenology at higher latitudes such as boreal regions [15,33,42].
Our results confirmed the hypothesis and showed that the phenological timings estimated by EVI were similar and more correlated with GCC. This could be attributed to the higher sensitivity of NDVI to soil and atmospheric factors compared to EVI. The latter index reduces soil and atmospheric effects and retains a higher sensitivity over denser vegetation canopies, which is found to have a considerable impact on vegetation indices [9,47].
In addition, EVI is designed to extract canopy greenness, regardless of the soil background and atmospheric aerosol variations. EVI is more spectrally sensitive to the NIR band and provides a higher canopy optical penetration depth due to the presence of an additional blue band and optimized soil factor value, which increases its spectral sensitivity to record information from multiple canopy leaf layers. In contrast, NDVI uses only red and NIR spectral bands and represents the total leaf variation in a vegetation canopy, which includes leaves with and without photosynthetic activities [9,47,48]. Previous studies reported that NDVI was saturated for coniferous plants because it cannot record small variations in leaf area index (LAI) during spring and autumn [49]. NDVI can provide spectral information of uppermost leaf layers due to higher absorptive properties of leaf pigments in the red spectral band, which eventually saturates NDVI compared to EVI over higher LAI or biomass areas [50,51].
Furthermore, GCC reflects vegetation dynamics differently from satellite-based vegetation indexes. It primarily represents the canopy greenness and reduces the effects of scene illumination [35,36]. EVI is more sensitive to coniferous species and comparable with GCC because of its ability to record the increase in pigmentation content and chlorophyll concentration in needles and increase in LAI of the canopy resulting from the growth and development of new needles formed in spring [26,49]. During late autumn, the consequences of needle aging along with declining pigmentation may decrease the LAI and result in a higher correlation between GCC and EVI [24,49,52].
4.2. Which Vegetation Indices Can Monitor GCC Phenology?
Previous studies used remote sensing vegetation indices and compared them with PhenoCam data for a number of species and ecosystems [24,27,53]. To our knowledge, index–specific comparisons of the phenological metrics for coniferous species are still missing and lack fine spatial details. Cui et al. [27] detected a significant correlation between MODIS-based NDVI and EVI at a 500 m spatial resolution with PhenoCam-based GCC on the beginning of greenness for North American grass phenology but did not find a significant correlation for the length and end of greenness for both vegetation indices. Zhang et al. [14] compared visible infrared imaging radiometer suite (VIIRS)-based NDVI and EVI2 (two-band enhanced vegetation index) data at a 500 m spatial resolution with PhenoCam GCC. They observed a better agreement between GCC and EVI2 compared to NDVI for the vegetation greening phase, but this disappeared for the senescence phase of North American deciduous forests for both vegetation indices. Our study demonstrated that GCC was more correlated with EVI for onset, ending, and length of growing season. Our results improved the relationship between GCC and EVI phenological metrics. This could be attributed to the higher spectral sensitivity of EVI for multiple canopy leaf layers due to the presence of an additional blue band and the optimized soil factor value [9], which enhance the reliability of estimations at the stand level for two important phenological phases of the onset and end of senescence for black spruce. The weak relationships between GCC and NDVI were consistent with previous studies [25].
The phenological differences between GCC and EVI were small for spring (1–5 days) and autumn (1–3 days) in the southern sites. Larger differences were observed with NDVI for both spring and autumn (10–25 days) in all sites. The northern sites showed higher differences between MIR, DAN, and MIS. This could be attributed to the spatial heterogeneity captured in the field of view by the PhenoCam and the satellite observations due to the presence of snow and mixed forest types in this region. Since the pixel size of the MODIS data is notably larger than the PhenoCam data, NDVI- and EVI-based phenology detection is expected to be more comparable to GCC in homogenous sites than in heterogeneous sites [14,25,29]. Previous PhenoCam-based studies did not report the issue of FOV differences because of the change in camera view angles, which may occur due to wind and vibration in rough weather conditions in remote locations. These FOV differences may cause an error in time-series index values extracted from the selected ROIs. Therefore, it is important to readjust ROIs based on the FOV shifts. In this study, uncertainty related to shifts in ROI in each PhenoCam site was reduced by considering the FOV shift detection module from the xROI package [27,34]. Overall, our study provided a robust experimental design to understand black spruce phenology by comparing coefficients of the double-logistic function among time-series PhenoCam GCC and MODIS VIs using the mixed model approach.
4.3. Implications of this Study
Our results provide a protocol to investigate and compare the canopy phenology of black spruce derived from PhenoCam digital images and MODIS-satellite-derived vegetation indices for six black spruce stands covering the latitudinal gradient of the Quebec boreal region. Thus, this study has the potential to improve the results of previous studies related to near-surface digital repeat photography (i.e., PhenoCam) and satellite data. By providing a novel and reliable statistical approach, this study could provide robust phenological models for coniferous forests in the absence of field observations for remote locations. In this study, we compared RGB PhenoCam-derived GCC with NIR-based MODIS EVI and NDVI to estimate the evergreen black spruce phenology of six sites along the entire latitudinal range of the closed boreal forest in Quebec, Canada. Our results showed that EVI performs better than NDVI when compared with PhenoCam (GCC) phenology. We demonstrated that NIR-based EVI is more related to RGB-based PhenoCam GCC than NDVI despite differences in spectral bands. The boreal forest represents the largest and least inhabited biome of the earth [54]. Thus, the high spatiotemporal resolutions required by phenological observations are challenging because of the remoteness of the sites, limited access, and harsh conditions during winter [15,55]. Our study shows that the phenological observations derived from RGB PhenoCam are comparable with the NIR-based EVI index. Therefore, satellite remote-sensing-based EVI and PhenoCam-based GCC could be used as a suitable alternative to field-based phenological observations in the boreal region.
5. Conclusions
Phenological observations in remote locations are scarce, and during recent decades, PhenoCam digital imagery has become popular, providing a more straightforward solution to understand plant phenology at both high spatial and temporal resolutions.
This study compared PhenoCam-based GCC at a daily temporal resolution with 16-day temporal resolution MODIS, NDVI, and EVI for six sites across the boreal forests of Quebec, Canada. Our study highlighted differences between the dynamics of canopy and stand-level phenology of black spruce measured from near-surface digital photography and satellite data, respectively, and therefore, the proposed approach has the potential to improve the relationship between landscapes captured by PhenoCam cameras and satellite sensors at different spatial resolutions [29].
We found a close relationship of PhenoCam GCC with satellite-sensor-based vegetation indices. EVI performs better than NDVI, with an average absolute difference of 1 to 5 days in evergreen black spruce. These results rejected our initial hypothesis, which expected a significant difference between RGB-based GCC and infrared-based EVI and NDVI. Researchers can use this approach to understand the phenology of single or multiple species.
This study presents a unique approach to compute GCC-based phenological metrics despite missing PhenoCam images for some locations and incorporates the issue of field of view shifts of a camera caused by heavy winds in remote locations [34,52]. We provide evidence that EVI has a more reliable spectral vegetation index for estimating phenology in black spruce than NDVI. The time lag for the seasonal dynamics between EVI and PhenoCam was short and not significantly different for both onset and ending. Our study, based on years of data collection by a network of PhenoCams covering a large study area, builds a bridge between PhenoCam and satellite remote-sensing-based phenological observations. Our findings are useful for designing phenological investigations on wide regions, mainly in remote sites where field data collections at regular time intervals are prevented by the extreme weather and the limited accessibility.
Supplementary Materials
The following supporting information can be downloaded at: https://www.mdpi.com/article/10.3390/rs14010100/s1, Figure S1: Example of the double logistic function (Equation (4) in the manuscript) used to model the yearly NDVI/EVI/GCC time series. It is defined by six parameters: min and max are the minimum and maximum values measured in winter and summer, respectively, SOS and EOS are the inflection points when the curve rises and falls, and slope1 and slope2 are the rates of increase and decrease of the curve at the inflection points; Figure S2: Example raster image of MODIS 250 spatial resolution data (base layer) and selected layover polygons (represented with black colour) from Quebec Forest inventory around PhenoCam tower site (represented with green star); Figure S3: Statistical relationship between GCC and vegetation indices (NDVI and EVI); Table S1: Coefficients of the double-logistic function fitted for the GCC of black spruce during 2016, 2017, 2018 and 2019 for six sites along the latitude in Quebec; Table S2: Coefficients of the double-logistic function fitted for the NDVI of black spruce during 2016, 2017, 2018 and 2019 for six sites along the latitude in Quebec; Table S3: Coefficients of the double-logistic function fitted for the EVI of black spruce during 2016, 2017, 2018 and 2019 for six sites along the latitude in Quebec; Video S1: Time-laps video of MIR site PhenoCam images.
Author Contributions
Conceptualization, S.K. and S.R.; methodology, S.K. and S.R.; software, S.K.; validation, S.K.; formal analysis, S.K.; investigation, S.K. and S.R.; resources, S.R., A.D., H.M.; data curation, S.K.; writing—original draft preparation, S.K.; writing—review and editing, S.K., S.R., A.D., H.M. and H.L.; visualization, S.K.; supervision, S.R.; project administration, S.R.; funding acquisition, S.R.; S.R. provided the research funding to the first author at the University of Quebec in Chicoutimi (UQAC), Canada. S.K. was the corresponding author. All authors have read and agreed to the published version of the manuscript.
Funding
This work was funded by the Ministère des Forêts, de la Faune et des Parcs du Québec, Direction général du secteur nord-est, région du Saguenay–Lac-St-Jean, Forêt d’Enseignement et de Recherche Simoncouche, and Parc National des Monts-Valin.
Institutional Review Board Statement
Not applicable.
Informed Consent Statement
Not applicable.
Acknowledgments
The authors thank F. Gionest, A. Ferland-Roy, and C. Pelletier for technical support and A. Garside for editing the English text. We also thank the providers of the important public data set in the Google Earth Engine, in particular NASA, USGS, NOAA, EC/ESA, and MERRA-2 model developers.
Conflicts of Interest
The authors declare no conflict of interest.
References
- Richardson, A.D.; Bailey, A.S.; Denny, E.G.; Martin, C.W.; O’KEEFE, J. Phenology of a northern hardwood forest canopy. Glob. Chang. Biol. 2006, 12, 1174–1188. [Google Scholar] [CrossRef] [Green Version]
- Hughes, L. Biological consequences of global warming: Is the signal already. Trends Ecol. Evol. 2000, 15, 56–61. [Google Scholar] [CrossRef]
- Julien, Y.; Sobrino, J.A. Global land surface phenology trends from GIMMS database. Int. J. Remote Sens. 2009, 30, 3495–3513. [Google Scholar] [CrossRef] [Green Version]
- Zhang, X.; Goldberg, M.D. Monitoring fall foliage coloration dynamics using time-series satellite data. Remote Sens. Environ. 2011, 115, 382–391. [Google Scholar] [CrossRef]
- Fisher, J.I.; Mustard, J.F.; Vadeboncoeur, M.A. Green leaf phenology at Landsat resolution: Scaling from the field to the satellite. Remote Sens. Environ. 2006, 100, 265–279. [Google Scholar] [CrossRef]
- Drusch, M.; Del Bello, U.; Carlier, S.; Colin, O.; Fernandez, V.; Gascon, F.; Hoersch, B.; Isola, C.; Laberinti, P.; Martimort, P. Sentinel-2: ESA’s optical high-resolution mission for GMES operational services. Remote Sens. Environ. 2012, 120, 25–36. [Google Scholar] [CrossRef]
- Rouse, W.; Haas, H.; Deering, W. 20 Monitoring Vegetation Systems in the Great Plains With Erts. Proc. ofthe Third ERTS Symp. 1974, 309–317. [Google Scholar]
- Tucker, C.J.; Sellers, P.J. Satellite remote sensing of primary production. Int. J. Remote Sens. 1986, 7, 1395–1416. [Google Scholar] [CrossRef]
- Huete, A.; Didan, K.; Miura, T.; Rodriguez, E.; Gao, X.; Ferreira, L. Overview of the radiometric and biophysical performance of the MODIS vegetation indices. Remote Sens. Environ. 2002, 83, 195–213. [Google Scholar] [CrossRef]
- Ganguly, S.; Friedl, M.A.; Tan, B.; Zhang, X.; Verma, M. Land surface phenology from MODIS: Characterization of the Collection 5 global land cover dynamics product. Remote Sens. Environ. 2010, 114, 1805–1816. [Google Scholar] [CrossRef] [Green Version]
- Zhang, X.; Friedl, M.A.; Schaaf, C.B.; Strahler, A.H.; Hodges, J.C.F.; Gao, F.; Reed, B.C.; Huete, A. Monitoring vegetation phenology using MODIS. Remote Sens. Environ. 2003, 84, 471–475. [Google Scholar] [CrossRef]
- Zhang, X.; Tan, B.; Yu, Y. Interannual variations and trends in global land surface phenology derived from enhanced vegetation index during 1982–2010. Int. J. Biometeorol. 2014, 58, 547–564. [Google Scholar] [CrossRef] [PubMed] [Green Version]
- Fu, Y.; Zhang, H.; Dong, W.; Yuan, W. Comparison of Phenology Models for Predicting the Onset of Growing Season over the Northern Hemisphere. PLoS One 2014, 9, e109544. [Google Scholar] [CrossRef]
- Zhang, X.; Jayavelu, S.; Liu, L.; Friedl, M.A.; Henebry, G.M.; Liu, Y.; Schaaf, C.B.; Richardson, A.D.; Gray, J. Evaluation of land surface phenology from VIIRS data using time series of PhenoCam imagery. Agric. For. Meteorol. 2018, 256–257, 137–149. [Google Scholar] [CrossRef]
- Khare, S.; Drolet, G.; Sylvain, J.D.; Paré, M.C.; Rossi, S. Assessment of spatio-temporal patterns of black spruce bud phenology across Quebec based on MODIS-NDVI time series and field observations. Remote Sens. 2019, 11, 2745. [Google Scholar] [CrossRef] [Green Version]
- Khare, S.; Ghosh, S.K.; Latifi, H.; Vijay, S.; Dahms, T. Seasonal-based analysis of vegetation response to environmental variables in the mountainous forests of western himalaya using landsat 8 data. Int. J. Remote Sens. 2017, 38, 4418–4442. [Google Scholar] [CrossRef] [Green Version]
- Morisette, J.T.; Richardson, A.D.; Knapp, A.K.; Fisher, J.I.; Graham, E.A.; Abatzoglou, J.; Wilson, B.E.; Breshears, D.D.; Henebry, G.M.; Hanes, J.M. Tracking the rhythm of the seasons in the face of global change: Phenological research in the 21st century. Front. Ecol. Environ. 2009, 7, 253–260. [Google Scholar] [CrossRef] [Green Version]
- Brown, T.B.; Hultine, K.R.; Steltzer, H.; Denny, E.G.; Denslow, M.W.; Granados, J.; Henderson, S.; Moore, D.; Nagai, S.; SanClements, M. Using phenocams to monitor our changing Earth: Toward a global phenocam network. Front. Ecol. Environ. 2016, 14, 84–93. [Google Scholar] [CrossRef] [Green Version]
- Ahrends, H.E.; Etzold, S.; Kutsch, W.L.; Stöckli, R.; Brügger, R.; Jeanneret, F.; Wanner, H.; Buchmann, N.; Eugster, W. Tree phenology and carbon dioxide fluxes: Use of digital photography for process-based interpretation at the ecosystem scale. Clim. Res. 2009, 39, 261–274. [Google Scholar] [CrossRef] [Green Version]
- Richardson, A.D.; Braswell, B.H.; Hollinger, D.Y.; Jenkins, J.P.; Ollinger, S. V Near-surface remote sensing of spatial and temporal variation in canopy phenology. Ecol. Appl. 2009, 19, 1417–1428. [Google Scholar] [CrossRef]
- Peter, J.S.; Hogland, J.; Hebblewhite, M.; Hurley, M.A.; Hupp, N.; Proffitt, K. Linking phenological indices from digital cameras in Idaho and Montana to MODIS NDVI. Remote Sens. 2018, 10, 1612. [Google Scholar] [CrossRef] [Green Version]
- Laskin, D.N.; McDermid, G.J. Evaluating the level of agreement between human and time-lapse camera observations of understory plant phenology at multiple scales. Ecol. Inform. 2016, 33, 1–9. [Google Scholar] [CrossRef]
- Richardson, A.D.; Jenkins, J.P.; Braswell, B.H.; Hollinger, D.Y.; Ollinger, S.V.; Smith, M.L. Use of digital webcam images to track spring green-up in a deciduous broadleaf forest. Oecologia 2007, 152, 323–334. [Google Scholar] [CrossRef]
- Sonnentag, O.; Hufkens, K.; Teshera-Sterne, C.; Young, A.M.; Friedl, M.; Braswell, B.H.; Milliman, T.; O’Keefe, J.; Richardson, A.D. Digital repeat photography for phenological research in forest ecosystems. Agric. For. Meteorol. 2012, 152, 159–177. [Google Scholar] [CrossRef]
- Richardson, A.D.; Hufkens, K.; Milliman, T.; Frolking, S. Intercomparison of phenological transition dates derived from the PhenoCam Dataset V1.0 and MODIS satellite remote sensing. Sci. Rep. 2018, 8, 1–12. [Google Scholar] [CrossRef] [Green Version]
- Zhang, S.; Buttò, V.; Khare, S.; Deslauriers, A.; Morin, H.; Huang, J.G.; Ren, H.; Rossi, S. Calibrating PhenoCam Data with Phenological Observations of a Black Spruce Stand. Can. J. Remote Sens. 2020, 46, 154–165. [Google Scholar] [CrossRef]
- Cui, T.; Martz, L.; Lamb, E.G.; Zhao, L.; Guo, X. Comparison of Grassland Phenology Derived from MODIS Satellite and PhenoCam Near-Surface Remote Sensing in North America. Can. J. Remote Sens. 2019, 45, 707–722. [Google Scholar] [CrossRef]
- Hufkens, K.; Friedl, M.; Sonnentag, O.; Braswell, B.H.; Milliman, T.; Richardson, A.D. Linking near-surface and satellite remote sensing measurements of deciduous broadleaf forest phenology. Remote Sens. Environ. 2012, 117, 307–321. [Google Scholar] [CrossRef]
- Liu, Y.; Hill, M.J.; Zhang, X.; Wang, Z.; Richardson, A.D.; Hufkens, K.; Filippa, G.; Baldocchi, D.D.; Ma, S.; Verfaillie, J.; et al. Using data from Landsat, MODIS, VIIRS and PhenoCams to monitor the phenology of California oak/grass savanna and open grassland across spatial scales. Agric. For. Meteorol. 2017, 237–238, 311–325. [Google Scholar] [CrossRef]
- Brown, L.A.; Dash, J.; Ogutu, B.O.; Richardson, A.D. On the relationship between continuous measures of canopy greenness derived using near-surface remote sensing and satellite-derived vegetation products. Agric. For. Meteorol. 2017, 247, 280–292. [Google Scholar] [CrossRef] [Green Version]
- Browning, D.M.; Karl, J.W.; Morin, D.; Richardson, A.D.; Tweedie, C.E. Phenocams bridge the gap between field and satellite observations in an arid grassland ecosystem. Remote Sens. 2017, 9, 1071. [Google Scholar] [CrossRef] [Green Version]
- Klosterman, S.T.; Hufkens, K.; Gray, J.M.; Melaas, E.; Sonnentag, O.; Lavine, I.; Mitchell, L.; Norman, R.; Friedl, M.A.; Richardson, A.D. Evaluating remote sensing of deciduous forest phenology at multiple spatial scales using PhenoCam imagery. Biogeosciences 2014, 11, 4305–4320. [Google Scholar] [CrossRef] [Green Version]
- Antonucci, S.; Rossi, S.; Deslauriers, A.; Morin, H.; Lombardi, F.; Marchetti, M.; Tognetti, R. Large-scale estimation of xylem phenology in black spruce through remote sensing. Agric. For. Meteorol. 2017, 233, 92–100. [Google Scholar] [CrossRef]
- Seyednasrollah, B.; Milliman, T.; Richardson, A.D. Data extraction from digital repeat photography using xROI: An interactive framework to facilitate the process. ISPRS J. Photogramm. Remote Sens. 2019, 152, 132–144. [Google Scholar] [CrossRef]
- Gillespie, A.R.; Kahle, A.B.; Walker, R.E. Color enhancement of highly correlated images. II. Channel ratio and “chromaticity” transformation techniques. Remote Sens. Environ. 1987, 22, 343–365. [Google Scholar] [CrossRef]
- Richardson, A.D.; Hufkens, K.; Milliman, T.; Aubrecht, D.M.; Chen, M.; Gray, J.M.; Johnston, M.R.; Keenan, T.F.; Klosterman, S.T.; Kosmala, M.; et al. Tracking vegetation phenology across diverse North American biomes using PhenoCam imagery. Sci. Data 2018, 5, 1–24. [Google Scholar] [CrossRef] [PubMed]
- Woebbecke, D.M.; Meyer, G.E.; Von Bargen, K.; Mortensen, D.A. Color indices for weed identification under various soil, residue, and lighting conditions. Trans. ASAE 1995, 38, 259–269. [Google Scholar] [CrossRef]
- Nijland, W.; de Jong, R.; de Jong, S.M.; Wulder, M.A.; Bater, C.W.; Coops, N.C. Monitoring plant condition and phenology using infrared sensitive consumer grade digital cameras. Agric. For. Meteorol. 2014, 184, 98–106. [Google Scholar] [CrossRef] [Green Version]
- Alberton, B.; Torres, S.; Cancian, L.F.; Borges, B.D.; Almeida, J.; Mariano, G.C.; Patricia, L.; Morellato, C. Introducing digital cameras to monitor plant phenology in the tropics: Applications for conservation. Perspect. Ecol. Conserv. 2017, 15, 82–90. [Google Scholar] [CrossRef]
- Didan, K. MOD13Q1 MODIS/Terra Vegetation Indices 16-Day L3 Global 250m SIN Grid V006; NASA EOSDIS Land Processes DAAC: Sioux Falls, SD, USA, 2015. [Google Scholar]
- Direction des Inventaires Forestiers. MRNF Normes de cartographie écoforestière-Troisième inventaire écoforestier; QC, Canada, 2009; Available online: https://www.mffp.gouv.qc.ca/publications/forets/connaissances/Norme-cartographie-ecoforestiere.pdf (accessed on 15 December 2021)ISBN 978-2-550-54985-7.
- Beck, P.S.A.; Atzberger, C.; Høgda, K.A.; Johansen, B.; Skidmore, A.K. Improved monitoring of vegetation dynamics at very high latitudes: A new method using MODIS NDVI. Remote Sens. Environ. 2006, 100, 321–334. [Google Scholar] [CrossRef]
- Khare, S.; Latifi, H.; Khare, S. Vegetation growth analysis of unesco world heritage hyrcanian forests using multi-sensor optical remote sensing data. Remote Sens. 2021, 13, 3965. [Google Scholar] [CrossRef]
- Gibbons, R.D.; Hedeker, D.; DuToit, S. Advances in analysis of longitudinal data. Annu. Rev. Clin. Psychol. 2010, 6, 79–107. [Google Scholar] [CrossRef] [PubMed] [Green Version]
- Wielgolaski, F.-E.; Inouye, D.W. An, Phenology Environmental, Integrative; Schwartz, M.D., Ed.; Kluwer Academic Publishers: Dordrecht, The Netherlands, 2003; ISBN 978-94-007-0632-3. [Google Scholar]
- Hird, J.N.; McDermid, G.J. Noise reduction of NDVI time series: An empirical comparison of selected techniques. Remote Sens. Environ. 2009, 113, 248–258. [Google Scholar] [CrossRef]
- Todd, S.W.; Hoffer, R.M. Responses of Spectral Indices to Variations in Vegetation Cover and Soil Background. Photogramm. Eng. Remote Sens. 1998, 64, 915–922. [Google Scholar]
- Yoshioka, H.; Miura, T.; Obata, K. Derivation of Relationships between Spectral Vegetation Indices from Multiple Sensors Based on Vegetation Isolines. Remote Sens. 2012, 4, 583–597. [Google Scholar] [CrossRef] [Green Version]
- Chen, X.; Vierling, L.; Deering, D.; Conley, A. Monitoring boreal forest leaf area index across a Siberian burn chronosequence: A MODIS validation study. Int. J. Remote Sens. 2005, 26, 5433–5451. [Google Scholar] [CrossRef] [Green Version]
- Fensholt, R. Earth observation of vegetation status in the Sahelian and Sudanian West Africa: Comparison of Terra MODIS and NOAA AVHRR satellite data. Int. J. Remote Sens. 2004, 25, 1641–1659. [Google Scholar] [CrossRef]
- Huete, A.; Miura, T.; Yoshioka, H.; Ratana, P.; Broich, M. Indices of Vegetation Activity. In Biophysical Applications of Satellite Remote Sensing; Springer: Berlin/Heidelberg, Germany, 2013; ISBN 9783642250460. [Google Scholar]
- Keenan, T.F.; Darby, B.; Felts, E.; Sonnentag, O.; Friedl, M.A.; Hufkens, K.; O’Keefe, J.; Klosterman, S.; Munger, J.W.; Toomey, M.; et al. Tracking forest phenology and seasonal physiology using digital repeat photography: A critical assessment. Ecol. Appl. 2014, 24, 1478–1489. [Google Scholar] [CrossRef] [Green Version]
- Melaas, E.K.; Sulla-Menashe, D.; Gray, J.M.; Black, T.A.; Morin, T.H.; Richardson, A.D.; Friedl, M.A. Multisite analysis of land surface phenology in North American temperate and boreal deciduous forests from Landsat. Remote Sens. Environ. 2016, 186, 452–464. [Google Scholar] [CrossRef]
- Taggart, R.E.; Cross, A.T. Global greenhouse to icehouse and back again: The origin and future of the Boreal Forest biome. Glob. Planet. Change 2009, 65, 115–121. [Google Scholar] [CrossRef]
- Buttò, V.; Khare, S.; Drolet, G.; Sylvain, J.D.; Gennaretti, F.; Deslauriers, A.; Morin, H.; Rossi, S. Regionwide temporal gradients of carbon allocation allow for shoot growth and latewood formation in boreal black spruce. Glob. Ecol. Biogeogr. 2021, 30, 1657–1670. [Google Scholar] [CrossRef]
Publisher’s Note: MDPI stays neutral with regard to jurisdictional claims in published maps and institutional affiliations. |
© 2021 by the authors. Licensee MDPI, Basel, Switzerland. This article is an open access article distributed under the terms and conditions of the Creative Commons Attribution (CC BY) license (https://creativecommons.org/licenses/by/4.0/).