Article

Experimental Research on Evaluation of Soil Water Content Using Ground Penetrating Radar and Wavelet Packet-Based Energy Analysis

1
School of Civil Engineering, Hunan City University, Yiyang 413000, China
2
Hunan Engineering Research Center of Structural Safety and Disaster Prevention for Urban Underground Infrastructure, Hunan City University, Yiyang 413000, China
3
School of Civil Engineering, Changsha University of Science & Technology, Changsha 410114, China
*
Author to whom correspondence should be addressed.
Remote Sens. 2021, 13(24), 5047; https://doi.org/10.3390/rs13245047
Submission received: 1 November 2021 / Revised: 28 November 2021 / Accepted: 7 December 2021 / Published: 12 December 2021
(This article belongs to the Special Issue Radar Techniques for Structures Characterization and Monitoring)

Abstract

:
Soil water content is one of the most important factors affecting the safety and stability of buildings or structures, especially in roadbeds, slopes, earth dams and foundations. Accurate assessments of soil water content can ensure the quality of construction, reduce construction costs and prevent accidents, among other benefits. In this study, ground penetrating radar (GPR) was used to detect and evaluate changes in soil water content. The GPR signal is usually nonstationary and nonlinear; however, traditional Fourier theory is typically suitable for periodic stationary signals, and cannot reflect the law of the frequency and energy of the GPR signal changing with time. Wavelet transform has good time-frequency localization characteristics, and therefore represents a new method for analyzing and processing GPR signals. According to the time-frequency characteristics of GPR signals, in this paper, a new biorthogonal wavelet basis which was highly matched with the GPR waveform was constructed using the lifting framework of wavelet theory. Subsequently, an evaluation method, namely, the wavelet packet-based energy analysis (WPEA) method, was proposed. The method was utilized to calculate the wavelet packet-based energy indexes (WPEI) of the GPR single-channel signals for clay samples with water contents ranging from 10% to 24%. The research results showed that there was a highly correlated linear relationship between the WPEI and the soil water contents, and the relationship between the two was fitted with a linear fitting function. The feasibility of the method was verified by comparing our results with those obtained using classical wavelet bases to perform the wavelet packet transform. The large-area, continuous scanning measurement method of GPR was shown to be suitable for evaluations of soil water contents in roadbeds, slopes, earth dams, and foundations.

1. Introduction

Soil is an essential element for human survival, production and life. Detailed knowledge of the physical and mechanical parameters of soil is critical for scientific research in fields such as geophysics, ecology, agricultural engineering, water conservation, and civil engineering [1,2]. In the civil engineering, the physical properties (i.e., density, saturation, porosity, etc.) and mechanical properties (i.e., stress, compression coefficient, compression modulus, swelling, shrinkage, etc.) of soil are deeply affected by water content (i.e., moisture content) [3,4]. Changes in the soil water content will not only cause huge changes in soil strength, deformation, frost heave, and infiltration, but will also have a significant impact on the stability of the foundations of buildings and structures, the subsidence of the ground, the flow of groundwater, etc. [5,6,7]. Taking landslides as an example, the rapid increase of soil water content caused by the infiltration of rainwater leads to a rapid decrease of soil strength [8]. Another example is the uneven settlement of subgrade soil. When such soil suffers from an excessively high or low water content, internal voids, weak interlayers, as well as rainfall, surface water and groundwater replenishment, may cause uneven settlement and collapse [9]. Therefore, it is of great significance to ascertain the soil water content in a timely manner in order to make scientific decisions or take reasonable measures.
At present, there are many ways to measure soil water content, including oven-drying, tensiometer, neutron rays, gamma rays, nuclear magnetic resonance, resistance, capacitance and synthetic aperture radar (SAR) methods [10,11,12]. The oven-drying method is a common and standard approach, because it can provide more accurate and reliable results than other methods [13,14]. However, it also has some disadvantages, such as long testing times (because soil samples must be subjected to oven drying for 24 h at 105 °C), low efficiency (as only one sample can be tested at a time), and destructiveness (since the original soil is destroyed in order to obtain the sample) [15]. The tensiometer method is a way to measure the water potential in soil, but its response speed are slow, and the measurement range is narrow [16,17]. Although the neutron and gamma ray methods can quickly determine the soil water content in situ, the operation of the respective instruments is more complicated, and the use of radioactive elements may cause mutations in cells, thereby having side effects on human health [18,19]. Compared with the neutron and gamma ray methods, the electrical resistance and capacitance methods are less expensive, but both are affected by pore distribution, particle size, and salinity [20,21]. The SAR method uses an independent microwave radiation source to detect the soil surface with a spatial resolution of meters to tens of meters under all weather conditions, and measures the radiation amount of radar backscattered signals [22,23,24,25]. However, measurements of soil water content are easily affected by the soil surface roughness and vegetation coverage. Therefore, there is an urgent for a fast, efficient, and accurate nondestructive testing technology to detect the soil water content.
The ground penetrating radar (GPR) method is a nondestructive detection technology that captures reflections of electromagnetic waves, thereby making it possible to analyze underground media. It has the advantages of continuous scanning, rapidity, high resolution, large detection depth, accurate measurement results, and is suitable for various geological conditions [26,27,28]. The GPR method provides additional advantages in that it enables spatial mapping of the soil material, particle size, water content, soil layer distribution, etc. below the surface of roadbeds, slopes, earth dams, and foundations [29]. Soil water content measurements using GPR are not limited to a specific location or depth. The space measurement performed using GPR allows the monitoring of an area containing thousands of measurement points per hectare, thereby providing real-time detection images of the underground space with an accuracy level of 1% to 5% [11,18].
The relationship model between soil water content and dielectric constant (i.e., dielectric permittivity) has been established, e.g., in the Topp, Roth and Herkelrath model [30,31,32]. The GPR method converts the electromagnetic wave velocity into the relative dielectric constant to estimate soil water content; however, the problem is that the depth of the reflection layer is difficult to determine, causing inaccurate calculation results [12,33]. The spectrum analysis method can convert GPR signals from the time-domain to the frequency-domain, and then analyze the amplitude, frequency and energy of the frequency-domain signals [34,35,36]. Thus, many scholars have established the relationship between frequency-domain signals and the physical properties of various engineering geotechnical media [37,38]. However, the collected GPR reflection signals are nonstationary and nonlinear due to the discontinuous, multiphase and variable nature of soil [39,40]. For a long time, limited by our understanding and available computing power, GPR signals were regarded as simple linear and stable signals, and were analyzed by Fourier transform, short-time Fourier transform, Mellin transform, Laplace transform [41,42,43].
In recent years, with the rapid development of digital signal processing technology, wavelet transform has been widely used in image compression, edge detection, speech synthesis, digital watermarking, signal filtering, geophysical prospecting, medical detection, and engineering calculations [44]. The procedure has good time-frequency characteristics, and as such, it opens up a new method for GPR signals analysis and processing. Wavelet analysis technology has been used in a large amount of research on GPR signal threshold denoising, attribute analysis, feature extraction and waveform predictions [45,46,47]. However, when performing wavelet transform on a GPR signal, the question of which wavelet basis is used completely depends on the experience of the relevant personnel [20,48]. Moreover, the selected wavelet bases do not have good similarity with the GPR signals being analyzed, and the inherent properties of the GPR signals cannot be accurately extracted, which hinders the in-depth study of wavelet transform in the analysis and processing of GPR signals [49,50]. Therefore, the question of how to use modern signal processing methods to construct a wavelet basis that matches the characteristics of the GPR signals must be urgently addressed if wavelet transform is to be applied to GPR signal processing.
The aim of this paper was to construct a symmetrical and tightly supported biorthogonal wavelet basis that was highly matched to the GPR waveform. Based upon this, a wavelet packet-based energy analysis (WPEA) method was proposed. The feasibility of the method was verified by setting up soils with different water contents in a model box in order to carry out simulation experiments. Then, the WPEA method was used to evaluate the soil water content in the model experiment. In the laboratory, eight kinds of clay samples with different water contents were used, and the GPR method was applied to carry out four repetitive experiments on the samples. The WPEA method was used to calculate the wavelet packet-based energy indexes (WPEI) of the GPR signals under different soil water contents, and the relationship curves between the WPEI and the soil water content were obtained. The effectiveness of the method proposed in this paper was verified by comparing our results with those obtained using classical wavelet bases for wavelet packet transform.
The rest of this paper is organized as follows. Section 2 describes the construction of a biorthogonal wavelet basis, wavelet packet decomposition, the WPEA method, and the GPR detection principle. The forward simulation experiment verifies the feasibility of using GPR to test the soil water content. Section 3 describes the GPR detection procedure and the data collection process in the case of soils with different water contents in the indoor experiment. The response law of the GPR signals and the WPEI of soils with different water contents were analyzed and obtained, and the effectiveness of the wavelet basis proposed in this paper is verified in Section 4. Finally, conclusions are summarized in Section 5.

2. Methods

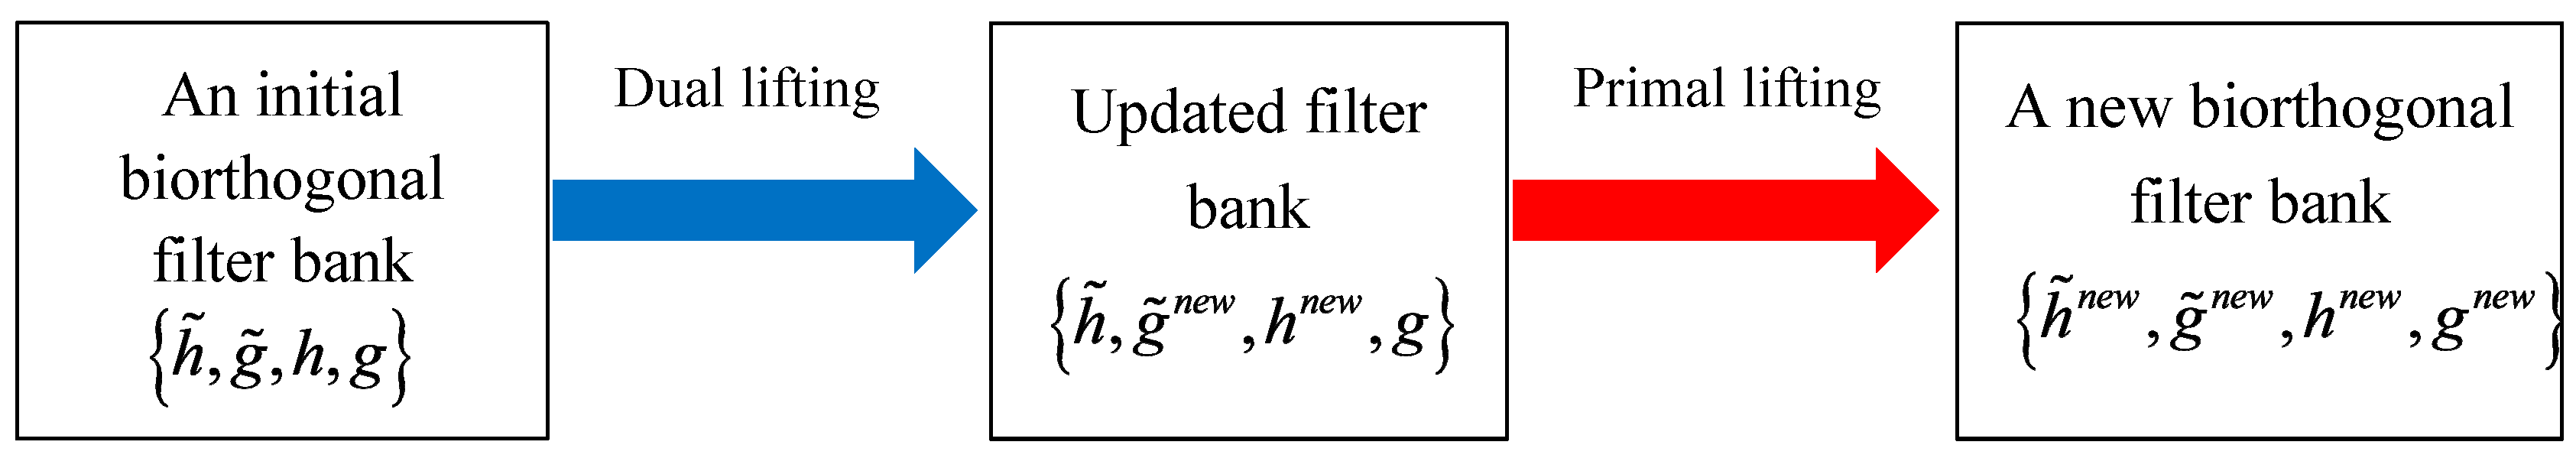
2.1. Construction of Biorthogonal Wavelet Basis

In discrete wavelet or stationary wavelet transform, the Mallat algorithm is mainly used in wavelet analysis. Usually, the signal is decomposed and reconstructed by a bank composed of four filters {   h ˜ , g ˜ , h , g } , and the signal is divided into low-frequency approximation and high-frequency detail information. The filters g ˜ and   h ˜ respectively represent the dual wavelet filter and dual scale filter at the decomposition end, also known as the decomposition high pass filter and decomposition low pass filter. Filters g and h denote the wavelet filter and scale filter at the reconstruction end, also known as the reconstruction high pass filter and the reconstruction low pass filter. Suppose the vanishing moments of the filter bank at the decomposition and reconstruction ends are N ˜ and N , the wavelet filter function has the following relationship based on the definition of vanishing moments [50,51]:
g ( z ) = ( z 1 ) N q ( z ) g ˜ ( z ) = ( z 1 ) N ˜ q ˜ ( z )
where z = e i ω , i stands for complex number, ω is the circular frequency of the relative discrete system and discrete signal (rad), q ( z ) and q ˜ ( z ) are both Laurent polynomials about z, and there exist q ( z ) | z = 1 0 , q ˜ ( z ) | z = 1 0 .
First, the initial filter bank { h ˜ , g ˜ , h , g } is used to dually boost the scale filter h and the dual wavelet filter g ˜ . After dual boosting, a new filter bank { h ˜ , g ˜ n e w , h n e w , g } can be generated. Then using this filter bank { h ˜ , g ˜ n e w , h n e w , g } is to improve the wavelet filter g and dual scale filter h ˜ to form a new filter bank { h ˜ n e w , g ˜ n e w , h n e w , g n e w } . The flow chart of the construction of the biorthogonal wavelet basis suitable for GPR signals waveform was shown in Figure 1.
Assuming that the lifting goal is to increase the vanishing moment of the wavelet filter g from N to N , then the lifting process can be regarded as designing a suitable lifting operator s ( z ) so that the wavelet filter g n e w after being lifted can be divisible by (z−1)N [52,53]
( z 1 ) N q ( z ) + h ( z ) s ( z 2 ) ( z 1 ) N = Q ( z )
where Q ( z ) is the Laurent polynomial about z.
Since h ( 1 ) 0 in Equation (2), there must be a factor ( z 1 ) N in the lifting operator s ( z ) . Therefore, the lifting operator s ( z ) can be defined as [52]
s ( z ) = ( z 1 ) N U ( z )
where U ( z ) is Laurent polynomial to be solved.
Substituting Equation (3) into Equation (2) gives:
Q ( z ) = 1 ( z 1 ) Δ N [ q ( z ) + h ( z ) ( z + 1 ) N U ( z 2 ) ]
where Δ N = N N , N is the vanishing moment of the wavelet filter after primal lifting, N is the vanishing moment of the initial wavelet filter.
Given
P ( z ) = q ( z ) + h ( z ) ( z + 1 ) N U ( z 2 )
where P ( z ) is the Laurent polynomial about z.
According to the lifting target requirement of vanishing moment of the new wavelet function, the Equation (5) satisfies the following relational expression [52,54]:
d n P ( z ) d z n | z = 1 = 0 , n = 0 , 1 , , Δ N 1
The expressions of Haar wavelet filters at the decomposition and reconstruction end are   h ˜ ( z ) = 1 2 ( 1 + z 1 ) and h ( z ) = 1 2 ( 1 + z 1 ) , and the expressions of wavelet filters at the decomposition and reconstruction end are   g ˜ ( z ) = 1 2 ( z - 1 ) z 1 and g ( z ) = 1 2 ( z - 1 ) z 1 . Assume that the vanishing moments of the wavelet filter function after lifting are 3 at the decomposition and reconstruction ends, and the initial filter is a Haar wavelet filter bank with 1st-order vanishing moments. By performing dual lifting and original lifting operations on the initial filter { h ˜ , g ˜ , h , g } , combined with the particle swarm algorithm for optimization search, the scale filter and dual scale filter coefficients of the new biorthogonal wavelet filter bank are finally obtained, namely
{ h ˜ 1 = { 3 512 , 3 512 , 17 256 , 7 256 , 77 512 , 83 512 , 59 128 , 59 128 , 83 512 , 77 512 , 7 256 , 17 256 , 3 512 , 3 512 } h 1 = { 1 16 , 1 16 , 1 2 , 1 2 , 1 16 , 1 16 }
At the same time, the coefficients of the wavelet filter and the dual wavelet filter are as follows:
{   g ˜ 1 = { 1 16 , 1 16 , 1 2 , 1 2 , 1 16 , 1 16 } g 1 = { 3 512 , 3 512 , 17 256 , 7 256 , 77 512 , 83 512 , 59 128 , 59 128 , 83 512 , 77 512 , 7 256 , 17 256 , 3 512 , 3 512 }
After calculating the scale filter coefficients ( h ˜ 1 and h 1 ) at the decomposition end and reconstruction end, the scale function ( φ ˜ n e w and φ n e w ) and wavelet function ( ψ ˜ n e w and ψ n e w ) forms corresponding to this wavelet can be obtained through an iterative algorithm based on the two-scale equation (see Formula (9)).
{ φ ( x ) = 2 k = + h φ ( 2 x k ) ψ ( x ) = 2 k = + g φ ( 2 x k ) φ ˜ ( x ) = 2 k = + h ˜ φ ˜ ( 2 x k ) ψ ˜ ( x ) = 2 k = + g ˜ φ ˜ ( 2 x k )
The function results { φ ˜ n e w , ψ ˜ n e w , φ n e w , ψ n e w } corresponding to the biorthogonal wavelet basis can be acquired by adding the scale filter coefficients ( h ˜ 1 and h 1 ) into the MATLAB wavelet toolbox.

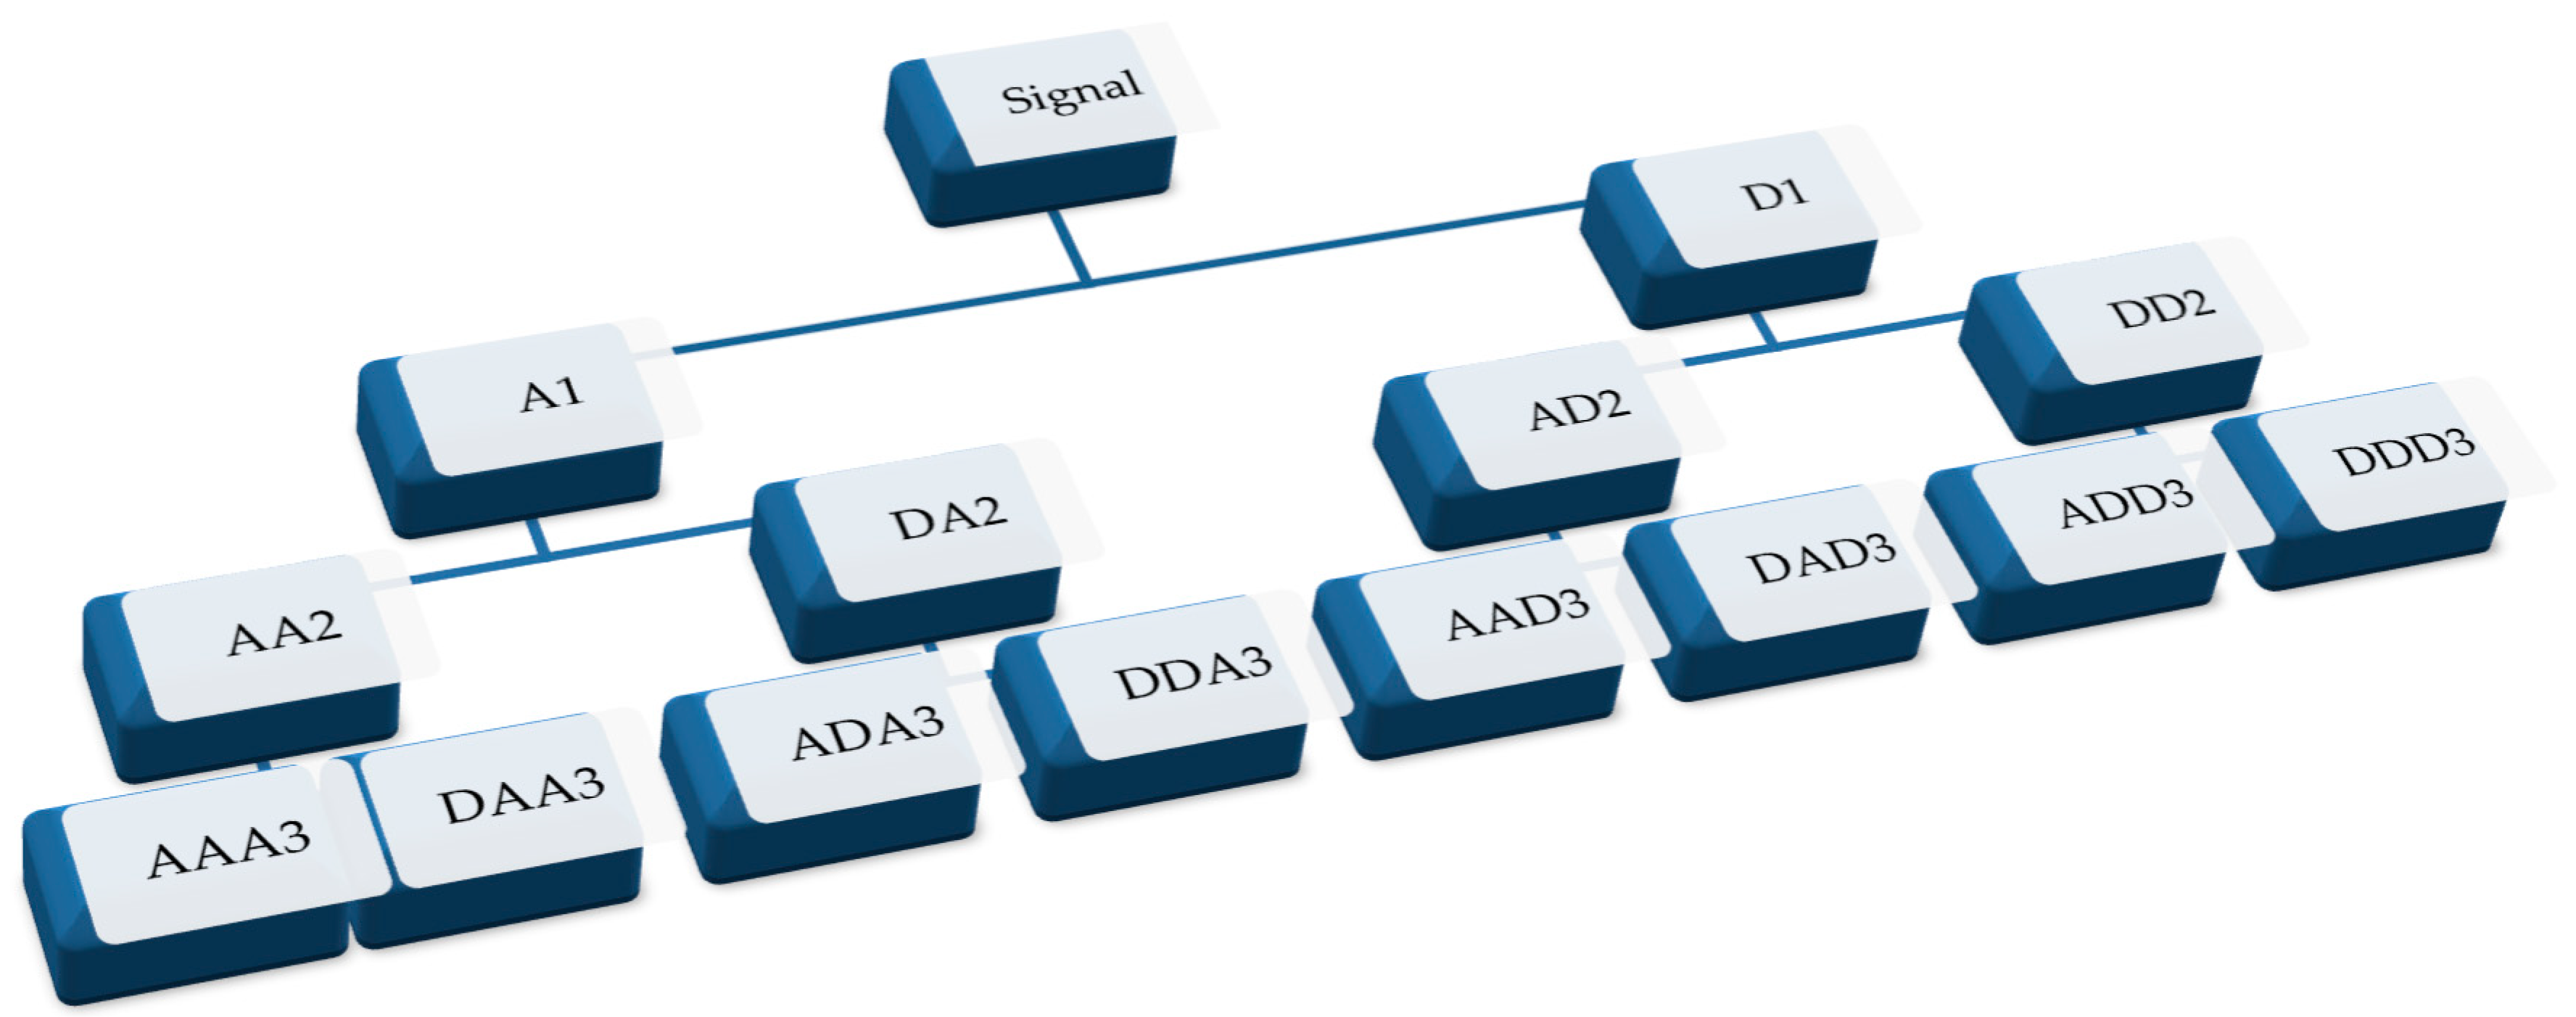
2.2. Decomposition of Wavelet Packet Transform

Recently, various signal processing methods have been widely used for GPR signal analysis and processing. Fourier transform, fractal analysis, wavelet/wavelet packet transform and Hilbert-Huang transform are the most popular methods [49,55,56,57]. In these methods, wavelet packet analysis can not only decompose the low-frequency part of the GPR signal, but can also further decompose the high-frequency part that is not refined by the wavelet analysis [58]. In addition, wavelet packet analysis can perform adaptive frequency band decomposition according to the inherent frequency characteristics of the GPR signal, which greatly improves the time-frequency resolution. Therefore, wavelet packet analysis has broad range of application prospects. In the decomposition process of the wavelet packet, the original GPR signals can be decomposed into several frequency band subsignals in a relatively short time window, and each subsignal includes an approximate part (“A”, i.e., the low-frequency subsignal) and a detailed part (“D”, i.e., the high-frequency subsignal). Figure 2 shows the decomposition process of a three-level wavelet packet for GPR signals. Component A1 is the low frequency of the first layer, and component D1 is the high-frequency of the first layer. Component AA2 is the low-frequency of the low-frequency part of the second-layer, and component DA2 is the high-frequency of the low-frequency part of the second-layer; component AD2 is the low-frequency of the high-frequency part of the second-layer, and component DD2 is the high-frequency of the high-frequency part of the second-layer. The other components can be deduced according to this logic.
If the original GPR single-channel signal X ( t ) is decomposed, a total of 2 i wavelet packet decomposition coefficients of the i -th layer are obtained, and the mathematical expression is given by [59,60]:
X ( t ) = X i , 1 ( t ) + X i , 2 ( t ) + + X i , j ( t ) + X i , 2 i 1 ( t ) + X i , 2 i ( t )
where j = 1 , 2 , , 2 i 1 , 2 i .

2.3. The WPEA Method

The GPR single-channel signal is subjected to wavelet packet transform. According to the sampling theorem, if the sampling frequency of the GPR single-channel signal is f s , where f is the abbreviation of frequency, and s is the abbreviation of sampling, then the Nyquist frequency (i.e., minimum sampling frequency) of the signal is f s / 2 [61,62]. The GPR single-channel signal is decomposed to the i -th layer, and the corresponding lowest frequency band is 0~ f s / 2 i + 1 . Assuming that the energy corresponding to the reconstructed subsignal X i , j ( t ) in each frequency band is E i , j ( t ) , the following formula may be applied [63]
E i , j ( t ) = | X i , j ( t ) | 2 d t = k = 1 m | x j , k ( t ) | 2
where x j , k ( t ) ( k = 1 , 2 , , m ) ( m is the number of sampling points) represents the discrete point amplitude of the reconstructed subsignal.
Assuming that the total energy of a GPR single-channel signal is E t o t a l ( t ) , the following relationship exists:
E t o t a l ( t ) = j = 0 2 i 1 E i , j ( t )
The energy can reflect the propagation law of the GPR signals, but can also reflect the inherent properties of the medium [64,65]. In this study, the WPEA method was adapted to calculate the WPEI of the GPR single-channel signals under different soil water contents.

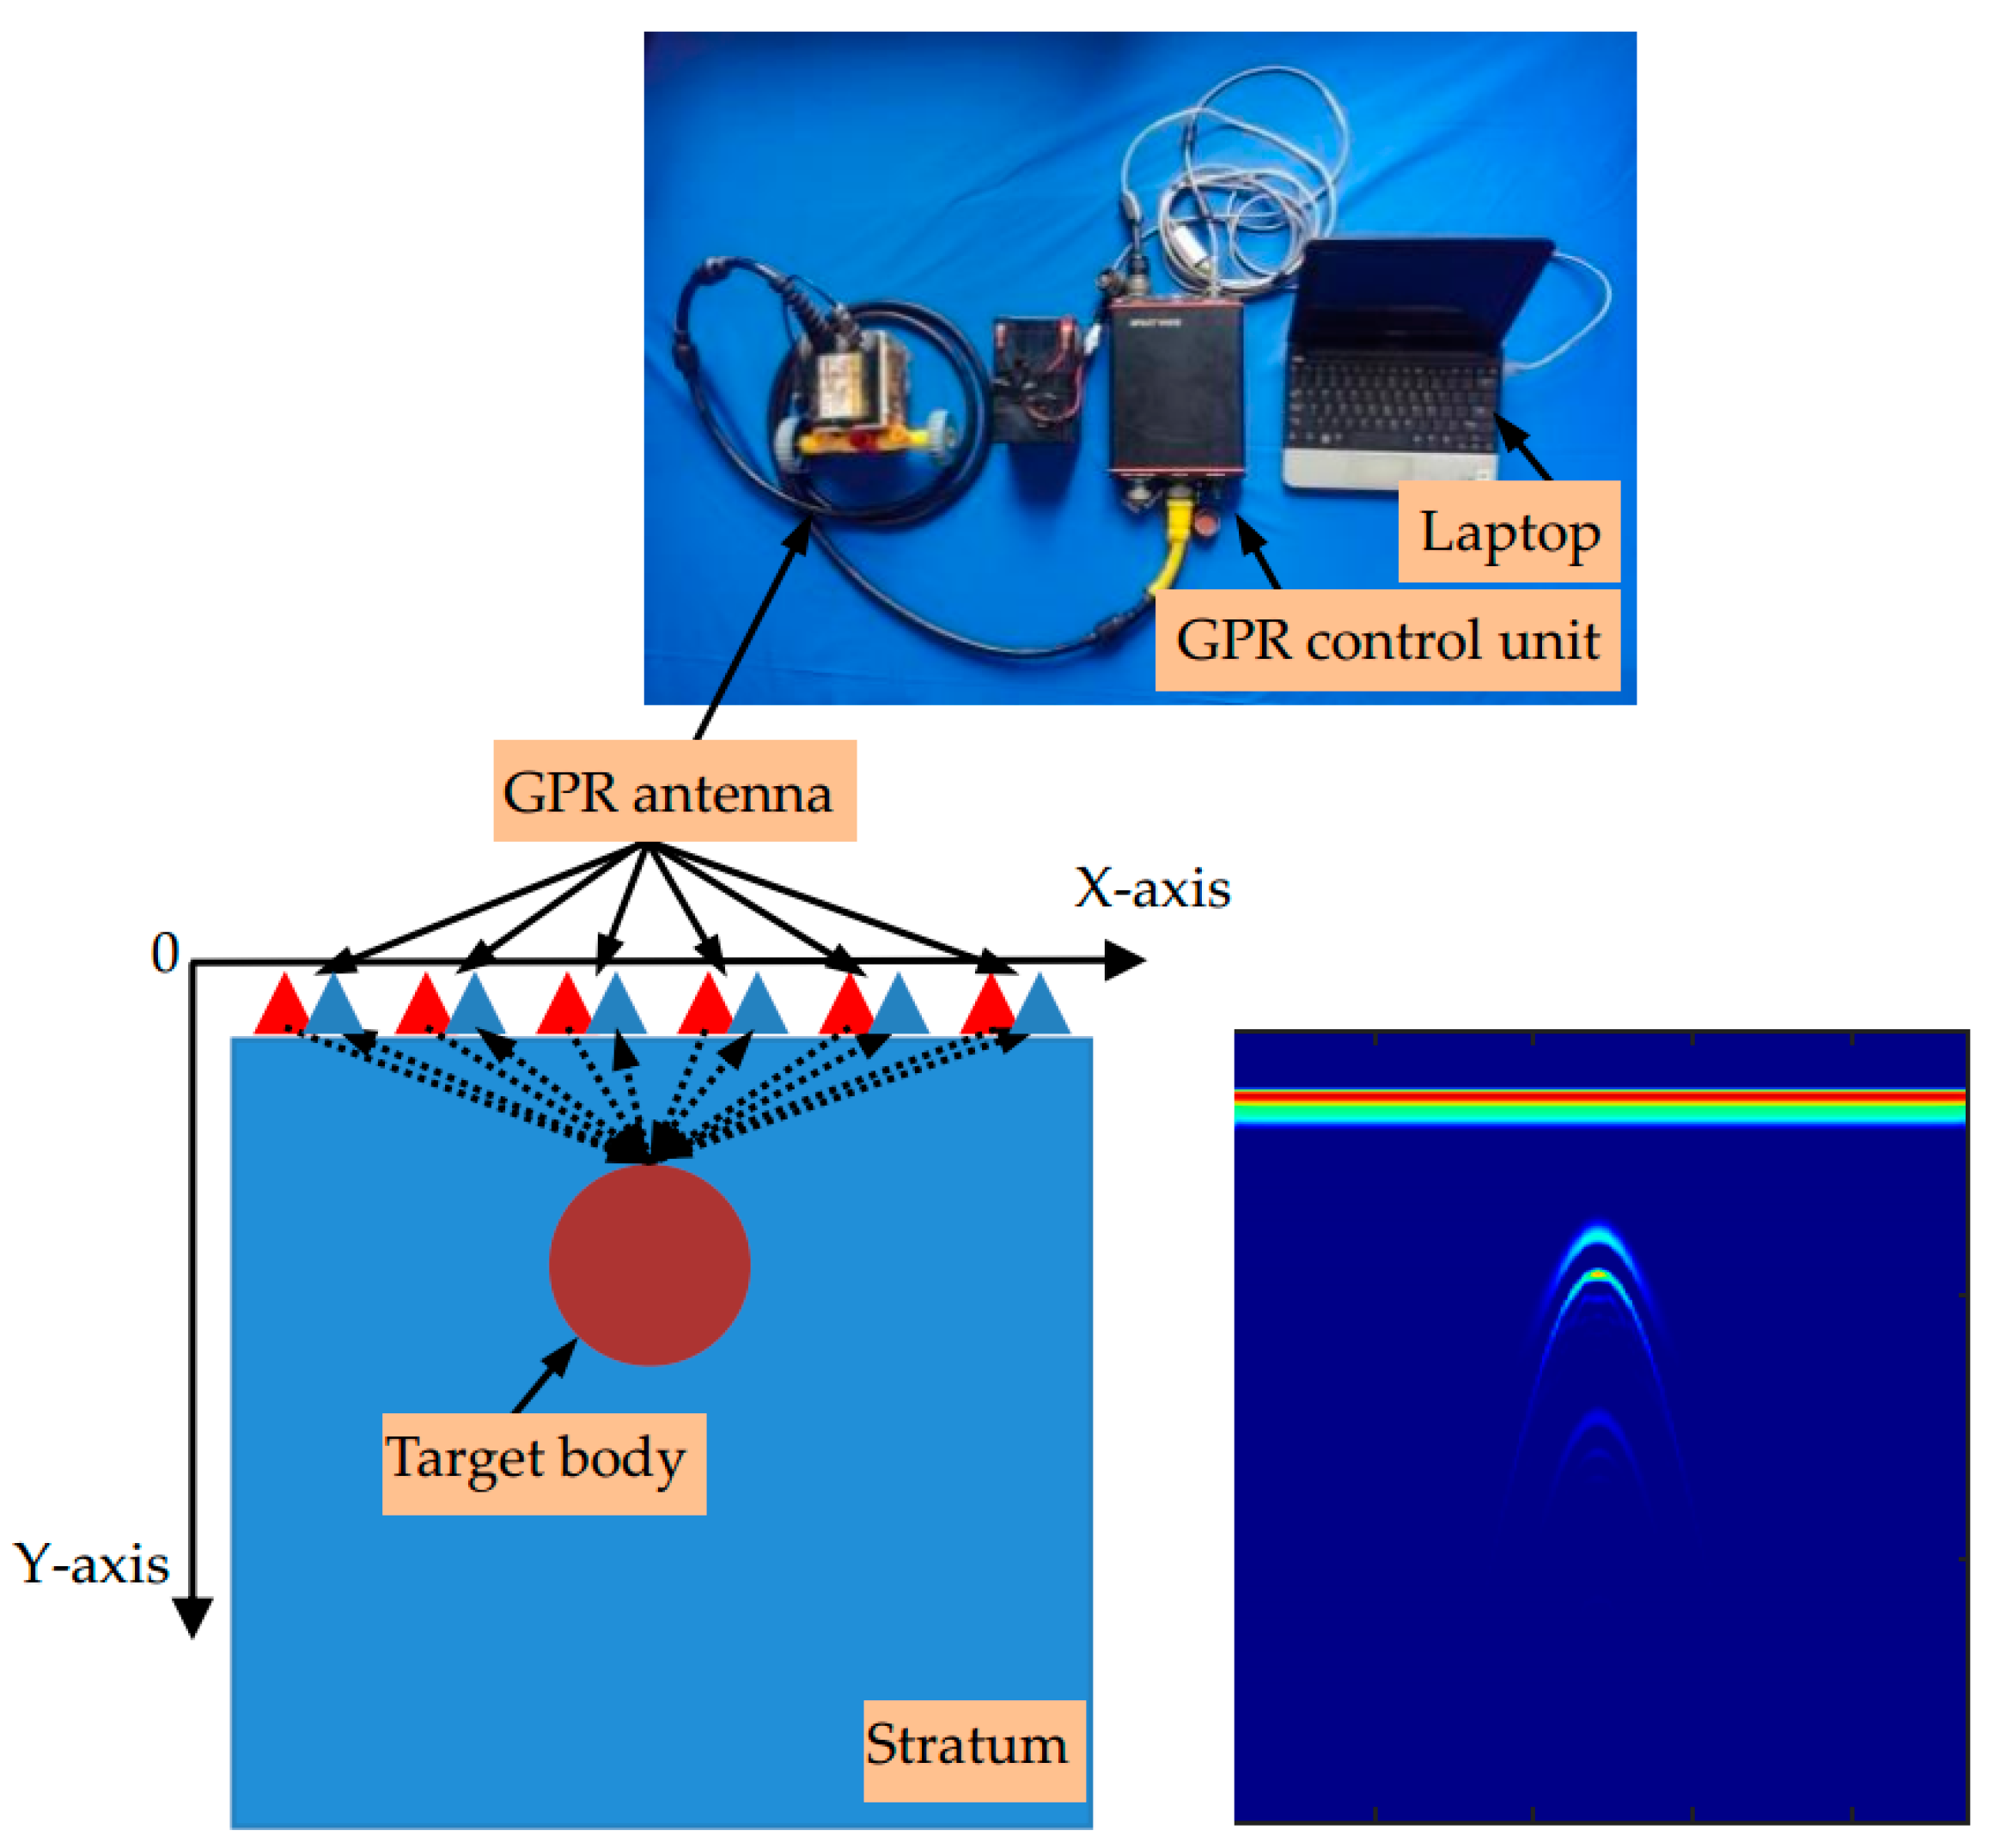
2.4. GPR Methodology

2.4.1. Detection Principle

The GPR is a geophysical detection method that uses media with different dielectric constants to produce different responses to electromagnetic wave reflection signals in order to determine the characteristics of underground media. It primarily includes a control unit, a transmitter and a receiver. The control unit provides instructions to the transmitter, which, in turn, emits high-frequency electromagnetic waves to the underground medium. During the propagation of electromagnetic waves into underground media, due to the difference in the relative dielectric constant of different media, some of the electromagnetic waves are reflected when they encounter the interface. The reflected waves follow the law of reflection, and are received by the antenna. The other part of the electromagnetic wave will pass through the interface and propagate to the deep part of the ground, where it is absorbed by the underground medium. As the GPR antenna moves, the control unit records the electromagnetic wave reflection signals at each sampling point. By analyzing the characteristics of the amplitude, phase, and frequency of the reflected signal, the stratum distribution and properties of the underground medium can be determined. A schematic diagram of GPR detection imaging is presented in Figure 3.

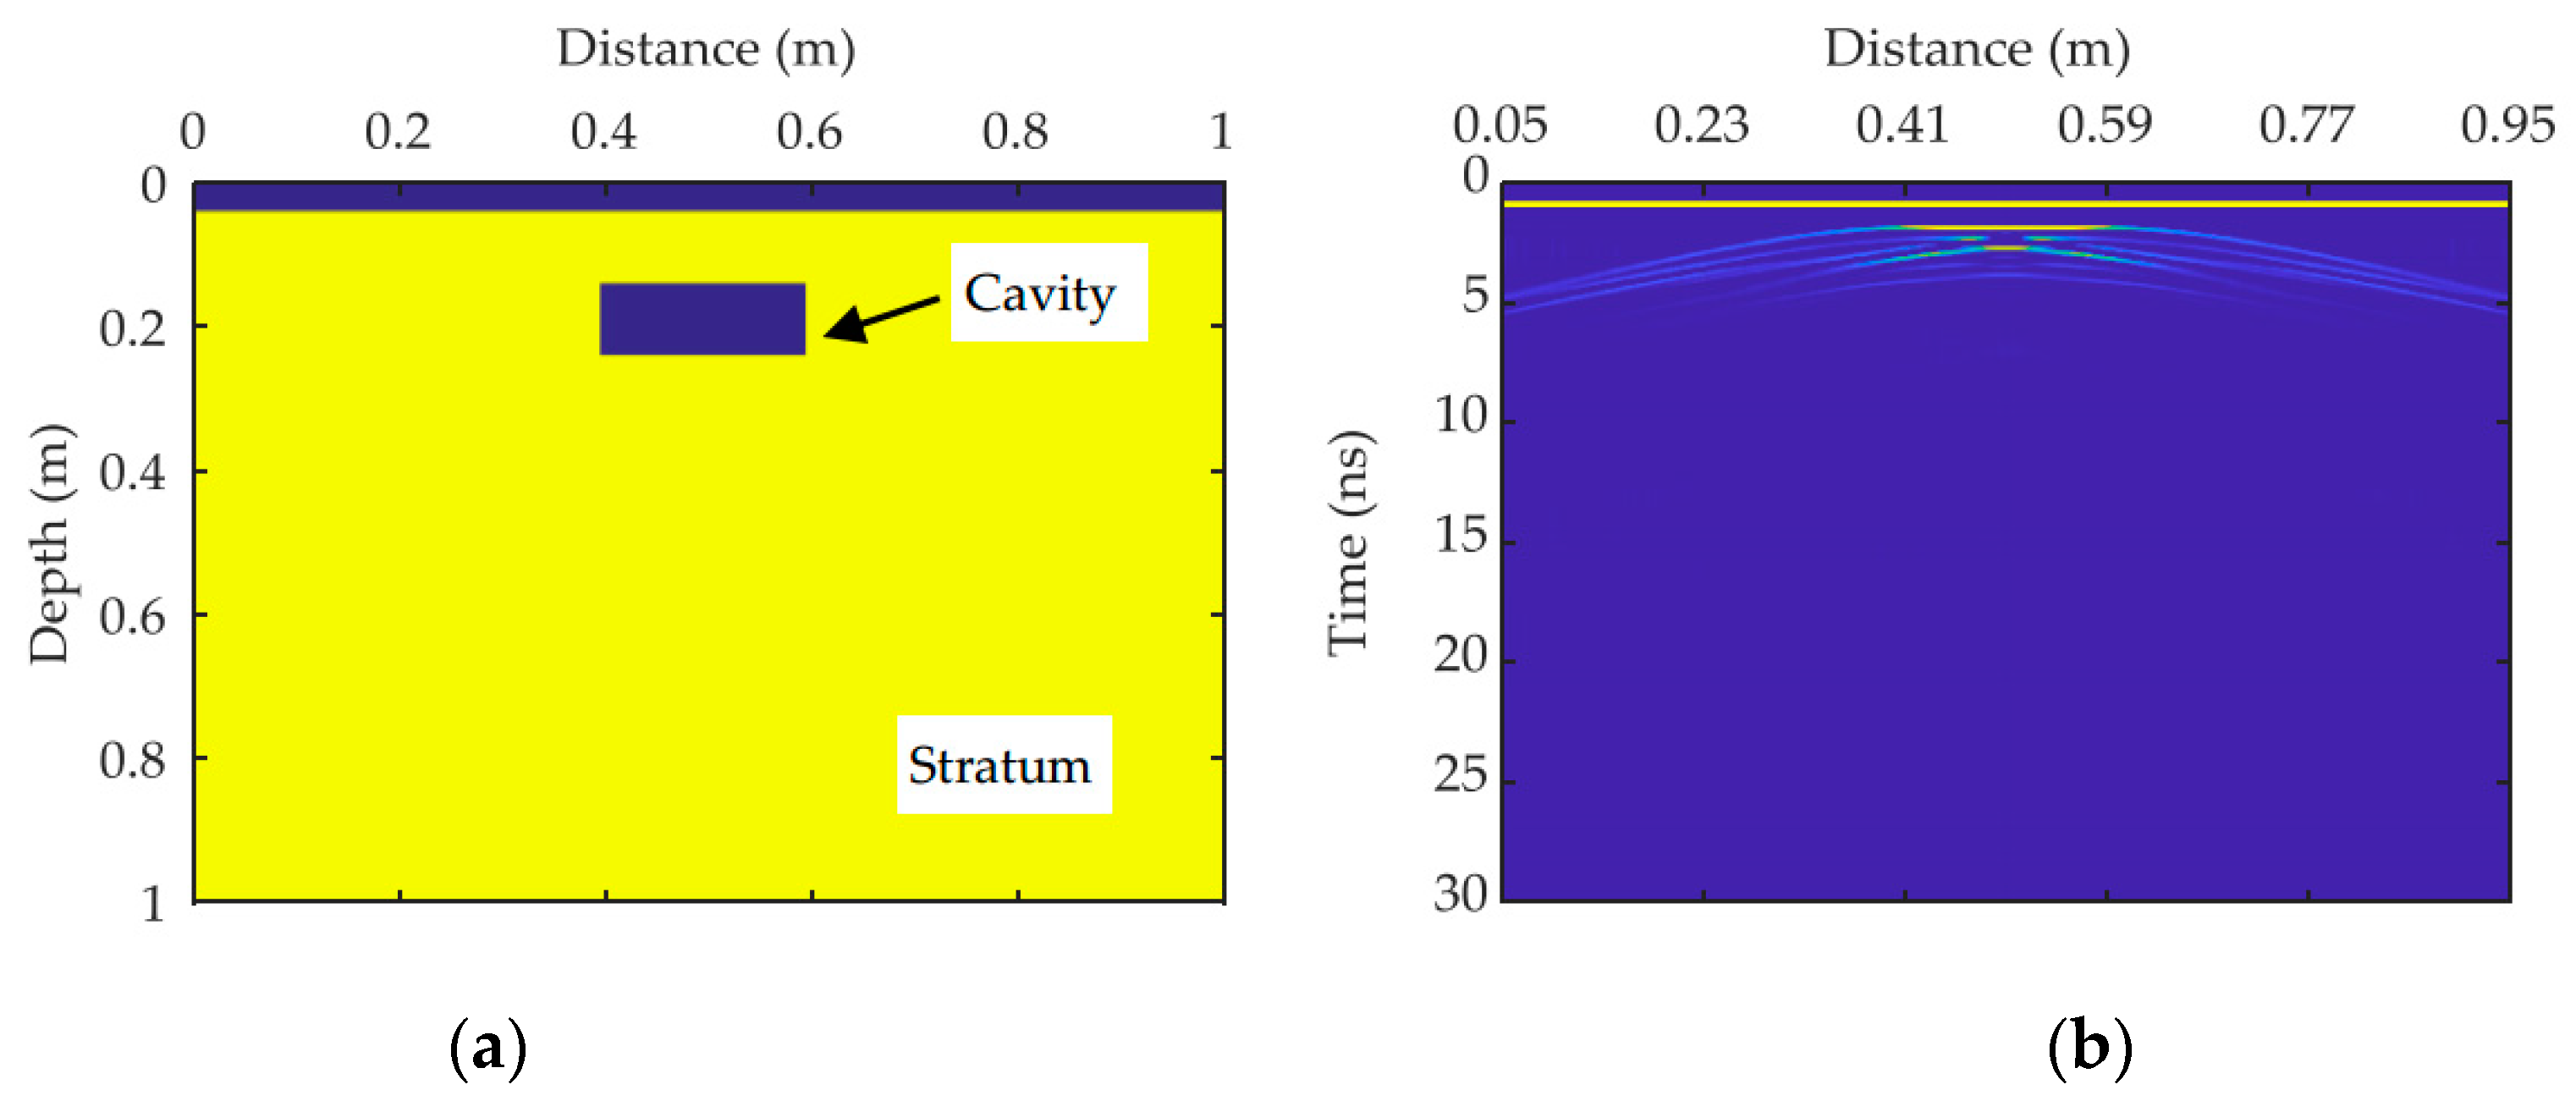
2.4.2. Forward Simulation

The finite-difference time-domain method can be used to realize the forward simulation process of GPR [66,67]. Assuming that the stratum is a uniform and continuous medium in a semi-infinite space, the reflection and refraction of electromagnetic waves used for forward simulation occur on a two-dimensional plane. To study the reflection law of electromagnetic waves in the stratum with different water contents, the stratum model shown in Figure 4a was designed. The simulation area of the GPR was a 1 m × 1 m square area; the upper left corner is the origin of the coordinates, the abscissa is the detection distance, and the ordinate is the detection depth. The detection target was a rectangular cavity with a length of 20 cm, a height of 10 cm, and a buried depth of 10 cm. Since dry sand could be reused, it was convenient to bury various model boxes. The background medium of the stratum was dry sand, the relative dielectric constant was 3, and the relative dielectric constant of air was set at 1.
GprMax is open source software that uses the finite-difference time-domain method to simulate electromagnetic wave propagation; as such, it can be used for GPR forward simulations [66,67]. The central-frequency of the antenna was 1600 MHz in the forward simulation of the GPR. The boundary absorption condition was a perfectly matched layer, and the excitation source employed was the Ricker wavelet. The spatial grid step size and the sampling step size were both 2.5 mm. The number of sampling channels was 365 and the sampling time was 30 ns. The GPR forward simulation software was adapted to perform forward simulations on the cavity model shown in Figure 4a. The obtained results are shown in Figure 4b.
The influence of the change of soil water content on the electromagnetic wave propagation characteristics is mainly reflected in differences in the relative dielectric constant and the electrical conductivity of soil. To study the effect of varying these parameters in different soils on the electromagnetic wave reflection signal, the cavity, as shown in Figure 4a, was filled with soils with different water contents.
According to the formulas of Topp and Liu, the relative dielectric constant and electrical conductivity of soil with different water contents were calculated [68,69]. The two parameters were selected as variables to distinguish different media in the forward simulation of GPR. The relationships between the relative dielectric constant, electrical conductivity and water content of the medium are as follows [68,69]:
ε = 3.03 + 9.3 w + 146.0 w 2 76.7 w 3
σ = 0.664 ε 3 3.6764 ε 2 + 25.051 ε 41.506
v = 0.3 ε
where w is soil water content (%), ε is relative dielectric constant, σ is electrical conductivity (S/cm), and v is electromagnetic wave velocity (m/ns).
Table 1 presents the physical properties of soil with increasing moisture content. The GPR forward simulation software was used to perform forward simulations on soil models with different water contents. Based upon 5087 iterative calculations, the results of the GPR forward simulation of soils with different water contents are shown in Figure 5.
The radagram presented in Figure 5 indicates that the greater the difference in the physical properties between dry sand and cavity-filled soil, the stronger the reflection of electromagnetic waves at the interface of dry sand and cavity-filled soil. From the GPR time profile shown in Figure 5a–h, the middle single-channel signals were extracted. The WPEA method proposed in Section 2.3 was employed to calculate the four single-channel signals, and the WPEI of the GPR signals in the case of soils with different water contents were obtained. The results are presented in Figure 6.
It can be seen from Figure 6 that when the differences in physical properties, i.e., relative dielectric constant and electrical conductivity between the cavity-filled soil and the dry sand, are small, the electromagnetic wave reflects weakly at the interface of the two media, the signal amplitude and energy are low, and the WPEI is small. As the water content increases, the differences in the physical properties between the soil and the dry sand increase; additionally, the amplitude and energy of the GPR reflected signal gradually increase, as does the WPEI of the obtained GPR signals. When the soil water content exceeds 18%, the GPR reflection at the interface between the soil and the dry sand is strong, and the WPEI of the obtained GPR signals is large, but the range of increase is small.
To determine the influence of the relative dielectric constant and electrical conductivity of the soil on the WPEI of the GPR signals, the following two working conditions were established. In the first case, when the soil water content was 18%, the corresponding electrical conductivity was 368.670 μS/cm; this value remained unchanged. When the soil water content changed from 10% to 24%, the corresponding relative dielectric constants were 5.343, 6.115, 6.983, 7.941, 8.987, 10.116, 11.325, 12.611, respectively. In the second case, when the soil water content was 18%, the corresponding relative dielectric constant was 8.897; this value also remained unchanged. When the soil water content changed from 10% to 24%, the corresponding electrical conductivities were 88.681 μS/cm, 126.085 μS/cm, 180.261 μS/cm, 258.134 μS/cm, 368.670 μS/cm, 523.129 μS/cm, 735.272 μS/cm, 1021.533 μS/cm, respectively.
A GPR forward simulation was performed on the geoelectric models in the two cases, and then the GPR single-channel signals were analyzed by the WPEA method. The analysis results are shown in Figure 7.
Figure 7a shows that when the electrical conductivity of the soil remained unchanged, the WPEI of the GPR signals continued to increase as the relative dielectric constant of the soil increased. Figure 7b illustrates that when the relative dielectric constant of the soil was constant, as the electrical conductivity of the soil increased, the WPEI of the GPR signals decreased.

3. Experimental Investigation

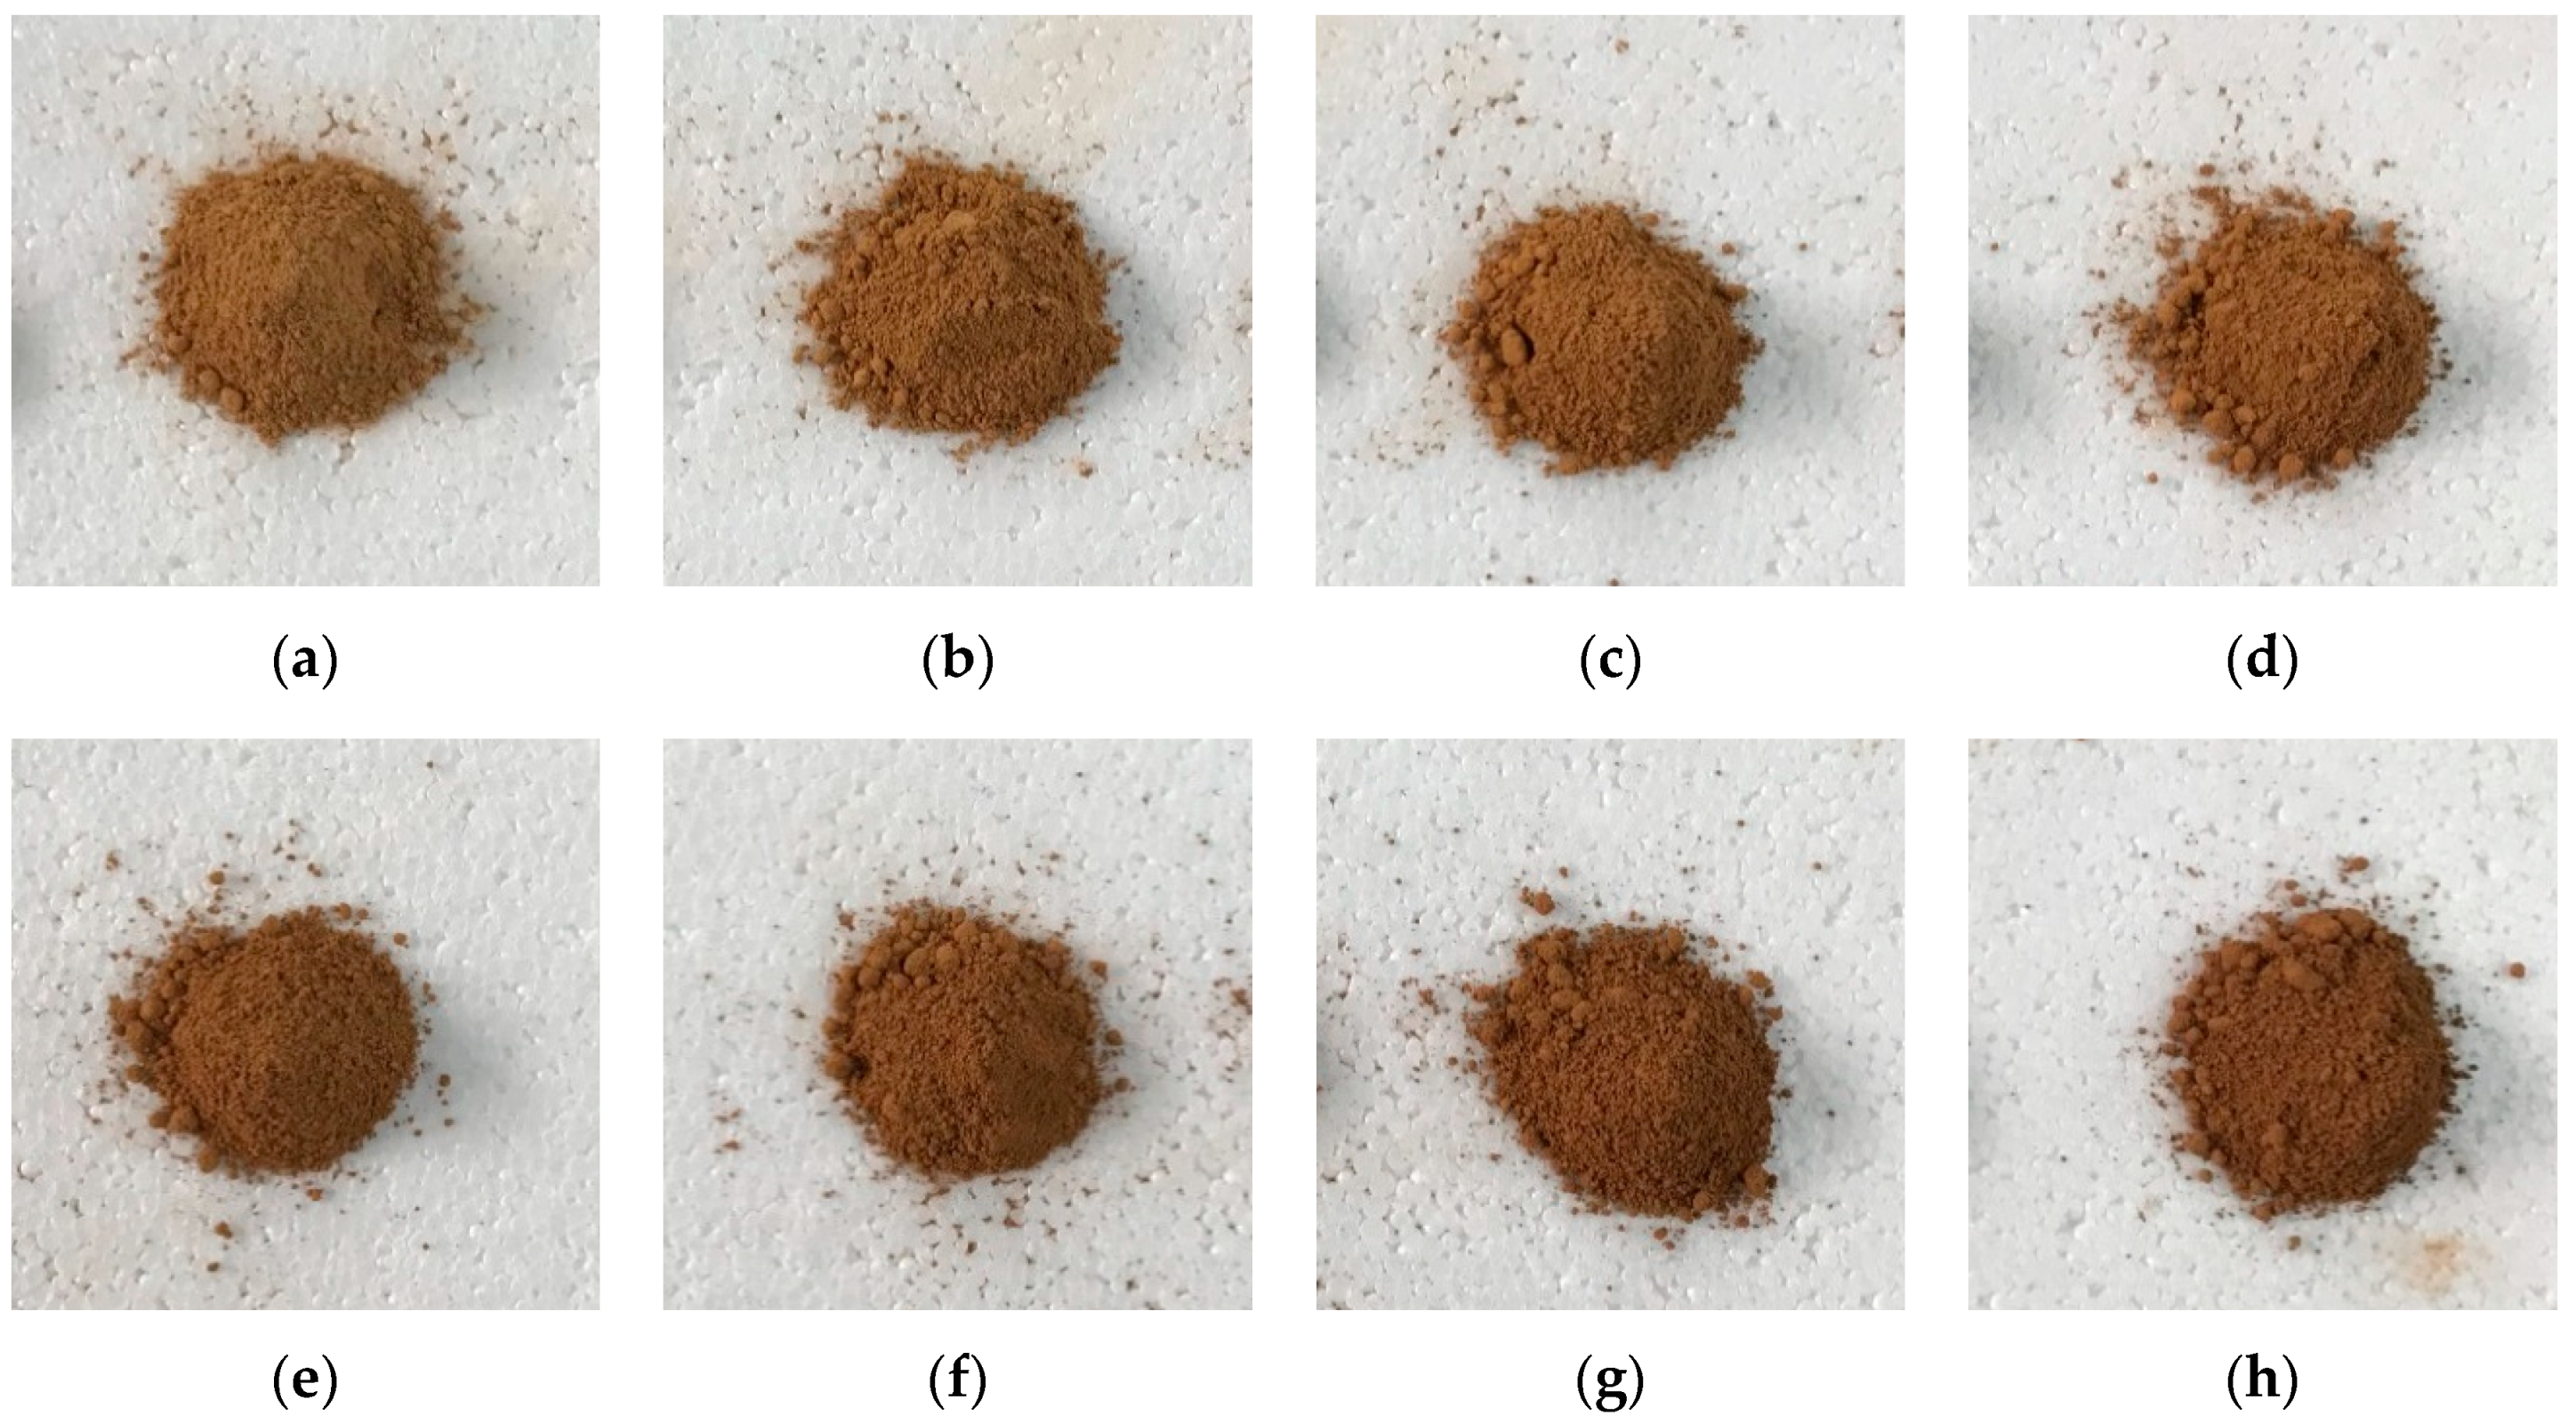
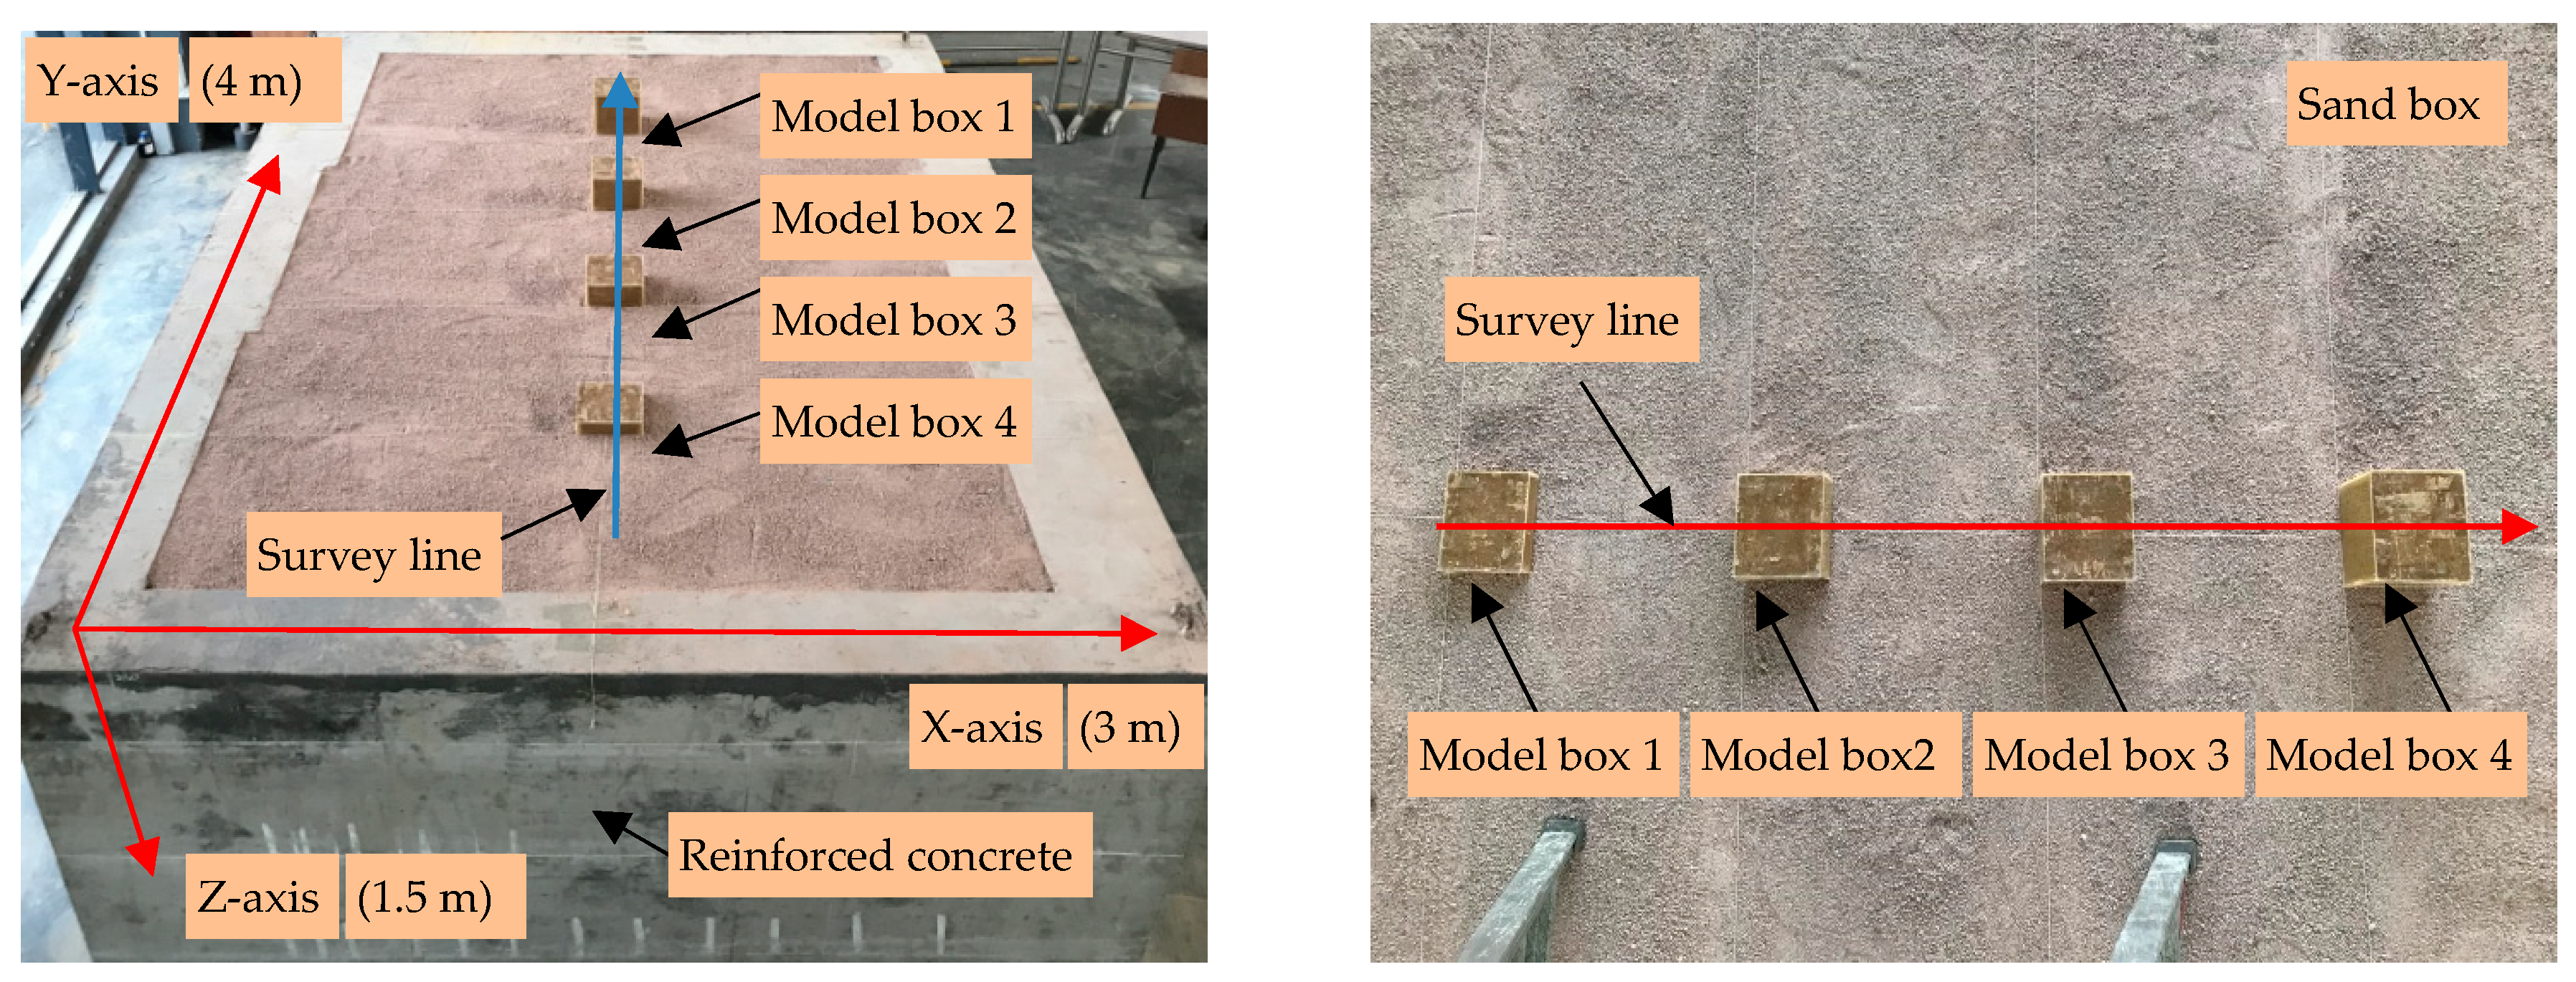
3.1. Experimental Setup

To ensure the reliability of this GPR test, four model boxes were set up. The heights of the model boxes were set to 5 cm, 10 cm, 15 cm and 20 cm, and the length and width were each 20 cm. In this experiment, the clay water content was set to 10%, 12%, 14%, 16%, 18%, 20%, 22%, and 24%. Using to the clay with different water contents, a total of eight GPR detection experiments were carried out. In the same test, the clay with the same water content was poured into four model boxes for the experiment at the same time. Figure 8 shows clay samples with different water contents. Among them, Figure 8a is clay with 10% water content, Figure 8b with 12% water content, Figure 8c with 14% water content, Figure 8d with 16% water content, Figure 8e with 18% water content, Figure 8f with 20% water content, Figure 8g with 22% water content, and Figure 8h with 24% water content.
To facilitate molding, the sand box was made of reinforced concrete with a length, width and height of 4 m, 3 m and 1.5 m respectively. The horizontal direction of the box was set as the x-axis, the vertical inward was the y-axis, and the vertical downward was the z-axis. The four model boxes were buried in order from low to high every 0.6 m along the y-axis, and the embedding depth was 10 cm. The specific layout of the four model boxes is shown in Figure 9.

3.2. GPR Data Collection

The detection depth of GPR is related to the antenna frequency. When the antenna frequency of GPR is higher, the attenuation speed of the electromagnetic wave in the formation process is faster, the resolution is higher, and the detection depth is lower. The heights of the model boxes in the sand box was 5 cm, 10 cm, 15 cm and 20 cm, and the buried depth was 10 cm. In this experiment, a ground probing radar system produced by Ingegneria Dei Sistemi, Italy, was used, and a 1600 MHz central-frequency shielded antenna was used to collect GPR signals from the model boxes. The clay sample shown in Figure 8a was filled with the four model boxes and then buried in the sand box. Since the model boxes were buried in specific positions, the GPR signals were collected at least 0.5 m from the sand box boundary during the GPR detection process to reduce interference from the boundary environment. During the sampling process, the GPR antenna passed above the model boxes, collecting one signal per 1 cm and a total of 300 single-channel signals. A total of 457 data points were collected for each single-channel signal within the 18 ns of the sampling time window. The GPR imaging results of the clay in the four model boxes are shown in Figure 10, where the positions of the four red boxes represented the reflections of the four model boxes in the GPR image.
In Figure 10, the horizontal direction is the true detection distance in meters, and the vertical direction is the two-way travel time in nanoseconds. Figure 10 shows that the direct wave signals have a large amplitude and high energy compared to the electromagnetic wave reflection signals; these characteristics seriously interfere with the reflection signals of the model boxes and reduce the quality and resolution of GPR images. In addition, more hyperbolic reflections and diffractions appeared in the GPR images as the clay moisture content in the model boxes increased, that is, the greater the contrast of the relative dielectric constant between the clay and the dry sand, the more local diffraction in the GPR images was observed.

4. Results

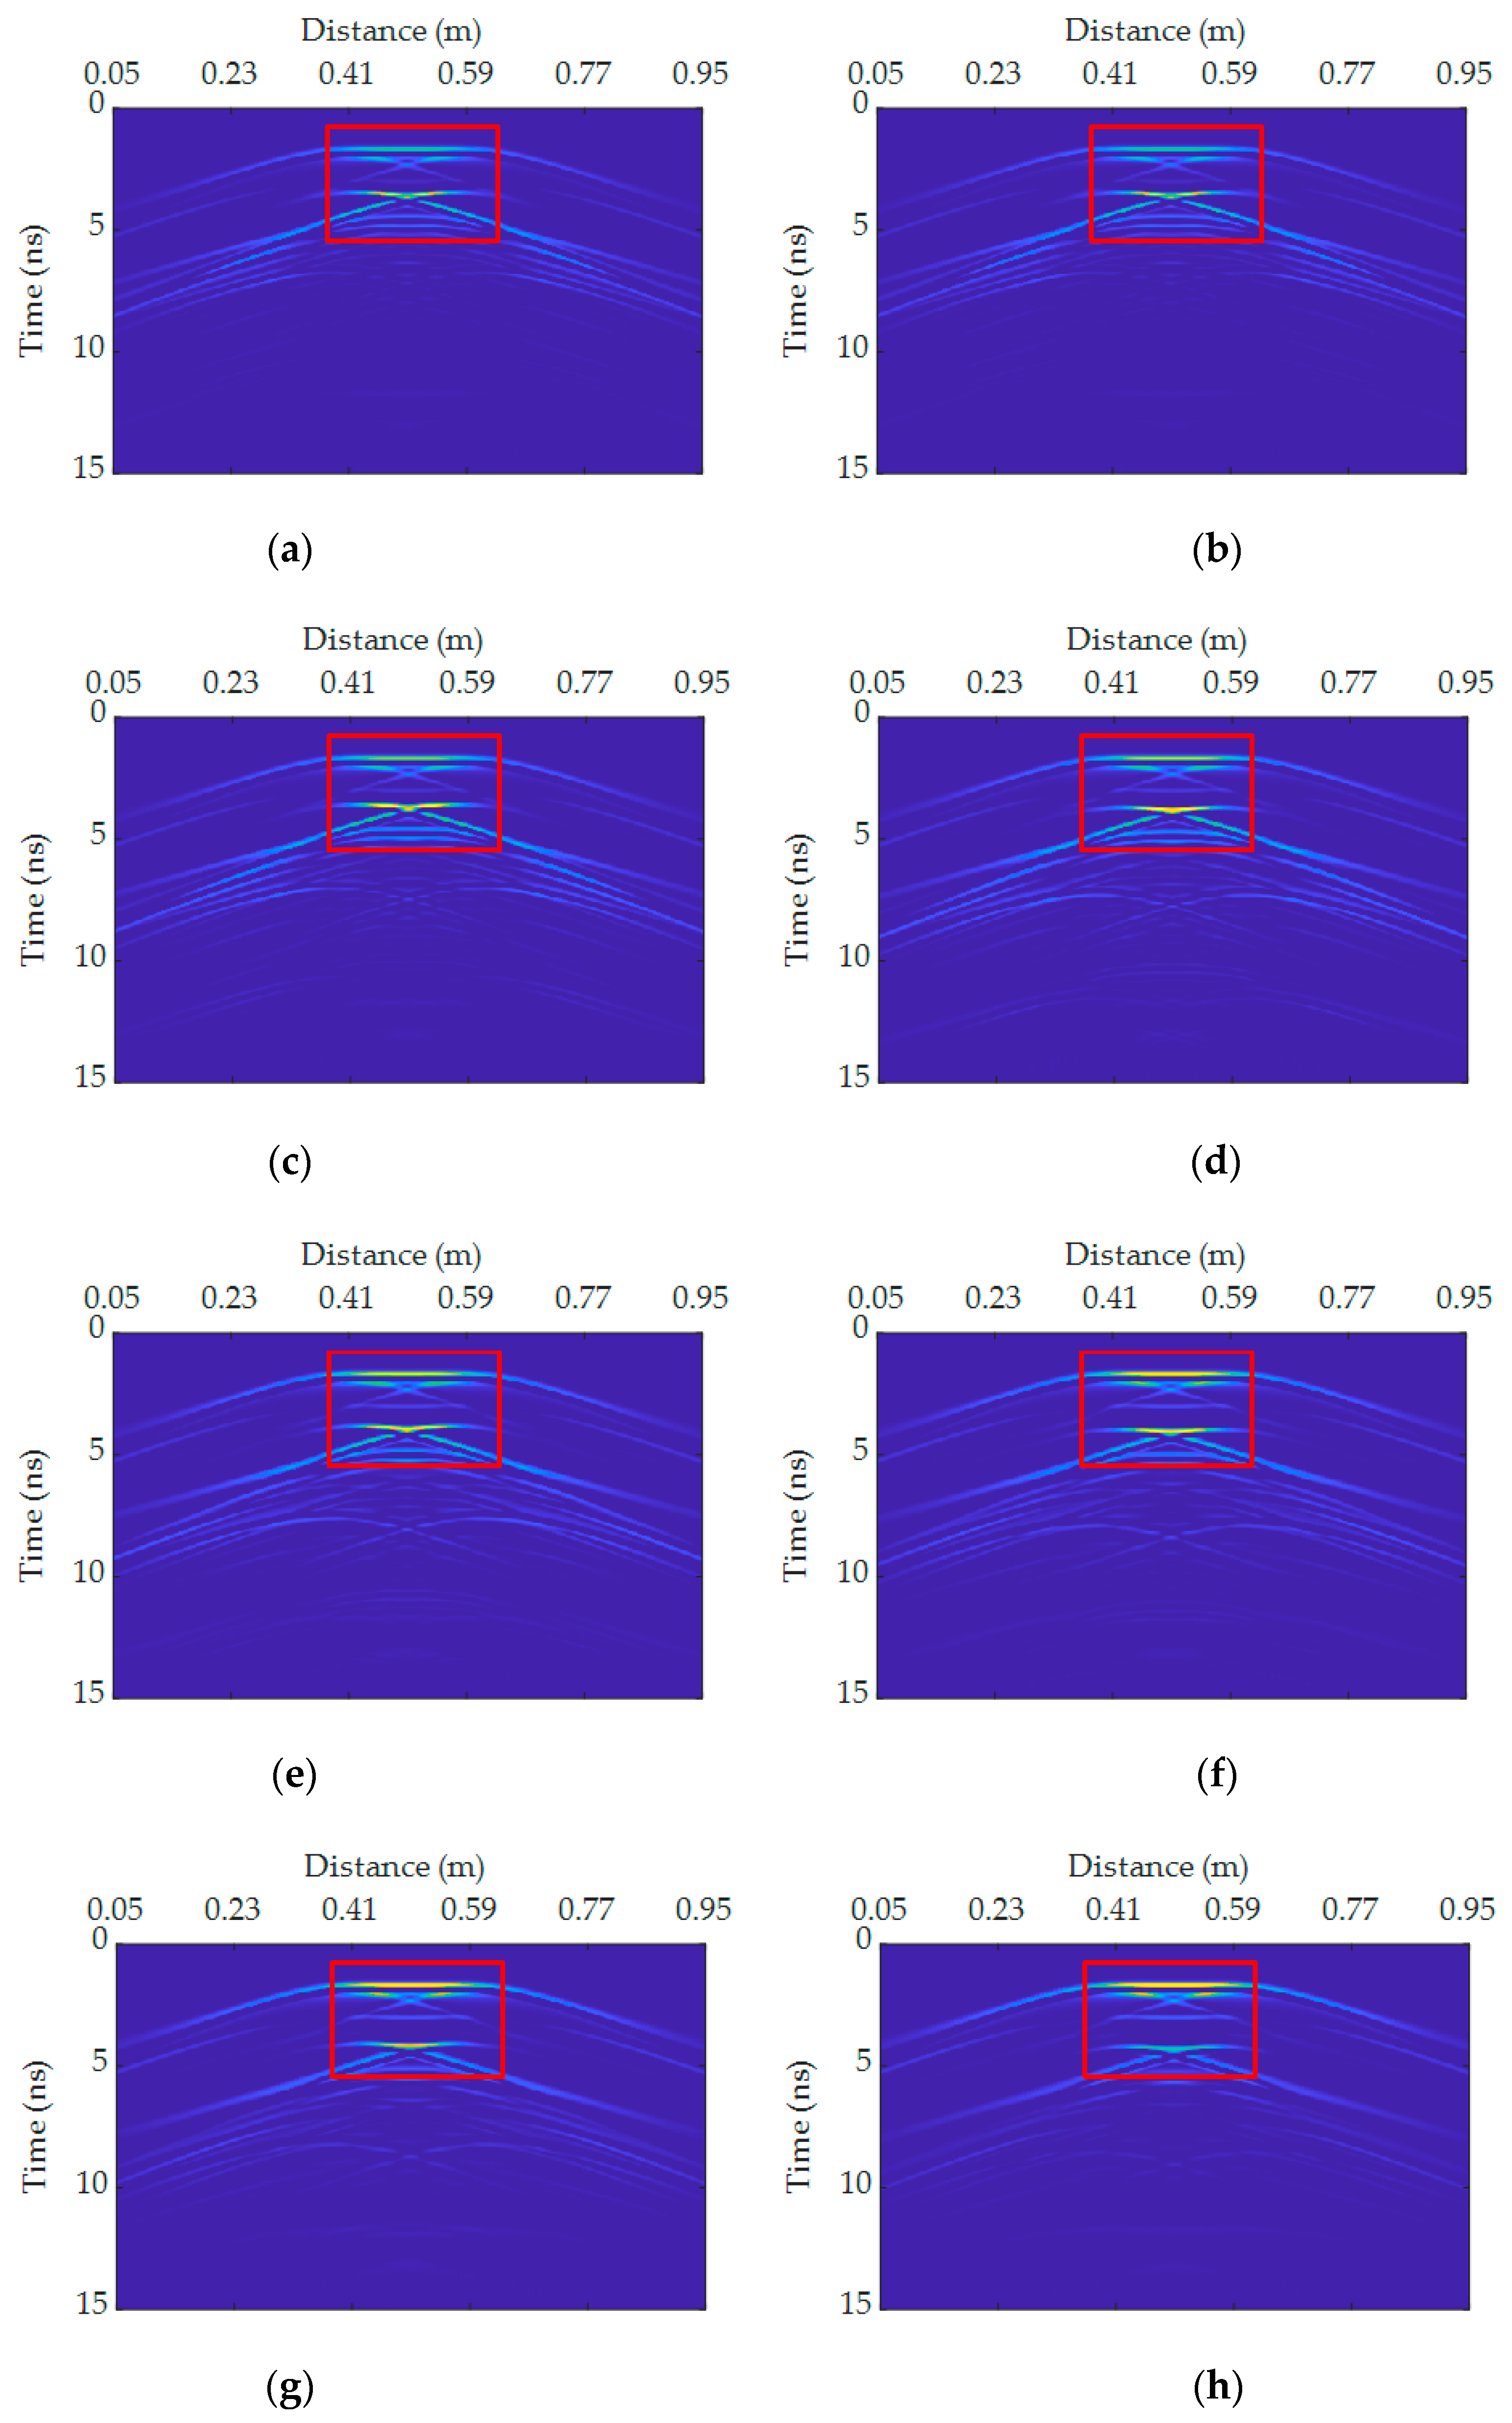
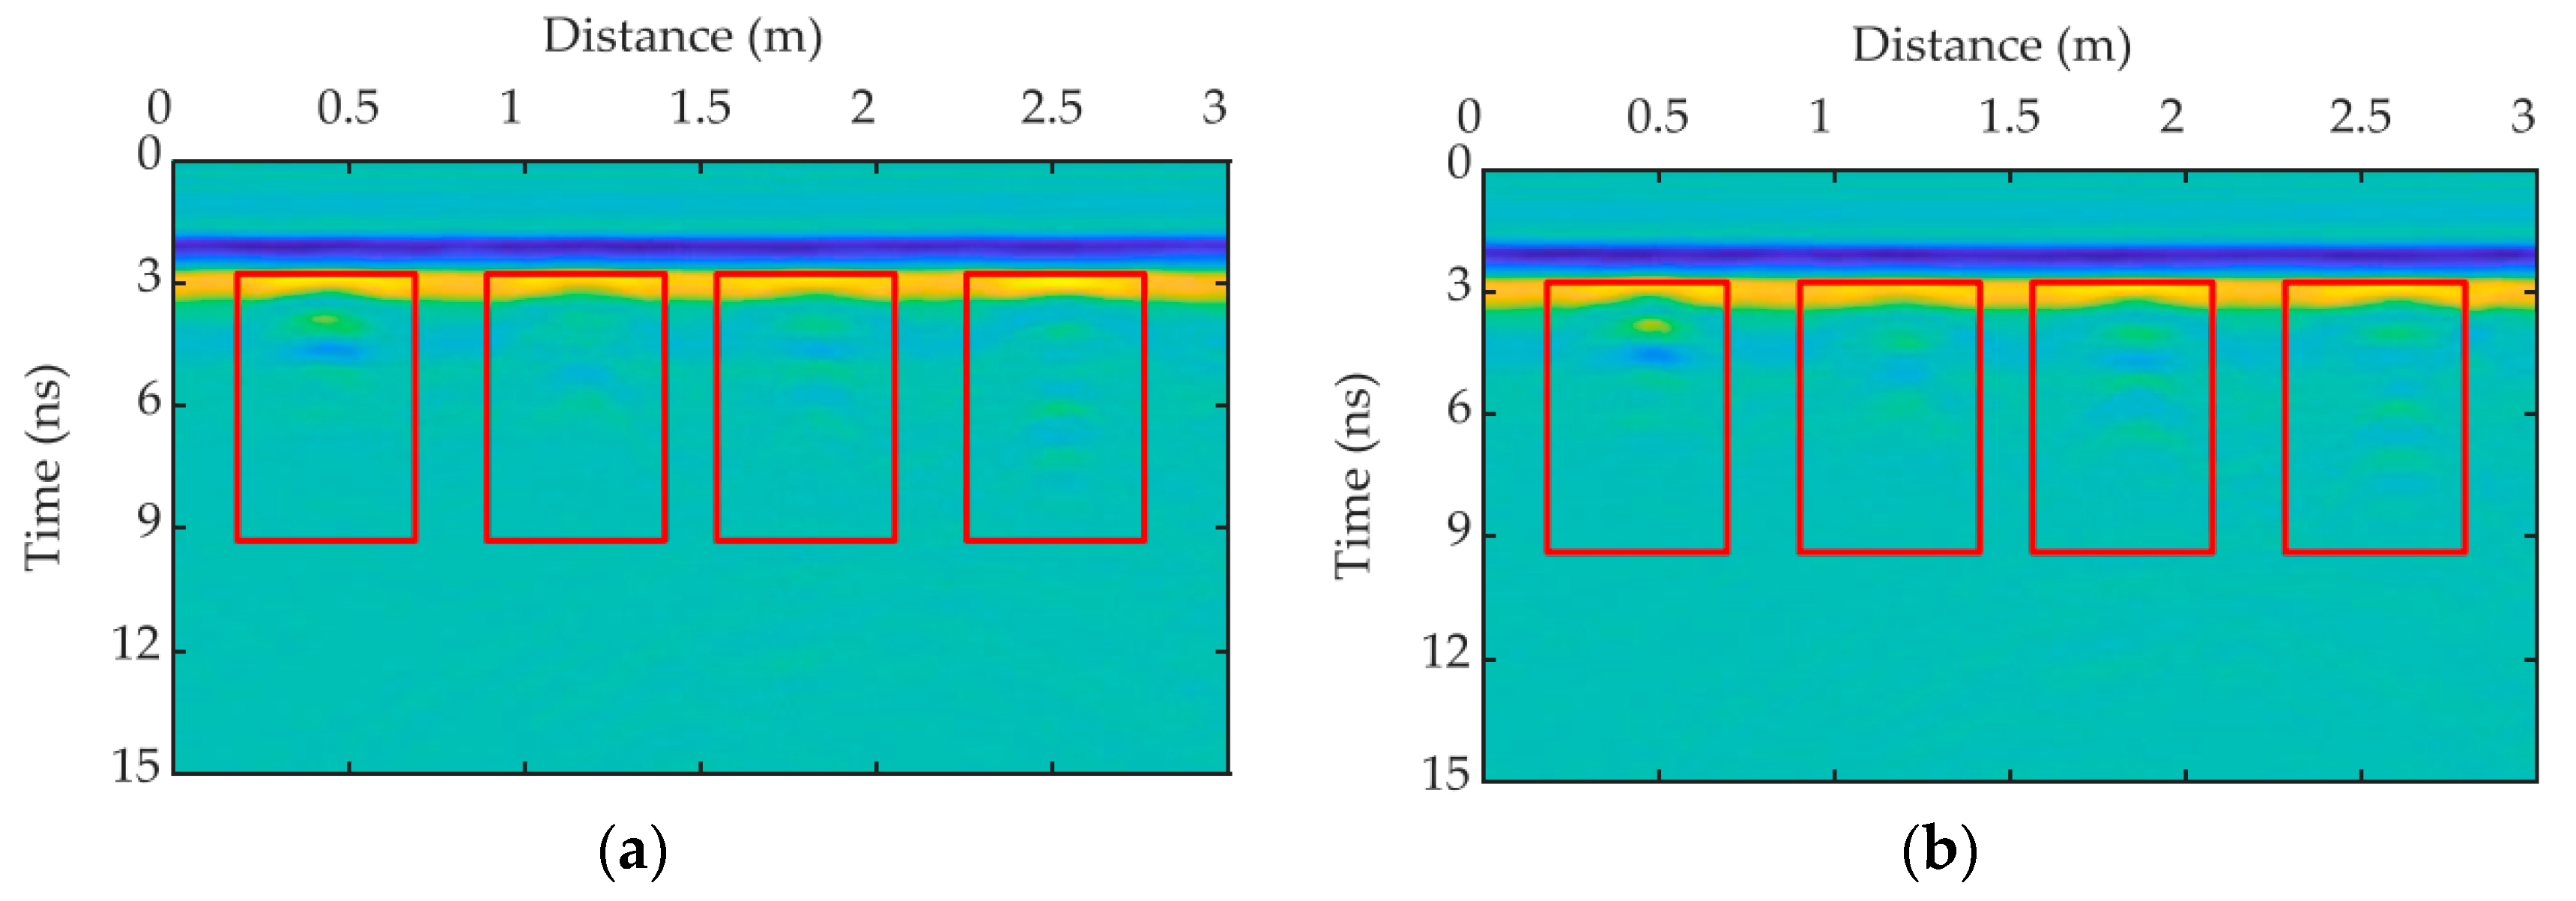
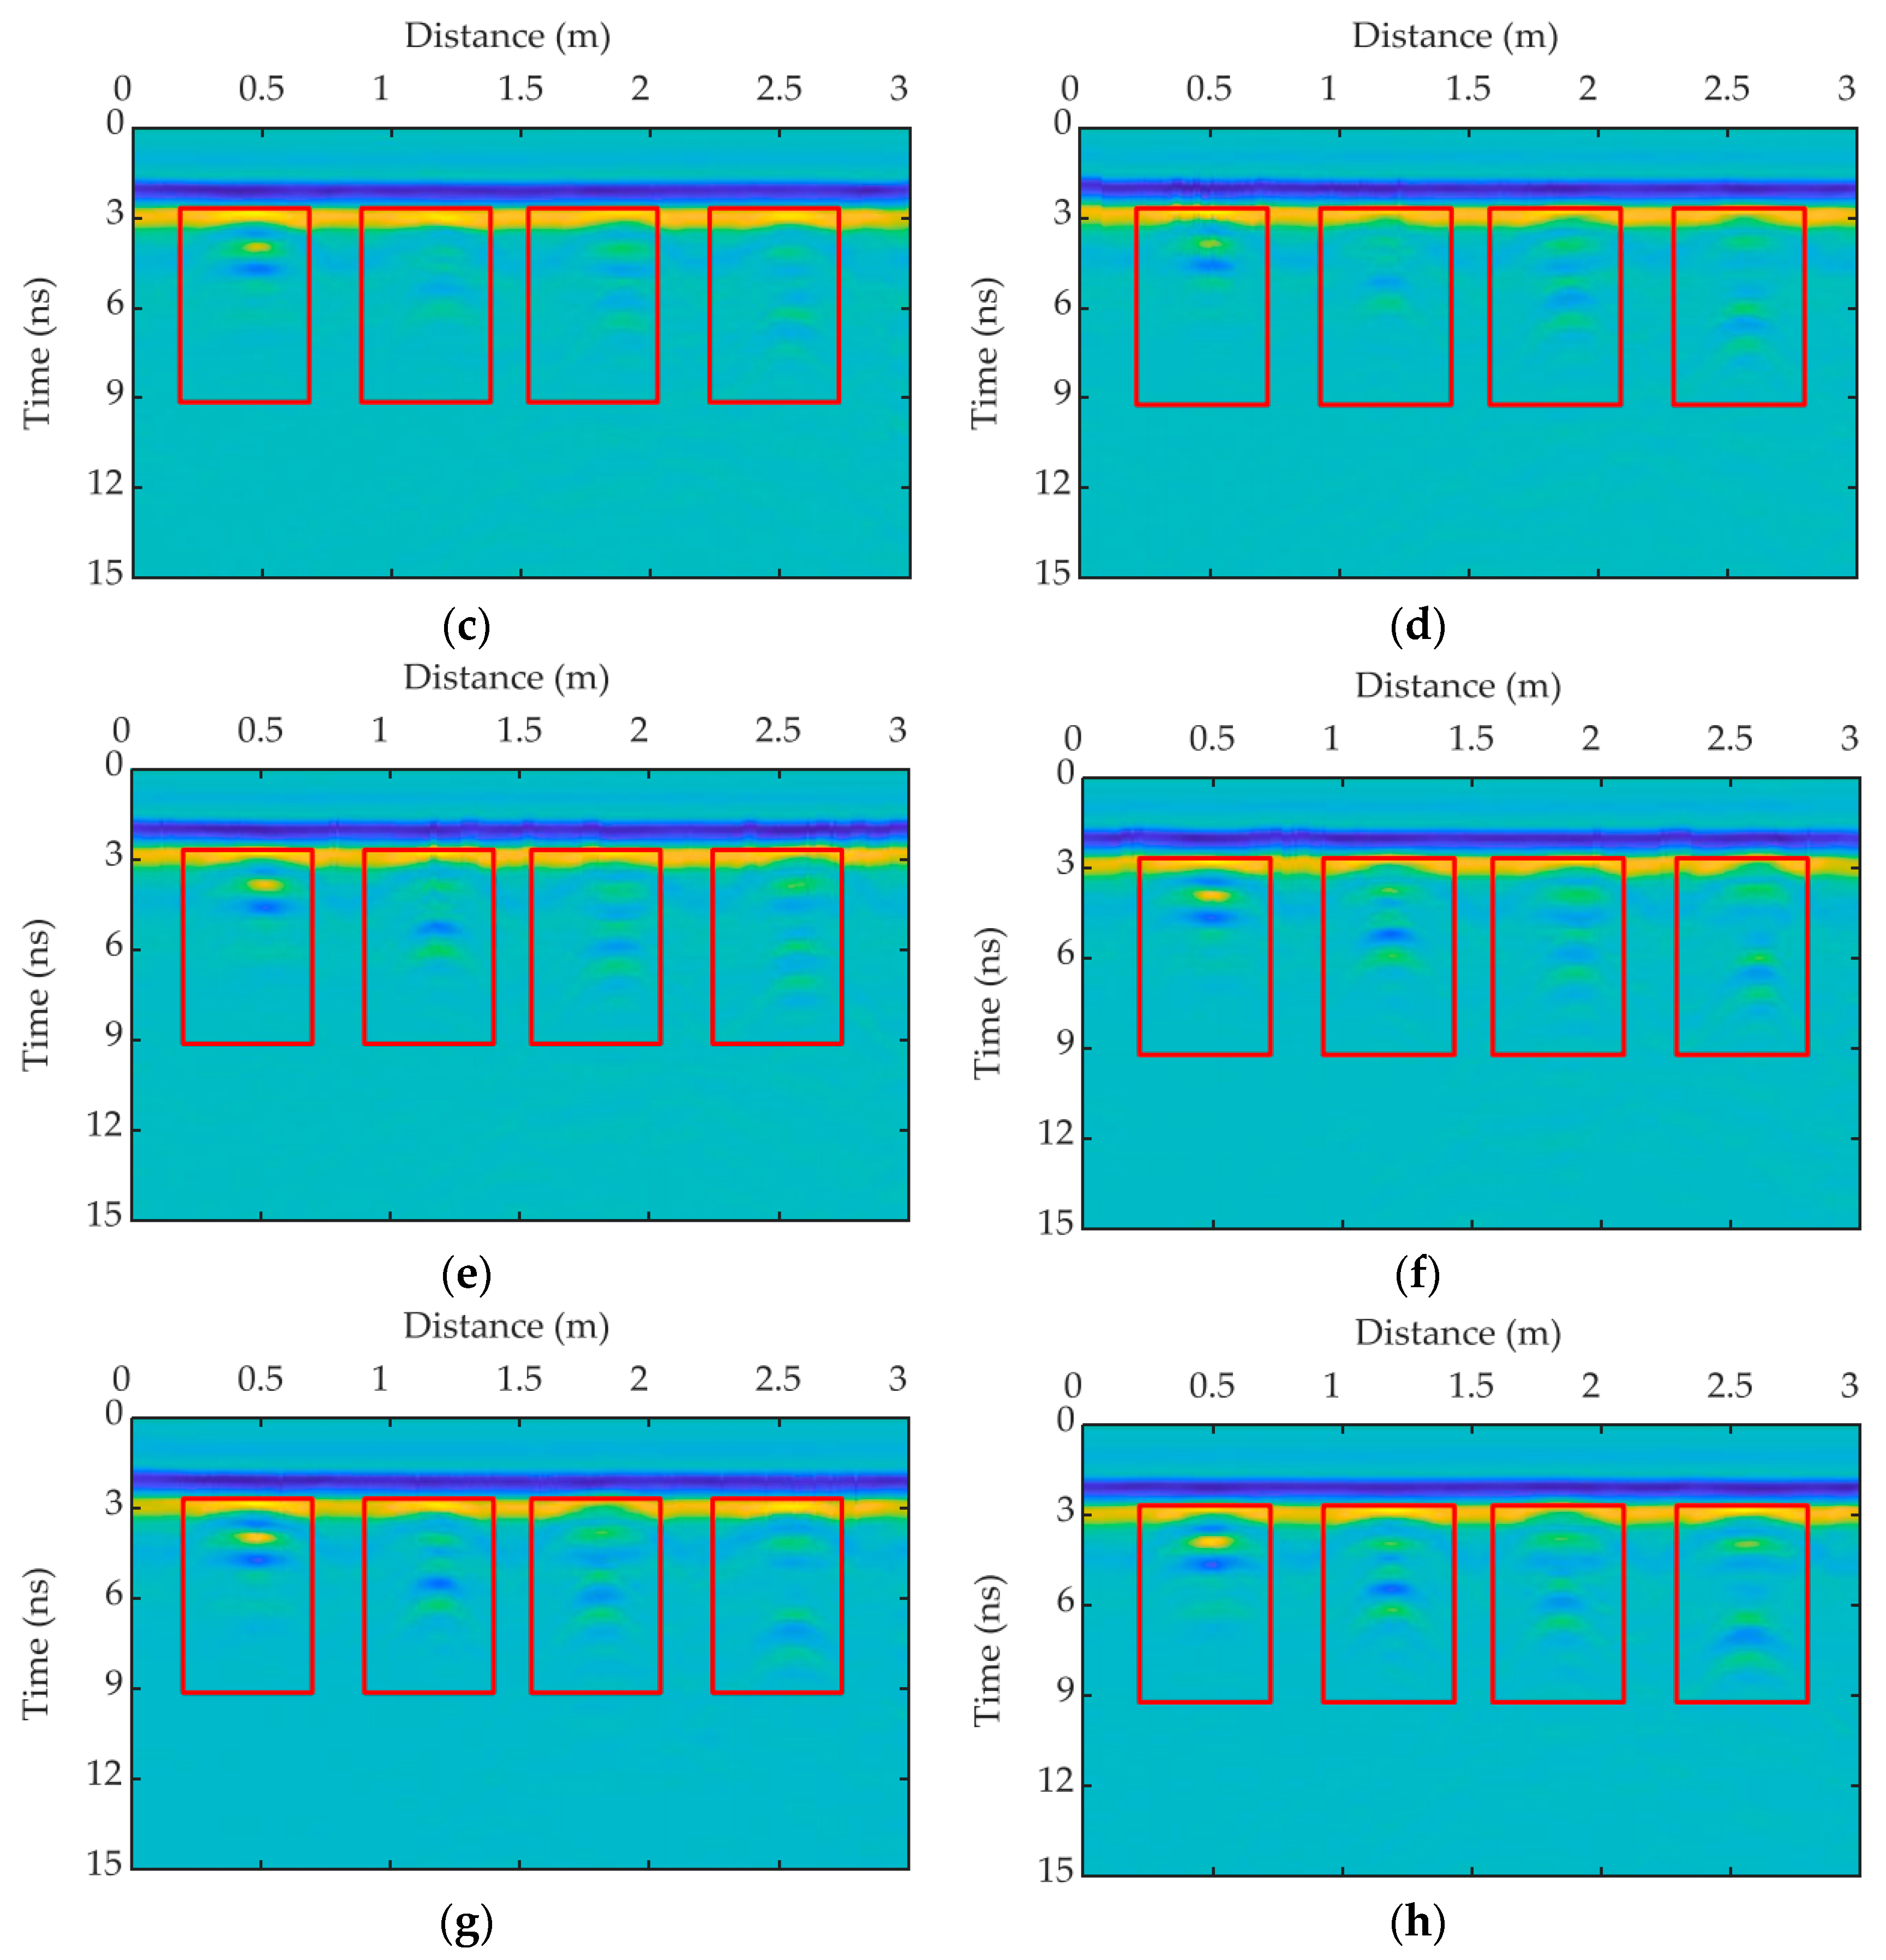
4.1. Preprocessing of GPR Signals

The GPR postprocessing analysis software was used to perform static correction, DC bias, gain, and band-pass filtering on the GPR signals shown in Figure 10. The results are shown in Figure 11.
The results show that the resolution of the GPR images in Figure 11 is high compared with that in Figure 10 when the direct wave and noise are removed; as such, the reflected signals of the model boxes can be displayed more clearly and intuitively.

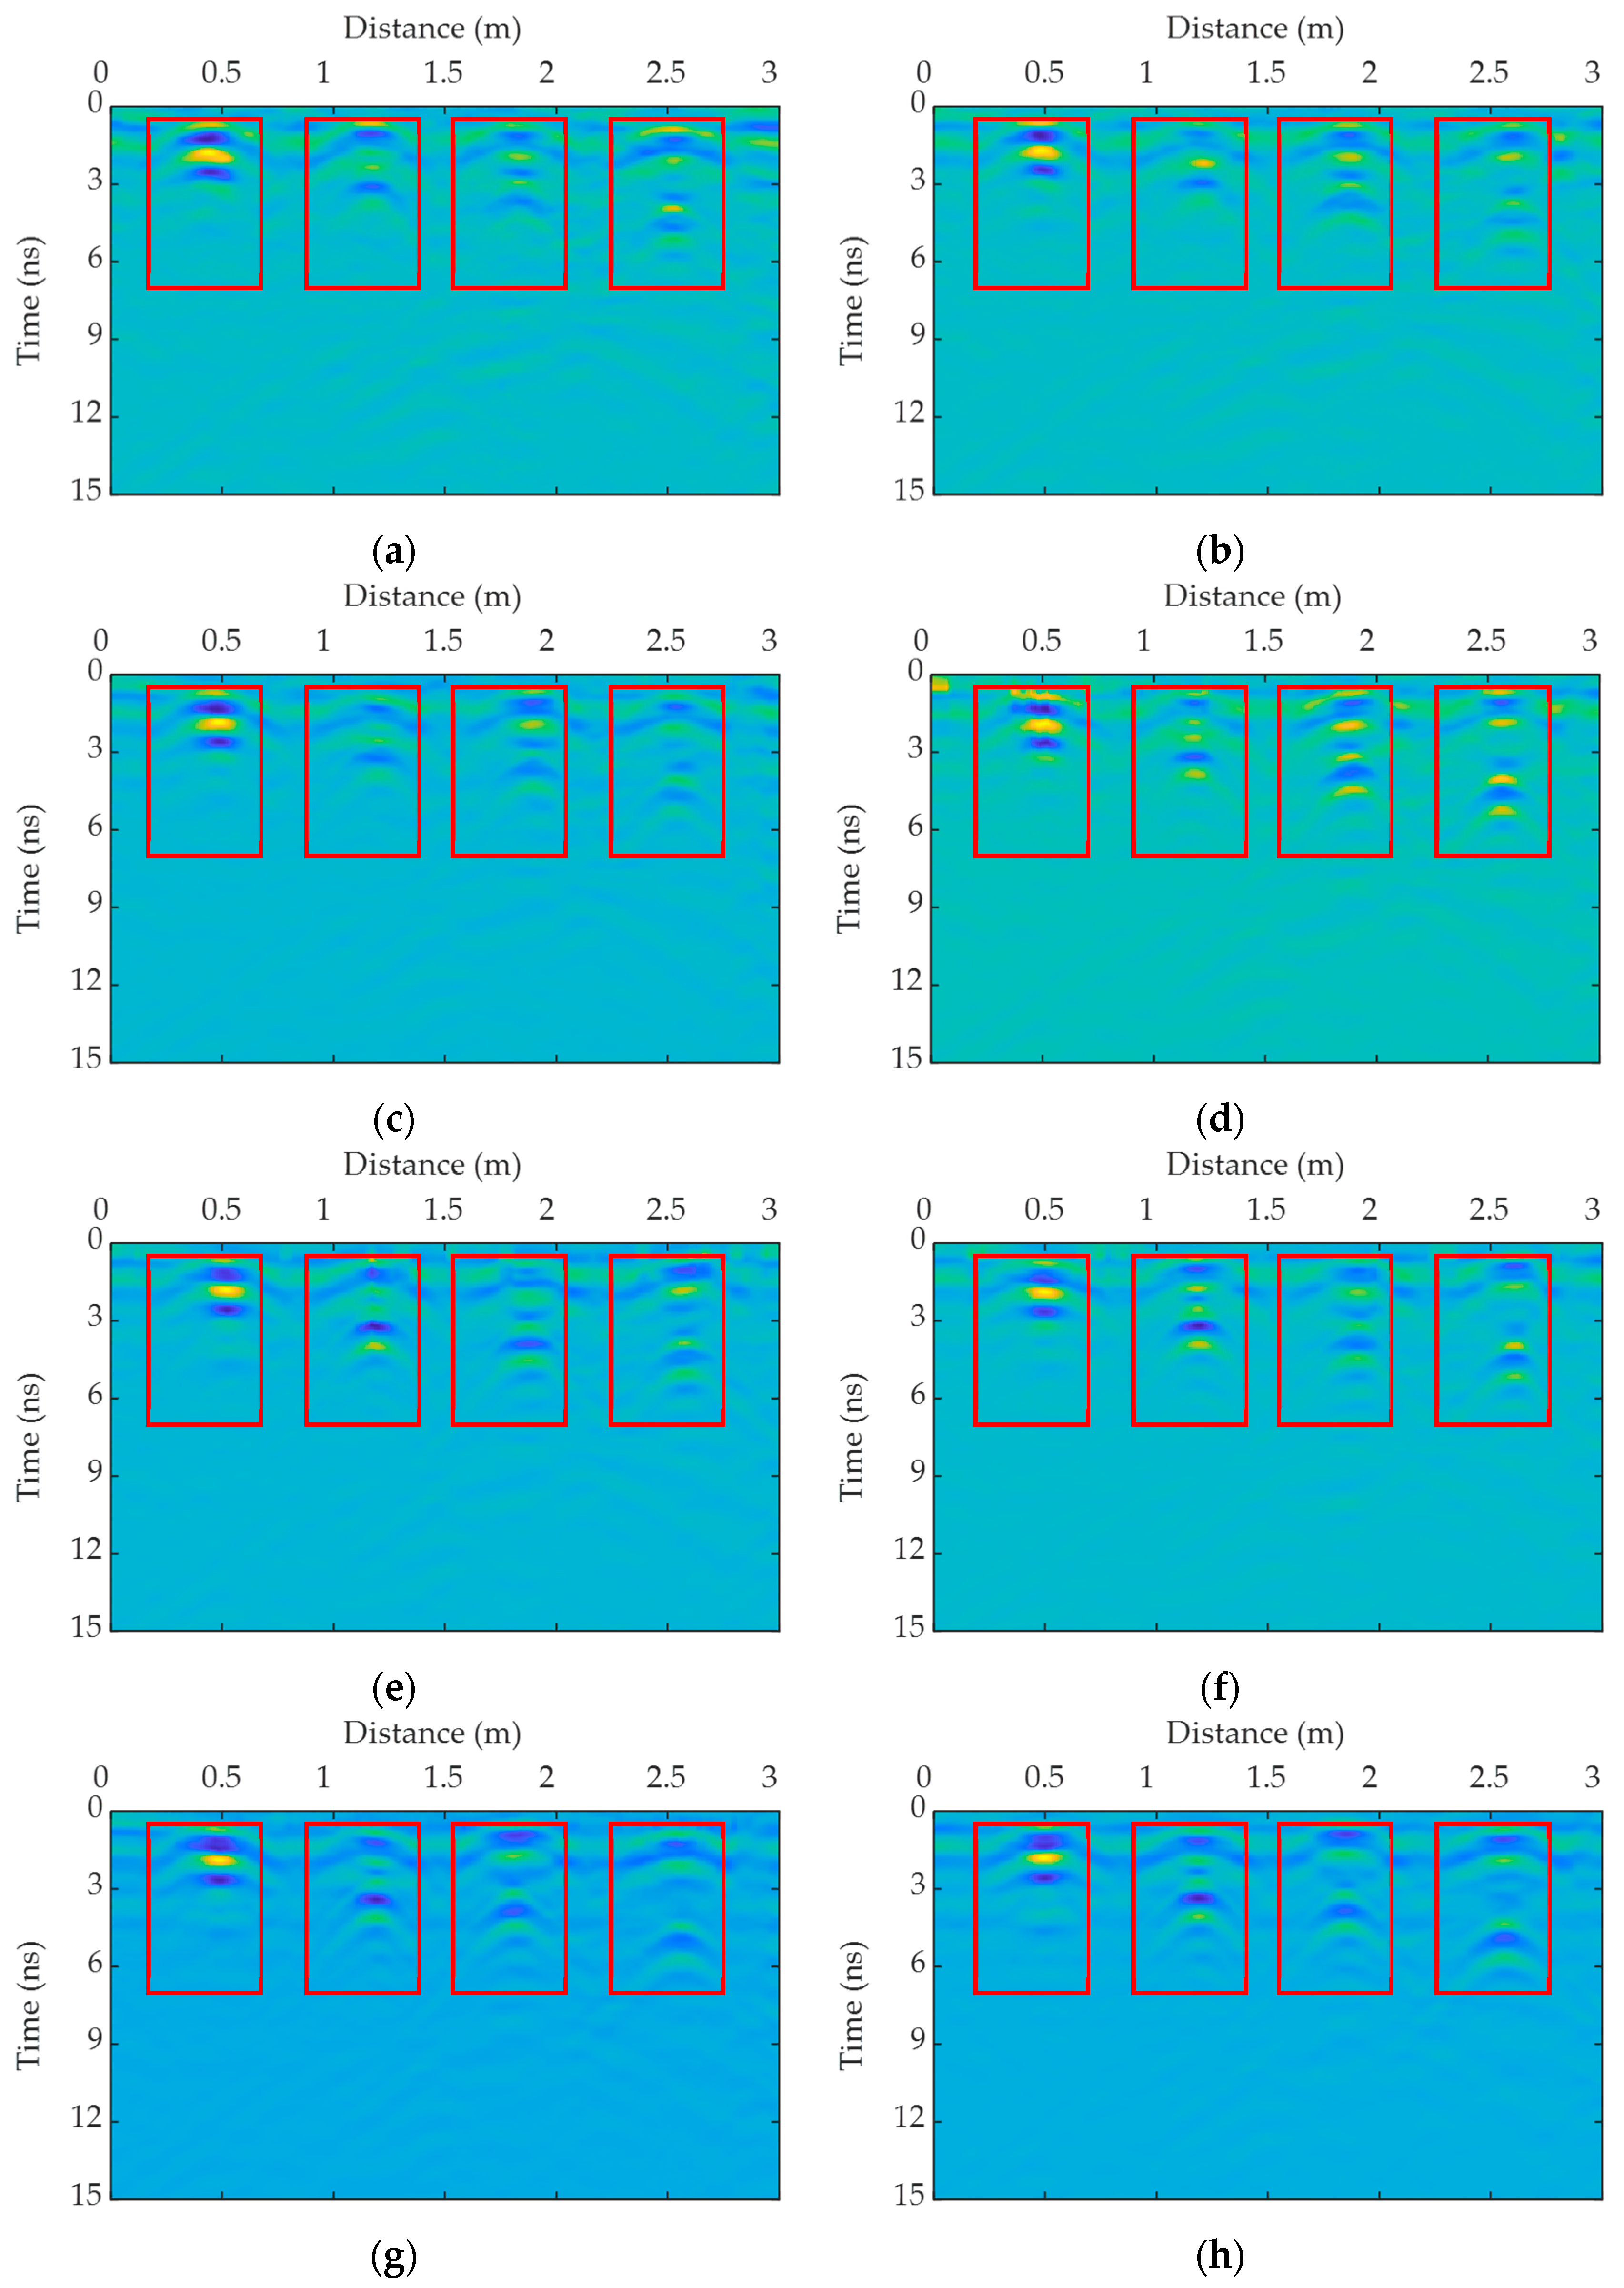
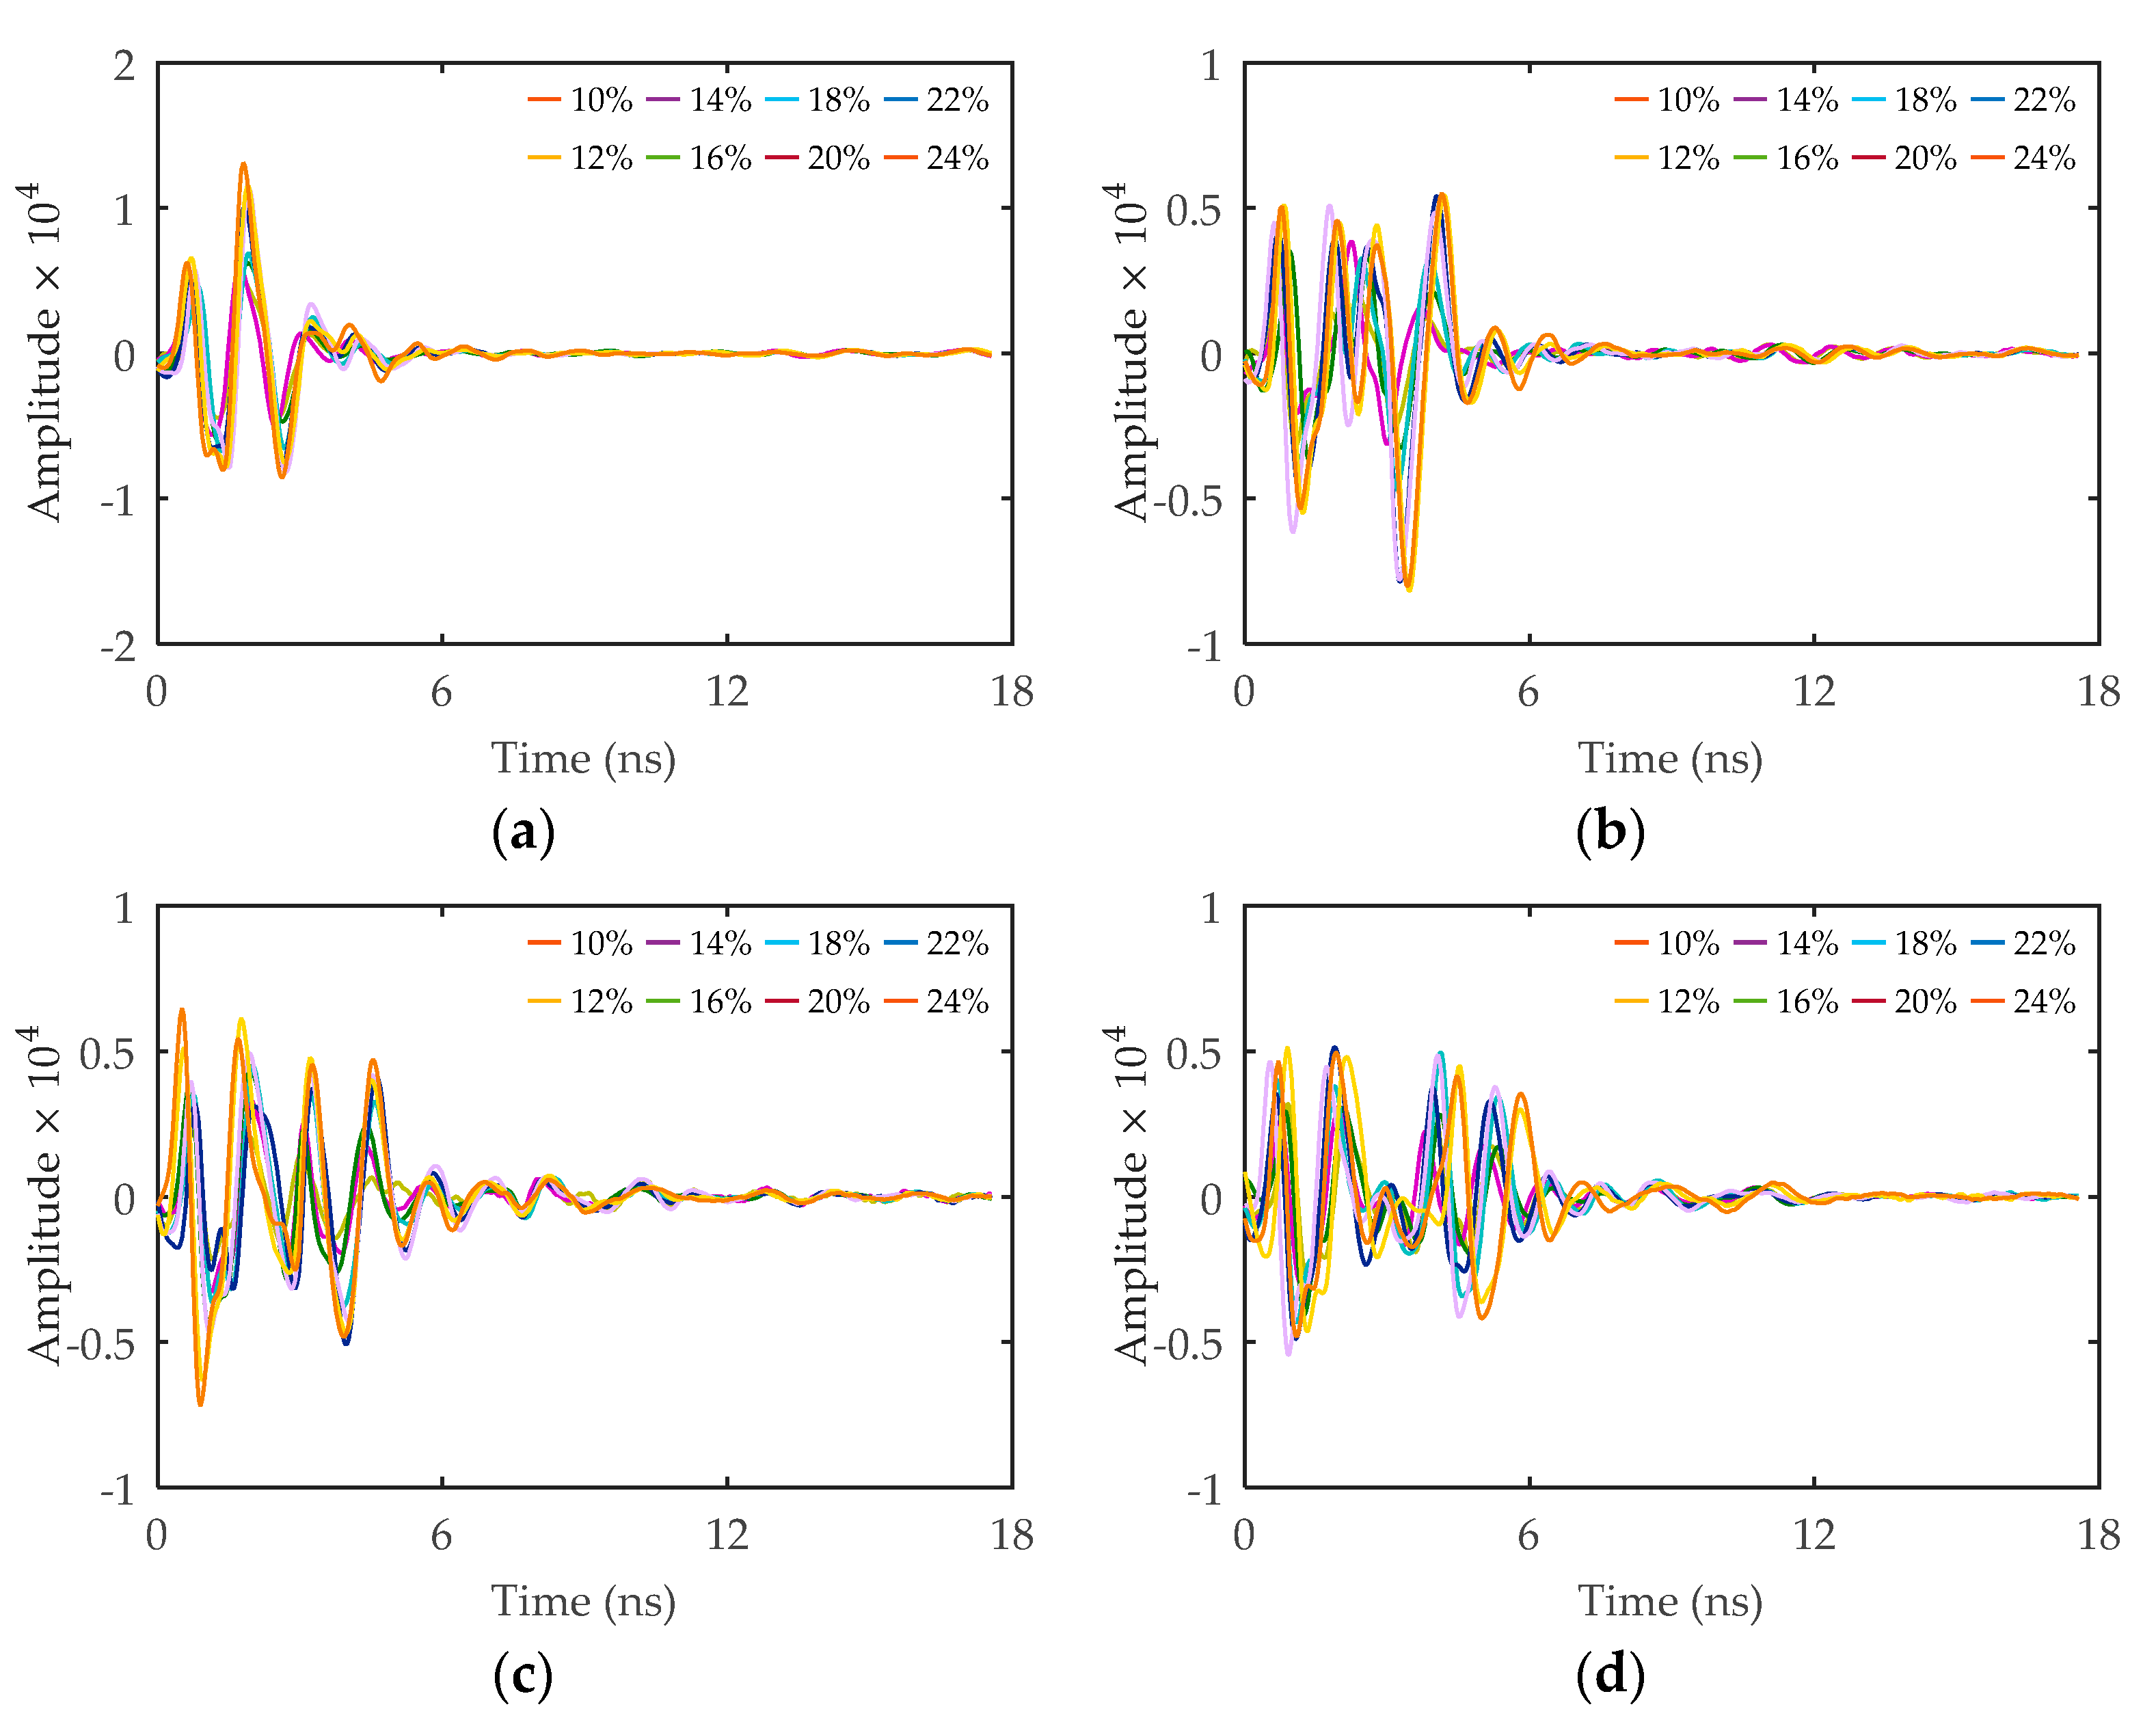
4.2. Time-Domain Signals Response

The clays shown in Figure 8b–h were filled separately into the model boxes, and then buried in sand boxes one by one. GPR was employed to detect the model boxes in the sand box, and the GPR time profiles of eight kinds of clays with different water contents were obtained. Then, from each GPR time profile, a typical single-channel signal that could reflect a model box was extracted; the results are shown in Figure 12. Figure 12a–d show the obtained GPR single-channel signals in the first to fourth model boxes. Each model box included eight kinds of soil with different water contents.

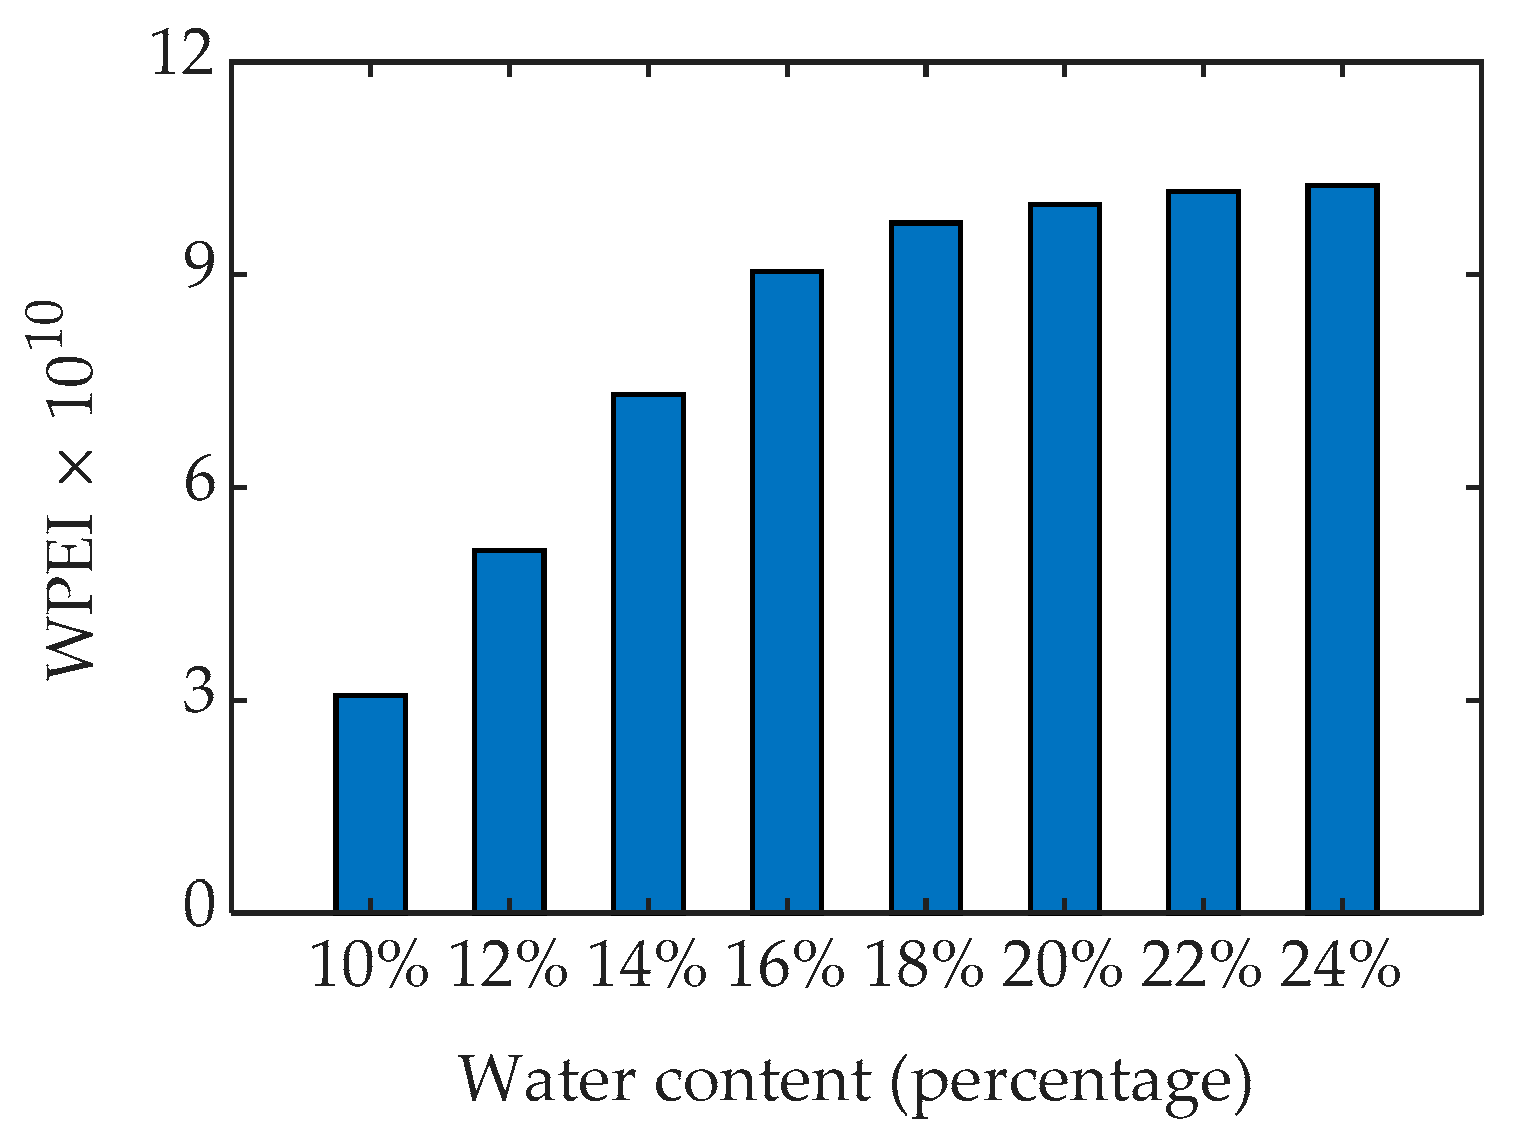
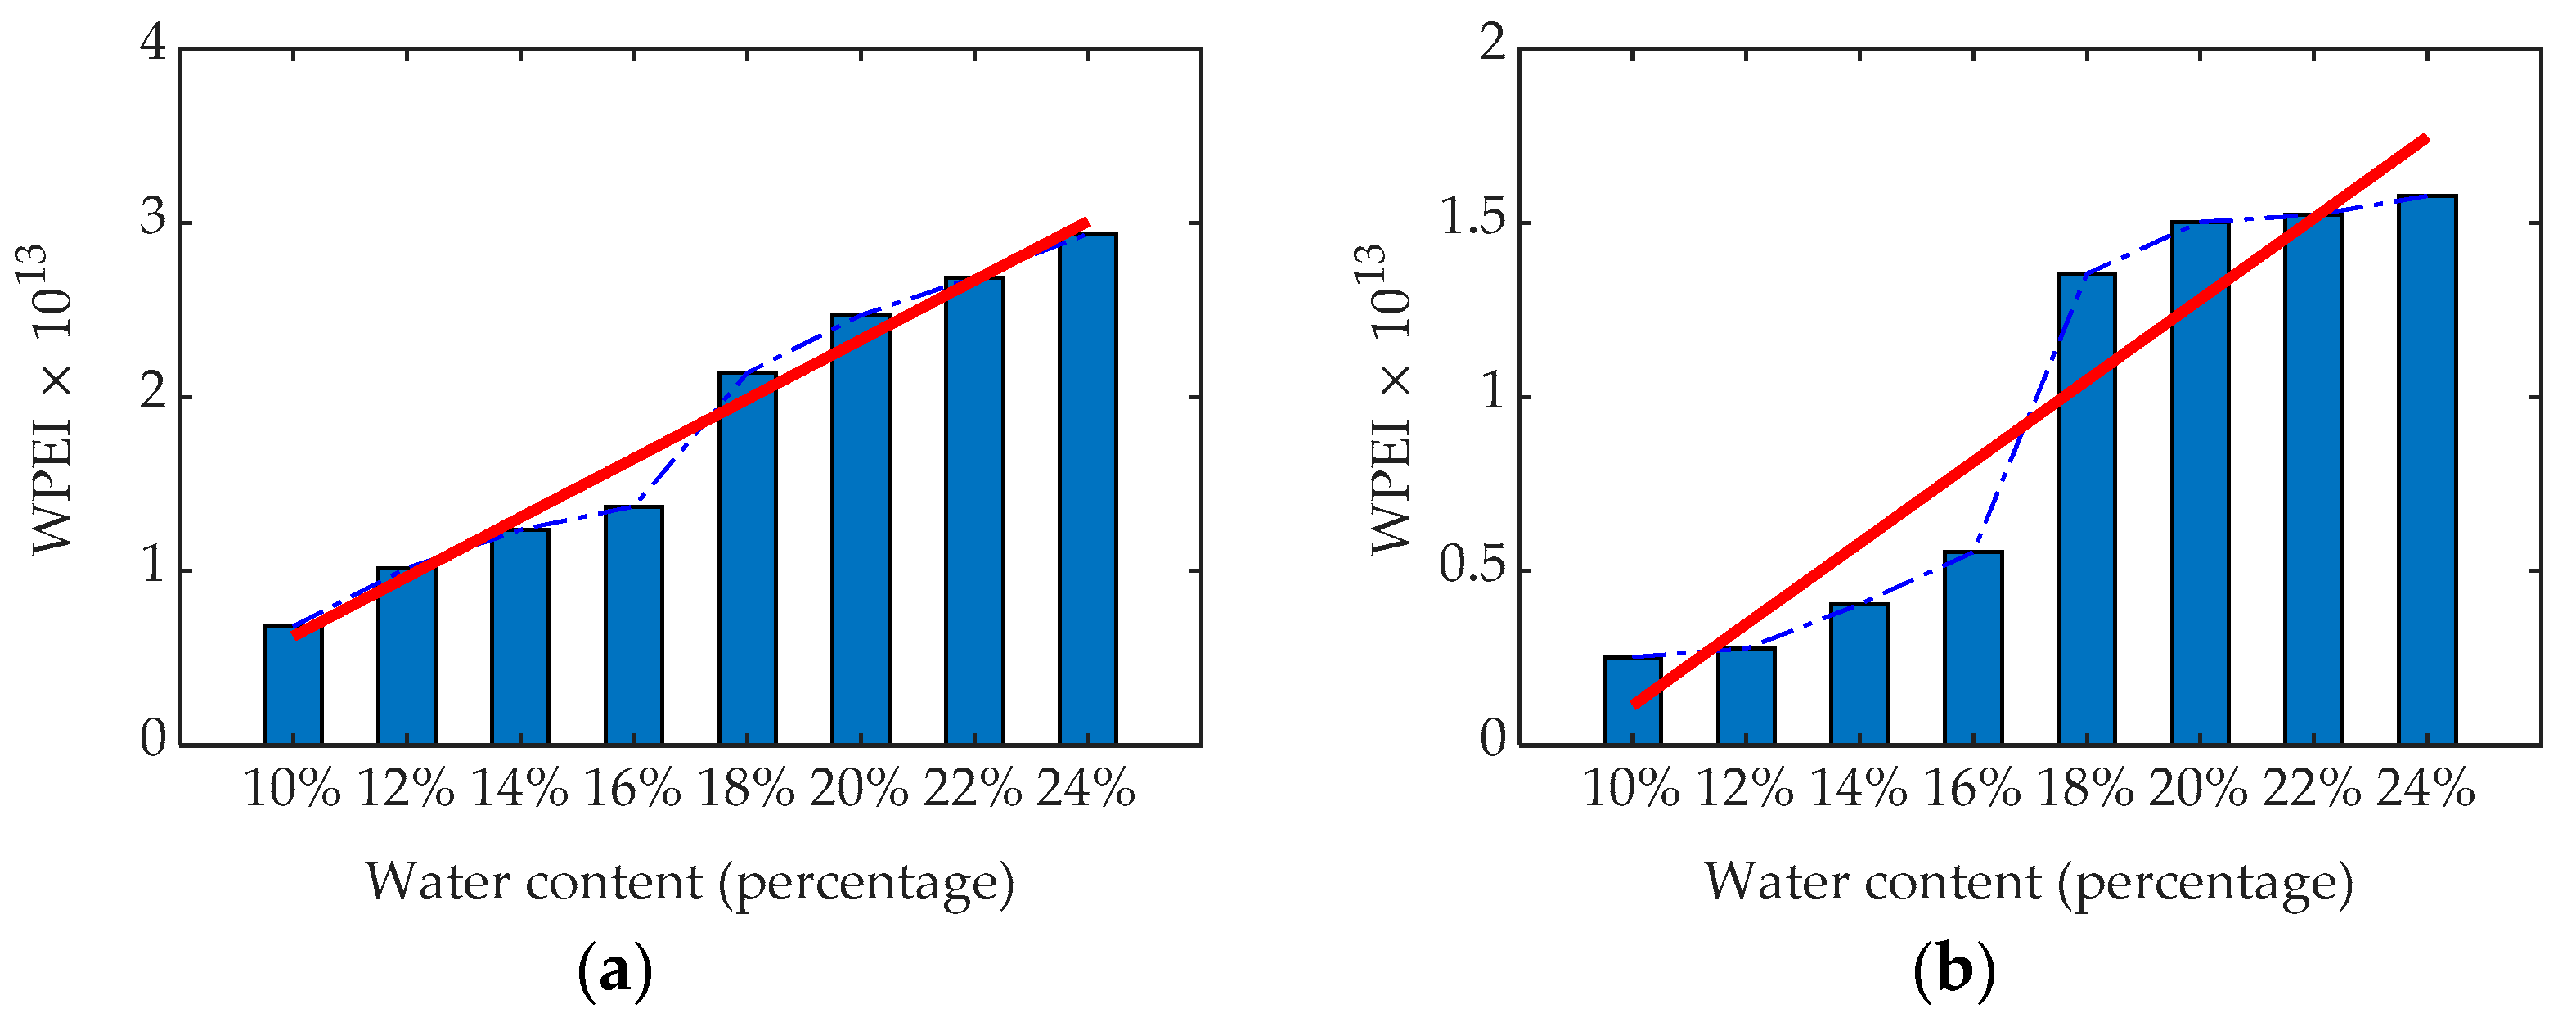
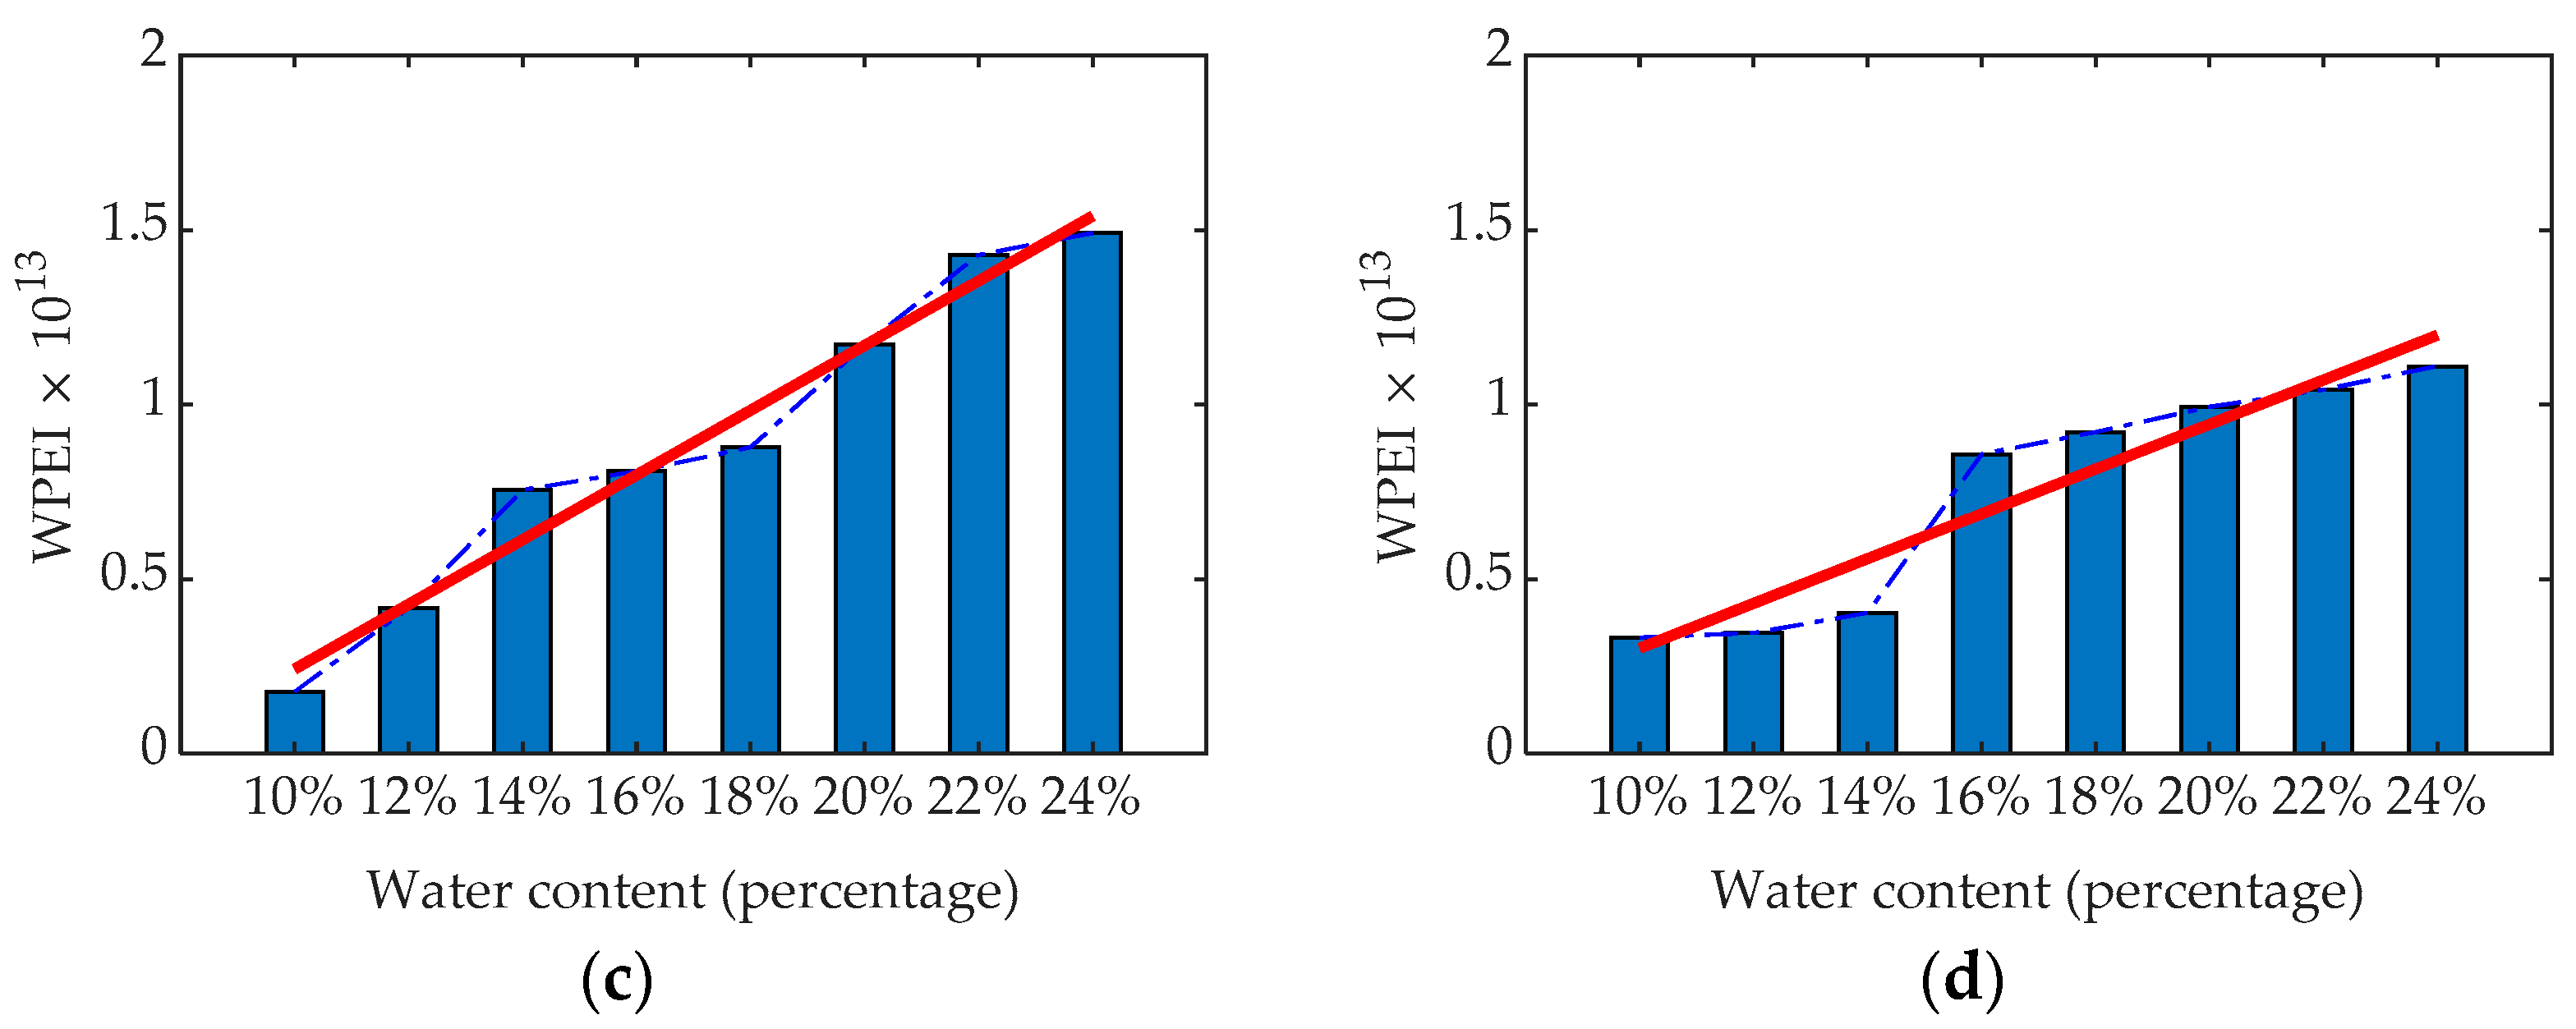
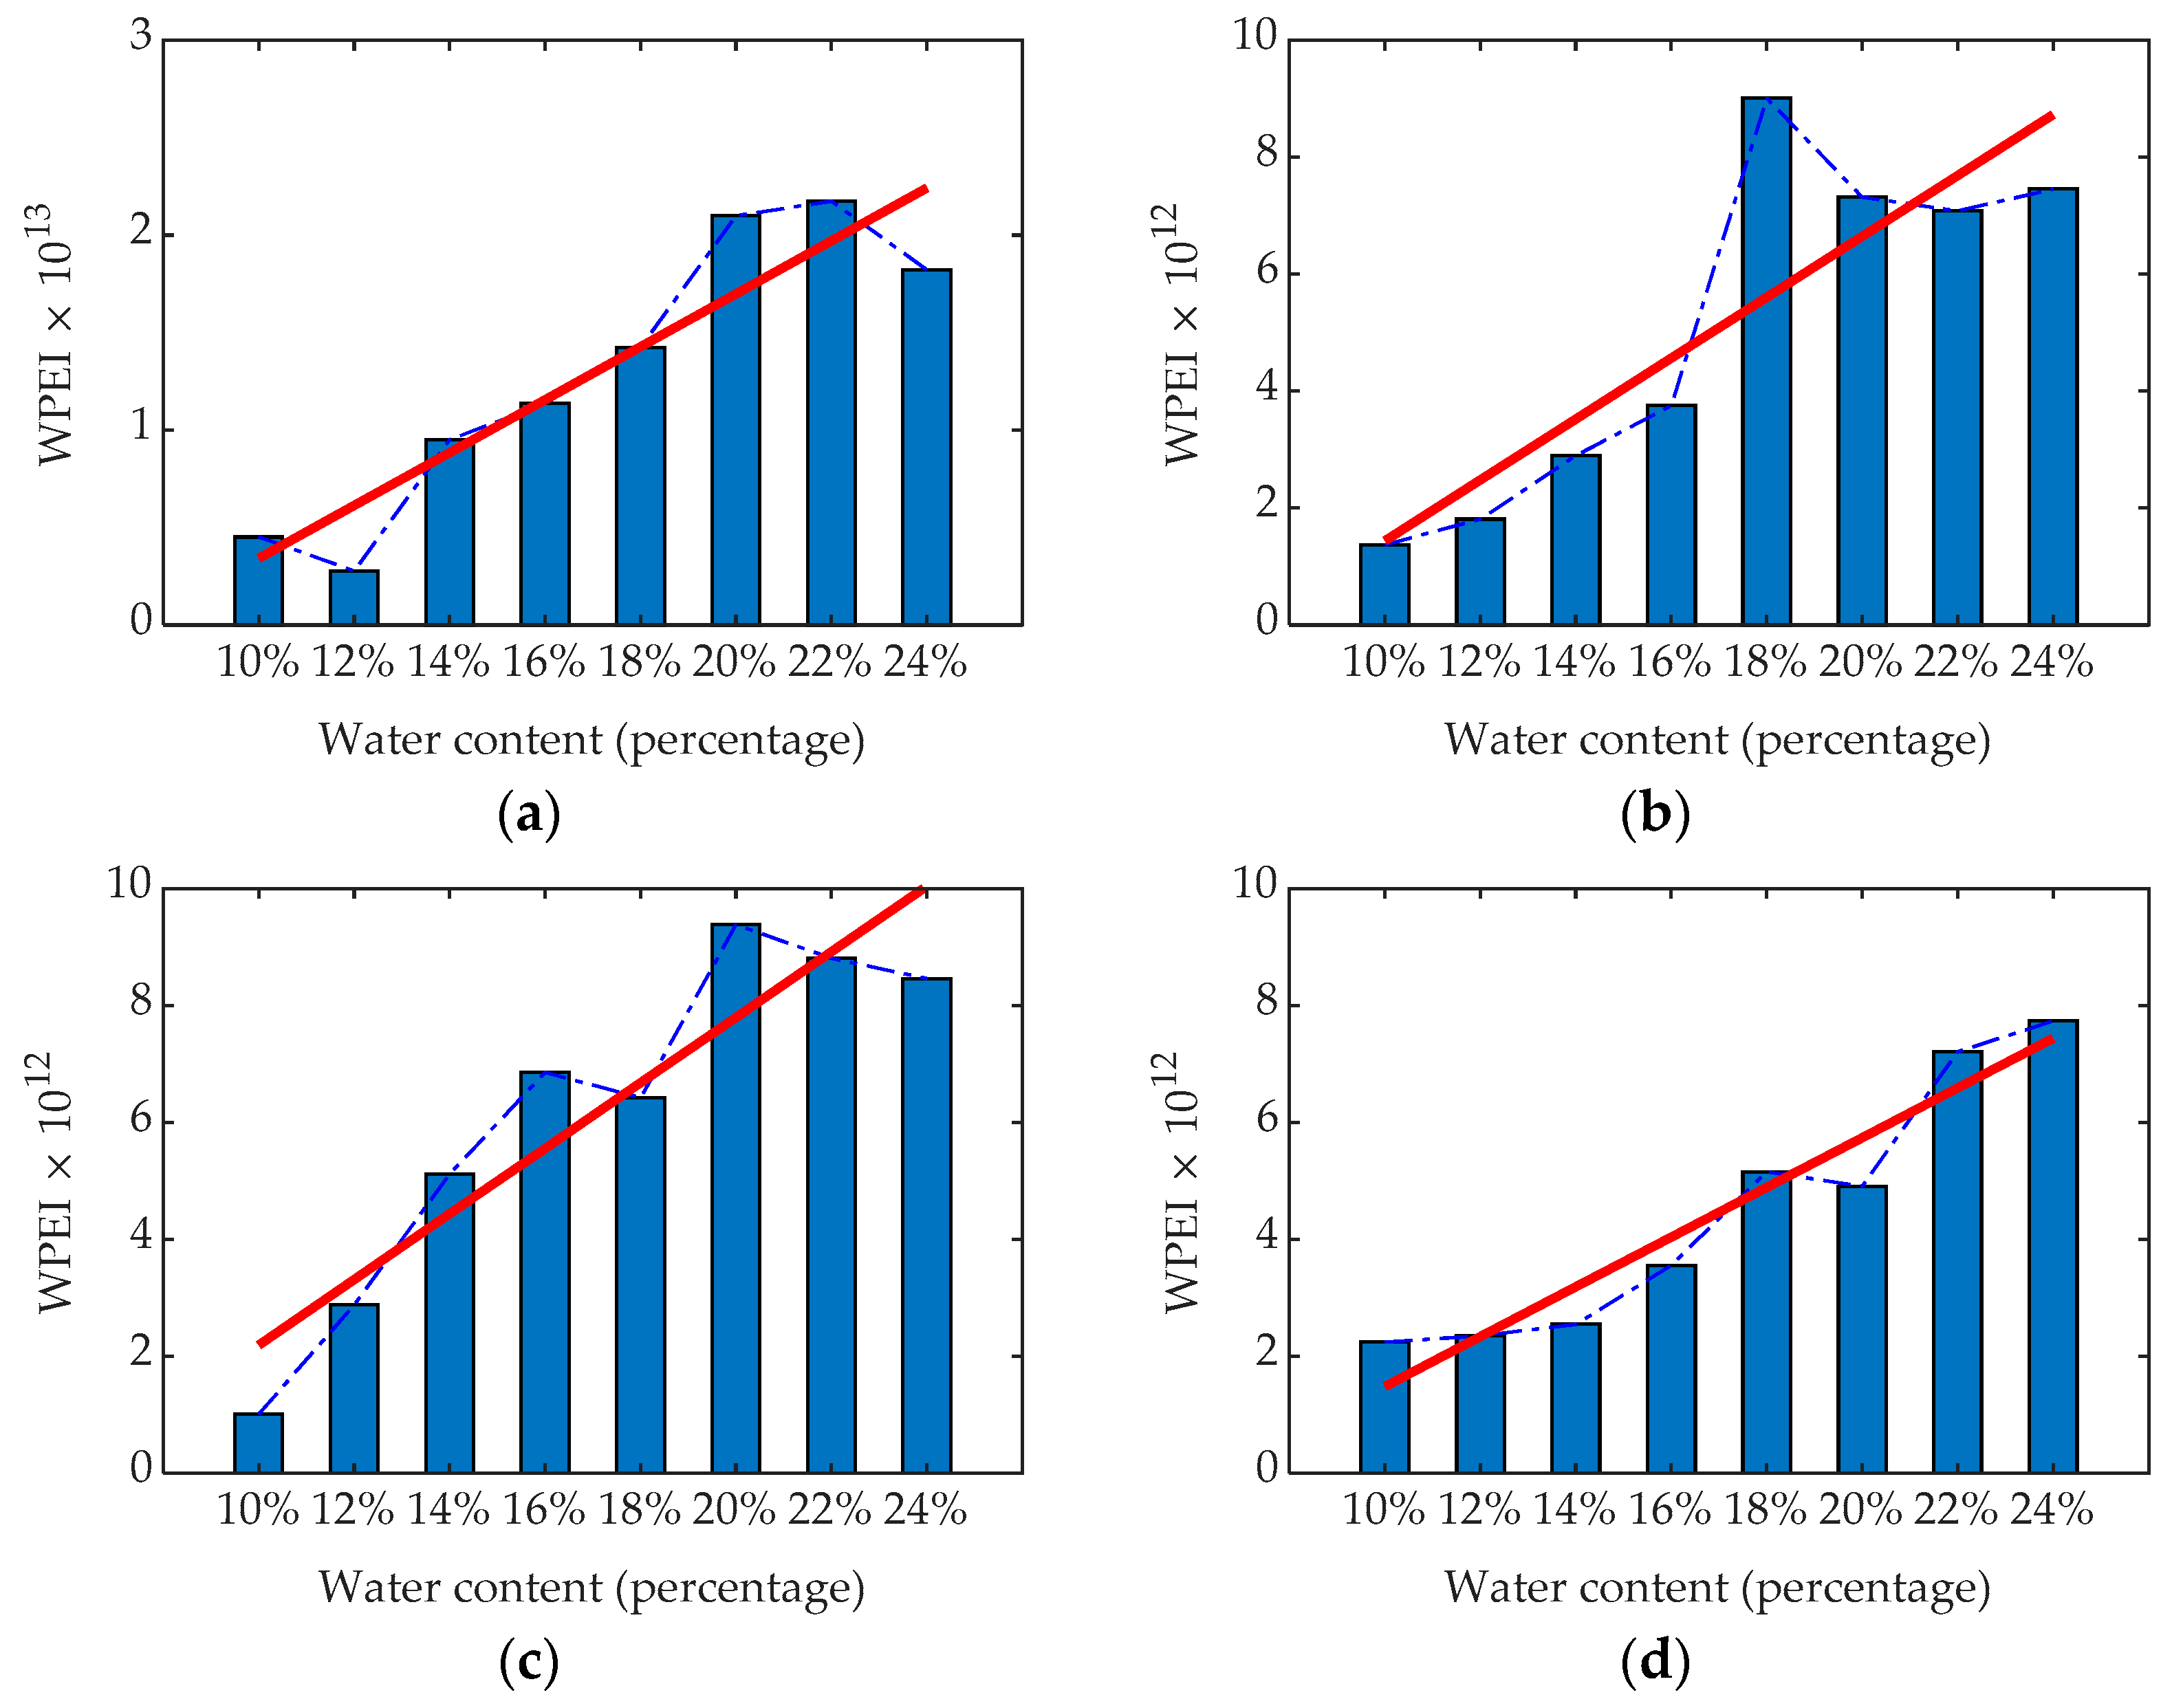
4.3. WPEI of GPR Signals

According to the wavelet basis described in Section 2.1, the GPR single-channel signals shown in Figure 12 was subjected to wavelet packet decomposition. Then, the WPEA method described in Section 2.3 was used to calculate the wavelet packet coefficients of the GPR single-channel signals, and the WPEI of the four model boxes with different water contents was obtained. The results are shown in Figure 13. Figure 13a–d shows the WPEI of the GPR single-channel signals in the first to fourth model boxes.
Four model experiments were repeated in four model boxes, and the obtained laws were consistent with each other, thereby verifying the reliability of the method. A linear function was used to curve-fit the WPEI of the clay with different water contents in the four model boxes. The obtained linear equations were: y 1 = 1.702 × 10 14 x 1 1.076 × 10 13 , y 2 = 1.166 × 10 14 x 2 1.051 × 10 13 , y 3 = 9.261 × 10 13 x 3 6.832 × 10 12 , and y 4 = 6.399 × 10 13 x 4   3.368 × 10 12 , and the correlation coefficients were 0.97, 0.89, 0.97 and 0.89, respectively. Among them, x 1 , x 2 , x 3 and x 4 were clays with different water contents, and x 1 = x 2 = x 3 = x 4 = [10% 12% 14% 16% 18% 20% 22% 24%], y 1 , y 2 , y 3 and y 4 were the WPEI values. These results suggest that the WPEI of the GPR signals continued to increase as the water contents of clay increased, with a strong correlation being observed between these two parameters. However, in the case of the same water content in the four model boxes, the WPEI values of the GPR signals were slightly different. That is to say, the slopes of the four fitted curves are not exactly the same. One possible reason is that the size of the model box and the unevenness of the clay filling had a certain impact on the attenuation law of the electromagnetic waves inside the model boxes.

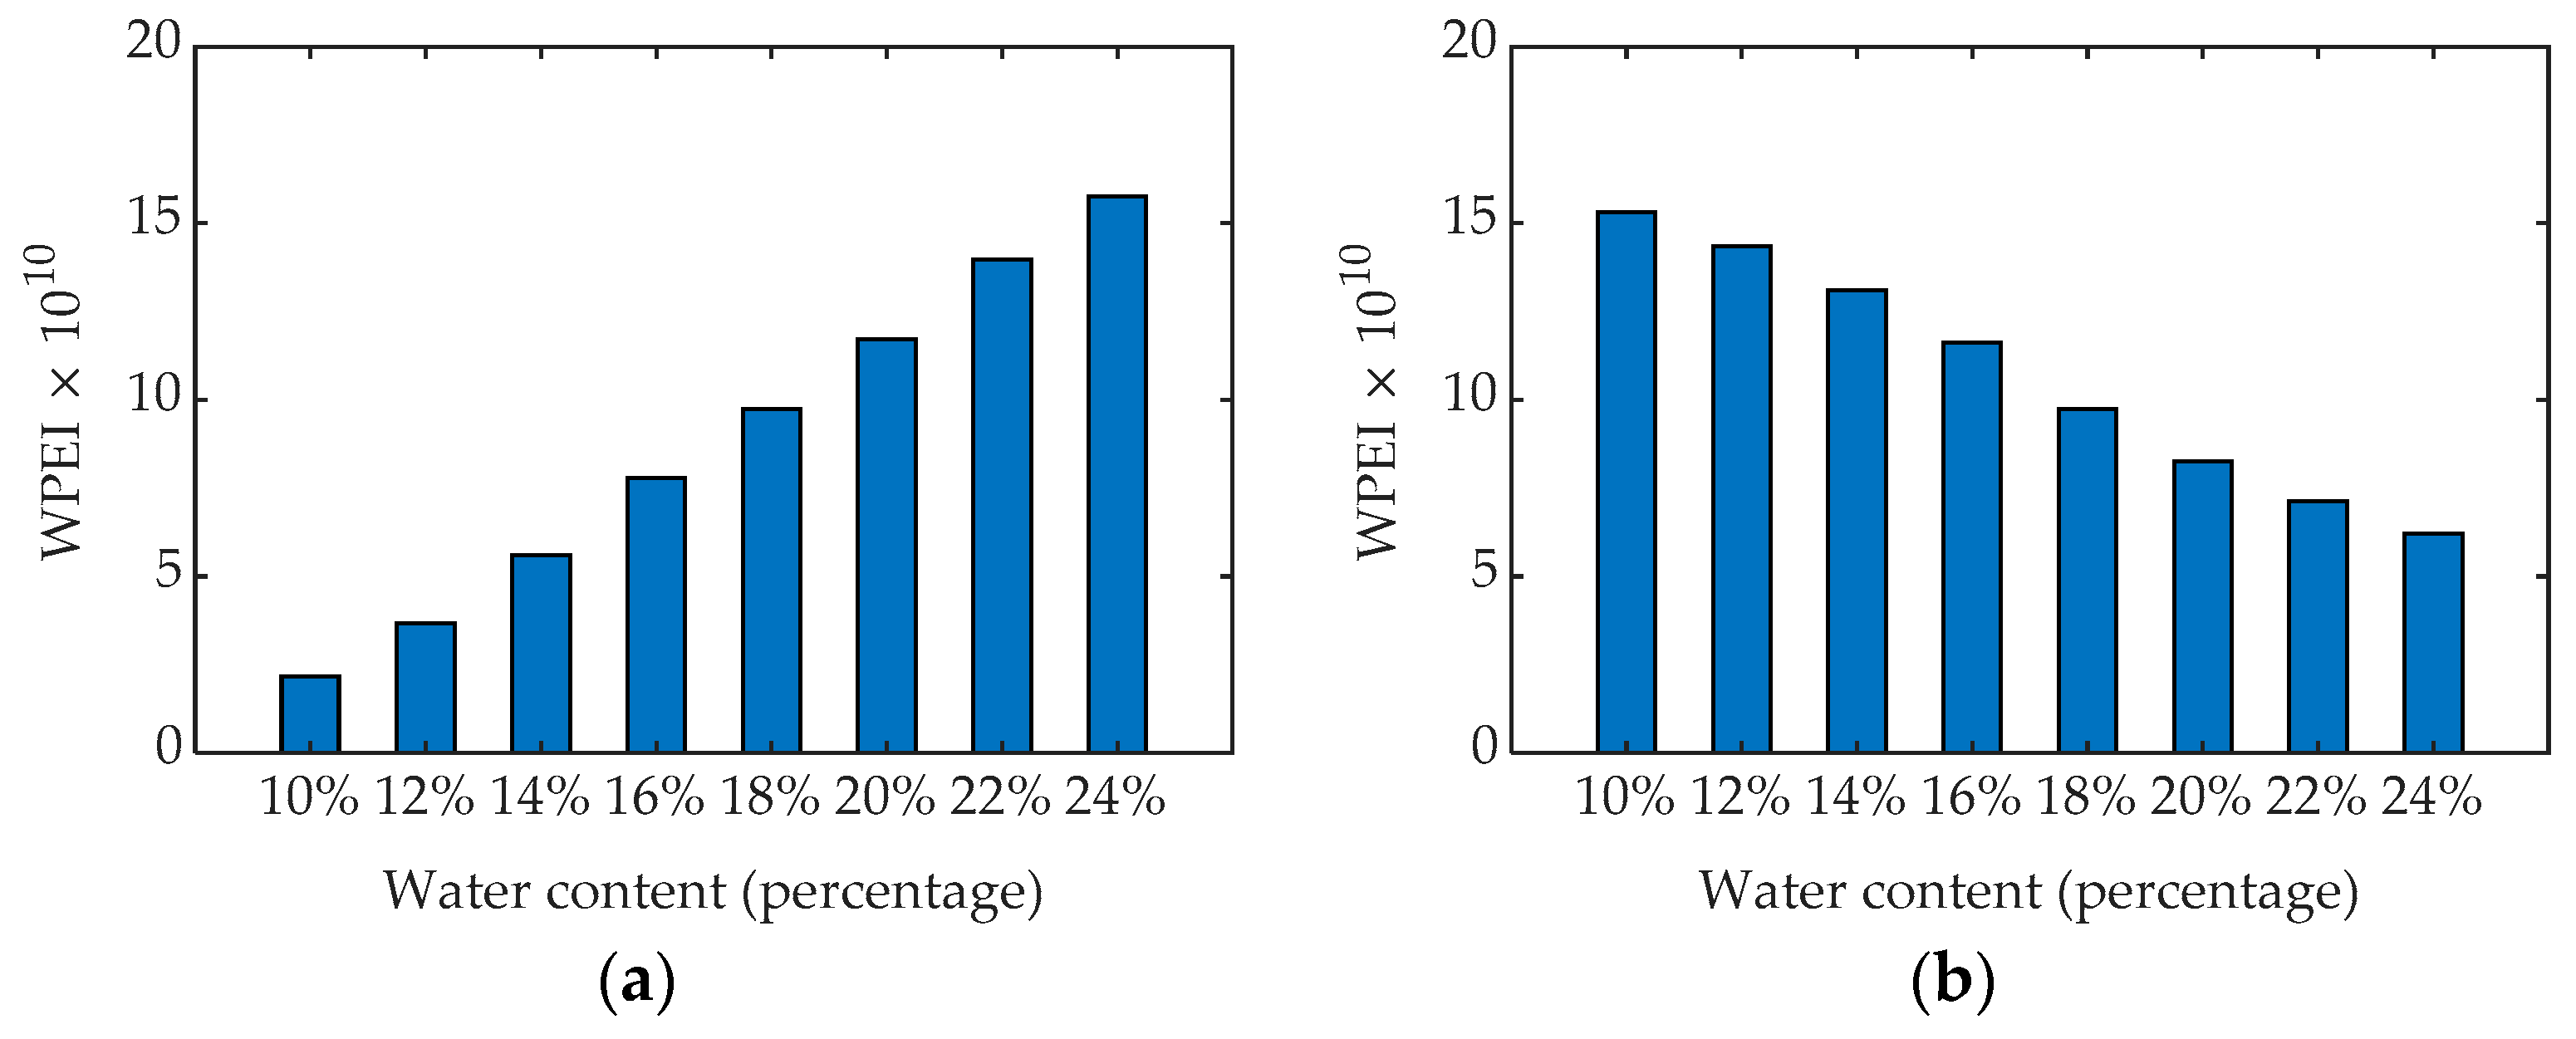
4.4. Comparative Analysis

To verify the feasibility of the wavelet basis defined in this paper in the wavelet packet analysis of the GPR signals, classical wavelet bases were also used to perform wavelet packet transform on the GPR single-channel signals, and the analysis results of the two were compared. Many researchers have shown that the wavelet bases of the Daubechies series have the characteristics of regularity, smoothness and tight support. As such, they have been widely used for the analysis and processing of GPR signals [70,71]. The db6 wavelet basis belongs to the wavelet of order 6 in the Daubechies wavelet series, and the db6 wavelet basis is an orthogonal wavelet which is tightly supported and asymmetric. The db6 wavelet basis (wavelet of order 6) was adapted to perform wavelet packet transform on the GPR single-channel signals, as shown in Figure 12. The wavelet packet coefficients were calculated using the WPEA method, and the WPEI with different water contents in the four model boxes were obtained. The results are shown in Figure 14. Figure 14a–d show the WPEI of the GPR single-channel signals after using the db6 wavelet packet transform in model boxes 1 to 4.
Figure 14 demonstrates that as the water content of the clay increases, the WPEI of the GPR signal shows a gradually increasing trend, even though this is not always consistent. In Figure 14a, the WPEI of the GPR signals gradually increases before the soil moisture content is 22%, but the WPEI decreases when the soil moisture content is 24%. In Figure 14b, before the soil moisture content reaches 18%, the WPEI of the GPR signals gradually increases. When the soil moisture content is 18%, the value of the WPEI reaches the maximum. After that, the value of the WPEI drops. In Figure 14c, the WPEI of the GPR signals basically shows an increasing trend before the soil moisture content reaches 20%. The value of the WPEI reaches the maximum when the soil moisture content is 20%, and then decreases. In Figure 14d, except for the fact that the soil water content is 20%, the WPEI of the GPR signals basically increases with the increase of the soil water content. As such, a linear function was used to curve-fit the WPEI of the clay with different water contents in the four model boxes. The obtained linear equations were: y 1 = 1.357 × 10 14 x 1 1.015 × 10 13 , y 2 = 5.205 × 10 13 x 2 3.761 × 10 12 , y 3 = 4.249 × 10 13 x 3 2.759 × 10 12 , and y 4 = 6.399 × 10 13 x 4 3.368 × 10 12 , and the correlation coefficients were 0.85, 0.74, 0.85 and 0.92, respectively. This shows that the use of db6 wavelet as the basis for wavelet packet transform does reveal that the WPEI gradually increases in clays with different water contents.

5. Discussion

Previous studies have mostly used the oven-drying method to determine the soil moisture content, which causes serious damage to the soil structure [10,11,12,13]. In addition, a limited number of on-site samples hinders the application range of this method [14]. In this study, the spatial distribution information of soil water content can be obtained using the GPR method. The use of GPR nondestructive testing methods to assess soil moisture content has an obvious advantage, that is, GPR can detect the moisture content over large areas in a short time [1,6].
The results of the forward simulation and indoor model experiments in this paper showed that the changes of the electromagnetic wave characteristics in GPR measurements were related to the measured values of moisture content in each soil sample, as indicated in the literature. Increasing the soil water content in the model box will change the relative permittivity and electrical conductivity in the soil, and affect the propagation speed of electromagnetic waves in the soil, thus impacting the GPR signal, which helps us to learn more about the physical properties of soil by analyzing the GPR signal [42,65].
By using wavelet packet transform with good time-frequency localization characteristics, the nonlinear and nonstationary GPR signal features may be extracted effectively [44,45,46,47]. However, there is no good similarity between the conventional wavelet bases and the GPR signals [49,50,51]. According to the time-frequency characteristics of GPR signals, this paper constructed the most suitable basis for wavelet packet analysis of GPR signals. Using this basis to perform wavelet packet transform of GPR signals helped us to better understand the propagation law of electromagnetic waves under different soil moisture conditions, and conveniently provided a way for us to study the relationship between the time-frequency characteristics of GPR signals and soil moisture content.
The accuracy of the GPR method used to estimate the soil moisture content was determined based on precise and appropriate empirical relationships [32,68]. In order to evaluate the moisture content of the soil, a fitting function between the WPEI of the GPR signals and the soil moisture content was established. In this way, the fitting function could be employed to evaluate the soil moisture content of roadbeds, slopes, earth dams and foundations over large areas. It is worth noting that the correlation coefficient between the WPEI of the GPR signal and the soil moisture content exceeded 0.85, which is better than or comparable to the results reported in related studies [20,39].
As shown in Figure 13, the WPEI of the GPR signals had a highly correlated linear relationship with the soil water content, but the result was obtained under perfect experimental conditions. It is also worth noting that the propagation characteristics of GPR electromagnetic waves in soil were easily affected by the physical and mechanical properties of the soil, including mineral composition, particle size, shape and gradation, density, compactness, porosity, degree of cementation, and stress history. In addition, the influences of groundwater level and seepage on the imaging results of GPR were not considered in this paper.

6. Conclusions

In this paper, a method for detecting soil water content using GPR technology is proposed. With the increase of soil water contents, the WPEI of the GPR signals also gradually increase. The WPEA method can be used to calculate the WPEI of the GPR signals to quantitatively evaluate the soil water content. The test results show that there is a highly correlated linear relationship between the WPEI and the soil water content, which can expand the application of GPR in slope monitoring, ground disaster prevention, subgrade, earth dam, and foundation compaction. In future work, the team will conduct research on the following three aspects: First, the soil water content detection experiment will be further refined to ensure that the soil density, compactness and porosity are basically constant when the soil water content changes. Second, a variety of soil samples will be used in model tests, including gravelly soil, sandy soil and cohesive soil, as well as soil samples of different particle sizes, shapes, and gradations. Third, according to the relationship between the WPEI of the GPR signals and the soil water content, a suitable model will be established to quantitatively evaluate the soil water content.

Author Contributions

S.Z., T.L. and G.F. contributed to the design and implementation of the research, S.Z., L.Z. and Y.G. contributed to the analysis, processing and interpretation of the data, S.Z., L.Z. and T.L. wrote the article with input from all authors. All authors have read and agreed to the published version of the manuscript.

Funding

This research received no external funding.

Institutional Review Board Statement

Not applicable.

Informed Consent Statement

Not applicable.

Data Availability Statement

Not applicable.

Acknowledgments

This work was supported by the National Natural Science Foundation of China (Nos. 51608183 and 52078061), the Natural Science Foundation of Hunan Province in China (Nos. 2018JJ3022 and 2021JJ50142).

Conflicts of Interest

The authors declare no conflict of interest.

References

  1. Shen, X.; Foster, T.; Baldi, H.; Dobreva, I.; Burson, B.; Hays, D.; Tabien, R.; Jessup, R. Quantification of soil organic carbon in biochar-amended soil using ground penetrating radar (GPR). Remote Sens. 2019, 11, 2874. [Google Scholar] [CrossRef] [Green Version]
  2. Zajícová, K.; Chuman, T. Application of ground penetrating radar methods in soil studies: A review. Geoderma 2019, 343, 116–129. [Google Scholar] [CrossRef]
  3. SU, S.L.; Singh, D.N.; Shojaei Baghini, M. A critical review of soil moisture measurement. Measurement 2014, 54, 92–105. [Google Scholar] [CrossRef]
  4. Venmans, A.A.M.; van de Ven, R.; Kollen, J. Rapid and non-intrusive measurements of moisture in road constructions using passive microwave radiometry and GPR—Full scale test. Procedia Eng. 2016, 143, 1244–1251. [Google Scholar] [CrossRef] [Green Version]
  5. Klewe, T.; Strangfeld, C.; Kruschwitz, S. Review of moisture measurements in civil engineering with ground penetrating radar—Applied methods and signal features. Constr. Build. Mater. 2021, 278, 122250. [Google Scholar] [CrossRef]
  6. Cui, X.; Zhang, Z.; Guo, L.; Liu, X.; Quan, Z.; Cao, X.; Chen, X. The root-soil water relationship is spatially anisotropic in shrub-encroached grassland in North China: Evidence from GPR investigation. Remote Sens. 2021, 13, 1137. [Google Scholar] [CrossRef]
  7. Liu, J.; Cheng, Y.S. A new approach of detecting and evaluation railway by using the train-mounted ground penetrating radar in China. Adv. Mater. Res. 2011, 243–249, 4351–4355. [Google Scholar] [CrossRef]
  8. Cao, Q.; Song, X.; Wu, H.; Gao, L.; Liu, F.; Yang, S.; Zhang, G. Mapping the response of volumetric soil water content to an intense rainfall event at the field scale using GPR. J. Hydrol. 2020, 583, 124605. [Google Scholar] [CrossRef]
  9. Tong, Z.; Gao, J.; Zhang, H. Innovative method for recognizing subgrade defects based on a convolutional neural network. Constr. Build. Mater. 2018, 169, 69–82. [Google Scholar] [CrossRef]
  10. Barca, E.; De Benedetto, D.; Stellacci, A.M. Contribution of EMI and GPR proximal sensing data in soil water content assessment by using linear mixed effects models and geostatistical approaches. Geoderma 2019, 343, 280–293. [Google Scholar] [CrossRef]
  11. Shamir, O.; Goldshleger, N.; Basson, U.; Reshef, M. Laboratory measurements of subsurface spatial moisture content by ground-penetrating radar (GPR) diffraction and reflection imaging of agricultural soils. Remote Sens. 2018, 10, 1667. [Google Scholar] [CrossRef] [Green Version]
  12. Galagedara, L.W.; Parkin, G.W.; Redman, J.D.; von Bertoldi, P.; Endres, A.L. Field studies of the GPR ground wave method for estimating soil water content during irrigation and drainage. J. Hydrol. 2005, 301, 182–197. [Google Scholar] [CrossRef]
  13. Tian, J.; Yue, J.; Philpot, W.D.; Dong, X.; Tian, Q. Soil moisture content estimate with drying process segmentation using shortwave infrared bands. Remote Sens. Environ. 2021, 263, 112552. [Google Scholar] [CrossRef]
  14. Reynolds, S.G. The gravimetric method of soil moisture determination Part I A study of equipment, and methodological problems. J. Hydrol. 1970, 11, 258–273. [Google Scholar] [CrossRef]
  15. Plati, C.; Loizos, A. Estimation of in-situ density and moisture content in HMA pavements based on GPR trace reflection amplitude using different frequencies. J. Appl. Geophys. 2013, 97, 3–10. [Google Scholar] [CrossRef]
  16. Khakiev, Z.; Shapovalov, V.; Kruglikov, A.; Morozov, A.; Yavna, V. Investigation of long term moisture changes in trackbeds using GPR. J. Appl. Geophys. 2014, 110, 1–4. [Google Scholar] [CrossRef]
  17. Walker, J.P.; Willgoose, G.R.; Kalma, J.D. In situ measurement of soil moisture: A comparison of techniques. J. Hydrol. 2004, 293, 85–99. [Google Scholar] [CrossRef]
  18. Zhang, J.; Lin, H.; Doolittle, J. Soil layering and preferential flow impacts on seasonal changes of GPR signals in two contrasting soils. Geoderma 2014, 213, 560–569. [Google Scholar] [CrossRef]
  19. Zreda, M.; Desilets, D.; Ferré, T.P.A.; Scott, R.L. Measuring soil moisture content non-invasively at intermediate spatial scale using cosmic-ray neutrons. Geophys. Res. Lett. 2008, 35, L21402. [Google Scholar] [CrossRef] [Green Version]
  20. Bablet, A.; Vu, P.V.H.; Jacquemoud, S.; Viallefont-Robinet, F.; Fabre, S.; Briottet, X.; Sadeghi, M.; Whiting, M.L.; Baret, F.; Tian, J. MARMIT: A multilayer radiative transfer model of soil reflectance to estimate surface soil moisture content in the solar domain (400–2500 nm). Remote Sens. Environ. 2018, 217, 1–17. [Google Scholar] [CrossRef] [Green Version]
  21. Verstraeten, W.W.; Veroustraete, F.; Feyen, J. Assessment of evapotranspiration and soil moisture content across different scales of observation. Sensors 2008, 8, 70–117. [Google Scholar] [CrossRef] [Green Version]
  22. Hu, F.; Wei, Z.; Zhang, W.; Dorjee, D.; Meng, L. A spatial downscaling method for SMAP soil moisture through visible and shortwave-infrared remote sensing data. J. Hydrol. 2020, 590, 125360. [Google Scholar] [CrossRef]
  23. Ferrazzoli, P.; Paloscia, S.; Pampaloni, P.; Schiavon, G.; Solimini, D.; Coppo, P. Sensitivity of microwave measurements to vegetation biomass and soil moisture content: A case study. IEEE Trans. Geosci. Remote Sens. 1992, 30, 750–756. [Google Scholar] [CrossRef]
  24. Qiu, J.; Crow, W.T.; Wagner, W.; Zhao, T. Effect of vegetation index choice on soil moisture retrievals via the synergistic use of synthetic aperture radar and optical remote sensing. Int. J. Appl. Earth Obs. 2019, 80, 47–57. [Google Scholar] [CrossRef]
  25. Kornelsen, K.C.; Coulibaly, P. Advances in soil moisture retrieval from synthetic aperture radar and hydrological applications. J. Hydrol. 2013, 476, 460–489. [Google Scholar] [CrossRef]
  26. Sonkamble, S.; Chandra, S. GPR for earth and environmental applications: Case studies from India. J. Appl. Geophys. 2021, 193, 104422. [Google Scholar] [CrossRef]
  27. Dinh, K.; Gucunski, N.; Zayed, T. Automated visualization of concrete bridge deck condition from GPR data. NDT E Int. 2019, 102, 120–128. [Google Scholar] [CrossRef]
  28. Fernandes, F.M.; Pais, J.C. Laboratory observation of cracks in road pavements with GPR. Constr. Build. Mater. 2017, 154, 1130–1138. [Google Scholar] [CrossRef]
  29. Lombardi, F.; Lualdi, M. Step-frequency ground penetrating radar for agricultural soil morphology characterisation. Remote Sens. 2019, 11, 1075. [Google Scholar] [CrossRef] [Green Version]
  30. Chen, Y.; Zhou, Z.; Wang, J.; Zhao, Y.; Dou, Z. Quantification and division of unfrozen water content during the freezing process and the influence of soil properties by low-field nuclear magnetic resonance. J. Hydrol. 2021, 602, 126719. [Google Scholar] [CrossRef]
  31. Wai-Lok Lai, W.; Dérobert, X.; Annan, P. A review of ground penetrating radar application in civil engineering: A 30-year journey from locating and testing to imaging and diagnosis. NDT E Int. 2018, 96, 58–78. [Google Scholar] [CrossRef]
  32. Roth, C.H.; Malicki, M.A.; Plagge, R. Empirical evaluation of the relationship between soil dielectric constant and volumetric water content as the basis for calibrating soil moisture measurement by TDR. J. Soil Sci. 1992, 43, 1–13. [Google Scholar] [CrossRef]
  33. Lunt, I.A.; Hubbard, S.S.; Rubin, Y. Soil moisture content estimation using ground-penetrating radar reflection data. J. Hydrol. 2005, 307, 254–269. [Google Scholar] [CrossRef]
  34. Shapovalov, V.; Yavna, V.; Kochur, A.; Khakiev, Z.; Sulavko, S.; Daniel, P.; Kruglikov, A. Application of GPR for determining electrophysical properties of structural layers and materials. J. Appl. Geophys. 2020, 172, 103913. [Google Scholar] [CrossRef]
  35. Benedetto, A. Water content evaluation in unsaturated soil using GPR signal analysis in the frequency domain. J. Appl. Geophys. 2010, 71, 26–35. [Google Scholar] [CrossRef]
  36. Bablet, A.; Viallefont-Robinet, F.; Jacquemoud, S.; Fabre, S.; Briottet, X. High-resolution mapping of in-depth soil moisture content through a laboratory experiment coupling a spectroradiometer and two hyperspectral cameras. Remote Sens. Environ. 2020, 236, 111533. [Google Scholar] [CrossRef]
  37. Rasol, M.A.; Pérez-Gracia, V.; Fernandes, F.M.; Pais, J.C.; Santos-Assunçao, S.; Santos, C.; Sossa, V. GPR laboratory tests and numerical models to characterize cracks in cement concrete specimens, exemplifying damage in rigid pavement. Measurement 2020, 158, 107662. [Google Scholar] [CrossRef]
  38. Rasol, M.A.; Pérez-Gracia, V.; Solla, M.; Pais, J.C.; Fernandes, F.M.; Santos, C. An experimental and numerical approach to combine ground penetrating radar and computational modeling for the identification of early cracking in cement concrete pavements. NDT E Int. 2020, 115, 102293. [Google Scholar] [CrossRef]
  39. Elshorbagy, A.; Parasuraman, K. On the relevance of using artificial neural networks for estimating soil moisture content. J. Hydrol. 2008, 362, 1–18. [Google Scholar] [CrossRef]
  40. Bai, H.; Sinfield, J.V. Improved background and clutter reduction for pipe detection under pavement using ground penetrating radar (GPR). J. Appl. Geophys. 2020, 172, 103918. [Google Scholar] [CrossRef]
  41. Szymczyk, P.; Szymczyk, M. Non-destructive building investigation through analysis of GPR signal by S-transform. Automat. Constr. 2015, 55, 35–46. [Google Scholar] [CrossRef]
  42. Tosti, F.; Patriarca, C.; Slob, E.; Benedetto, A.; Lambot, S. Clay content evaluation in soils through GPR signal processing. J. Appl. Geophys. 2013, 97, 69–80. [Google Scholar] [CrossRef]
  43. Ghasemi, F.S.A.; Abrishamian, M.S. A novel method for FDTD numerical GPR imaging of arbitrary shapes based on Fourier transform. NDT E Int. 2007, 40, 140–146. [Google Scholar] [CrossRef]
  44. Ling, T.; Liu, H.; Gong, S.; Huang, F. Construction and application of a new biorthogonal wavelet basis for a quantitative analysis of GPR signals. J. Appl. Geophys. 2019, 170, 103837. [Google Scholar] [CrossRef]
  45. Javadi, M.; Ghasemzadeh, H. Wavelet analysis for ground penetrating radar applications: A case study. J. Geophys. Eng. 2017, 14, 1189–1202. [Google Scholar] [CrossRef]
  46. Lu, G.; Zhao, W.; Forte, E.; Tian, G.; Li, Y.; Pipan, M. Multi-frequency and multi-attribute GPR data fusion based on 2-D wavelet transform. Measurement 2020, 166, 108243. [Google Scholar] [CrossRef]
  47. Baili, J.; Lahouar, S.; Hergli, M.; Al-Qadi, I.L.; Besbes, K. GPR signal de-noising by discrete wavelet transform. NDT E Int. 2009, 42, 696–703. [Google Scholar] [CrossRef]
  48. Artagan, S.S.; Borecky, V. Advances in the nondestructive condition assessment of railway ballast: A focus on GPR. NDT E Int. 2020, 115, 102290. [Google Scholar] [CrossRef]
  49. Ni, S.; Huang, Y.; Lo, K.; Lin, D. Buried pipe detection by ground penetrating radar using the discrete wavelet transform. Comput. Geotech. 2010, 37, 440–448. [Google Scholar] [CrossRef]
  50. Zhang, L.; Ling, T.; Yu, B.; Huang, F.; Zhang, S. Intensive interferences processing for GPR signal based on the wavelet transform and F-K filtering. J. Appl. Geophys. 2021, 186, 104273. [Google Scholar] [CrossRef]
  51. Verma, V.S.; Kumar Jha, R. Improved watermarking technique based on significant difference of lifting wavelet coefficients. Signal. Image Video Process. 2014, 9, 1443–1450. [Google Scholar] [CrossRef]
  52. Li, H.; Wang, Q.; Wu, L. A novel design of lifting scheme from general wavelet. IEEE Trans. Signal Process. 2001, 49, 1714–1717. [Google Scholar]
  53. Ling, T.; Zhang, L.; Liu, H.; Huang, F.; Gu, D.; Yu, B. Quantitative identification and analysis of tunnel lining defect based on the wavelet lifting scheme theory. China J. Highw. Transp. 2019, 32, 197–204. [Google Scholar]
  54. Daubechies, I.; Sweldens, W. Factoring wavelet transforms into lifting steps. J. Fourier Anal. Appl. 1998, 4, 247–269. [Google Scholar] [CrossRef]
  55. Tzanis, A. The curvelet transform in the analysis of 2-D GPR data: Signal enhancement and extraction of orientation-and-scale-dependent information. J. Appl. Geophys. 2015, 115, 145–170. [Google Scholar] [CrossRef]
  56. Ling, T.; Zhang, L.; Huang, F.; Gu, D.; Yu, B.; Zhang, S. OMHT method for weak signal processing of GPR and its application in identification of concrete micro-crack. J. Cent. South Univ. 2020, 26, 3057–3065. [Google Scholar] [CrossRef]
  57. Liao, K.; Lai, X.; Zhou, Z.; Zhu, Q. Applying fractal analysis to detect spatio-temporal variability of soil moisture content on two contrasting land use hillslopes. Catena 2017, 157, 163–172. [Google Scholar] [CrossRef]
  58. Kong, Q.; Chen, H.; Mo, Y.L.; Song, G. Real-time monitoring of water content in sandy soil using shear mode piezoceramic transducers and active sensing-A feasibility study. Sensors 2017, 17, 2395. [Google Scholar] [CrossRef] [Green Version]
  59. Xu, B.; Li, B.; Song, G. Active debonding detection for large rectangular CFSTs based on wavelet packet energy spectrum with piezoceramics. J. Struct. Eng. 2013, 139, 1435–1443. [Google Scholar] [CrossRef]
  60. Wang, Z.; Wei, L.; Cao, M. Damage quantification with embedded piezoelectric aggregates based on wavelet packet energy analysis. Sensors 2019, 19, 425. [Google Scholar] [CrossRef] [Green Version]
  61. Lu, W.; Li, P.; Chen, M.; Zhou, C.; Shu, D. Comparison of vibrations induced by excavation of deep-buried cavern and open pit with method of bench blasting. J. Cent. South Univ. 2011, 18, 1709–1718. [Google Scholar] [CrossRef]
  62. Chen, G.; Li, Q.; Li, D.; Wu, Z.; Liu, Y. Main frequency band of blast vibration signal based on wavelet packet transform. Appl. Math. Model. 2019, 74, 569–585. [Google Scholar] [CrossRef]
  63. Jiang, T.; Kong, Q.; Patil, D.; Luo, Z.; Huo, L.; Song, G. Detection of debonding between fiber reinforced polymer bar and concrete structure using piezoceramic transducers and wavelet packet analysis. IEEE Sens. J. 2017, 17, 1992–1998. [Google Scholar] [CrossRef]
  64. Luo, T.X.H.; Lai, W.W.L.; Giannopoulos, A. Forward modelling on GPR responses of subsurface air voids. Tunn. Undergr. Space Tech. 2020, 103, 103521. [Google Scholar] [CrossRef]
  65. Ercoli, M.; Di Matteo, L.; Pauselli, C.; Mancinelli, P.; Frapiccini, S.; Talegalli, L.; Cannata, A. Integrated GPR and laboratory water content measures of sandy soils: From laboratory to field scale. Constr. Build. Mater. 2018, 159, 734–744. [Google Scholar] [CrossRef]
  66. Warren, C.; Giannopoulos, A.; Giannakis, I. gprMax: Open source software to simulate electromagnetic wave propagation for ground penetrating radar. Comput. Phys. Commun. 2016, 209, 163–170. [Google Scholar] [CrossRef] [Green Version]
  67. Giannopoulos, A. Modelling ground penetrating radar by GprMax. Constr. Build. Mater. 2005, 19, 755–762. [Google Scholar] [CrossRef]
  68. Topp, G.C. Electromagnetic determination of soil water content: Measurements in coaxial transmission lines. Water Resour. Res. 1980, 16, 574–582. [Google Scholar] [CrossRef] [Green Version]
  69. Liu, J. Methods of Detection on Moisture of Railway Subgrage by Using the Ground Penetrating Radar. Ph.D. Thesis, China University of Mining and Technology, Beijing, China, 2015. [Google Scholar]
  70. Cao, M.; Qiao, P. Integrated wavelet transform and its application to vibration mode shapes for the damage detection of beam-type structures. Smart Mater. Struct. 2008, 17, 055014. [Google Scholar] [CrossRef]
  71. Yi, T.H.; Li, H.N.; Zhao, X.Y. Noise smoothing for structural vibration test signals using an improved wavelet thresholding technique. Sensors 2012, 12, 11205–11220. [Google Scholar] [CrossRef] [Green Version]
Figure 1. Construction of biorthogonal wavelet basis suitable for GPR signal waveform.
Remotesensing 13 05047 g001
Figure 2. Decomposition process of a three-level wavelet packet.
Remotesensing 13 05047 g002
Figure 3. Schematic diagram of GPR detection imaging.
Remotesensing 13 05047 g003
Figure 4. A cavity model buried in the stratum for GPR forward simulation and the simulation result. (a) Cavity model; (b) GPR time profile of cavity model.
Remotesensing 13 05047 g004
Figure 5. Results of GPR forward simulation of soils with different water contents. (a) water content = 10%; (b) water content = 12%; (c) water content = 14%; (d) water content = 16%; (e) water content = 18%; (f) water content = 20%; (g) water content = 22%; (h) water content = 24%.
Remotesensing 13 05047 g005
Figure 6. WPEI of cavity-filled soil with increasing water contents.
Remotesensing 13 05047 g006
Figure 7. Relationship between the WPEI and the soil water content. (a) Changing trend of the WPEI as the relative dielectric constant increases for soils, (b) changing trend of the WPEI as the electrical conductivity increases for soils.
Remotesensing 13 05047 g007
Figure 8. Clay samples with different water contents. (a) water content = 10%; (b) water content = 12%; (c) water content = 14%; (d) water content = 16%; (e) water content = 18%; (f) water content = 20%; (g) water content = 22%; (h) water content = 24%.
Remotesensing 13 05047 g008
Figure 9. Layout drawing of the four model boxes in the sand box.
Remotesensing 13 05047 g009
Figure 10. GPR imaging results of the clay in the four model boxes. (a) water content = 10%; (b) water content = 12%; (c) water content = 14%; (d) water content = 16%; (e) water content = 18%; (f) water content = 20%; (g) water content = 22%; (h) water content = 24%.
Remotesensing 13 05047 g010aRemotesensing 13 05047 g010b
Figure 11. GPR time profiles after conventional processing. (a) water content = 10%; (b) water content = 12%; (c) water content = 14%; (d) water content = 16%; (e) water content = 18%; (f) water content = 20%; (g) water content = 22%; (h) water content = 24%.
Remotesensing 13 05047 g011
Figure 12. GPR single-channel signals of four model boxes with different water contents. (a) Model box 1; (b) Model box 2; (c) Model box 3; (d) Model box 4.
Remotesensing 13 05047 g012
Figure 13. Regression relationship between the WPEI obtained using the WPEA method and the soil water content in the four model boxes. (a) Model box 1; (b) Model box 2; (c) Model box 3; (d) Model box 4.
Remotesensing 13 05047 g013aRemotesensing 13 05047 g013b
Figure 14. Regression relationship between the WPEI obtained by using db6 wavelet packet transform and the soil water content in four model boxes. (a) Model box 1; (b) Model box 2; (c) Model box 3; (d) Model box 4.
Remotesensing 13 05047 g014
Table 1. Physical properties of soil with increasing moisture content.
Water Content10%12%14%16%18%20%22%24%
Relative dielectric constant5.3436.1156.9837.9418.98710.11611.32512.611
Conductivity (μS/cm)88.681126.085180.261258.134368.670523.129735.2721021.533
Electromagnetic wave velocity (m/ns)0.1290.1210.1130.1060.1000.0940.0890.084
Publisher’s Note: MDPI stays neutral with regard to jurisdictional claims in published maps and institutional affiliations.

