Abstract
Leaf area index (LAI) is an essential indicator of crop development and growth. For many agricultural applications, satellite-based LAI estimates at the farm-level often require near-daily imagery at medium to high spatial resolution. The combination of data from different ongoing satellite missions, Sentinel 2 (ESA) and Landsat 8 (NASA), provides this opportunity. In this study, we evaluated the leaf area index generated from three methods, namely, existing vegetation index (VI) relationships applied to Harmonized Landsat-8 and Sentinel-2 (HLS) surface reflectance produced by NASA, the SNAP biophysical model, and the THEIA L2A surface reflectance products from Sentinel-2. The intercomparison was conducted over the agricultural scheme in Bekaa (Lebanon) using a large set of in-field LAIs and other biophysical measurements collected in a wide variety of canopy structures during the 2018 and 2019 growing seasons. The major studied crops include herbs (e.g., cannabis: Cannabis sativa, mint: Mentha, and others), potato (Solanum tuberosum), and vegetables (e.g., bean: Phaseolus vulgaris, cabbage: Brassica oleracea, carrot: Daucus carota subsp. sativus, and others). Additionally, crop-specific height and above-ground biomass relationships with LAIs were investigated. Results show that of the empirical VI relationships tested, the EVI2-based HLS models statistically performed the best, specifically, the LAI models originally developed for wheat (RMSE:1.27), maize (RMSE:1.34), and row crops (RMSE:1.38). LAI derived through European Space Agency’s (ESA) Sentinel Application Platform (SNAP) biophysical processor underestimated LAI and provided less accurate estimates (RMSE of 1.72). Additionally, the S2 SeLI LAI algorithm (from SNAP biophysical processor) produced an acceptable accuracy level compared to HLS-EVI2 models (RMSE of 1.38) but with significant underestimation at high LAI values. Our findings show that the LAI-VI relationship, in general, is crop-specific with both linear and non-linear regression forms. Among the examined indices, EVI2 outperformed other vegetation indices when all crops were combined, and therefore it can be identified as an index that is best suited for a unified algorithm for crops in semi-arid irrigated regions with heterogeneous landscapes. Furthermore, our analysis shows that the observed height-LAI relationship is crop-specific and essentially linear with an R2 value of 0.82 for potato, 0.79 for wheat, and 0.50 for both cannabis and tobacco. The ability of the linear regression to estimate the fresh and dry above-ground biomass of potato from both observed height and LAI was reasonable, yielding R2: ~0.60.
1. Introduction
One of the most fundamental vegetation biophysical parameters is the Leaf Area Index (LAI), defined as a dimensionless measure of the one-sided leaf area (m2) per unit ground surface area (m2) [1,2]. LAI has long been reported as a good indicator for several agronomic, ecological, and hydrological applications such as vegetation status [3], atmospheric circulation modeling [4], photosynthesis and biomass accumulation [5], evapotranspiration [6], hydrological modeling [6], climate change assessment [7], and predicting rainfall interception [8]. LAI is also crucial in several land surface models [9,10], crop yield models, and yield estimation [11,12].
Remote sensing has proved to be a promising alternative tool for estimating crop LAI quickly over large areas, and without damaging the canopy [13,14]. However, remote sensing requires extensive validation with ground truth data collected over different landcover types [15]. The retrieval of crop biophysical variables from remote sensing falls into two categories: empirical and physical modeling approaches. The simplest method of estimating LAI from remote sensing is by establishing an empirical relationship between the remotely sensed vegetation indices (VIs) and measured LAI, referred to as the LAI-VI approach [16,17]. Vegetation indices are computed based on the reflectance in two or more spectral bands and reflect biophysical characteristics of the plant canopy such as greenness, biomass, and LAI [18,19]. VIs that have shown good correlation with LAI include the normalized difference vegetation index (NDVI) [20], soil adjusted vegetation index (SAVI) [21], enhanced vegetation index (EVI) [22], and enhanced vegetation index 2 (EVI2) [23]. Correlations have been computed using various mathematical forms, such as linear, logarithmic, polynomial, or exponential functions of VIs [5,24].
On the other hand, the physical modeling approach involves the use of radiative transfer models (RTMs) to simulate the canopy spectral reflectance, and the inversion of RTMs to obtain the required parameters [25,26]. Because the inversion of an RTM model can be very computing-intensive, often precomputed look-up-tables (LUTs) are employed for operational use, as in the MODIS LAI product main algorithm [27]. Another modeling technique is the retrieval of LAI biophysical parameters based on neural networks, such as the algorithm implemented in the Sentinel Application Platform (SNAP) biophysical processor tool [28] developed by the European Space Agency (ESA). While SNAP is widely used, the accuracy of the LAI product generated using the SNAP software has not been thoroughly assessed [29,30]. SNAP LAI estimates need to be evaluated over a wide range of crop varieties to assess the general utility of this retrieval approach.
Despite the advances in technology that allow remote sensing to play a vital role in LAI estimation, the trade-off between the temporal and spatial resolution [31] has limited the ability of a single sensor to capture crop LAI dynamics and heterogeneity at the farm level. Several studies pointed out that medium spatial resolution products (e.g., Landsat 30 m spatial resolution) potentially miss observations at critical growth stages due to their long revisit time (16 days) [32,33,34]. Rigorous LAI monitoring, especially during fast-developing crop growth stages, requires daily or near-daily imagery at medium to high spatial resolution (10–30 m) [35,36]. The proven compatibility and good registration between Landsat 8 and Sentinel-2 imaging enable combined LAI estimation at near-daily timesteps and medium resolution [37,38]. In this context, NASA has developed the Harmonized Landsat and Sentinel-2 (HLS) product [39]. HLS consists of surface reflectance (SR) data from the Landsat-8 Operational Land Imager (OLI) and the Sentinel-2 Multi-Spectral Instrument (MSI). The advantage of the HLS product is that it can support near-real-time vegetation monitoring at a medium spatial resolution (<30 m) [39].
THEIA is a French national multi-agency organization that promotes the use of satellite data by public policy actors and scientific community. The THEIA Land Data Center produces and distributes L2A products, including Sentinel-2A and B. S2 L2A data are corrected for atmospheric effects using the MACCS-ATCOR Joint Algorithm (MAJA) [40,41,42,43]. This processor uses multi-temporal information to detect clouds (and cloud shadows) and to estimate the optical properties of the atmosphere. Compared to other S2 atmospheric correction algorithms, MAJA has been shown to achieve better performances for certain land cover types (asphalt, grass, shrubs, pasture, and bare soil) [44]. However, the quality of the S2 images corrected using the MAJA method still needs to be tested over more landcover types and measurement sites.
The present work aims to perform a comparative analysis between LAI generated from three methods: existing vegetation index (VI) relationships applied to Harmonized Landsat-8 and Sentinel-2 (HLS) surface reflectance produced by NASA, the SNAP biophysical model, and L2A THEIA product from Sentinel-2. Evaluation is conducted using ground measurements of LAI conducted in multiple crops in the Bekaa Valley, Lebanon, over two growing seasons (2018–2019). We evaluate whether existing LAI-VI models, initially developed for particular crops, can be applied to the crops sampled in this research irrespective of their limitation to “one place, one time, one equation.” Finally, we establish new LAI-VI site and crop-specific empirical relationships calibrated to local conditions and investigate the crop-specific height and above-ground biomass relationships with LAI.
2. Materials and Methods
2.1. Study Area and Surveyed Crops
The study area is focused on the agricultural scheme of the Bekaa Valley of Lebanon, which is an almost flat plain between two mountain ranges (Figure 1). The total cropland area in the valley is 118,000 ha [45], which accounts for 42% of the total cultivated area in Lebanon [46,47]. The agricultural sector in Lebanon is a key contributor to the country’s agri-food industry. Most of the rural population in the underprivileged regions of Lebanon (Akkar, Dinniyeh, the Northern Bekaa, and the South) rely on agriculture activities, which account for 80% of the local GDP [48]. The study area covers Baalbek (characterized by semi-arid climate) in the 2019 growing season and the North to West Bekaa (characterized by the Mediterranean climate) in the 2018 growing season. Field campaigns were conducted within the study area to acquire ground LAI measurements in several different crop types. In total, 451 fields were surveyed representing a total cultivated area of 5606 ha. A summary of the fields and crops surveyed and measurements collected over the two growing seasons is given in Table 1. Of the crops studied here, wheat and potato are the two primary strategic cash crops of the Bekaa Valley. In addition, vegetables cover around 20% of the agricultural lands in Lebanon [49]. Due to the involvement of large numbers of people in the cultivation, processing, and trading of tobacco, this crop plays a vital role in the economic and financial sector of the country. Of the total tobacco produced, 43% is produced in the Bekaa and the north of Lebanon [50]. Additionally, cannabis is widely cultivated in Central and Northern Bekaa, with more than 7000 ha planted annually [51]. Cannabis has a high return value compared to other crops representing a major source of income for some farmers in the Bekaa Valley.
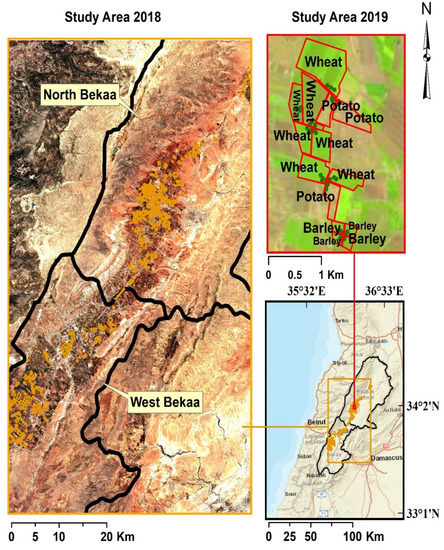
Figure 1.
Location of the study area within the Bekaa Valley. Fields surveyed during the 2018 field campaigns are outlined in light orange, while fields surveyed in 2019 are outlined in red. LAI, canopy height, and above-ground biomass sampling sites (labeled in dark green) for the 2019 growing season, the color version of the study area map is available online.

Table 1.
Surveyed crop groups during the 2018–2019 growing seasons, the number of fields and their average areas.
2.2. Biophysical Measurements
2.2.1. Leaf Area Index Measurements
In situ measurements of LAI were collected in the 2018 and 2019 growing seasons using the SS1 SunScan Canopy Analysis System (Delta-T Devices). This instrument consists of 64 sensors that measure photosynthetic active radiation (PAR) with an accuracy of ±10%, embedded in a 1 m long portable probe (Figure 2a) with an external beam fraction sensor (BFS) (Figure 2b) [52]. The BFS is used to monitor the light incident on the canopy at the same time as the below-canopy measurements are taken. The SS1 requires several inputs, including the ellipsoidal leaf angle distribution (ELADP), longitude, latitude, and local timing (Figure 2a). Typical ELADP values used in this study are summarized in Table A1 in Appendix A. LAI measurements were taken during the same day as a Landsat 8 or Sentinel 2 satellite overpass to calibrate and evaluate the relationship between LAI and the vegetation indices to be tested. Some measurements were taken within ±2 h of the overpass, and others continued to the rest of the day.
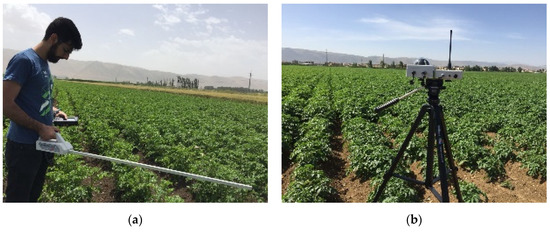
Figure 2.
LAI Measurements: (a) Data inputs to the SS1 SunScan Canopy Analysis System, (b) beam fraction sensor (BFS) installed in a potato field.
Two different patterns for data collection strategies were used in 2018 and 2019. In 2018, LAI measurements were collected over the full Bekaa Valley study area in Figure 1. To capture within-field variability, five measurements were taken in each field, and the average value was taken to be representative of the field-scale. For each field, the measurements were acquired at five different locations ~5 m apart following the pattern schematized in Figure 3 (points A, B, C, D, and E), starting from the center of the field. Measurements were collected away from the field boundaries to avoid edge effects.
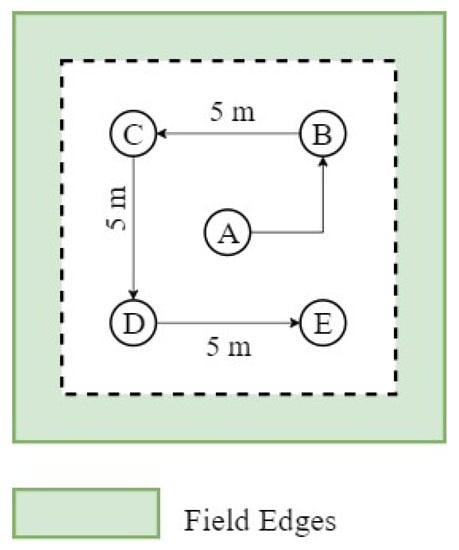
Figure 3.
LAI measurement approach for each visited field during 2018 growing season.
For the 2019 growing season, extending from April to July, the sampling focus was on monitoring time-series LAI dynamics of three significant crops in the Bekaa regions: wheat, barley, and potato. A total of 42 predefined sampling sites in North Bekaa with recorded GPS coordinates were selected, and LAI was measured at these locations on each Landsat 8 or S2 overpass date. The sampling sites include 21 locations in wheat fields, 12 locations in barley fields, and 9 locations in potato fields.
2.2.2. Canopy Height and Above-Ground Dry and Fresh Biomass Measurements
Measurements of above-ground crop biomass and height were also collected at a subset of the LAI sampling sites in 2018 and 2019. A quadrate (0.5 m2 × 0.5 m2) was randomly thrown in the field, and the vegetation within the frame of the quadrate was clipped. Three samples of potato biomass were taken from each field, and the obtained results were averaged. The above-ground plant component was oven-dried at 75 °C for 48 h to a constant weight and then weighed. Above-ground biomass measurements were collected in the potato fields in 2019. Crop height was directly measured for the tobacco and cannabis crops in 2018, and the potato crop in 2019 for the plant samples within the frame. Figure 1 shows the biophysical parameters sampling sites (labeled in dark green) for the 2019 growing season. Crop height and LAI field sampling at different growing stages of a wheat culture studied during the 2019 growing season is shown in Figure 4.
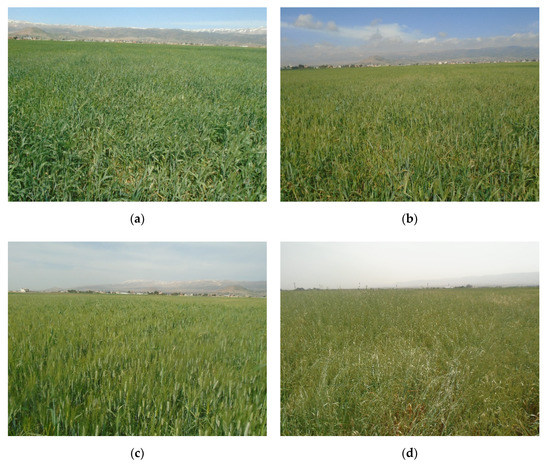
Figure 4.
Crop height and LAI field sampling at different growing stages of a wheat culture studied during the 2019 growing season: (a) DOY: 122, LAI: 2.3, height: 45 cm, (b) DOY: 131, LAI: 2.97, height: 73 cm, (c) DOY: 138, LAI: 3.03, height: 78 cm, (d) DOY: 141, LAI: 3.23, height: 58 cm.
2.3. Surface Reflectance Data
2.3.1. Satellite Datasets
Satellite data were obtained for dates when measurements were collected in the field during the 2018 and 2019 growing seasons. Additional scenes were collected in 2019 to develop the time-series of biophysical retrievals. A total of 17 and 24 HLS images (Tile T36 SYC) were used for the 2018 and 2019 growing seasons, respectively. HLS has adopted the tiling system used by Sentinel-2. The tiles are in the Universal Transverse Mercator (UTM) projection and are nominally 110 km on a side. The tiling system is aligned with the UTM-based Military Grid Reference System (MGRS). The first two numbers of a tile name (such as 36SYC) correspond to the UTM zone, 6° of longitude in width. Each zone is divided into latitude bands of 8°. This is represented by a letter, S in the tile covering the study area. Finally, each 6° × 8° polygon (grid zone) is further divided into 110 km tiles, from west to east, 4th letter (Y in this case), and south to north, 5th letter (C in this case). For further information on the output projection and gridding, readers are referred to the HLS product user’s guide [39]. Figure 5 represents a summary of the satellite data used in the study.
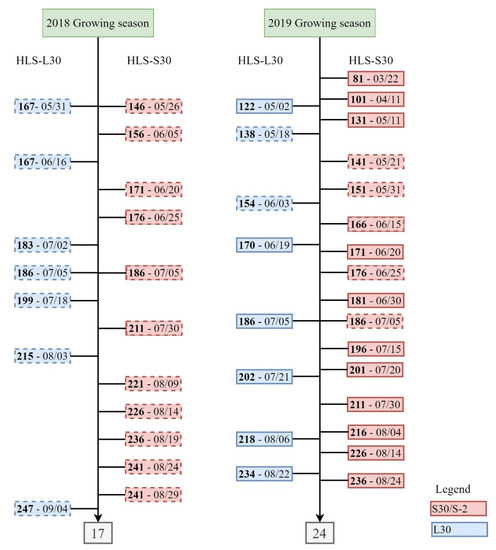
Figure 5.
Harmonized Landsat-8 and Sentinel-2 (HLS) scenes used in the study, showing the day of year (DOY) (in bold) with the respective date of HLS products (Landsat 8 (L30) images blue boxes, Sentinel-2 (S30) red boxes), with the respective number of total images in grey boxes. S2 images from THEIA were also obtained on the S2 dates (red boxes). Dashed boxes represent the HLS scenes used to validate LAI, whereas full boxes indicate scenes used to generate crop biophysical variable time-series during the 2019 growing season.
Imagery from the newly released harmonized surface reflectance product (HLS, v1.4) was downloaded for these dates from May to September in 2018 and March to August in 2019. HLS represents a synergy of Landsat-8 (L30) and Sentinel-2 (S30) data with 30 m resolution [39]. This harmonized data product is based on the framework established by Claverie et al. [39], which encompasses several steps: resampling Sentinel-2 to 30 m, a bidirectional reflectance distribution function (BRDF) normalization for both Landsat 8 and Sentinel 2 datasets, a geographical registration for the two products, and a bandpass adjustment using the Landsat-8 band passes as a reference to which the Sentinel-2 spectral bands are adjusted. The resulting data products, S-30 MSI and L-30 OLI consist of surface reflectance data that are consistent in terms of spectral response and spatial resolution. A detailed representation of the HLS processing methodology can be found in [39].
Atmospherically corrected Level 2-A surface reflectance images from Sentinel-2 were also downloaded from the THEIA website at the French Land Data Center (https://www.theia-land.fr/) on the S30 dates listed in Figure 5. These were used to generate LAI with the Sentinel LAI index and SNAP software, designed specifically for use with THEIA SR data products. The goal was to use the LAI biophysical product from Sentinel-2 (using SNAP and S2 index) as a benchmark to compare to the LAI generated using HLS.
2.3.2. Cloud Masking
Cloud masking is required to identify high-quality land surface reflectance values with low uncertainties. The HLS product contains, in addition to the surface reflectance bands, a level-2-pixel quality assurance band. This band provides information about the cloud status in each pixel (clear, shadow, low, medium, and high confidence), snow/ice, and water pixels. The Landsat-8 cloud mask is derived from both the mask in the USGS Landsat TOA data and the Land Collection 1 Surface Reflectance Code (LaSRC) atmospheric correction tool. However, the Sentinel-2 cloud mask is a union of the Fmask algorithm, which has been adapted from [53] and the LaSRC mask. The quality assessment band (QA) bits of the HLS Landsat and Sentinel-2 were decoded with a loop using simple integer arithmetic, and its output was used to mask cloud shadow, adjacent cloud, cloud, and cirrus from the processed images.
As for the L2A products from THEIA, atmospheric correction, and detection of clouds and cloud shadows are performed using the Multi-sensor Atmospheric Correction and Cloud Screening (MACCS) processor (https://labo.obs-mip.fr/multitemp/?p=6203). The L2A 10-m cloud mask product was downloaded and used from the mask directory.
2.3.3. Vegetation Indices
Vegetation indices (VIs) are widely used in the assessment of several biophysical parameters including the fraction of photosynthetically active radiation absorbed by the vegetation (FAPAR) [54], green vegetation fraction [55], leaf area index (LAI) [56], and canopy chlorophyll content [57]. In this study, we use several indices for the evaluation of LAI, including the soil adjusted vegetation index (SAVI), normalized difference vegetation index (NDVI), enhanced vegetation index 2 (EVI2), and the Sentinel-2 LAI Index (SeLI). SAVI, NDVI, and EVI2 are a combination of visible and near-infrared bands, while SeLI is a combination of near-infrared and the red edge bands of the Sentinel 2 imagery.
NDVI was selected as one of the simplest and earliest VI. Compared to NDVI, both SAVI and EVI2 are less sensitive to soil background [58], and EVI2 is less saturated at high LAI ranges [58]. For SAVI, we use L = 0.5 (USGS, 2017b). SeLI is a new robust LAIgreen index developed by Pasqualotto et al. [30] and computed from near-infrared and red edge bands. The red-edge region, between 690 and 750 nm, represents the region between the maximum absorption in the red wavelength and maximum reflection in the near-infrared wavelength by the plant [59,60]. Several researchers emphasize the importance of the red edge band in the estimation of LAIgreen. Equations for the VIs used in this study are presented in Table 2, along with primary citations.

Table 2.
References and equations of selected VIs to be evaluated in this study.
In the literature, vegetation indices are often calculated from top-of-atmosphere reflectance. In this study, however, we calculate the VIs (NDVI, SAVI, and EVI2) using the HLS (Harmonized Landsat Sentinel-2) 30-m surface reflectance products derived from both Landsat-8 L1T products and Sentinel-2 MSI L1C data. Furthermore, we calculated SeLI from the L2A THEIA surface reflectance product.
2.4. LAI Models
2.4.1. Existing VI-Based LAI Models
Several existing VI-based LAI models were used to create spatial LAI layers for the study area (Table 3). These models were evaluated with the collected LAI measurements to determine the formula with the best performance over the sampled crop types. The models evaluated include relationships with NDVI (linear, exponential, and polynomial of third-order fits), SAVI (third-order polynomial and logarithmic fits), EVI2 (square root fits), and linear fits to SeLI. The relationships between LAI and different studied vegetation indices, as presented in literature, are summarized in Table 3.

Table 3.
A summary of the equations for the selected existing vegetation index-based LAI models evaluated in this study, along with the satellite and reflectance type used in the cited references.
2.4.2. SNAP Model
In addition to the VI-based LAI models described in Section 2.4.1, LAI was produced from S2 THEIA surface reflectance data using Sentinel Application Platform toolbox (SNAP) software. SNAP provides a “Biophysical Processor” tool in the thematic land processing pull-down menu, used for the retrieval of several biophysical variables, including LAI. The algorithm is based on neural networks that are trained to estimate the canopy characteristics [66]. LAI can be directly retrieved for each pixel based on a pre-trained neural net. The neural nets are trained using well-known RTM (PROSAIL: PROSPECT [67] + SAIL [26]) as described in [28]. The ANN algorithm requires eight S2 spectral wavebands (B3–B7, B8a, B11, and B12) as input. The eight bands are resampled to 20 m to preserve the red-edge region in the S-2 scenes. LAI, with the quality indicators of the used dataset, were thus automatically obtained with the finest possible resolution.
2.5. Data Analysis
Figure 6 represents a summary of the overall methodological approach that was followed in this study to generate LAI from the studied vegetation indices computed from HLS and the THEIA L2A surface reflectance products and using the SNAP software.
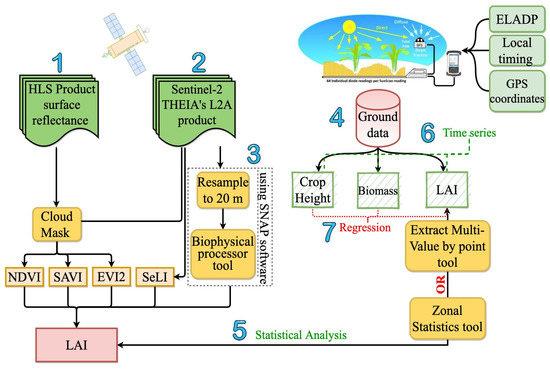
Figure 6.
Step-by-step flow chart for the validation of satellite-derived LAI against the ground measured LAI. Components of the analysis include: (1) existing vegetation index (VI) relationships applied to Harmonized Landsat-8 and Sentinel-2 (HLS) surface reflectance generated by NASA, (2) THEIA L2A surface reflectance products from Sentinel-2, (3) the SNAP biophysical model, (4) ground-truthing, (5) statistical comparison between the measured and the modeled LAI, (6) monitoring crop biophysical parameters during the 2019 growing season, and (7) investigation of crop-specific height and above-ground biomass relationships with LAI.
In this methodological approach, we first perform a comparative assessment of LAI models (both physical and existing empirical LAI estimation methods) against the ground LAI measurements of the studied crop groups. Particular focus is placed on evaluating the newly embedded biophysical processor, based on the artificial neural network (ANN) method, in the Sentinel Application Platform (SNAP) software, as well as the newly developed S2 LAI algorithm from SeLI index, in comparison with empirically-based VI models applied to HLS data. Next, we generated new empirical fits of the VI data to our ground observations specific to these crop groups. Finally, we see how well LAI (observed and retrieved) correlates with other important crop development variables: canopy height and biomass. To further assess the performance of the studied LAI models against the measured LAI, the measured LAI data were divided into three groups: low (0–2), medium (2–4), and high (>4) LAI ranges.
2.6. Accuracy Assessment
Statistical analysis between observed and remotely sensed LAI was performed for each crop group during the 2018–2019 growing seasons. In 2018, the study was conducted for five crop groups, namely: herbs, grains, potato, tobacco, and vegetables. In 2019, the study was conducted on three major crops, namely: wheat, barley, and potato.
Statistical metrics computed are as follows:
Root mean square error (RMSE) [68]:
Mean absolute error (MAE) [69]:
Mean absolute percentage error (MAPE) [70]:
Relative RMSE over the average measured LAI, also referred to as coefficient of variation of root-mean square error—CV(RMSE) as in [71]:
Mean bias error (MBE) [72]:
Index of agreement (d) [73]:
We also investigate the relation between the measured LAI and the remotely sensed vegetation indices. For this purpose, we use Pearson’s r, an often-used parametric correlation coefficient given by [74]:
The significance of the correlation is computed using the two-tailed t-test with n-2 degrees of freedom:
3. Results
The performance of the empirical and biophysical models was evaluated using the aforementioned statistical parameters in comparison with field measurements. A table of the derived statistical metrics, along with a summary graphical representation, is shown in Figure 7 and Table 4, respectively. The results are explained in the sections below.
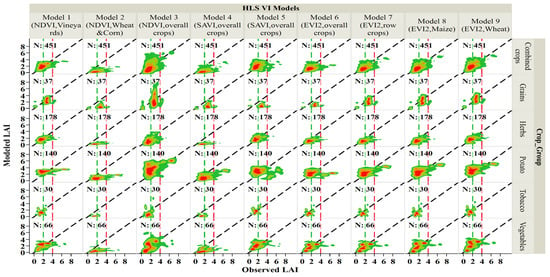
Figure 7.
Comparison between modeled and observed LAI in the 2018–2019 growing seasons for the HLS-VI models. The dashed green vertical lines represent the low observed LAI interval (0–2 m2/m2), the dashed red vertical lines represent the high observed LAI interval (>4 m2/m2), and the region between these two vertical lines represents the medium observed LAI range (2–4 m2/m2), the 2-D density plots represent four color levels with a dark red color at high density to dark green at lower densities, in addition to the orange and light green in representing medium densities.

Table 4.
Statistical analysis summary for the studied crops in both 2018 and 2019 growing seasons for the vegetation indices derived from the HLS product models.
3.1. Evaluation of Existing LAI Models
3.1.1. HLS VI Models
Empirical LAI models that are developed in relation to vegetation indices are considered as one of the most straightforward methods used for predicting LAI. Here we evaluate the efficiency and robustness of LAI models developed from indices that are computed from red and near-infrared HLS surface reflectance bands using the normalized difference ratio: NDVI (Model 1, 2, and 3), soil adjusted vegetation index: SAVI (Model 4 and 5), and enhanced vegetation index 2: EVI2 (Model 6, 7, 8, and 9). Our analysis (Figure 7 and Table 4) shows that Model 7 (EVI2, initially developed for row crops), Model 8 (EVI2, developed for maize), and Model 9 (EVI2, developed for wheat) outperformed other models when LAI observations from all crops sampled in the current study are combined.
On the other hand, models performing relatively poorly can also be identified. Both Model 2 (NDVI, initially developed for wheat, and corn) and Model 4 (SAVI, for overall agricultural crops) underestimated the LAI for all crops. Underestimation was also noticed in Model 5 (SAVI, overall agricultural crops) and Model 6 (EVI2, overall agricultural crops) for grains. Model 8 (EVI2, initially developed for maize) and Model 3 (NDVI, overall agricultural crops) overestimated the LAI for potato. Our analysis shows an apparent underestimation of LAI in all tested models when measured LAI exceeded 4, except for Model 3 and Model 8 which overestimated LAI for potato for observed LAI > 4.
3.1.2. Sentinel-2 LAI Models
For comparison with SNAP and SeLI LAI derived from S2 data only, subsets of HLS model-observation pairs were selected on the S2 dates represented in the THEIA dataset (Figure 8 and Table 5). The highest performing VI models applied to HLS SR data (7, 8, and 9; Section 3.1.1) outperformed LAI derived from S2 SeLI and the SNAP model (see Section 3.1.2; Table 5 and Figure 8). The HLS VI models had lower RMSE, MAE, RRMSE, and MAPE values than those of Model 10 (SeLI, overall crops), and the SNAP model. Model 9 (EVI2, initially developed for wheat) had the highest index of agreement (d), lowest RMSE, MAE, and MBE, compared to other models, primarily Model 10 (SeLI, overall crops) and the SNAP model. Furthermore, LAI derived from HLS EVI2 outperformed the LAI models derived from the other studied vegetation indices.
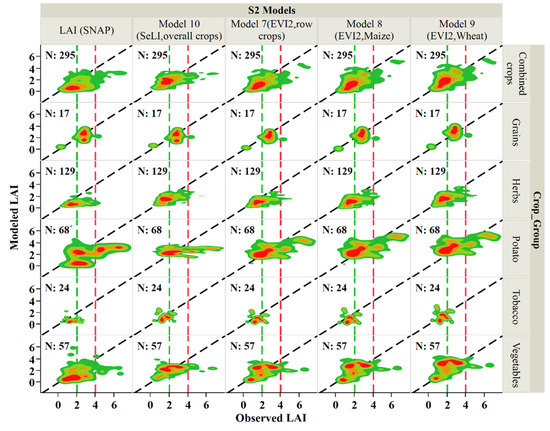
Figure 8.
Comparison between modeled and observed LAI in the 2018–2019 growing seasons for the HLS-VI for the HLS VI best-performing models derived from S30, Model 10 (SeLI, overall crops) and SNAP model derived from S2 THEIA product. The dashed green vertical lines represent the low observed LAI interval (0–2 m2/m2), the dashed red vertical lines represent the high observed LAI interval (>4 m2/m2), and the region between these two vertical lines represents the medium observed LAI range (2–4 m2/m2), the 2-D density plots represent four color levels with a dark red color at high density to dark green at lower densities, in addition to the orange and light green in representing medium densities.

Table 5.
Statistical analysis summary for the studied crops in both 2018 and 2019 growing seasons for the HLS VI best-performing models derived from S30, Model 10 (SeLI, overall crops) and SNAP model derived from S2 THEIA products.
3.2. Empirical Relationships between VIs and LAI Observations in Bekaa
Vegetation indices are shown to correlate well with LAI. The studied VIs were evaluated with the multi-crop observed LAI dataset over both 2018 and 2019 growing seasons to devise a new LAI algorithm for crops in the Bekaa Valley. The semi-empirical relationships between the measured LAI and the vegetation indices for all combined crops and different crop groups are given in Table 6. The different types of fitting functions with the crop group-specific LAI-VI relationships are summarized in Table 6 for the two satellites combined (L30 and S30), and in Table 7 for the two satellites separated.

Table 6.
Statistics obtained using regression equations of the form y = (a × VI + b) × (1 + c × exp (d × VI)) for each of the studied index, for the studied crop groups.

Table 7.
Regression coefficients obtained by regressing LAI against EVI2 using the equation of the form y = (a × VI + b) × (1 + c × exp (d × VI)), for the studied crop groups, separated by satellite type, L30, and S30.
The R2 for each index obtained with different fittings ranged between 0.27 and 0.63 for the crops combined, with SeLI index having the lowest R2 in all fittings (0.27). However, the p-value was <0.0001 in all cases. Results for Pearson’s r shows a strong correlation between the measured LAI and EVI2 (r = 0.7), followed by SAVI (r = 0.67) and NDVI (r = 0.6) and SeLI (r = 0.5) with the lowest correlation. Each index was represented as a function of the measured LAI for the different crop groups and the combined crops (Figure 9). However, EVI2 herein can be identified as a best-suited index for a unified algorithm for the crops combined.
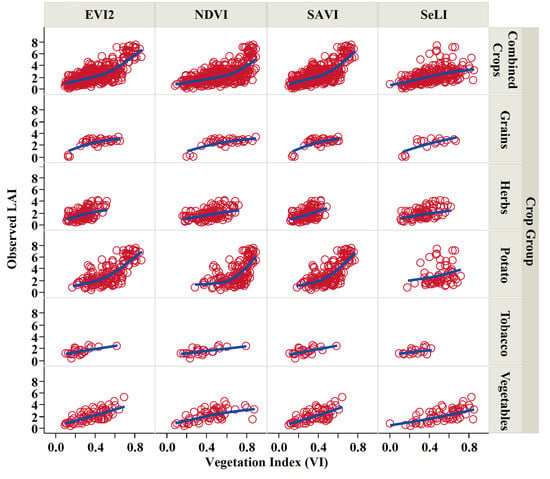
Figure 9.
Measured LAI as a function of vegetation indices (VI) derived from HLS product for the different studied crop groups and all crops combined.
To evaluate the significance of combining both Landsat-8 and Sentinel-2A in determining the LAI-EVI2 for each crop group, we fitted modeled LAI from L30, from S30, and from both satellites combined using the regression coefficients from Table 6 and Table 7 and then extracted the modeled LAI on the observed days. The summary of comparisons between the modeled and observed LAI is shown in Table 8. Our results show that combining both satellites allowed us to achieve lower RMSE and MAE for the crops combined and for each crop group. The use of L30 separately produced higher RMSE and MAE values than those obtained from L30-S30 combined, whereas the use of S30 yielded a lower RMSE and MAE values than L30. Overall, these results demonstrate the benefits of the combined use of Landsat-8 and Sentinel-2A satellites comparing to the single-satellite usage in defining the LAI-EVI2 relationship.

Table 8.
Statistical comparison between modeled and observed LAI separated by satellite type: L30, S30, and L30 and S30 combined, the modeled LAI is obtained using the LAI-EVI2 empirical relationships displayed in Table 6.
3.3. LAI-Crop Height Relationships
3.3.1. Crop Height
In addition to LAI, crop height is often used to monitor crop development [75,76,77,78,79] and is an essential variable in many land-surface modeling systems—governing surface turbulence and transport of wind and radiation through the canopy to the soil surface [80,81,82,83]. LAI vs. height relationships are unique to specific crop types due to the vast diversity of canopy structure among crop types [84,85,86,87]. In this study, a linear regression analysis was conducted to obtain the relationship between the crop height, the measured LAI, and the best performing LAI models for potato, cannabis, and tobacco. Figure 10, Figure 11 and Figure 12 indicate that an increase in leaf area is associated with an increased height due to leaf extension as the crop develops. Our analysis shows that the relation between the ground measured LAI and the measured height of the potato crop is essentially linear with an R2 value of 0.82, greater than that obtained when regressing the crop height to LAI obtained from Model 7 (EVI2, row crops; R2 = 0.48) (Figure 10). A similar crop height-LAI linear relationship was obtained for the wheat crop against measured LAI with a higher R2 (0.79) compared to Model 9 LAI (EVI2, wheat)-height relation (R2 = 0.61) (Figure 11). Furthermore, a good relationship exists between the measured height and the measured LAI for the cannabis and tobacco crops with R2: 0.489 and 0.495, and between the modeled LAI (model 10 derived from SeLI), with R2: 0.384 and 0.494 for both cannabis and tobacco, respectively (Figure 12).
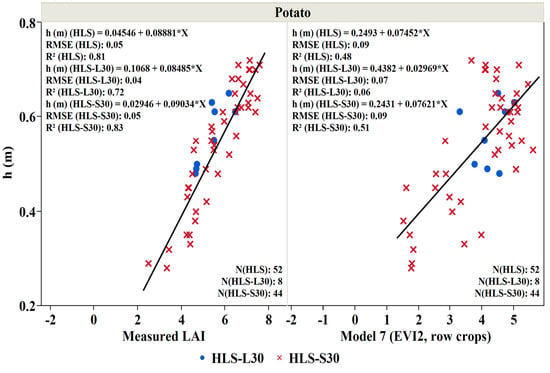
Figure 10.
Crop height (h (m)) as a function of measured LAI (m2/m2) and LAI derived from Model 7 (EVI2, row crops) for potato crop studied during the 2019 growing season. Blue points represent the measurements during Landsat overpass and the red crosses represent the measurements during Sentinel 2 overpass.
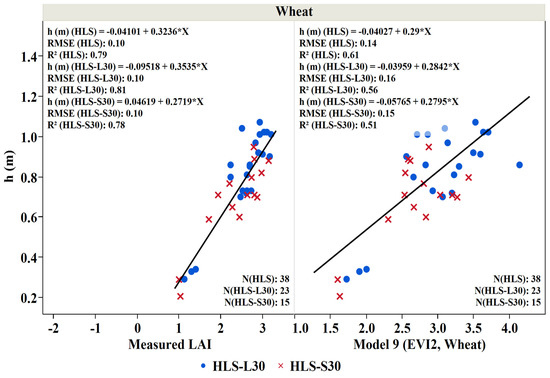
Figure 11.
Crop height (h (m)) as a function of measured LAI (m2/m2) and LAI derived from Model 9 (EVI2, wheat) for wheat crop studied during the 2019 growing season. Blue points represent the measurements during Landsat overpass and the red crosses represent the measurements during Sentinel 2 overpass.
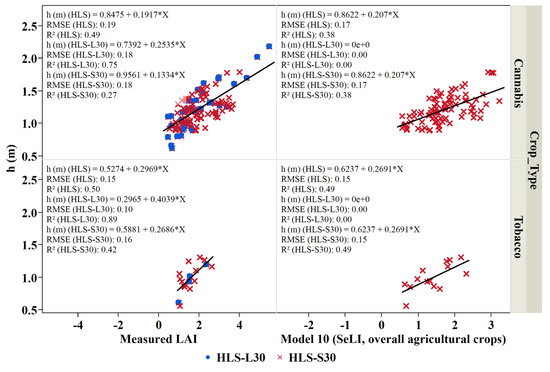
Figure 12.
Crop height (h (m)) as a function of measured LAI (m2/m2) and LAI derived from Model 10 (SeLI, overall agricultural crops) for cannabis and tobacco crops studied during the 2018 growing season. Blue points represent the measurements during Landsat overpass and the red crosses represent the measurements during Sentinel 2 overpass.
To evaluate the importance of combining both L30 and S30 in defining the LAI-h relationship, we applied the L30, S30, and L30 and S30 regression equations obtained between the modeled height and observed LAI for each crop group at each observation day. Statistical comparison between separated and combined satellite datasets is shown in Table 9. This relationship is better defined when both L30 and S30 are combined, where slightly lower RMSE and MAE values were obtained when the LAI based height relationship was determined using both L30 and S30, than those obtained with S30 or L30, separately.
3.3.2. Potato Dry and Fresh Weight
Potato crop biomass is an essential indicator of crop development, and the availability of this information during the growing season can help in decision-making processes for optimal crop production [88,89]. Reflectance-based VI response to canopy variables such as LAI largely determines potato growth, and VIs are widely used in biomass prediction models [11,12]. Here, we regressed the above-ground dry and fresh weight of the potato crop studied in 2019 against each of the measured LAI, LAI obtained from Model 7 (EVI2, row crops), and the measured height. The relationship between above-ground fresh and dry weights as a function of both the measured LAI and modeled LAI shows that an increase in the leaf area index is associated with an increase in biomass (Figure 13). No saturation in the measurement of biomass from LAI was noticed. Fresh and dry above-ground biomass of potato could be derived from the modeled LAI using a linear relation was with good accuracy (R2: 0.7 for fresh biomass) and with moderate accuracy (R2: 0.4 for dry biomass).
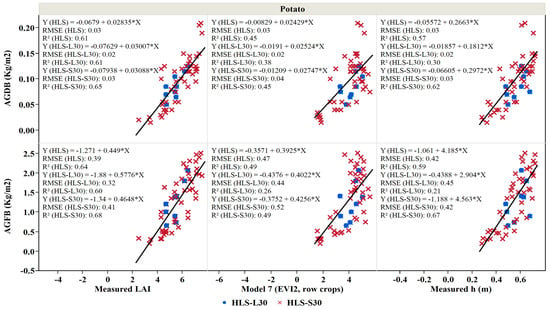
Figure 13.
Above-ground fresh (AGFB) and dry (AGDB) biomass weight as a function of LAI derived from Model 7 (EVI2, row crops), measured LAI, and height (h) for potato fields combined during the 2019 growing season. Blue points represent the measurements during Landsat overpass and the red crosses represent the measurements during Sentinel 2 overpass.
On the other hand, the regression of above-ground dry and fresh biomass (AGDB and AGFB, respectively) of potato against crop height showed that an increase in the above-ground fresh and dry weight of the potato crop is associated with an increase in the crop height (Figure 13). The ability of the linear regression to estimate the fresh and dry above-ground biomass of potato from crop height was with a good accuracy level (R2: app. 0.6), with lower RMSE and MAE values obtained as a result of combining both L30 and S30 compared to the single-use of L30 in defining the AGFB and LAI relationship (Table 10).

Table 10.
Statistical comparison between modeled and observed above-ground dry biomass (AGDB) and above-ground fresh biomass (AGFB) for potato separated by satellite type: L30, S30, and L30 and S30 combined, modeled fresh and dry above-ground biomass is obtained from equations displayed in Figure 13 as a function of observed LAI.
3.3.3. Seasonal Co-Variability in Observed and Modeled Biophysical Variables
This analysis shows that changes in both observed and modeled parameters (LAI, crop height, and biomass) are proportional to changes in EVI2 (Figure 14 and Figure 15). Continuous capture of the biophysical variables’ time-series was obtained when combining both L30 and S30 as compared to single sensor use. Modeled LAI derived from the LAI-VI models established in Section 3.2 was used to derive the height and biomass for potatoes on the LAI-height and LAI-biomass equations generated in Section 3.3. We further investigated the seasonal co-variability in the biophysical variables for wheat and potato crops sampled in the Bekaa Valley during the 2019 growing season (Figure 14 and Figure 15). Fresh and dry biomass weight was also evaluated for potato. Measurements of potato crop development were collected regularly during the 2019 growing season, whereas wheat biophysical parameter measurements were conducted at the end of the growing season.
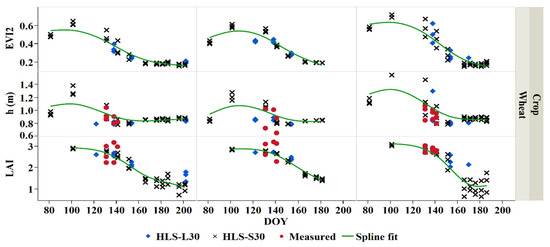
Figure 14.
A combined L30 and S30 derived and measured biophysical parameters (EVI2, h, and LAI) time-series of wheat for three farms during the 2019 growing season, modeled (both L30 and S30) crop biophysical in green spline fit.
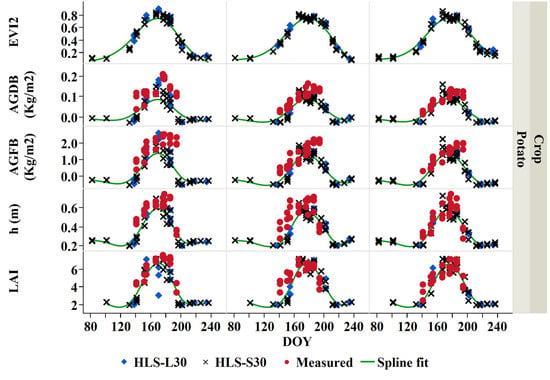
Figure 15.
A combined L30 and S30 derived and measured biophysical parameters (EVI2, above-ground fresh biomass (AGFB), above-ground dry biomass (AGDB), height (h), and leaf area index (LAI) time-series of potato for three farms during the 2019 growing season, modeled (both L30 and S30) crop biophysical in green spline fit.
The phenological differences between both potato and wheat were captured for three potato and wheat farms. Typically, the potato had a higher peak of both modeled and measured LAI during the middle of the growing season, where the average maximum measured LAI for all studied potato fields was found to be 6–8 m2/m2 in the mid-season stage (DOY 180). The average minimum measured potato LAI was about 2–3 m2/m2 during the beginning of the growing season (DOY 140). Similarly, modeled LAI evolution was observed for the three potato farms. On the other hand, the measured wheat LAI ranged between 2 and 3 m2/m2. Lower wheat LAI values were observed since wheat was monitored during the end of the season, where LAI tends to decrease.
The measured crop height increases as the crop develops. The average minimum measured potato crop height was about 0.4 m during the beginning of the growing season (DOY 140). The maximum average crop height for all studied potato fields was found to be around 0.6 m in the mid-season stage (DOY 180). The measured wheat crop height was found to be approximately 1 m during the end of the season (DOY 135–140). Similar modeled crop height evolution was observed for the three wheat farms.
Similarly, the above-ground fresh and dry biomass increased with crop growth. The above-ground biomass was the lowest at the beginning of the growing season, and it increases to reach its maximum during the middle of the growing season with a value of 2 kg/m2 and 0.2 kg/m2, for the above-ground fresh and dry biomass, respectively.
Different temporal LAI, crop height, and biomass dynamics were noticed in both potato and wheat crops (Figure 14 and Figure 15). Both crop type and management practices affect the dissimilarity of the temporal biophysical parameters of these crops. Furthermore, the same crop types, but different fields, diverged in their biophysical temporal profiles. These deviations can be attributed to the variation of farming conditions, agronomic, and management practices among the farms with the same crops.
3.3.4. Spatial Biophysical Parameter Patterns
Figure 16 shows the time development of the LAI, crop height, and above-ground fresh and dry biomass of a potato crop surveyed during the 2018 season. The modeled LAI maps are derived from the exponential LAI-EVI2 fit established in Section 3.2. These LAI maps were used to derive the height and biomass for potatoes on the LAI-height and LAI-biomass equations generated in Section 3.3. The spatial variability of the canopy conditions throughout the growing season is considerable, reflecting differences in soil conditions, planting dates, and cultivation practices. Note that fields 10 and 11 have depressed growth patterns coinciding with the L30 satellite overpass (DOY: 167). Furthermore, fields 9, 10, 11 and half of 8 reached senescence earlier than the other fields. The fact that fields 10 and 11 lag behind other potato-fields in terms of crop development is probably due to soil moisture stress that could be an insufficient amount of water available for irrigation or that irrigation was delayed. However, moisture stress was not high enough to completely inhibit crop growth.
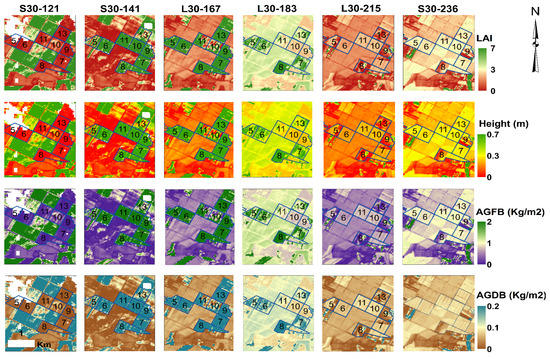
Figure 16.
Spatial and temporal biophysical parameter maps for different satellite (L30 and S30) overpass dates (DOY). The blue delineations indicate the surveyed potato fields during the 2018 season with their corresponding field IDs.
Other factors yielding the variation in the magnitude of biophysical parameters estimation include the crop’s susceptibility to unfavorable growth conditions, crop variety, differences in planting and harvest dates, crop management, weed control, planting density, and irrigation management. Overall, HLS products present good spectral and temporal resolution allowing for visual inspection of error estimates in time series maps of LAI and other biophysical variables.
4. Discussion
4.1. Uncertainties in -LAI Assessment
Uncertainties associated with LAI assessment can be grouped into two categories: the uncertainty of remote sensing methods and the errors in the LAI observation techniques.
LAI can be retrieved using a physical radiative transfer model or a simple empirical model based on a vegetation index. Any physical model is a simplification of the complex world. There are uncertainties associated with the physical model itself, and in the surface reflectance data used as input. The uncertainty of atmospheric correction of the satellite images is a major factor affecting the accuracy of LAI estimation by remote sensing [58]. Atmospheric correction also affects LAI-VI relationships. The use of vegetation indices to generate LAI products is subject to several uncertainties. First, studies have shown that due to VI saturation effects, LAI values that are greater than 4 m2/m2 are beyond the prediction power of the studied vegetation indices [5,24,60]. Thus, issues with VI saturation over dense canopies remain an issue to be addressed [58,90]. Second, different vegetation indices respond differently to the crop leaf optical properties defined by the leaf chlorophyll, dry mass, and water content [67]. Third, the leaf inclination, solar angle, and sensor bandwidth and calibration affect the vegetation spectral reflectance [91]. Therefore, LAI-VI relationships usually are only good for the local area where model was developed, while physical models could, in theory, be used more generally.
Regarding errors in the LAI measurement method, the underestimation of LAI in the high range of measured LAI can be attributed to the SS1 equipment limitations under high vegetation cover (LAI range > 4 m2/m2). LAI that is calculated using light transmission theory, such as the SS1 method, is underestimated because SS1 does not correct for canopy clumping effects [92]. Generally, when the canopy is clumped, the leaves hide each other, leaving a gap in between, and thus allow for more light to reach the ground as compared to randomly distributed leaves. The underestimation of LAI with SS1 was also observed in previous studies due to the lack of clumping correction [93,94]. Another type of error that falls in the second uncertainty category is that the leaf angle distribution (ELADP) is a fixed constant that is predefined by the user according to the crop. However, the chosen ELADP values may not be accurate throughout the growing season since the canopy leaves change throughout the entire season [95]. The assumption of a constant leaf absorption constant of 0.85 adds uncertainty to the LAI measurements. Moreover, row spacing, crop height, and time of measurement can affect the LAI values.
Scaling up field observations to match satellite pixel footprint is another challenge. Field LAI is a point measurement. Even through many points can be measured within a satellite pixel, the summary of the point measurements is still an approximation of the area. In addition, satellite pixels have geolocation errors and their footprints may vary from date to date, which is always a challenge for remote sensing data product validation [96].
4.2. S2 Model Results in Comparison to Previous Studies
We also assessed the performance of the newly developed SeLI-based LAI algorithm. Pasqualotto et al. [30] showed that LAI derived SeLI could be used as a generic model for LAIgreen of different crop types. Our results agree with the conclusions obtained by Pasqualotto et al. [30] and Sharma, et al. [97], who pointed out that the S2 red-edge bands are critical for the estimation of biophysical variables, mainly the LAI. Following the HLS VI models, Model 10 (SeLI, developed for overall agricultural crops) ranked next in terms of low RMSE, MAE, MBE, RRMSE, and MAPE values for all crops sampled in the study area. However, the S2 LAI algorithm significantly underestimates high LAI compared to other LAI-HLS derived models.
Our assessment shows that LAI derived from SNAP performed best for grain crops. The results demonstrate the potential of using SNAP to derive more uniform LAI estimates for both wheat and barley (possibly due to the good performance of the radiative transfer model for homogenous conditions). A clear underestimation of the SNAP-LAI product was noticed for herbs, potato, vegetables, and tobacco (Figure 8). Pasqualotto et al. [30] showed that LAI estimated from the Sentinel-2 product using the SNAP software underestimated LAI of potato, artichoke, squash, alfalfa, lettuce, wheat, pumpkin, and others. Compared to HLS VI and S2 SeLI models, SNAP provided less accurate estimates of LAI (Table 5 and Figure 8). These results are not in agreement with Kganyago et al. [98] who showed that SNAP-derived LAI values were overestimated for maize and sunflowers during the 2019 peak growing time in South Africa. This shows that the LAI estimation using SNAP software is highly location and crop type dependent.
S2 and HLS models outperforming the SNAP model confirm the suitability of S2 models applications to the small geographical scale (field level) of our study. The authors of the SNAP (personal communication) mentioned that the biophysical processor lacks the ancillary information from which some vegetation architecture features could be derived. Hence, the absence of reliable and regularly updated land cover maps at a spatial resolution, like that of S2, prevents tailoring of specific algorithms for each of the land cover classes. Consequently, the algorithm may provide reasonably good estimates over all the cases, but certainly poorer performances as compared to algorithms specific to a given surface type [28]. Thus, the poor performance of SNAP-derived LAI suggests that it is not suitable for precision agriculture and may be useful for large-area applications.
4.3. HLS VI Models Validation Challenges
The major challenge encountered while validating existing vegetation index relationships applied to HLS SR product is the uniqueness and diversity of the site-specific LAI-VI relationships. Site-specific properties such as the crop type [5], biochemical properties of the leaf canopy [99], biophysical properties of the leaf canopy [100], as well as sensor characteristics and the atmospheric scattering and absorption [101], have yielded unique local LAI-VI relationships that are ideally applicable only under unique conditions. This work shows that the existing LAI-VI models, initially developed for particular crops from different sensors, can be applied to some crops sampled in this research irrespective of their limitation to “one place, one time, one equation.” As shown in Results, the LAI models originally developed for wheat (RMSE: 1.27), maize (RMSE: 1.34), and row crops (RMSE: 1.38) worked well for the combined crops of the study area. However, these relationships cannot replace the locally established relationships in this work, as the local relationships account for the site-specific conditions affecting the LAI-VI relationships.
4.4. Empirical Relationships Establishment between VIs and LAI Observations Challenges
The major challenge of establishing the empirical relationship between the observed LAI and vegetation indices is the difficulty of finding one index with a sufficiently general character that can be used to estimate LAI for a wide variety of crop types. In this work, the established indices do not present this general character, as each index performed differently in different crop types. The most robust relation between ground measured LAI and vegetation indices appears in SeLI for cannabis, SAVI and EVI2 for potato, NDVI for tobacco, and EVI2 for vegetables. However, EVI2 outperformed other vegetation indices for all crops combined, and therefore it can be identified as an index that is best suited for a unified algorithm for crops in semi-arid irrigated regions with heterogeneous landscapes.
As more remote sensing and field measurements become available, machine learning approaches may be used to investigate the complex relationships between LAI and remote sensing spectral features. Surface reflectance provides information about land covers and structures, which could be used to build the relationship directly [102].
5. Conclusions and Recommendations
This study reconfirms the limited ability of Landsat as an isolated sensor to capture the full time-series at the farm level. L30 missed biophysical observations at critical growth stages due to the smaller number of images available. Few L30 images were used due to its long revisit time and cloud coverage. Our results also demonstrate the importance of higher observation frequency achieved with the combination of Landsat-8 and Sentinel-2A satellites compared to the single use of L30 in both crop monitoring and modeling efforts, where stronger LAI-based crop biophysical parameters relationships were achieved with L30 and S30 combined, as compared to L30 separately. LAI and other crop growth variables are appropriately monitored and modeled in this work, especially during fast-developing phenomena. Multi-satellite data normalization is crucial, and this was addressed through crop biophysical variables time-series generated for monitoring wheat and potato crops in the Bekaa Valley. Time series of crop growth parameters are essential for detecting changes in crop cover, and the combination of data from different ongoing satellite missions provides this opportunity. Thus, the recent availability of high temporal frequency high-resolution images (HLS product) provides the ability to conduct and utilize more site-based biophysical variables measurements for crops other than the two studied strategic crops (wheat and potato) by providing more time-matched surface reflectance products.
Using the combined Landsat 8 and Sentinel-2 data at a 30-m spatial resolution, we focused in this work on the estimation LAI at the field scale in a semi-arid irrigated heterogeneous landscape. Unlike most existing approaches utilizing vegetation indices derived from non-normalized satellite data to estimate LAI, we derived the LAI from three methods, namely: existing vegetation index (VI) relationships applied to Harmonized Landsat-8 and Sentinel-2 (HLS) surface reflectance produced by NASA, the SNAP biophysical model, and L2A THEIA product from Sentinel-2. The EVI2 index surpassed any other index in predicting LAI, and it is the best for modeling LAI of various crops. This study also shows that LAI derived from the artificial neural network through ESA’s SNAP biophysical processor is underestimated but yielded a good accuracy level for wheat and barley LAI estimation. Hence, the poor performance of SNAP dictates further improvement to support precision agriculture [98]. Future studies should investigate the discrepancy in the disagreement of LAI-SNAP accuracy in the cited research work. While the LAI derived from the SeLI algorithm produces an acceptable accuracy level compared to HLS-EVI2, a significant underestimation at high LAI was observed. The normalizing satellite data in crop monitoring and modeling is crucial to eliminate the bias due to sensor and bandwidth variability and atmospheric correction techniques. We encourage the scientific community to validate new crop and site-specific LAI-VI, LAI-height, and LAI-above-ground biomass empirical relationships developed in this work.
We recommend exploring improved hemispherical LAI estimation techniques that can provide information on the canopy clumping and leaf angle inclination, measure the LAI at different heights, and differentiate between leaves and woody parts through the integration of infrared techniques [103,104]. The use of other vegetation indices, such as the normalized difference water index (NDWI), derived from near- and shortwave-infrared reflectance, may be less susceptible to saturation problems [105]. Ingestion of multiple spectral bands within a machine learning approach may be useful for large-area applications [102]. Future work may also focus on the effects of soil moisture on the retrieval of LAI. More studies on the use of other vegetation indices that correct for soil background, such as the Weighted Difference Vegetation Index (WDVI) [106], could be explored (here we found that EVI2, which corrects for both atmosphere and soil background, gave good results). Additionally, future studies should consider quantifying the effect of various atmospheric correction approaches such as Sen2Cor, FORCE, iCor, and MAJA on biophysical parameters retrieval, since atmospheric correction performance varies by different spectral bands of Sentinel-2 [98].
Author Contributions
Conceptualization, H.J.; methodology, H.J., R.M., and M.A.; validation, H.J., R.M., and M.A.; formal analysis, R.M., M.A., and H.J.; investigation, R.M., M.A., and H.J.; resources, H.J., R.M., M.A., and F.G.; data curation, R.M., M.A., and H.J.; writing—original draft preparation, R.M., H.J., and M.A.; writing—review and editing, H.J., M.A., R.M., and F.G.; visualization, R.M.; supervision, H.J. and M.A.; project administration, H.J.; funding acquisition, M.A., F.G., and H.J. All authors have read and agreed to the published version of the manuscript.
Funding
This research was funded by a grant from NASA, grant number 17-LCLUC17-0002- 08NSSC18K0483 under the project Characterizing Field-Scale Water Use, Phenology and Productivity in Agricultural Landscapes using Multi-Sensor Data Fusion” and IHE Delft Partnership Programme for Water and Development (DUPC2)—the Netherlands Ministry of Foreign Affairs, grant number 108485, under the project “ITSET: Integrating time-series ET mapping into an operational irrigation management framework”.
Acknowledgments
We thank Naji El-Beyrouthy for helping with field data collection.
Conflicts of Interest
The authors declare no conflict of interest. The funders had no role in the design of the study; in the collection, analyses, or interpretation of data; in the writing of the manuscript, or in the decision to publish the results.
Appendix A
There are two major classes of LAI measurement methods: (1) direct measurement and (2) indirect measurement. The direct method involves destructively harvesting the canopy and measuring the area of the collected leaves samples using instruments such as LI-3000C portable leaf area meter (LI-COR, Lincoln, NE, USA). This method has relatively high precision, and is often used to validate the indirect measurement methods; however, it is very labor-intensive, tedious, and is not suitable for large area measurement [107,108]. On the other hand, the indirect methods are based on light interception, hemispherical photography, or remote sensing [15]. Both light interception and hemispherical techniques are referred to as optical approaches, which involve variable measurements such as gap fraction and light transmission. These variables are measured by commercial instruments and are related to LAI based on PAR inversion and Beer–Lambert extinction law theories for both gap fraction and light transmission, respectively. A more detailed explanation of these theories is provided in Appendix A, along with an evaluation of different optical instruments as presented in literature.
Several studies have used different optical instruments to either assess these instruments against direct measurements or to validate the remotely sensed LAI [15,95,109]. Although indirect measurement of LAI using optical instruments is faster than direct measurement, it suffers from several limitations. First, indirect measurements do not measure the LAI but rather the light intercepted by the plant canopy that is then related to LAI. In other words, the optical instruments do not distinguish the leaves from the flowers or branches. Thus, they tend to either underestimate or overestimate the direct LAI depending on the method used and canopy studied.
Moreover, each method has sources of error. For example, the digital hemispherical photography (DHP) includes some subjectivity regarding factors such as variable clouds, shadows, and brightness, which makes it challenging to choose a threshold that allows the distinction of the canopy from non-canopy. For this reason, hemispherical photographs are recommended to be captured under uniformly diffuse or overcast conditions, while the leaf angle distribution can be a source of error if it is misestimated in instruments such as SS1 and AccuPAR. Finally, row spacing, crop height, time of measurement, and placement of the meter can affect the observed LAI values.
The indirect measurement of LAI with the optical instruments is based on two major theoretical approaches, namely: the gap fraction or PAR inversion methods.
With the gap fraction approach, LAI is determined by solving for L as per the below Equations (A1) and (A2):
where P (θ) is the gap fraction, θ is the zenith angle of view, α is the leaf angle, G (θ, α) is the fraction of foliage projected on the plane normal to the zenith direction, and Ω (θ) is the clumping coefficient when foliage is randomly distributed within the canopy, Ω (θ) = 1, but as the foliage becomes more clumped, Ω (θ) < 1, and L is the leaf area index.
Examples of instruments that use the above theory include the LAI–2200 plant canopy analyzer, which compares above and below canopy light levels detected by five conical rings with zenith view angles ranging from nadir to 75°. Another example is digital hemispherical photography (DHP). DHP measures LAI by the inversion of the Poisson model (Equation (A2)), as described by Thimonier, et al. [110]. DHP uses a fish-eye lens inside the camera that images the canopy from beneath in a hemisphere. The collected photographs are then processed by the user using Can-Eye or other software. By process of thresholding, distinguishing pixels that are occupied by leaves from those that are occupied by the sky, the user can determine the LAI values.
The second approach is based on Beer–Lambert extinction law, and it can be explained as follows:
In a case of light absorption by the canopy, according to Beer’s law, a relationship between the incident (I0), transmitted light (I) and leaf area index (L) is given by Equation (A3) below:
where K is an extinction coefficient which depends on the direction of beam and leaf angle distribution. K is calculated, according to Campbell [111] as per Equation (A4):
where x is the ellipsoidal leaf angle distribution (ELADP), and θ is the zenith angle of the direct beam.
Typical ELADP values used in this study are summarized in Table A1 from Campbell and Van Evert [112]. A default value of 1 was used for random spherical distribution crops that are not mentioned in Table A1 below. Zenith angels are calculated from longitude, latitude, and local timing.

Table A1.
Typical ELADP values.
Table A1.
Typical ELADP values.
| Crop | ELADP |
|---|---|
| Maize | 0.76–2.52 |
| Wheat | 0.96 |
| Barley | 1.2 |
| Cucumber | 2.17 |
| Tobacco | 1.29–2.47 |
| Potato | 1.7–2.47 |
Examples of instruments that use the above theory include SS1 SunScan Plant Canopy Analysis System. This instrument consists of 64 PAR sensors with an accuracy of ±10%, embedded in a 1 m long portable probe. Combined with a calibrated BF3 Sunshine Sensor, it measures the incident and transmitted PAR in the canopy to provide an estimate of LAI. A brief theoretical background of how the SunScan computes its reading of LAI can be found in the user’s manual. Another instrument is the Accu-PAR model Lp-80 PAR LAI Ceptometer (Decagon Devices, Inc. Pullman, WA, USA). The LAI measured by Accu-PAR and other PAR inversion instruments is dependent on several factors such as the solar zenith angle which is calculated using the time of day and the geographic location, the path length of the beam radiation, and the leaf angle distribution of the canopy as described by Beer’s law.
Evaluation of different LAI instruments as presented in Literature:
Casa et al. [113] evaluated different commercial LAI instruments and compared them to direct LAI measurements of different crops. These instruments are the LAI-2000, the Sunscan Ceptometer, and digital hemispherical photography. Casa et al. [113] concluded that the digital hemispherical photograph provided the best estimates of LAI for alfalfa (RMSE = 0.33 m2/m2), broad bean (RMSE = 0.3 m2/m2), emmer (RMSE = 0.31 m2/m2), maize (RMSE = 0.58 m2/m2), and wheat (RMSE = 0.68 m2/m2). Ariza-Carricondo et al. [15] assessed the LAI-2200 plant canopy analyzer, the SS1 SunScan Canopy Analysis System, and digital hemispherical photography (DHP) for four different canopy types, including maize. The results have shown that LAI-2200 overestimates LAI in a very low range of the directly measured LAI. The DHP only slightly overestimated the direct method, whereas the SS1 underestimated the direct measurements by about 25%; this is consistent with Gower et al. [94], who showed that SunScan underestimated LAI compared with the destructive measurement. However, the SunScan probe has provided reasonable estimates of leaf area index for corn (p = 0.0713) as reported by Wilhelm et al. [95] and for rice cultivars (p < 0.001) when restricting the range of LAI to <4 m2/m2 as reported by Sone et al. [110].
Reyes-González et al. [3] measured the leaf area index of cornfields with the Accu-PAR model Lp-80 PAR LAI Ceptometer (Decagon Devices, Inc. Pullman, WA, USA). In their methodological approach, the LAI measurement was done during the time the satellite overpasses to assess the LAI estimated using the remote sensing-based METRIC model. The results of the comparison of the estimated LAI to the LAI obtained from AccuPAR have shown that LAI values measured in situ were higher than the LAI values estimated using the remote sensing-based METRIC model by about 12%, with a good linear correlation (MBE of 0.61, and RMSE of 0.59). Pasqualotto et al. [30] and Anderson et al. [105] used LAI-2200 plant canopy. Pasqualotto et al. [30] compared LAI obtained from Sentinel-2 LAI Index SeLI ([B8a − B5]/[B8a + B5]) with the in situ measurements and found a good linear correlation between them (R2 of 0.732, and RMSE of 0.69 m2/m2). Similar results were achieved by Anderson et al. [105], where the accuracy of LAI retrieval from optimized soil adjusted vegetation index (OSAVI) and normalized difference water Index (NDWI) compared to the measured LAI was 0.6 as measured by the root-mean-square-deviation (RMSD).
References
- Asner, G.P.; Scurlock, J.M.O.; Hicke, J.A. Global synthesis of leaf area index observations: Implications for ecological and remote sensing studies. Glob. Ecol. Biogeogr. 2003, 12, 191–205. [Google Scholar] [CrossRef]
- Chen, J.M.; Black, T.A. Defining leaf area index for non-flat leaves. Plant Cell Environ. 1992, 15, 421–429. [Google Scholar] [CrossRef]
- Reyes-González, A.; Kjaersgaard, J.; Trooien, T.; Sánchez, D.G.R.; Sánchez-Duarte, J.I.; Preciado-Rangel, P.; Fortis-Hernandez, M. Comparison of Leaf Area Index, Surface Temperature, and Actual Evapotranspiration Estimated using the METRIC Model and In Situ Measurements. Sensors 2019, 19, 1857. [Google Scholar] [CrossRef] [PubMed]
- Charbonnier, F. Measuring and Modeling Light, Water and Carbon Budgets and Net Primary Productivity in a Coffee-based Agroforestry System of Costa Rica. Ph.D. Thesis, Université de Lorraine, Lorraine, France, 2013. [Google Scholar]
- Viña, A.; Gitelson, A.; Nguy-Robertson, A.L.; Peng, Y. Comparison of different vegetation indices for the remote assessment of green leaf area index of crops. Remote. Sens. Environ. 2011, 115, 3468–3478. [Google Scholar] [CrossRef]
- Jung, M.; Reichstein, M.; Ciais, P.; Seneviratne, S.I.; Sheffield, J.; Goulden, M.L.; Bonan, G.; Cescatti, A.; Chen, J.; De Jeu, R.; et al. Recent decline in the global land evapotranspiration trend due to limited moisture supply. Nature 2010, 467, 951–954. [Google Scholar] [CrossRef] [PubMed]
- Fassnacht, K.S.; Gower, S.T.; MacKenzie, M.D.; Nordheim, E.V.; Lillesand, T.M. Estimating the leaf area index of North Central Wisconsin forests using the landsat thematic mapper. Remote. Sens. Environ. 1997, 61, 229–245. [Google Scholar] [CrossRef]
- Taugourdeau, S.; Le Maire, G.; Avelino, J.; Jones, J.R.; Ramirez, L.G.; Quesada, M.J.; Charbonnier, F.; Gómez-Delgado, F.; Harmand, J.M.; Rapidel, B.; et al. Leaf area index as an indicator of ecosystem services and management practices: An application for coffee agroforestry. Agric. Ecosyst. Environ. 2014, 192, 19–37. [Google Scholar] [CrossRef]
- Van den Hurk, B.J.; Viterbo, P.; Los, S.O. Impact of leaf area index seasonality on the annual land surface evaporation in a global circulation model. J. Geophys. Res. Space Phys. 2003, 108, 108. [Google Scholar] [CrossRef]
- Jarlan, L.; Balsamo, G.; Lafont, S.; Beljaars, A.; Calvet, J.C.; Mougin, E. Analysis of leaf area index in the ECMWF land surface model and impact on latent heat and carbon fluxes: Application to West Africa. J. Geophys. Res. Space Phys. 2008, 113, 113. [Google Scholar] [CrossRef]
- Dente, L.; Satalino, G.; Mattia, F.; Rinaldi, M. Assimilation of leaf area index derived from ASAR and MERIS data into CERES-Wheat model to map wheat yield. Remote. Sens. Environ. 2008, 112, 1395–1407. [Google Scholar] [CrossRef]
- Fang, H.; Liang, S.; Hoogenboom, G.; Teasdale, J.; Cavigelli, M. Corn-yield estimation through assimilation of remotely sensed data into the CSM-CERES-Maize model. Int. J. Remote. Sens. 2008, 29, 3011–3032. [Google Scholar] [CrossRef]
- Hansen, P.; Schjoerring, J.K. Reflectance measurement of canopy biomass and nitrogen status in wheat crops using normalized difference vegetation indices and partial least squares regression. Remote. Sens. Environ. 2003, 86, 542–553. [Google Scholar] [CrossRef]
- He, L.; Zhang, H.Y.; Zhang, Y.S.; Song, X.; Feng, W.; Kang, G.Z.; Wang, C.Y.; Guo, T. Estimating canopy leaf nitrogen concentration in winter wheat based on multi-angular hyperspectral remote sensing. Eur. J. Agron. 2016, 73, 170–185. [Google Scholar] [CrossRef]
- Carricondo, C.A.; Di Mauro, F.; de Beeck, M.O.; Roland, M.; Gielen, B.; Vitale, D.; Ceulemans, R.; Papale, D. A comparison of different methods for assessing leaf area index in four canopy types. Central Eur. For. J. 2019, 65, 67–80. [Google Scholar] [CrossRef]
- Baret, F.; Guyot, G. Potentials and limits of vegetation indices for LAI and APAR assessment. Remote. Sens. Environ. 1991, 35, 161–173. [Google Scholar] [CrossRef]
- Broge, N.; Leblanc, E. Comparing prediction power and stability of broadband and hyperspectral vegetation indices for estimation of green leaf area index and canopy chlorophyll density. Remote. Sens. Environ. 2001, 76, 156–172. [Google Scholar] [CrossRef]
- Baghzouz, M.; Devitt, D.A.; Fenstermaker, L.; Young, M.H. Monitoring Vegetation Phenological Cycles in Two Different Semi-Arid Environmental Settings using a Ground-Based NDVI System: A Potential Approach to Improve Satellite Data Interpretation. Remote. Sens. 2010, 2, 990–1013. [Google Scholar] [CrossRef]
- Huete, A.; Justice, C.; van Leeuwen, W. MODIS Vegetation Index (MOD13), EOS MODIS Algorithm; Theoretical basis document; NASA Goddard Space Flight Center: Greenbelt, MD, USA, 1996.
- Deering, D.W. Rangeland Reflectance Characteristics Measured by Aircraft and Spacecraft Sensors. Ph. D. Thesis, Texas A&M Universtiy, College Station, TX, USA, 1978. [Google Scholar]
- Huete, A. A soil-adjusted vegetation index (SAVI). Remote. Sens. Environ. 1988, 25, 295–309. [Google Scholar] [CrossRef]
- Huete, A. A comparison of vegetation indices over a global set of TM images for EOS-MODIS. Remote. Sens. Environ. 1997, 59, 440–451. [Google Scholar] [CrossRef]
- Jiang, Z.; Huete, A.; Didan, K.; Miura, T. Development of a two-band enhanced vegetation index without a blue band. Remote Sens. Environ. 2008, 112, 3833–3845. [Google Scholar] [CrossRef]
- Nguy-Robertson, A.L.; Peng, Y.; Gitelson, A.A.; Arkebauer, T.J.; Pimstein, A.; Herrmann, I.; Karnieli, A.; Rundquist, D.C.; Bonfil, D.J. Estimating green LAI in four crops: Potential of determining optimal spectral bands for a universal algorithm. Agric. For. Meteorol. 2014, 192, 140–148. [Google Scholar] [CrossRef]
- Campos-Taberner, M.; García-Haro, F.; Camps-Valls, G.; Muedra, G.A.G.; Nutini, F.; Crema, A.; Boschetti, M. Multitemporal and multiresolution leaf area index retrieval for operational local rice crop monitoring. Remote. Sens. Environ. 2016, 187, 102–118. [Google Scholar] [CrossRef]
- Féret, J.-B.; Gitelson, A.; Noble, S.; Jacquemoud, S. PROSPECT-D: Towards modeling leaf optical properties through a complete lifecycle. Remote. Sens. Environ. 2017, 193, 204–215. [Google Scholar] [CrossRef]
- Myneni, R.B.; Hoffman, S.; Knyazikhin, Y.; Privette, J.L.; Glassy, J.; Tian, Y.; Wang, Y.; Song, X.; Zhang, Y.; Smith, G.R.; et al. Global products of vegetation leaf area and fraction absorbed PAR from year one of MODIS data. Remote. Sens. Environ. 2002, 83, 214–231. [Google Scholar] [CrossRef]
- Weiss, M.; Baret, F. S2ToolBox Level 2 products: LAI, FAPAR, FCOVER, Version 1.1. In ESA Contract nr 4000110612/14/I-BG; INRA Avignon: Paris, France, 2016; p. 52. [Google Scholar]
- Djamai, N.; Fernandes, R. Comparison of SNAP-Derived Sentinel-2A L2A Product to ESA Product over Europe. Remote. Sens. 2018, 10, 926. [Google Scholar] [CrossRef]
- Pasqualotto, N.; Delegido, J.; Van Wittenberghe, S.; Rinaldi, M.; Moreno, J. Multi-Crop Green LAI Estimation with a New Simple Sentinel-2 LAI Index (SeLI). Sensors 2019, 19, 904. [Google Scholar] [CrossRef]
- Strittholt, J.; Miles, L.; Horning, N.; Fosnight, E. Sourcebook on Remote Sensing and Biodiversity Indicators; Technical Series no. 32; Secretariat of the Convention on Biological Diversity: Montreal, QC, Canada, 2007; p. 203.
- Hansen, M.; Loveland, T.R. A review of large area monitoring of land cover change using Landsat data. Remote. Sens. Environ. 2012, 122, 66–74. [Google Scholar] [CrossRef]
- Hilker, T.; Wulder, M.A.; Coops, N.C.; Seitz, N.; White, J.C.; Gao, F.; Masek, J.G.; Stenhouse, G. Generation of dense time series synthetic Landsat data through data blending with MODIS using a spatial and temporal adaptive reflectance fusion model. Remote. Sens. Environ. 2009, 113, 1988–1999. [Google Scholar] [CrossRef]
- Yang, D.; Su, H.; Yong, Y.; Zhan, J. MODIS-Landsat Data Fusion for Estimating Vegetation Dynamics—A Case Study for Two Ranches in Southwestern Texas. Proc. Int. Electron. Conf. Remote Sens. 2015, 22. [Google Scholar] [CrossRef]
- Claverie, M.; Demarez, V.; Duchemin, B.; Hagolle, O.; Ducrot, D.; Marais-Sicre, C.; Dejoux, J.F.; Huc, M.; Keravec, P.; Béziat, P.; et al. Maize and sunflower biomass estimation in southwest France using high spatial and temporal resolution remote sensing data. Remote. Sens. Environ. 2012, 124, 844–857. [Google Scholar] [CrossRef]
- Skakun, S.; Vermote, E.; Roger, J.C.; Franch, B. Combined use of Landsat-8 and Sentinel-2A images for winter crop mapping and winter wheat yield assessment at regional scale. AIMS Geosci. 2017, 3, 163–186. [Google Scholar] [CrossRef] [PubMed]
- Barsi, J.A.; AlHammoud, B.; Czapla-Myers, J.; Gascon, F.; Haque, O.; Kaewmanee, M.; Leigh, L.; Markham, B. Sentinel-2A MSI and Landsat-8 OLI radiometric cross comparison over desert sites. Eur. J. Remote. Sens. 2018, 51, 822–837. [Google Scholar] [CrossRef]
- Storey, J.; Roy, D.P.; Masek, J.; Gascon, F.; Dwyer, J.; Choate, M. A note on the temporary misregistration of Landsat-8 Operational Land Imager (OLI) and Sentinel-2 Multi Spectral Instrument (MSI) imagery. Remote. Sens. Environ. 2016, 186, 121–122. [Google Scholar] [CrossRef]
- Claverie, M.; Ju, J.; Masek, J.G.; Dungan, J.L.; Vermote, E.F.; Roger, J.C.; Skakun, S.; Justice, C. The Harmonized Landsat and Sentinel-2 surface reflectance data set. Remote. Sens. Environ. 2018, 219, 145–161. [Google Scholar] [CrossRef]
- Hagolle, O.; Dedieu, G.; Mougenot, B.; Debaecker, V.; Duchemin, B.; Meygret, A. Correction of aerosol effects on multi-temporal images acquired with constant viewing angles: Application to Formosat-2 images. Remote. Sens. Environ. 2008, 112, 1689–1701. [Google Scholar] [CrossRef]
- Hagolle, O.; Huc, M.; Desjardins, C.; Auer, S.; Richter, R. MAJA ATBD Algorithm Theoretical Basis Document; Technical report; National Centre for Space Studies (CNES): Paris, France; Center for the Study of the Biosphere from Space (CESBIO): Toulouse, France; German Aerospace Center (DLR): Köln, Germany, 2017. [Google Scholar]
- Hagolle, O.; Huc, M.; Pascual, D.V.; Dedieu, G. A multi-temporal method for cloud detection, applied to FORMOSAT-2, VENµS, LANDSAT and SENTINEL-2 images. Remote. Sens. Environ. 2010, 114, 1747–1755. [Google Scholar] [CrossRef]
- Hagolle, O.; Huc, M.; Pascual, D.V.; Dedieu, G. A Multi-Temporal and Multi-Spectral Method to Estimate Aerosol Optical Thickness over Land, for the Atmospheric Correction of FormoSat-2, LandSat, VENμS and Sentinel-2 Images. Remote. Sens. 2015, 7, 2668–2691. [Google Scholar] [CrossRef]
- Rouquié, B.; Hagolle, O.; Bréon, F.-M.; Boucher, O.; Desjardins, C.; Rémy, S. Using Copernicus Atmosphere Monitoring Service Products to Constrain the Aerosol Type in the Atmospheric Correction Processor MAJA. Remote. Sens. 2017, 9, 1230. [Google Scholar] [CrossRef]
- Jaafar, H.; Ahmad, F.A. Time series trends of Landsat-based ET using automated calibration in METRIC and SEBAL: The Bekaa Valley, Lebanon. Remote. Sens. Environ. 2020, 238, 111034. [Google Scholar] [CrossRef]
- FAO. Land and Water Database; Food and Agriculture Organization of the United Nations: Rome, Italy, 2019. [Google Scholar]
- MOE. Lebanon State of the Environment Report; Ministry of Environment (MOE): Beirut, Lebanon, 2001. [Google Scholar]
- FAO. Lebanon at a Glance; Food and Agriculture Organization of the United Nations: Rome, Italy, 2020. [Google Scholar]
- Hamade, K. Lebanon; Arab NGO Network for Development (ANND): Beirut, Lebanon, 2010. [Google Scholar]
- Salti, N.; Chaaban, J.; Naamani, N. The Economics of Tobacco in Lebanon: An Estimation of the Social Costs of Tobacco Consumption. Subst. Use Misuse 2013, 49, 735–742. [Google Scholar] [CrossRef]
- HAJU, A. Hashish Harvest in Bekaa: The People Behind the Plant. Al Akhbar, 3 March 2015. [Google Scholar]
- Potter, E.; Wood, J.; Nicholl, C. SunScan Canopy Analysis System; User Manual; Delta-T Devices: Cambridge, UK, 1996. [Google Scholar]
- Zhu, Z.; Wang, S.; Woodcock, C.E. Improvement and expansion of the Fmask algorithm: Cloud, cloud shadow, and snow detection for Landsats 4–7, 8, and Sentinel 2 images. Remote. Sens. Environ. 2015, 159, 269–277. [Google Scholar] [CrossRef]
- Di Bella, C.M.; Paruelo, J.; Becerra, J.E.; Bacour, C.; Baret, F. Effect of senescent leaves on NDVI-based estimates of fAPAR: Experimental and modelling evidences. Int. J. Remote. Sens. 2004, 25, 5415–5427. [Google Scholar] [CrossRef]
- Zeng, X.; Dickinson, R.E.; Walker, A.; Shaikh, M.; DeFries, R.S.; Qi, J. Derivation and Evaluation of Global 1-km Fractional Vegetation Cover Data for Land Modeling. J. Appl. Meteorol. 2000, 39, 826–839. [Google Scholar] [CrossRef]
- Boegh, E.; Soegaard, H.; Broge, N.; Hasager, C.B.; Jensen, N.; Schelde, K.; Thomsen, A. Airborne multispectral data for quantifying leaf area index, nitrogen concentration, and photosynthetic efficiency in agriculture. Remote. Sens. Environ. 2002, 81, 179–193. [Google Scholar] [CrossRef]
- Gitelson, A.; Ciganda, V.S.; Rundquist, D.C.; Viña, A.; Arkebauer, T.J. Remote estimation of canopy chlorophyll content in crops. Geophys. Res. Lett. 2005, 32, 32. [Google Scholar] [CrossRef]
- Kang, Y.; Özdoğan, M.; Zipper, S.C.; Román, M.O.; Walker, J.P.; Hong, S.Y.; Marshall, M.; Magliulo, V.; Moreno, J.; Alonso, L.; et al. How Universal is the Relationship between Remotely Sensed Vegetation Indices and Crop Leaf Area Index? A Global Assessment. Remote. Sens. 2016, 8, 597. [Google Scholar] [CrossRef]
- Guyot, G.; Baret, F.; Jacquemoud, S. Imaging spectroscopy for vegetation studies. Imaging Spectrosc. Fundam. Prospect. Appl. 1992, 2, 145–165. [Google Scholar]
- Liu, J.; Miller, J.R.; Haboudane, D.; Pattey, E. Exploring the relationship between red edge parameters and crop variables for precision agriculture. In Proceedings of the IGARSS IEEE International Geoscience and Remote Sensing Symposium, Anchorage, AK, USA, 20–24 September 2004; pp. 1276–1279. [Google Scholar]
- Rouse, J., Jr.; Haas, R.; Deering, D.; Schell, J.; Harlan, J. Monitoring the Vernal Advancement and Retrogradation (Green Wave Effect) of Natural Vegetation; Great Plains Corridor; Texas A&M University Remote Sensing Center: College Station, TX, USA, 1974. [Google Scholar]
- Johnson, L.F.; Roczen, D.; Youkhana, S.; Nemani, R.; Bosch, D. Mapping vineyard leaf area with multispectral satellite imagery. Comput. Electron. Agric. 2003, 38, 33–44. [Google Scholar] [CrossRef]
- González Piqueras, J. Evapotranspiración de la Cubierta Vegetal Mediante la Determinación del Coeficiente de Cultivo por Teledetección. Extensión a Escala Regional: Acuífero 08.29 Mancha Oriental. Ph.D. Thesis, Universitat de València, Valencia, Spain, 2006. [Google Scholar]
- Myneni, R.B.; Ramakrishna, R.; Nemani, R.; Running, S. Estimation of global leaf area index and absorbed par using radiative transfer models. IEEE Trans. Geosci. Remote. Sens. 1997, 35, 1380–1393. [Google Scholar] [CrossRef]
- Pôças, I.; Paço, T.; Cunha, M.; Andrade, J.A.; Silvestre, J.; Sousa, A.; Santos, F.L.; Pereira, L.S.; Allen, R.G. Satellite-based evapotranspiration of a super-intensive olive orchard: Application of METRIC algorithms. Biosyst. Eng. 2014, 128, 69–81. [Google Scholar] [CrossRef]
- Bochenek, Z.; Dąbrowska-Zielińska, K.; Gurdak, R.; Niro, F.; Bartold, M.; Grzybowski, P. Validation of the LAI biophysical product derived from Sentinel-2 and Proba-V images for winter wheat in western Poland. Geoinf. Issues 2017, 9, 15–26. [Google Scholar]
- Jacquemoud, S.; Baret, F. PROSPECT: A model of leaf optical properties spectra. Remote. Sens. Environ. 1990, 34, 75–91. [Google Scholar] [CrossRef]
- Kenney, J.F. Mathematics of Statistics; D. Van Nostrand: New York, NY, USA, 1939. [Google Scholar]
- Willmott, C.; Matsuura, K. Advantages of the mean absolute error (MAE) over the root mean square error (RMSE) in assessing average model performance. Clim. Res. 2005, 30, 79–82. [Google Scholar] [CrossRef]
- De Myttenaere, A.; Golden, B.; Le Grand, B.; Rossi, F. Mean Absolute Percentage Error for regression models. Neurocomputing 2016, 192, 38–48. [Google Scholar] [CrossRef]
- Hargan, M. Measurement of Energy and Demand Savings; ASHRAE guideline 14-2002; American Society of Heating Refrigerating and Air-Conditioning Engineers Inc: Peachtree Corners, GE, USA, 2002. [Google Scholar]
- Addiscott, T.M.; Whitmore, A.P. Computer simulation of changes in soil mineral nitrogen and crop nitrogen during autumn, winter and spring. J. Agric. Sci. 1987, 109, 141–157. [Google Scholar] [CrossRef]
- Jafarmadar, S.; Nezhad, A.S. Pollutants Emission And Dispersion From Elevated Gas Flare: CS Of Aghajary. J. Ind. Pollut. Control 2015, 31, 323–331. [Google Scholar]
- Pearson, K., VII. Note on regression and inheritance in the case of two parents. Proc. R. Soc. Lond. 1895, 58, 240–242. [Google Scholar]
- Falster, D.; Westoby, M. Plant height and evolutionary games. Trends Ecol. Evol. 2003, 18, 337–343. [Google Scholar] [CrossRef]
- Law, C.N.; Snape, J.W.; Worland, A.J. The genetical relationship between height and yield in wheat. Heredity 1978, 40, 133–151. [Google Scholar] [CrossRef]
- Moles, A.T.; Warton, D.I.; Warman, L.; Swenson, N.G.; Laffan, S.W.; Zanne, A.E.; Pitman, A.; Hemmings, F.A.; Leishman, M.R.; Pitman, A.J. Global patterns in plant height. J. Ecol. 2009, 97, 923–932. [Google Scholar] [CrossRef]
- Shrestha, D.; Steward, B.; Birrell, S.; Kaspar, T. Plant height estimation using two sensing systems. In Proceedings of the ASAE Annual International Meeting, Chicago, IL, USA, 28–31 July 2002. [Google Scholar]
- Yin, X.; McClure, M.A.; Jaja, N.; Tyler, D.D.; Hayes, R.M. In-Season Prediction of Corn Yield using Plant Height under Major Production Systems. Agron. J. 2011, 103, 923–929. [Google Scholar] [CrossRef]
- Masutomi, Y.; Ono, K.; Takimoto, T.; Mano, M.; Maruyama, A.; Miyata, A. A land surface model combined with a crop growth model for paddy rice (MATCRO-Rice v. 1)—Part 2: Model validation. Geosci. Model Dev. 2016, 9, 4155–4167. [Google Scholar] [CrossRef]
- Mathison, C.; Challinor, A.J.; Deva, C.; Falloon, P.; Garrigues, S.; Moulin, S.; Williams, K.; Wiltshire, A. Developing a sequential cropping capability in the JULESvn5.2 land–surface model. Geosci. Model Dev. Discuss. 2019, 1–50. [Google Scholar] [CrossRef]
- Oleson, K.W.; Bonan, G.B. The Effects of Remotely Sensed Plant Functional Type and Leaf Area Index on Simulations of Boreal Forest Surface Fluxes by the NCAR Land Surface Model. J. Hydrometeorol. 2000, 1, 431–446. [Google Scholar] [CrossRef]
- Teixeira, A.H.D.C. Determining Regional Actual Evapotranspiration of Irrigated Crops and Natural Vegetation in the São Francisco River Basin (Brazil) using Remote Sensing and Penman-Monteith Equation. Remote. Sens. 2010, 2, 1287–1319. [Google Scholar] [CrossRef]
- Papadavid, G.; Fasoula, D.; Hadjimitsis, M.; Perdikou, P.S.; Hadjimitsis, D.G. Image based remote sensing method for modeling black-eyed beans (Vigna unguiculata) Leaf Area Index (LAI) and Crop Height (CH) over Cyprus. Open Geosci. 2013, 5, 1–11. [Google Scholar] [CrossRef]
- Papadavid, G.; Hadjimitsis, D.G.; Toulios, L.; Michaelides, S. Mapping potato crop height and leaf area index through vegetation indices using remote sensing in Cyprus. J. Appl. Remote. Sens. 2011, 5, 053526. [Google Scholar] [CrossRef]
- Thenkabail, P.S.; Smith, R.B.; de Pauw, E. Hyperspectral Vegetation Indices for Determining Agricultural Crop Characteristics; Yale University, Center for Earth Observation: New Haven, CT, USA, 1999. [Google Scholar]
- Watson, D.J. Comparative Physiological Studies on the Growth of Field Crops: I. Variation in Net Assimilation Rate and Leaf Area between Species and Varieties, and within and between Years. Ann. Bot. 1947, 11, 41–76. [Google Scholar] [CrossRef]
- Kross, A.; McNairn, H.; Lapen, D.; Sunohara, M.; Champagne, C. Assessment of RapidEye vegetation indices for estimation of leaf area index and biomass in corn and soybean crops. Int. J. Appl. Earth Obs. Geoinf. 2015, 34, 235–248. [Google Scholar] [CrossRef]
- Mkhabela, M.; Bullock, P.; Raj, S.; Wang, S.; Yang, Y. Crop yield forecasting on the Canadian Prairies using MODIS NDVI data. Agric. For. Meteorol. 2011, 151, 385–393. [Google Scholar] [CrossRef]
- Huete, A.; Didan, K.; Miura, T.; Rodriguez, E.; Gao, X.; Ferreira, L. Overview of the radiometric and biophysical performance of the MODIS vegetation indices. Remote Sens. Environ. 2002, 83, 195–213. [Google Scholar] [CrossRef]
- Liu, J.; Pattey, E.; Jégo, G. Assessment of vegetation indices for regional crop green LAI estimation from Landsat images over multiple growing seasons. Remote. Sens. Environ. 2012, 123, 347–358. [Google Scholar] [CrossRef]
- Jones, H.G. Plants and Microclimate; A Quantitative Approach to Environmental Plant Physiology; Cambridge University Press: Cambridge, UK, 2013. [Google Scholar]
- Gower, S.T.; Kucharik, C.J.; Norman, J.M.; Kucharik, C.J. Direct and Indirect Estimation of Leaf Area Index, fAPAR, and Net Primary Production of Terrestrial Ecosystems. Remote. Sens. Environ. 1999, 70, 29–51. [Google Scholar] [CrossRef]
- Wilhelm, W.W.; Ruwe, K.; Schlemmer, M.R. Comparison of Three Leaf Area Index Meters in a Corn Canopy. Crop. Sci. 2000, 40, 1179–1183. [Google Scholar] [CrossRef]
- Fang, F. The Retrieval of Leaf Inclination Angle and Leaf Area Index in Maize. Master’s Thesis, University of Twente Faculty of Geo-Information and Earth Observation (ITC), Enschede, The Netherlands, 2015. [Google Scholar]
- Tan, B.; Woodcock, C.; Hu, J.; Zhang, P.; Özdoğan, M.; Huang, D.; Yang, W.; Knyazikhin, Y.; Myneni, R.B. The impact of gridding artifacts on the local spatial properties of MODIS data: Implications for validation, compositing, and band-to-band registration across resolutions. Remote. Sens. Environ. 2006, 105, 98–114. [Google Scholar] [CrossRef]
- Sharma, L.K.; Bu, H.; Denton, A.; Franzen, D.W. Active-Optical Sensors using Red NDVI Compared to Red Edge NDVI for Prediction of Corn Grain Yield in North Dakota, U.S.A. Sensors 2015, 15, 27832–27853. [Google Scholar] [CrossRef]
- Kganyago, M.; Mhangara, P.; Alexandridis, T.; Laneve, G.; Ovakoglou, G.; Mashiyi, N. Validation of sentinel-2 leaf area index (LAI) product derived from SNAP toolbox and its comparison with global LAI products in an African semi-arid agricultural landscape. Remote. Sens. Lett. 2020, 11, 883–892. [Google Scholar] [CrossRef]
- Haboudane, D. Hyperspectral vegetation indices and novel algorithms for predicting green LAI of crop canopies: Modeling and validation in the context of precision agriculture. Remote. Sens. Environ. 2004, 90, 337–352. [Google Scholar] [CrossRef]
- Goel, N.S.; Qin, W. Influences of canopy architecture on relationships between various vegetation indices and LAI and Fpar: A computer simulation. Remote. Sens. Rev. 1994, 10, 309–347. [Google Scholar] [CrossRef]
- Turner, D.P.; Cohen, W.B.; Kennedy, R.E.; Fassnacht, K.S.; Briggs, J.M. Relationships between Leaf Area Index and Landsat TM Spectral Vegetation Indices across Three Temperate Zone Sites. Remote. Sens. Environ. 1999, 70, 52–68. [Google Scholar] [CrossRef]
- Anderson, M.C.; Gao, F.; Kustas, W.P.; Wang, Y. Simple method for retrieving leaf area index from Landsat using MODIS leaf area index products as reference. J. Appl. Remote. Sens. 2012, 6, 063554. [Google Scholar] [CrossRef]
- Jonckheere, I.; Fleck, S.; Nackaerts, K.; Muys, B.; Coppin, P.; Weiss, M.; Baret, F. Review of methods for in situ leaf area index determination. Agric. For. Meteorol. 2004, 121, 19–35. [Google Scholar] [CrossRef]
- Schaefer, M.T.; Farmer, E.; Soto-Berelov, M.; Woodgate, W.; Jones, S. Overview of ground based techniques for estimating LAI. In AusCover Good Practice Guidelines; A Technical Handbook Supporting Calibration and Validation Activities of Remotely Sensed Data Product; TERN: St Lucia, QLD, Australia; AusCover: Canbera, ACT, Australia, 2015; pp. 88–118. [Google Scholar]
- Anderson, M.C.; Neale, C.; Li, F.; Norman, J.; Kustas, W.; Jayanthi, H.; Chavez, J. Upscaling ground observations of vegetation water content, canopy height, and leaf area index during SMEX02 using aircraft and Landsat imagery. Remote. Sens. Environ. 2004, 92, 447–464. [Google Scholar] [CrossRef]
- Clevers, J.G.P.W.; Kooistra, L.; Brande, M.M.M.V.D. Using Sentinel-2 Data for Retrieving LAI and Leaf and Canopy Chlorophyll Content of a Potato Crop. Remote. Sens. 2017, 9, 405. [Google Scholar] [CrossRef]
- Bréda, N. Ground-based measurements of leaf area index: A review of methods, instruments and current controversies. J. Exp. Bot. 2003, 54, 2403–2417. [Google Scholar] [CrossRef]
- Feng, W.; Wu, Y.; He, L.; Ren, X.; Wang, Y.; Hou, G.; Wang, Y.; Liu, W.; Guo, T. An optimized non-linear vegetation index for estimating leaf area index in winter wheat. Precis. Agric. 2019, 20, 1157–1176. [Google Scholar] [CrossRef]
- Sone, C.; Saito, K.; Futakuchi, K. Comparison of Three Methods for Estimating Leaf Area Index of Upland Rice Cultivars. Crop. Sci. 2009, 49, 1438–1443. [Google Scholar] [CrossRef]
- Thimonier, A.; Sedivy, I.; Schleppi, P. Estimating leaf area index in different types of mature forest stands in Switzerland: A comparison of methods. Eur. J. For. Res. 2010, 129, 543–562. [Google Scholar] [CrossRef]
- Campbell, G. Extinction coefficients for radiation in plant canopies calculated using an ellipsoidal inclination angle distribution. Agric. For. Meteorol. 1986, 36, 317–321. [Google Scholar] [CrossRef]
- Campbell, G.; van Evert, F. Light interception by plant canopies: Efficiency and architecture. In Resource Capture by Crops; Nottingham University Press: Nottingham, UK, 1994; pp. 35–52. [Google Scholar]
- Casa, R.; Upreti, D.; Pelosi, F. Measurement and estimation of leaf area index (LAI) using commercial instruments and smartphone-based systems. IOP Conf. Ser. Earth Environ. Sci. 2019, 275, 012006. [Google Scholar] [CrossRef]
© 2020 by the authors. Licensee MDPI, Basel, Switzerland. This article is an open access article distributed under the terms and conditions of the Creative Commons Attribution (CC BY) license (http://creativecommons.org/licenses/by/4.0/).