Abstract
Soil moisture is an important variable in ecological, hydrological, and meteorological studies. An effective method for improving the accuracy of soil moisture retrieval is the mutual supplementation of multi-source data. The sensor configuration and band settings of different optical sensors lead to differences in band reflectivity in the inter-data, further resulting in the differences between vegetation indices. The combination of synthetic aperture radar (SAR) data with multi-source optical data has been widely used for soil moisture retrieval. However, the influence of vegetation indices derived from different sources of optical data on retrieval accuracy has not been comparatively analyzed thus far. Therefore, the suitability of vegetation parameters derived from different sources of optical data for accurate soil moisture retrieval requires further investigation. In this study, vegetation indices derived from GF-1, Landsat-8, and Sentinel-2 were compared. Based on Sentinel-1 SAR and three optical data, combined with the water cloud model (WCM) and the advanced integral equation model (AIEM), the accuracy of soil moisture retrieval was investigated. The results indicate that, Sentinel-2 data were more sensitive to vegetation characteristics and had a stronger capability for vegetation signal detection. The ranking of normalized difference vegetation index (NDVI) values from the three sensors was as follows: the largest was in Sentinel-2, followed by Landsat-8, and the value of GF-1 was the smallest. The normalized difference water index (NDWI) value of Landsat-8 was larger than that of Sentinel-2. With reference to the relative components in the WCM model, the contribution of vegetation scattering exceeded that of soil scattering within a vegetation index range of approximately 0.55–0.6 in NDVI-based models and all ranges in NDWI1-based models. The threshold value of NDWI2 for calculating vegetation water content (VWC) was approximately an NDVI value of 0.4–0.55. In the soil moisture retrieval, Sentinel-2 data achieved higher accuracy than data from the other sources and thus was more suitable for the study for combination with SAR in soil moisture retrieval. Furthermore, compared with NDVI, higher accuracy of soil moisture could be retrieved by using NDWI1 (R2 = 0.623, RMSE = 4.73%). This study provides a reference for the selection of optical data for combination with SAR in soil moisture retrieval.
1. Introduction
Soil moisture accounts for more than 0.05% of fresh water resources on the Earth’s surface [1]. Soil moisture is an important foundation for water-heat transfer and energy exchange between terrestrial and atmospheric systems, as well as the key bond between surface and groundwater circulation and the carbon cycle between lands [2,3,4]. Therefore, soil moisture retrieval and monitoring over extensive areas is of great significance.
Methods of soil moisture acquisition include field monitoring [5], remote sensing data retrieval [6], land surface and hydrological model simulation, as well as data assimilation [7,8]. In particular, remote sensing observation has become an important means of obtaining soil moisture information on a global scale, owing to its wide coverage, long duration, low cost, better characterization of spatial distribution, and monitoring of surface changes [9].
Among several remote sensing monitoring methods, optical methods based on spectral reflectance indices and thermal infrared methods based on thermal inertia are not applicable, as vegetation canopy can cover soil radiation information and thus affect the accuracy of soil moisture retrieval [5,6]. Consequently, they are more suitable for soil moisture monitoring in areas with bare soil and sparse vegetation. In areas with moderate to lush vegetation coverage, the microwave retrieval method has become one of the effective methods for soil moisture retrieval, due to its advantages such as long wavelength, strong penetration, and no influence from clouds [9]. However, the influence of vegetation on microwave soil moisture retrieval is inevitable. In order to correct the uncertainty of microwave scattering caused by vegetation, optical data are incorporated to obtain the vegetation parameters, through which the scattering and attenuation characteristics of vegetation are estimated and the effect on the total backscatter is eliminated [10,11,12].
The Sentinel 1A (launched in 2014) and Sentinel 1B (launched in 2016) satellites provide c-band synthetic aperture radar (SAR) data free of charge. Meanwhile, optical data have been increasingly used in soil moisture estimation, such as data from Landsat-8 [13], GF-1 [14], Sentinel-2 [15], and HJ-1 [16]. The combination of SAR data with multi-source optical data has been widely used for soil moisture retrieval. With Sentinel-1, MODIS, and Landsat-8 data, Qiu et al. [11] explored the impact of different vegetation indices on the parameterization of vegetation water content (VWC) and the accuracy of soil moisture retrieval by combining the WCM and advanced integral equation model (AIEM). Tao et al. [14] used multi-temporal SAR data and GF-1 data to propose improved vegetation backscattering model, and the results showed that the model was fairly accurate for soil moisture estimation. The multi-temporal VV polarized SAR data of Sentinel-1 and normalized difference vegetation index (NDVI) data in Sentinel-2 optical image were used. Based on the water cloud model (WCM), the accuracy of soil moisture retrieval was verified with ground measurements and neural network moisture products [17]. Using the support vector regression (SVR) technique, Attarzadeh et al. [18] combined features extracted from Sentinel-1 and Sentinel-2 data to develop a soil moisture retrieval technology, based on object-based image analysis in vegetation areas. The WCM model was parameterized based on SAR observations of different frequencies, ground measurements, and NDVI data derived from Sentinel-2, and then the neural network was used to retrieve SAR signals of different frequencies and estimate the soil moisture. The results showed that the estimated soil moisture provided by the L-band was slightly lower than that by the C-band [19]. In these studies, optical data were used to estimate the vegetation scattering part of the model by calculating vegetation parameters, for the purpose of estimating the impact of vegetation and improving the accuracy of soil moisture retrieval. However, vegetation indices derived from optical data vary among different sensors, which could lead to differences in the estimation of the scattering part of vegetation in the model of vegetation microwave scattering, and thus affect the accuracy of soil moisture retrieval. Therefore, the selection of optical data for the estimation of vegetation scattering in the model is extremely important, indicating the necessity of comparative analysis and evaluation of vegetation indices derived from optical data for soil moisture retrieval to be conducted in this direction.
In the present study, we selected a vegetation microwave scattering model (semi-empirical WCM) coupled with a physically-based AIEM, and combined them with a look-up table algorithm to carry out adaptive evaluation of soil moisture retrieval, based on vegetation indices from different sources of optical data. To quantitatively evaluate the accuracy of different optical data in soil moisture retrieval, seven VWC values calculated according to seven vegetation indices based on Landsat-8, Sentinel-2, and GF-1 data were added to the coupled vegetation microwave scattering model. This study focused on only the wheat growing areas with limited in situ soil moisture measurements. The following section introduces an overview of the study area and describes the adopted dataset. Section 3 presents the radar scattering model, algorithm of retrieval, and vegetation indices. Comparative analysis for the influence of vegetation indices derived from different sources of optical data on retrieval accuracy is given in Section 4. Finally, the main conclusions for this study are given in Section 5.
2. Data and Pre-Processing
2.1. Study Area and Ground Measurements
The study area is located in the Dingxing County, north of Baoding City, Hebei Province (Figure 1). It is located in the middle latitudes and belongs to the Haihe plain area, with an open terrain. This area belongs to the semi-arid climate in the warm and temperate zone of the eastern monsoon, which is significantly characterized by high temperatures, humid and rainy summers, and cold winters. With a long history of irrigation, it has been a well-known water conservancy area since ancient times. The main crops are winter wheat and corn, where the growth of winter wheat is from early October to early June next year. The annual mean temperature is 11.7 °C, the hottest month is July, and the monthly mean temperature is 26.2 °C.
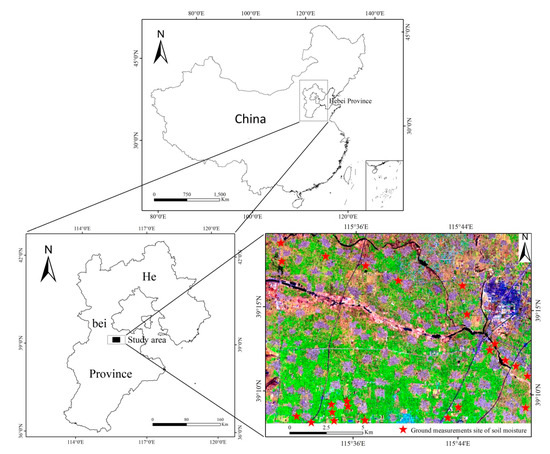
Figure 1.
Location of the study area and the ground measured sites.
The soil moisture values of the 23 measured sites used in the study were all obtained by drying. Each measuring point of soil moisture was collected at a depth of 0–5 cm. First, a certain volume of soil was processed in a dryer, and then the change in soil weight before and after drying, was used to calculate the water content of the soil volume. The value for each measured station was the average of the 5 measurement points within 3 m of the station radius. The soil surface roughness at each site was measured from two directions, i.e., parallel and perpendicular to the wheat planting, using an 87 cm plate profiler and a camera. After digitizing the shooting results, the root mean square height (s) and correlation length (l) were calculated by the designed MATLAB program.
2.2. Sentinel-1 SAR Data Collection and Processing
The sentinel-1 constellation provides free C-band SAR data with high-imaging resolution (Table 1) and short revisit cycle (6 days) [18]. Compared with ESA’s previous radar satellites (ERS-1, ERS-2, and ENVISAT), it combines features such as multi-polarization, multi-incident angle, and large width, with high-resolution ultra-wide mode and high-resolution wide interference mode. Compared to vertical transmission and horizontal reception (VH) polarization, vertical transmission and vertical reception (VV) polarization is less sensitive to vegetation cover volume scattering [20,21,22]. Zeng et al. [23] and Bao et al. [10] found that the backscattering coefficient of VV polarization is more suitable for soil moisture retrieval than that of VH polarization. As phase information was not considered, the ground distance imaging product, VV polarization, and imaging mode IW were selected.

Table 1.
Related parameters of different observation modes.
The Sentinel-1 data in the study is a LEVEL-1 product. The software SNAP provided by the European Space Agency (http://www.esa.int/ESA) was used to process the original data. Preprocessing steps include Apply orbit file, Radiation calibration, Coherent speckle filtering (Refined Lee filter), and the Doppler terrain correction. The results to be preprocessed were converted to a logarithmic scale to obtain a true backscatter coefficient image.
2.3. Optical Data Collection and Processing
Sentinel-2 is a high spatial resolution (10, 20, 60 m), high temporal resolution (5 days), multispectral (13 bands) imaging satellite carrying a multispectral imager (MSI), comprising two satellites (2A and 2B) [19]. Sentinel-2A provides five levels of data products—L0, L1A, L1B, L1C, and L2A. ESA releases only L1C products to users. Sentinel-2 data were provided by the United States Geological Survey (https://glovis.usgs.gov/). Based on the plug-in-Sen2cor of the Snap software, pre-processing steps such as atmospheric correction and radiation calibration was performed to obtain the surface reflectance L2A product.
Landsat-8 is the eighth satellite in the Landsat satellite series, carrying two main payloads—Operational Land Image (OLI) and Thermal Infrared Sensor (TIRS) [13]. The satellite has a total of 11 bands. The spatial resolution is 30 m, except for the thermal infrared band (100 m) and the panchromatic band (15 m). Compared to other Landsat satellites, Landsat-8 is a significant improvement in terms of the number of bands, number of images, and level of data quantization. Two Landsat-8 images were downloaded from the geospatial data cloud (http://www.gscloud.cn/), and the original images were pre-processed with the ENVI5.3 software. The main operation steps include radiation calibration, atmospheric correction, and geometric correction.
Gaofen-1 is the first satellite of China’s high-resolution Earth observation system, and was launched on April 26, 2013 [14]. The satellite is equipped with a panchromatic/multispectral camera (PMS sensor, 2m/8m) and a multispectral camera (WFV sensor, 16 m), with a short revisit cycle, high platform stability and a design life of no less than 5 years. The GF-1 WFV data in this study was downloaded from the China Centre for Resources Satellite Data and Application (http://www.cresda.com/CN/). Preprocessing steps, including radiation calibration, atmospheric correction, ortho-rectification, and geometric correction, were consecutively completed in the ENVI5.3 software.
The nearest neighbor sampling method has been widely used in many data comparison studies [24,25,26]. According to the requirement of the research of comparative analysis, preprocessed Landsat-8, Sentinel-2, and GF-1 data were sampled with a spatial resolution of 30 m, using the method of nearest neighbor sampling. As the vegetation in the agricultural area did not change greatly within one week, the difference in the number of days of the three types of optical image data corresponding to each SAR data was set within one week (Table 2).
Table 2.
Sentinel-1 and optical data used in this study.
3. Methodology
In this study, the structure of comparative analysis on the soil moisture retrieval based on GF-1, Landsat-8, and Sentinel-2 data is described by the flow chart in Figure 2.
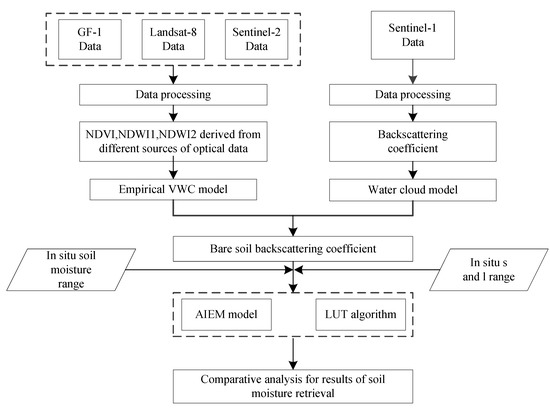
Figure 2.
Flowchart of the soil moisture retrieval based on GF-1, Landsat-8, and Sentinel-1/2.
The first step involved the processing of data used in this paper such as GF-1, Landsat-8, and Sentinel-1/2. Vegetation indices extracted from these processed optical data were used to calculate VWCs using the empirical VWC model. Based on WCM, the total backscatter coefficient achieved from processed Sentinel-1 SAR was combined with VWCs to obtain the bare soil backscatter coefficient. Referring to the range of in situ soil moisture and in situ s and l, results of the soil moisture retrieval based on the LUT algorithm and the database established by AIEM were obtained. Finally, results of soil moisture retrieval based on different sources of optical data were comparatively analyzed.
3.1. Microwave Scattering Model Based on Bare and Vegetation Cover
As this study focused on the retrieval of surface soil moisture in a wheat farmland, a WCM suitable for crop cover was selected [27]. This semi-empirical WCM model, which briefly described the scattering mechanism of crop cover, with few input parameter, had been widely used to simulate SAR data [28,29,30]. Under a given polarization mode, the total backscatter term () of this model was composed of the body scattering term directly scattered by the vegetation layer () and the soil scattering term ():
where and are descriptive parameters of vegetation canopy; θ is the radar incident angle (degrees); A and B are empirical coefficient which need to be adjusted according to radar configurations and vegetation types; is the two-way attenuation.
In this study, the values of A and B refer to the results of Bindlish et al. [31], in which empirical parameters of WCMs with different land cover modes were investigated (Table 3). As the crop in the study area is wheat, winter wheat was selected, that is, A = 0.0018 and B = 0.1380. In most current studies, E1 and E2 are generally treated as equal, and they are usually characterized by NDVI, LAI, or VWC [21,28,32,33]. El Hajj et al. [9] reported similar accuracies for soil moisture retrieval when WCM was combined with vegetation description values such as LAI, VWC, biomass, and FAPAR. In this study, E1 = E2 = VWC (VWC values were obtained from the relationship between vegetation index and VWC; VWC is also wheat water content). According to the Sentinel-1 original data, the incident angle information was derived to minimize the influence of the incident angle on the retrieval accuracy.
Table 3.
Empirical parameters of the water cloud model.
The AIEM model developed on the basis of the IEM model [34,35], which can better simulate the backscattering of various bare surfaces [36,37], was used to replace the soil scattering term in Equation (1). In AIEM, the backscattering coefficient is a function of the dielectric constant, sensor parameters, radar frequency, incident angle, roughness parameter (l, s), and autocorrelation function (p). It can be expressed as follows:
where pq stands for co-polarization or cross-polarization, k is the spatial wavenumber (=2πf), θ is the radar incident angle, is the power Fourier transform of autocorrelation function, s is the root-mean-square height of the soil surface, and and are the complementary field and Kirchhoff coefficients, respectively. Here, the soil dielectric constant calculated by the Dobson model was selected as the input variable of the AIEM model. This model is a function of the incident wave frequency, soil moisture, soil texture, and soil temperature. It is used in both the AMSR-E/2 and SMOS soil moisture products algorithms [38,39,40].
3.2. Vegetation Indices and Vegetation Water Content
The VWC is an important parameter of the WCM model. We characterized it by the equation relationship between vegetation indices and VWC. In our study, Landsat-8, GF-1, and Sentinel-2 data were used for calculating NDVI and normalized difference water index (NDWI). As the Landsat-8 and Sentinel-2 have two short-wave infrared bands, they can provide NDWI1 and NDWI2 (NDWI1 corresponds to band 11 of Sentinel-2 and band 6 of Landsat-8, NDWI2 corresponds to band 12 of Sentinel-2 and band 7 of Landsat-8). Numerous studies have established linear, exponential, polynomial, and other relationships through VWC and vegetation indices [41,42,43]. Gao et al. [44] integrated a large number of existing vegetation moisture content models and proposed a more superior VWC model. To quantitatively describe the difference between different data sources, this study used an expression of VWC based on wheat [44]. The VWC expression was as follows:
VWC = 0.078 × 103.510*NDVI
VWC = 2.45*NDWI1 + 0.57
VWC = 12.38*NDWI2 − 3.26
3.3. Look Up Table (LUT) Algorithm Creation
The AIEM model was used to simulate the backscattering coefficient values of the bare surface and generate a database. An optimal cost function was established to ensure that the backscatter coefficient simulated by the AIEM model best matched the backscatter coefficient of the radar data after removing the effects of vegetation. The final soil moisture retrieval result was achieved by finding the soil moisture information corresponding to the simulated backscatter coefficient that minimized the cost function. Soil roughness is an important factor affecting the accuracy of soil moisture retrieval, and many parameters had been developed to describe soil roughness. In this study, the threshold range of the roughness parameter was set in the LUT algorithm, which covers various possible conditions of the surface. Referring to the measured data, the root mean square height, correlation length, and soil moisture value of the study area were limited to [0, 4.0], [0, 13], and [0, 35], respectively. The increments for these three parameters were set as 0.1 cm, 1.0 cm, and 1%, respectively. The cost function was as follows:
where S is the cost function, is the backscattering coefficient of the VV polarization extracted from the radar image, and is the backscattering coefficient simulated by the AIEM model.
4. Results and Discussion
4.1. Differences in Different Optical Data Indices
We systematically compared the differences between different optical data indices for the overall study area to the local measured sites (NDVI, NDWI1, NDWI2). Figure 3 and Table 4 provide the comparison results of 3 pairs of optical data (Since GF-1 did not have a shortwave infrared band, i.e., 7 pairs of indices).
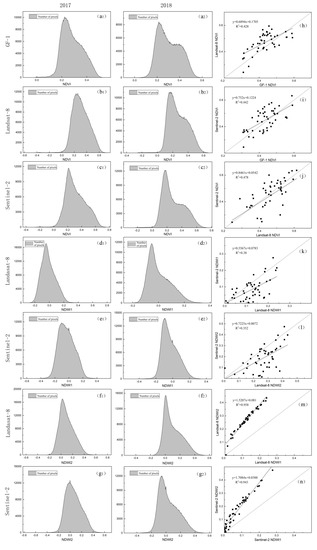
Figure 3.
Pixel number distribution of each index data (left and middle) and relationship between different optical indices collected from 46 measured sites in two time periods (right) (2017 and 2018, represent the optical data used in this study in 2017 and the optical data used in 2018, respectively).
Table 4.
Statistics of three optical indices in the study area.
From the statistical characteristics and pixel number distribution map (a–c) of the 3 pairs of NDVI, the mean values and standard deviation of sentinel-2 NDVI data appeared to always be higher than the mean values and standard deviation of GF-1 NDVI and Landsat-8 NDVI, regardless of differences in the remote sensor, season, and vegetation growth stage. GF-1 NDVI showed the lowest standard deviation and mean value. Sentinel-2 NDVI showed the most pixel counts in the high value part. The pixel number ratio (number of pixels for statistical threshold greater than 0.4/total number of pixels), was found to be the highest for Sentinel-2 NDVI (Table 5). The values of NDVI from the three sensors, ranked from low to high, were in the following order: GF-1 < Landsat-8 < Sentinel-2.
Table 5.
Percentage statistics of NDVI threshold greater than 0.4.
As GF-1 did not have a short-wave infrared band, only NDWI1 and NDWI2 of Landsat-8 and Sentinel-2 were compared. According to the statistical characteristics of NDWI1 and NDWI2 in Table 4 and Figure 3d–g, the mean values and standard deviation of NDWI2 were found to always be greater than the mean values and the standard deviation of NDWI1, and the overall value of NDWI2 was higher than that of NDWI1. Compared to the NDWI1 and NDWI2 data of Landsat-8, the mean values of Sentinel-2 NDWI1 and NDWI2 data were smaller. The ratio of pixel number (number of pixels for statistical threshold greater than 0/total number of pixels), showed that Landsat-8 NDWI1 and NDWI2 accounted for a higher proportion (Table 6). The NDWI value (including NDWI1, NDWI2) of Landsat-8 was larger than that of Sentinel-2.
Table 6.
Percentage statistics of NDWI threshold greater than 0.
These optical indices show a weak correlation over the measured sites (Figure 3h–n). If the time series of the measured sites are considered or a large number of points are selected for relationship fitting, a better fitting effect will be achieved [45,46]. At the same time, the comparison of sparse sites also reveals that there are some differences in the indices from different optical sensors.
The spectral response functions of the three sensors show different performances (Figure 4). In the infrared band, Landsat-8 and GF-1 were more stable, and Sentinel-2 exhibited a trough at 662 nm, indicating decreased ability to receive radiation signals. In the near-infrared band, due to the effect of water vapor absorption at 825 nm [47], the near-infrared band detection capability of Sentinel-2 and GF-1 are weakened. Sentinel-2 and Landsat-8 exhibit similar performances in the short-wave infrared band. The detection capabilities of the different band signals of each sensor vary, which is one of the reason for the difference between the indices [48,49]. Compared with the other two satellites, Sentinel-2 has a high spatial resolution and can detect ground objects in greater detail, which may be another reason for the difference in the indices [45]. Relevant research show that the difference in optical data is also related to transit time, preprocessing steps, etc. [47,50]. In this study, the values of Sentinel-2 NDVI were higher and the values of GF-1 NDVI were smaller, which is consistent with the relevant results of data comparison of Lessio et al [51] and He et al [52], respectively. According to the conclusion of Xu and Zhang [45] that differences in the mean values of NDVI reflect the strength of vegetation signal detection, the results show that Sentinel-2 data are more sensitive to vegetation characteristics and have a stronger ability to detect vegetation signals, which is consistent with the conclusion of Pan et al. [53] in the comparative study of optical data. By analyzing the spectral characteristic curve of vegetation (right in Figure 4), surface reflectance was found to gradually decrease with increasing wavelength of short-wave infrared, resulting in a larger NDWI2 value in the longer band (2100–2300 nm). It is interesting that Yantao et al. [46] compared the average reflectance of the two optical data bands. The average reflectance of Landsat-8 in the near-infrared band is higher than that of Sentinel-2. However, the short-wave infrared band tends to be equal to the increase in wavelength, which shows that the values of NDWI1 and NDWI2 of Sentinel-2 are less than the corresponding indices of Landsat-8, which is consistent with the results of this study.
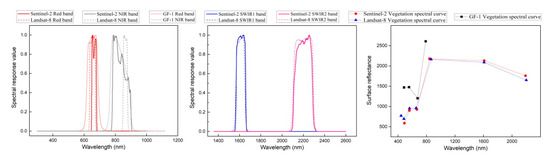
Figure 4.
Spectral responses of the red, near-infrared (NIR), and short-wave infrared (SWIR1, SWIR2) bands for GF-1, Landsat-8 and Sentinel-2 (left and middle), and vegetation spectral curves of three optical sensors (right).
4.2. Contribution of Bare Soil Scattering to Total Scattering with Different Indices
Differences between indices cause deviations in vegetation descriptors, which in turn leads to a certain difference in the contribution of vegetation scattering described. In the model, the ratio of the contribution of soil scattering to total scattering can reflect contribution of vegetation scattering to a certain extent. Combining the data of the same indices from the same remote sensor in two time periods, a graph of the ratio of the contribution of soil scattering to the total scattering as a function of indices was prepared based on the measured sites (Figure 5). Among them, according to formula 10, when the calculation of VWC for NDWI2 satisfies NDWI2 > 0.27, VWC is a positive value. Accordingly, only data with threshold greater than 0.27 was selected in NDWI2. In Figure 5, the scattering ratio of all the measured sites gradually decrease with increasing values of the indices, indicating that the contribution of vegetation scattering increases with the increasing values of the indices, while the contribution of soil scattering shows the opposite trend.
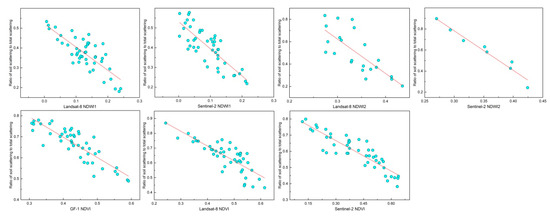
Figure 5.
Ratio of bare soil contribution to total scattering () for all sites using seven indices. Each graph fits a curve through the regression equation to show the trend.
Regardless of the sensor type, the threshold value for the contribution of vegetation scattering exceeded that of soil scattering within approximately 0.55–0.6 for NDVI and any range for NDWI1. Compared with NDVI, NDWI1 has a stronger response to vegetation scattering. In addition, Landsat-8 has the strongest response to vegetation scattering in NDWI1-based models. Sentinel-2 has the strongest response to vegetation scattering in NDVI-based models. In NDWI2 shown in Figure 3, regardless of the type of sensor, eligible points were extremely rare. This is because most pixels of NDWI2 were below 0.27. The investigation results show that when Landsat-8 NDVI > 0.48 and Sentinel-2 NDVI > 0.53, NDWI2 is above 0.27. A further review of the works of Maggioni et al. [54] and Yi et al. [55] revealed that the calculation of VWC for NDWI2 has certain limitations, that is, NDWI2 requires a certain threshold. Combined with the survey, the threshold at which a positive value can be achieved for VWC calculated with NDWI2 is approximately 0.4–0.55 for NDVI. VWC calculated with NDWI2 is meaningful in areas with medium and high vegetation coverage.
4.3. Effect of Indices from Different Optical Data on Accuracy of Soil Moisture Retrieval
The degree of elimination for the contribution of vegetation scattering can affect the accuracy of soil moisture retrieval. As NDWI2 for the study area cannot be used to effectively retrieve VWC, NDWI2 was excluded from further the comparative experiments of soil moisture retrieval. The retrieval results based on the indices from different optical data show that Sentinel-2 NDVI and Sentinel-2 NDWI1 achieve higher retrieval accuracy (Figure 6, Table 7). Nevertheless, the accuracy of soil moisture retrieval based on NDWI1 was higher than that based on NDVI in the Sentinel-2 data (R2 = 0.623, RMSE = 4.73%).
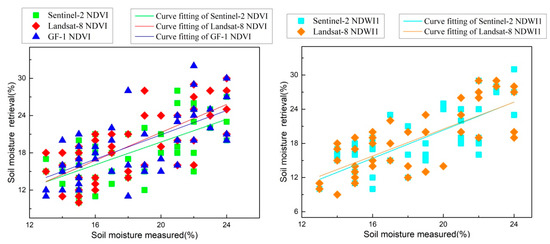
Figure 6.
Scatter plot between the value of soil moisture retrieval and the value of measured soil moisture.
Table 7.
Statistical parameters of soil moisture retrieval with different optical data indices.
NDVI < 0.7 is more sensitive to soil moisture [56], making the accuracy of soil moisture retrieval in this interval more reliable. The NDVI values of each sensor were different, but they were all less than 0.7 in this study. Sentinel-2 NDVI has a stronger ability to detect vegetation signals, and more accurately describes the true situation of NDVI, thereby effectively eliminating the contribution of vegetation scattering and making soil moisture retrieval with Sentinel-2 data more accurate. Short-wave infrared is more sensitive to VWC [57,58], and NDWI1 had a higher correlation with VWC [59], providing more accurate elimination of the contribution of vegetation scattering and higher accuracy of soil moisture retrieval. NDWI derived from Sentinel-2 is more advantageous than that from Landsat-8 [46]. Although Landsat-8 is slightly higher in band reflectivity than Sentinel-2, it may cause excessive elimination of vegetation scattering contribution, resulting in lower accuracy of soil moisture retrieval.
5. Conclusions
The removal of contribution of vegetation scattering in vegetation coverage areas has a significant impact on the retrieval accuracy. As optical remote sensing satellites are continuously being launched into the space, the diversity and difference of optical data will affect the degree of contribution of vegetation scattering, which will affect the retrieval accuracy. Selecting appropriate optical data to achieve the goal of better eliminating the contribution of vegetation scattering is one of the key factors for improving the reliability of retrieval results. For wheat vegetation, a comparative study on the accuracy of seven indices derived from three sources of optical data for soil moisture retrieval was carried out. Based on the WCM vegetation scattering model and the AIEM soil scattering model, the effectiveness of different types of optical data for soil moisture retrieval was investigated.
Compared with GF-1 and Landsat-8, the mean value and standard deviation of Sentinel-2 NDVI were the highest, indicating that sentinel-2 data was more sensitive to vegetation characteristics and had stronger capability for vegetation signal detection. The ranking of NDVI values from the three sensors followed the order: GF-1 < Landsat-8 < Sentinel-2. The NDWI1 and NDWI2 values of Landsat-8 were larger than those of Sentinel-2.Differences between the indices data derived from different sources of optical data lead to differences in the contribution of vegetation scattering. Regardless of the sensor type, the threshold value for the contribution of vegetation scattering exceeded that of soil scattering within approximately 0.55–0.6 for NDVI and any range for NDWI1. The threshold value at which NDWI2 can be used to calculate VWC was approximately 0.4–0.55 for NDVI. VWC calculated with NDWI2 was meaningful over areas with medium and high vegetation coverage. In the soil moisture retrieval, Sentinel-2 data achieved better retrieval accuracy for both NDVI and NDWI1 in the estimation of the contribution of vegetation scattering. And Sentinel-2 data was suitable for retrieval of soil moisture than data from the other sources. Furthermore, compared with NDVI, NDWI1 showed higher accuracy of soil moisture retrieval (R2 = 0.623, RMSE = 4.73%).
Owing to the limited data available for this study, only factors such as vegetation growth stage and seasonal difference were considered in the comparative analysis of optical data. In the future, topography, climate and other factors will be considered for the comprehensive assessment of optical data, so as to provide more scientific reference for the selection of optical data for soil moisture retrieval. In addition, SAR data in the L-band shows great potential in soil moisture retrieval, and the use of SAR data in the L-band for studies of soil moisture retrieval will also be considered in the future.
Author Contributions
Q.W., J.S. and Y.Z. collected the original data; Q.W. and T.J. jointly designed the study and wrote the manuscript; X.C., D.L. and Y.L. helped on the revision and discussion; T.J. and J.L. provided supervision. All authors have read and agreed to the published version of the manuscript.
Funding
This research was funded by National Natural Science Foundation of China under grant 41721003, Natural Science Foundation of Hubei Province of China under grant 2019CFB427, National Basic Research Program of China under grant 2013CB733302, Scientific Research Project of City College, Southwest University of Science and Technology(Grant No. 2020XJXM03); the Key Laboratory of Geospace Environment and Geodesy, Ministry of Education, Wuhan University, under grant 17-02-07 and the Key Laboratory of Surveying and Mapping Science and Geospatial Information Technology of Ministry of Natural Resources (2020-1-3).
Acknowledgments
All the respectable reviewers and editors are acknowledged for their fruitful comments and suggestions about the paper.
Conflicts of Interest
The authors declare no conflict of interest.
References
- Gleick, P.H. Water resources. In Encyclopedia of Climate and Weather; Schneider, S.H., Ed.; Oxford University Press: New York, NY, USA, 1996; pp. 817–823. [Google Scholar]
- Scholze, M.; Kaminski, T.; Knorr, W.; Blessing, S.; Vossbeck, M.; Grant, J.P.; Scipal, K. Simultaneous assimilation of SMOS soil moisture and atmospheric CO2 in-situ observations to constrain the global terrestrial carbon cycle. Remote Sens. Environ. 2016, 180, 334–345. [Google Scholar] [CrossRef]
- Larson, K.M.; Small, E.E.; Gutmann, E.D.; Bilich, A.L.; Braun, J.J.; Zavorotny, V.U. Use of GPS receivers as a soil moisture network for water cycle studies. Geophys. Res. Lett. 2008, 35, 24. [Google Scholar] [CrossRef]
- Petrone, R.M.; Price, J.S.; Waddington, J.M.; Von Waldow, H. Surface moisture and energy exchange from a restored peatland, Quebec, Canada. J. Hydrol. 2004, 295, 198–210. [Google Scholar] [CrossRef]
- Zhang, D.; Zhou, G. Estimation of soil moisture from optical and thermal remote sensing: A. review. Sensors 2016, 16, 1308. [Google Scholar] [CrossRef] [PubMed]
- Baghdadi, N.N.; El Hajj, M.; Zribi, M.; Fayad, I. Coupling SAR C-band and optical data for soil moisture and leaf area index retrieval over irrigated grasslands. IEEE J. Sel. Top. Appl. Earth Obs. Remote Sens. 2015, 9, 1229–1243. [Google Scholar] [CrossRef]
- Houser, P.R.; Shuttleworth, W.J.; Famiglietti, J.S.; Gupta, H.V.; Syed, K.H.; Goodrich, D.C. Integration of soil moisture remote sensing and hydrologic modeling using data assimilation. Water Resour. Res. 1998, 34, 3405–3420. [Google Scholar] [CrossRef]
- Draper, C.; Mahfouf, J.; Calvet, J.C.; Martin, E.L.; Wagner, W. Assimilation of ASCAT near-surface soil moisture into the SIM hydrological model over France. Hydrol. Earth Syst. Sci. 2011, 15, 3829. [Google Scholar] [CrossRef]
- El Hajj, M.; Baghdadi, N.; Zribi, M.; Belaud, G.; Cheviron, B.; Courault, D.; Charron, F. Soil moisture retrieval over irrigated grassland using X-band SAR data. Remote Sens. Environ. 2016, 176, 202–218. [Google Scholar] [CrossRef]
- Bao, Y.; Lin, L.; Wu, S.; Deng, K.A.; Petropoulos, G.P. Surface soil moisture retrievals over partially vegetated areas from the synergy of Sentinel-1 and Landsat 8 data using a modified water-cloud model. Int. J. Appl. Earth Obs. Geoinf. 2018, 72, 76–85. [Google Scholar] [CrossRef]
- Qiu, J.; Crow, W.T.; Wagner, W.; Zhao, T. Effect of vegetation index choice on soil moisture retrievals via the synergistic use of synthetic aperture radar and optical remote sensing. Int. J. Appl. Earth Obs. Geoinf. 2019, 80, 47–57. [Google Scholar] [CrossRef]
- Zribi, M.; Muddu, S.; Bousbih, S.; Bitar, A.A.; Tomer, S.K.; Baghdadi, N.; Bandyopadhyay, S. Analysis of L-band SAR data for soil moisture estimations over agricultural areas in the tropics. Remote Sens. 2019, 11, 1122. [Google Scholar] [CrossRef]
- Zhao, X.; Huang, N.; Niu, Z.; Raghavan, V.; Song, X. Soil moisture retrieval in farmland using C-band SAR and optical data. Spat. Inf. Res. 2017, 25, 431–438. [Google Scholar] [CrossRef]
- Tao, L.; Wang, G.; Chen, W.; Chen, X.; Li, J.; Cai, Q. Soil moisture retrieval from SAR and optical data using a combined model. IEEE J. Sel. Top. Appl. Earth Obs. Remote Sens. 2019, 12, 637–647. [Google Scholar] [CrossRef]
- Attarzadeh, R.; Amini, J. Towards an object-based multi-scale soil moisture product using coupled Sentinel-1 and Sentinel-2 data. Remote Sens. Lett. 2019, 10, 619–628. [Google Scholar] [CrossRef]
- He, B.; Xing, M.; Bai, X. A synergistic methodology for soil moisture estimation in an alpine prairie using radar and optical satellite data. Remote Sens. 2014, 6, 10966–10985. [Google Scholar] [CrossRef]
- Bousbih, S.; Zribi, M.; El Hajj, M.; Baghdadi, N.; Lilichabaane, Z.; Gao, Q.; Fanise, P. Soil moisture and irrigation mapping in A semi-arid region, based on the synergetic use of Sentinel-1 and Sentinel-2 data. Remote Sens. 2018, 10, 1953. [Google Scholar] [CrossRef]
- Attarzadeh, R.; Amini, J.; Notarnicola, C.; Greifeneder, F. Synergetic use of Sentinel-1 and Sentinel-2 data for soil moisture mapping at plot scale. Remote Sens. 2018, 10, 1285. [Google Scholar] [CrossRef]
- El Hajj, M.; Baghdadi, N.; Zribi, M. Comparative analysis of the accuracy of surface soil moisture estimation from the C-and L-bands. Int. J. Appl. Earth Obs. Geoinf. 2019, 82, 101888. [Google Scholar] [CrossRef]
- Patel, P.; Srivastava, H.S.; Panigrahy, S.; Parihar, J.S. Comparative evaluation of the sensitivity of multi-polarized multi-frequency SAR backscatter to plant density. Int. J. Remote Sens. 2006, 27, 293–305. [Google Scholar] [CrossRef]
- Baghdadi, N.; El Hajj, M.; Zribi, M.; Bousbih, S. Calibration of the water cloud model at C-band for winter crop fields and grasslands. Remote Sens. 2017, 9, 969. [Google Scholar] [CrossRef]
- Chauhan, S.; Srivastava, H.S. Comparative evaluation of the sensitivity of multi-polarised sar and optical data for various land cover classes. Int. J. Adv. Remote Sens. GIS Geogr. 2016, 4, 1–14. [Google Scholar]
- Zeng, X.; Xing, Y.; Shan, W.; Zhang, Y.; Wang, C. Soil water content retrieval based on Sentinel-1A and Landsat 8 image for Bei’an-Heihe Expressway. Chin. J. Eco. Agric. 2017, 25, 118–126. [Google Scholar]
- Cui, C.; Xu, J.; Zeng, J.; Chen, K.; Bai, X.; Lu, H.; Chen, Q.; Zhao, T. Soil moisture mapping from satellites: An intercomparison of SMAP, SMOS, FY3B, AMSR2, and ESA CCI over two dense network regions at different spatial scales. Remote Sens. 2018, 10, 33. [Google Scholar] [CrossRef]
- Kim, H.; Parinussa, R.; Konings, A.G.; Wagner, W.; Cosh, M.H.; Lakshmi, V.; Zohaib, M.; Choi, M. Global-scale assessment and combination of SMAP with ASCAT (active) and AMSR2 (passive) soil moisture products. Remote Sens. Environ. 2018, 204, 260–275. [Google Scholar] [CrossRef]
- Ma, H.; Zeng, J.; Chen, N.; Zhang, X.; Cosh, M.H.; Wang, W. Satellite surface soil moisture from SMAP, SMOS, AMSR2 and ESA CCI: A comprehensive assessment using global ground-based observations. Remote Sens. Environ. 2019, 231, 111215. [Google Scholar] [CrossRef]
- Attema, E.P.W.; Ulaby, F.T. Vegetation modeled as a water cloud. Radio Sci. 1978, 13, 357–364. [Google Scholar] [CrossRef]
- Paloscia, S.; Pettinato, S.; Santi, E.; Notarnicola, C.; Pasolli, L.; Reppucci, A. Soil moisture mapping using Sentinel-1 images: Algorithm and preliminary validation. Remote Sens. Environ. 2013, 134, 234–248. [Google Scholar] [CrossRef]
- Yang, G.; Shi, Y.; Zhao, C.; Wang, J. Estimation of soil moisture from multi-polarized SAR data over wheat coverage areas. In Proceedings of the 2012 First International Conference on Agro-Geoinformatics (Agro-Geoinformatics), Shanghai, China, 2–4 August 2012. [Google Scholar]
- Zribi, M.; Chahbi, A.; Shabou, M.; Lilichabaane, Z.; Duchemin, B.; Baghdadi, N.; Amri, R.; Chehbouni, A. Soil surface moisture estimation over a semi-arid region using ENVISAT ASAR radar data for soil evaporation evaluation. Hydrol. Earth Syst. Sci. Discuss. 2011, 15, 345–358. [Google Scholar] [CrossRef]
- Bindlish, R.; Barros, A.P. Parameterization of vegetation backscatter in radar-based, soil moisture estimation. Remote Sens. Environ. 2001, 76, 130–137. [Google Scholar] [CrossRef]
- Sikdar, M.; Cumming, I. A Modified Empirical Model for Soil Moisture Estimation in Vegetated Areas Using SAR Data. In Proceedings of the IGARSS 2004. 2004 IEEE International Geoscience and Remote Sensing Symposium, Anchorage, AK, USA, 20–24 September 2004; IEEE: Piscataway, NJ, USA, 2004; Volume 2, pp. 803–806. [Google Scholar]
- Prevot, L.; Champion, I.; Guyot, G. Estimating surface soil moisture and leaf area index of a wheat canopy using a dual-frequency (C and X bands) scatterometer. Remote Sens. Environ. 1993, 46, 331–339. [Google Scholar] [CrossRef]
- Chen, K.S.; Wu, T.D.; Tsay, M.K.; Fung, A.K. Note on the multiple scattering in an IEM model. IEEE Trans. Geosci. Remote Sens. 2000, 38, 249–256. [Google Scholar] [CrossRef]
- Fung, A.K.; Liu, W.Y.; Chen, K.S.; Tsay, M. An improved IEM model for bistatic scattering from rough surfaces. J. Electromagn. Waves Appl. 2002, 16, 689–702. [Google Scholar] [CrossRef]
- Chen, L.; Shi, J.; Wigneron, J.P.; Chen, K. A parameterized surface emission model at L-band for soil moisture retrieval. IEEE Geosci. Remote Sens. Lett. 2009, 7, 127–130. [Google Scholar] [CrossRef]
- Nearing, G.S.; Moran, M.S.; Thorp, K.R.; Collins, C.D.; Slack, D.C. Likelihood parameter estimation for calibrating a soil moisture model using radar bakscatter. Remote Sens. Environ. 2010, 114, 2564–2574. [Google Scholar] [CrossRef]
- Njoku, E.G.; Jackson, T.J.; Lakshmi, V.; Chan, T.K.; Nghiem, S.V. Soil moisture retrieval from AMSR-E. IEEE Trans. Geosci. Remote Sens. 2003, 41, 215–229. [Google Scholar] [CrossRef]
- Njoku, E.G.; Chan, S.K. Vegetation and surface roughness effects on AMSR-E land observations. Remote Sens. Environ. 2006, 100, 190–199. [Google Scholar] [CrossRef]
- Jacquette, E.; Al Bitar, A.; Mialon, A.; Kerr, Y.; Quesney, A.; Cabot, F.; Richaume, P. SMOS CATDS level 3 global products over land[C]//Remote Sensing for Agriculture, Ecosystems, and Hydrology XII. Int. Soc. Opt. Photonics 2010, 7824, 78240K. [Google Scholar]
- Huang, J.; Chen, D.; Cosh, M.H. Sub-pixel reflectance unmixing in estimating vegetation water content and dry biomass of corn and soybeans cropland using normalized difference water index (NDWI) from satellites. Int. J. Remote Sens. 2009, 30, 2075–2104. [Google Scholar] [CrossRef]
- Jiang, J.; Hu, D.; Li, Y.; Tang, X.; Li, J. Research of soil moisture retrieval model of wheat covered surface based on MIMICS model. J. Triticeae Crop. 2015, 35, 707–713. [Google Scholar]
- Cheng, X.; Yang, G.; Xu, X.; Chen, T.; Wang, D. Inferred water content of winter wheat based on ground hyperspectral and remote sensing data of TM5. J. Triticeae Crop. 2014, 34, 227–233. [Google Scholar]
- Gao, Y.; Walker, J.P.; Allahmoradi, M.; Monerris, A.; Ryu, D.; Jackson, T.J. Optical sensing of vegetation water content: A synthesis study. IEEE J. Sel. Top. Appl. Earth Obs. Remote Sens. 2015, 8, 1456–1464. [Google Scholar]
- Xu, H.; Zhang, T. Assessment of consistency in forest-dominated vegetation observations between ASTER and Landsat ETM+ images in subtropical coastal areas of southeastern China. Agric. For. Meteorol. 2013, 168, 1–9. [Google Scholar] [CrossRef]
- Yantao, X.I.; Thinh, N.X.; Cheng, L.I. Preliminary comparative assessment of various spectral indices for built-up land derived from Landsat-8 OLI and Sentinel-2A MSI imageries. Eur. J. Remote Sens. 2019, 52, 240–252. [Google Scholar]
- Wu, X.P.; Xu, H.Q.; Jiang, Q.L. Cross-Comparison of GF-1, GF-2 and landsat-8 OLI sensor data. Geomat. Inf. Sci. Wuhan Univ. 2020, 45, 150–158. [Google Scholar] [CrossRef]
- Mandanici, E.; Bitelli, G. Preliminary comparison of Sentinel-2 and landsat 8 imagery for a combined use. Remote Sens. 2016, 8, 1014. [Google Scholar] [CrossRef]
- Arekhi, M.; Goksel, C.; Sanli, F.B.; Senel, G. Comparative evaluation of the spectral and spatial consistency of Sentinel-2 and Landsat-8 OLI data for igneada longos forest. ISPRS Int. J. Geo Inf. 2019, 8, 56. [Google Scholar] [CrossRef]
- Zhao, J.; Li, J.; Liu, Q.; Wang, H.; Chen, C.; Xu, B.; Wu, S. Comparative analysis of Chinese HJ-1 CCD, GF-1 WFV and ZY-3 MUX sensor data for leaf area index estimations for maize. Remote Sens. 2018, 10, 68. [Google Scholar] [CrossRef]
- Lessio, A.; Fissore, V.; Borgognomondino, E. Preliminary tests and results concerning integration of Sentinel-2 and Landsat-8 OLI for crop monitoring. J. Imaging 2017, 3, 49. [Google Scholar] [CrossRef]
- He, L.I.; Chen, Z.; Jiang, Z.; Wenbin, W.U.; Ren, J.; Liu, B.; Tuya, H. Comparative analysis of GF-1, HJ-1, and Landsat-8 data for estimating the leaf area index of winter wheat. J. Integr. Agric. 2017, 16, 266–285. [Google Scholar]
- Pan, Y.Y.; Li, C.C.; Ma, X.X.; Wang, B.S.; Fang, X. Atmospheric correction method of sentinel-2A satellite and result analysis. Remote Sens. Inf. 2018, 33, 41–48. [Google Scholar]
- Maggioni, R.; Panciera, J.P.; Walker, M.; Rinaldi, V. A multi-sensor approach for high resolution airborne soil moisture mapping. In In Proceedings of the 30th Hydrology and Water Resource Symp[CD-ROM], Hobart, Australia, 4–8 December 2006. [Google Scholar]
- Yi, Y.; Yang, D.; Chen, D.; Huang, J. Retrieving crop physiological parameters and assessing water deficiency using MODIS data during the winter wheat growing period. Can. J. Remote Sens. 2007, 33, 189–202. [Google Scholar] [CrossRef]
- Elhajj, M.; Baghdadi, N.; Bazzi, H.; Zribi, M. Penetration analysis of sar signals in the c and l bands for wheat, maize, and grasslands. Remote Sens. 2019, 11, 31. [Google Scholar] [CrossRef]
- Ceccato, P.; Gobron, N.; Flasse, S.P.; Pinty, B.; Tarantola, S. Designing a spectral index to estimate vegetation water content from remote sensing data: Part 1: Theoretical approach. Remote Sens. Environ. 2002, 82, 188–197. [Google Scholar] [CrossRef]
- Ceccato, P.; Flasse, S.P.; Gregoire, J.M. Designing a spectral index to estimate vegetation water content from remote sensing data: Part 2. Validation and applications. Remote Sens. Environ. 2002, 82, 198–207. [Google Scholar] [CrossRef]
- Chuvieco, E.; Riano, D.; Aguado, I.; Cocero, D. Estimation of fuel moisture content from multitemporal analysis of Landsat Thematic Mapper reflectance data: Applications in fire danger assessment. Int. J. Remote Sens. 2002, 23, 2145–2162. [Google Scholar] [CrossRef]
© 2020 by the authors. Licensee MDPI, Basel, Switzerland. This article is an open access article distributed under the terms and conditions of the Creative Commons Attribution (CC BY) license (http://creativecommons.org/licenses/by/4.0/).