Abstract
The geostationary earth orbit satellite—Himawari-8 loaded with the Advanced Himawari Imager (AHI) has greatly enhanced our capacity of dynamic monitoring in Asia–Pacific area. The Himawari-8/AHI hourly aerosol product is a promising complementary source to the MODerate resolution Imaging Spectroradiometer (MODIS) daily aerosol product for near real-time air pollution observations. However, a comprehensive evaluation of AHI aerosol optical depth (AOD) is still limited, and the difference in performances of AHI and MODIS remains uncertain. In this study, we evaluated the Himawari-8/AHI Level 3 Version 3.0 and MODIS Collection 6.1 Deep Blue AOD products over China against AOD measurements from AErosol RObotic NETwork (AERONET) sites in a spatiotemporal comparison of the products from February 2018 to January 2019. Results showed that AHI AOD achieved a moderate agreement with AERONET with a correlation coefficient of 0.75 and a root-mean-square-error of 0.26, which was slightly inferior to MODIS. The retrieval accuracy was spatially and temporally varied in AHI AOD, with higher accuracies for XiangHe and Lulin sites as well as in the morning and during the summer. The dependency analysis further revealed that the bias in AHI AOD was strongly dependent on aerosol loading and influenced by the Ångström Exponent and NDVI while those for MODIS appeared to be independent of all variables. Fortunately, the biases in AHI AOD could be rectified using a random forest model that contained the appropriate variables to produce sufficiently accurate results with cross-validation R of 0.92 and RMSE of 0.15. With these adjustments, AHI AOD will continue to have great potential in characterizing precise dynamic aerosol variations and air quality at a fine temporal resolution.
1. Introduction
Atmospheric aerosol particles are suspended solid particles or liquid droplets in air [1] that play a key role in climate system [2,3,4] due to their capacity to influence global radiation budgets directly by scattering and absorbing solar radiation [5,6] and indirectly by altering cloud extent and properties, such as shortwave albedo [7] and thermal emissivity [8]. High concentrations of aerosol particles will lead to a rapid decrease in atmospheric visibility [9] and adverse impacts on public health [10]. Moreover, ambient particulate matter pollutions have been the focus of public concern because of their potential risks for several diseases, such as respiratory infections, lung cancer and cardiovascular diseases [11,12], which led to approximately 4 million deaths worldwide in 2016 according to the Global Burden of Disease study [13]. Therefore, a better understanding of spatiotemporal variability of aerosol particles is urgently needed for alleviating these negative effects.
Aerosol optical depth (AOD), the most commonly used aerosol parameter, is defined as the integral of aerosol extinction coefficient in the vertical column [14] and strongly associated with the amount of aerosols [15]. Generally, AOD can be monitored using ground-based measurements and satellite-based observations. Ground-based measurements based on discrete monitoring sites like AErosol RObotic NETwork (AERONET) [16], certainly provide highly reliable aerosol information. However, they are always limited in number and unevenly distributed, resulting in potential biases from interpolating local point-based measurements to surface-based estimations at a large spatial scale [17,18]. Fortunately, satellite-based remote sensing can simultaneously observe aerosol over wide and continuous areas, enabling us to characterize aerosol properties from regional to global scales [19,20]. With the rapid development of remote sensing technologies and satellite-based aerosol retrieval algorithms [21], considerable advances have been made in this field over the past decades.
Polar orbiting satellites from Advanced Very High Resolution Radiometer (AVHRR) [21] to MODerate resolution Imaging Spectroradiometer (MODIS) [20], Visible Infrared Imaging Radiometer Suite (VIIRS) [22], and Multi-angle Imaging SpectroRadiometer (MISR) [23], are equipped with capabilities of monitoring large-scale aerosol properties. In particular, one of the most widely used and sophisticated sensors is the MODIS instrument with the ability to observe daily aerosol properties worldwide at relatively fine spatial resolution.
The most recent released MODIS Collection 6.1 (C6.1) AOD product was based on Dark Target (DT) and Deep Blue (DB) algorithms proposed by Kaufman et al. [24] and Hsu et al. [25], respectively. Evaluation studies between MODIS C6.1 and previous collections in terms of accuracy and uncertainty showed that the latest MODIS C6.1 product had the highest agreement with the AERONET measurements [26,27]. MODIS AOD products have been widely used for various applications such as identification of dust sources [28] and estimation of surface-level PM2.5 concentrations [29]. However, polar orbiting satellites still have difficulties in capturing aerosol dynamics with fine temporal frequencies (i.e., hourly or minutely) and could result in time representation errors [30].
In contrast, geostationary earth orbits (GEO) satellites hover continuously at fixed locations with respect to the rotating Earth to provide dynamic monitoring at hourly or sub-hourly temporal resolution. By leveraging near real-time snapshots, GEO satellites have been proven to be quite useful in monitoring hazards such as aerosol pollution, dust storms, volcanic eruptions, and forest fires [31,32]. Himawari-8, the latest Japanese geostationary meteorological satellite carried with Advanced Himawari Imager (AHI), was launched by the Japanese Meteorological Agency in October 2014. Specifically, AHI located at 140.7° E has the capacity of providing diurnal aerosol variation across the Asia-Pacific region. In recent years, increasing applications of Himawari-8/AHI have been conducted in aerosol data assimilation [33,34], fire event detection [35], and estimation of surface particles matter concentrations [32]. Validation of AHI AOD potentially promotes to the development of AHI aerosol product in aerosol and air quality research. However, there were only a few studies so far addressing the evaluation of AHI hourly aerosol product in terms of retrieval accuracies and uncertainties. For example, AHI Level 3 Version 1.0 hourly AOD product against 4 AERONET sites in Asia–Pacific region was evaluated. It was reported that AOD values were consistent with ground-based observations in general [36]. AHI Level 3 Version 1.0 hourly AOD in China had a relatively good agreement with AERONET with low uncertainty and a high correlation coefficient at different hours from July 2015 to December 2016 [37]. There is still a considerable demand for evaluating the new Version 3.0 hourly aerosol product. Particularly, spatiotemporal accuracy of AHI AOD and difference in performance of AHI and MODIS have yet to be clearly identified.
Addressing these issues, the main goal of this study is to provide a comprehensive evaluation of Himawari-8/AHI hourly aerosol product, with the following specific objectives: (i) to evaluate and compare the retrieval accuracy of Himawari-8/AHI newly released Level 3 Version 3.0 and MODIS AOD products using AERONET measurements in China; (ii) to conduct an inter-comparison of these two products in terms of their performance in revealing spatiotemporal variations of AOD; and (iii) to identify and account for spatiotemporal difference in retrieval biases in Himawari-8/AHI AOD product.
2. Materials and Methods
2.1. Himawari-8/AHI AOD Product
Himawari-8 AHI is a multiple wavelength imager with 16 bands ranging from visible to infrared wavelength (3 visible bands, 3 near-infrared bands and 10 infrared bands), providing observations over the Asia–Pacific region with a temporal resolution of 2.5–10 min and a spatial resolution of 0.5–2 km [38]. Currently, Himwari-8 has released Level 3 (L3) Version 3.0 hourly aerosol product, including AOD at 500 nm and Ångström Exponent (AE) with the spatial resolution of 5 km. An hourly-combined algorithm developed by Kikuchi et al. [36] was applied in AHI L3 hourly aerosol product. It has ability to minimize cloud contamination induced in the retrieval of AHI Level 2 (L2) Version 2.0 10 minute aerosol product by a common algorithm developed by Yoshida et al. [39]. The L3 AOD product provides AOD_Pure and AOD_Merged subsets. To be specific, AOD_Pure is the result of applying the rigorous cloud screening to L2 AOD retrievals, and AOD_Merged is the result of interpolating AOD_Pure based on spatial and temporal variability information from L2 AOD. AOD_Merged generally has fewer missing values than AOD_Pure because of interpolation, and has a higher accuracy than L2 AOD due to successful elimination of cloud contamination [36]. As shown in Table 1, AHI L3 Version 3.0 hourly aerosol product from February 2018 to January 2019 covering China (09:00–18:00 CST) was downloaded from Japan Aerospace Exploration Agency (JAXA) Himawari Monitor website (http://www.eorc.jaxa.jp/ptree/index.html). We note that in this study, the more reliable AOD_Merged retrievals (hereafter AHI AOD for short) were extracted for evaluation and comparison. Additionally, we also validated AHI L3 Version 1.0 aerosol product for the period of July 2015–June 2017 and results are showed in Supplementary Information (SI) Figure S1 and Table S2, which can be as a reference for users before the release of Version 3.0 for that period.

Table 1.
Summary of datasets used for evaluation analysis.
2.2. MODIS Data
MODIS has been in operation onboard National Aeronautics and Space Administration (NASA) Earth Observing System (EOS) Terra platform since late 1999 and Aqua since 2002. MODIS provides daily observations of aerosol properties across the globe at approximately 10:30 (Terra) and 13:30 (Aqua) local time. Specifically, MODIS C6.1 Level 2 AOD products (MOD04_L2 for Terra product and MYD04_L2 for Aqua) include AOD retrievals from DT aerosol retrieval algorithm described in [40] and enhanced DB aerosol retrieval algorithm described in [41] at spatial resolutions of 3 km and 10 km, are publicly available from https://ladsweb.modaps.eosdis.nasa.gov/. MODIS C6.1 AOD products have been validated with AERONET sites at regional and global scales [26,27,42]. Previous studies identified that DB algorithm was more likely to successfully retrieve AOD over land and performed better than the DT algorithm, especially in brighter areas like deserts, sparse vegetated areas and urban areas [26,27]. Here we extracted a subset of Terra/Aqua C6.1 10 km DB aerosol datasets, i.e., aerosol optical depth at 550 nm with a quality flag of 2 or 3 over China from February 2018 to January 2019, hereafter referred to as MODIS AOD for simplicity. Additionally, we extracted the 16 day 1 km normalized difference vegetation index (NDVI) parameter from MYD13A2 product to explore its relationship with residual errors of satellite-based AOD.
2.3. AERONET AOD Data
AERONET is a global ground-based aerosol observation network, using the CE-318 sun photometer produced by Cimel Electronique Company [16]. Generally, AERONET observations provide AOD data at 340, 380, 440, 500, 670, 870 and 1020 nm wavelengths with a high temporal frequency of ~15 min during daylight hours [16]. Due to the consistency of processing standards and low uncertainties of 0.01–0.02 [43], AERONET AOD measurements have been considered as “ground truth” for calibrating and verifying satellite-based AOD retrievals [44,45]. Specifically, AERONET AOD measurements were reported in terms of three-level quality assurance/control: Level 1.0 (unprocessed), Level 1.5 (cloud-screened) and Level 2.0 (cloud screened and quality assured) [46]. In this study, AERONET Level 1.5 and Level 2.0 AOD measurements from 23 sites located in China (Figure 1) from February 2018 to January 2019 were collected from http://aeronet.gsfc.nasa.gov/ to evaluate satellite-based AOD retrievals from AHI and MODIS, and the details of AERONET sites are listed in Table S1. In addition, Ångström Exponent between 440 nm and 675 nm was also extracted to transform MODIS AOD from 550 nm to 500 nm.
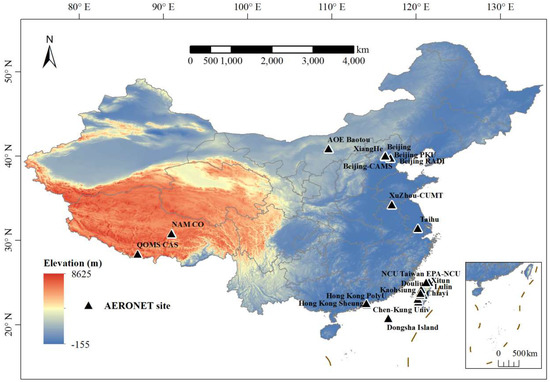
Figure 1.
Spatial distribution of 23 AERONET sites in China for evaluating satellite-based AOD products.
2.4. Comparison of AHI and MODIS AOD Products Against AERONET Data
AERONET measures continuous AOD values with a 15 min interval at each site, while the satellite-based AOD products (i.e., AHI and MODIS AOD products in this study) represent instantaneous values over a pixel size of 5 to 10 km. To minimize difference in their spatial-temporal scales, a matchup technique [47,48] was employed to collocate ground- and satellite-based aerosol retrievals. First, AOD retrievals within 5 × 5 grids of AHI (~25 × 25 km2) and MODIS (~50 × 50 km2) centered on AERONET sites were averaged to match AERONET measurements. Secondly, these aggregated values were collocated with average AERONET observations extracted within ±30 min of satellite overpass time. A valid collocation was only obtained when at least 20% satellite retrievals within 5 × 5 grids and at least 2 AERONET observations within an hour were available. In total, the numbers of valid collocations for AERONET-AHI, and AERONET-MODIS from February 2018 to January 2019 were 3439 and 1007, respectively. For the comparison between AHI and MODIS, AHI retrievals within ±30 min of MODIS overpass time were averaged to match MODIS retrievals, thereby leading to 568 valid collocations.
To ensure MODIS AOD retrievals are comparable with AHI and AERONET, we interpolated MODIS AOD from 550 nm to 500 nm using Ångström Exponent [49] as follows:
where is Ångström Exponent between 440 and 675 nm from AERONET, , are the AOD at wavelengths , .
Quantitative metrics including the number of satellite-based and AERONET collocations (N), root mean square error (RMSE), mean bias (MB), mean absolute error (MAE), mean relative bias (MRB), the percentage of matchups falling within expected error (EE) envelop, and correlation coefficient (R) were used to assess the performance of satellite-based AOD products against ground-based AERONET measurements. Specifically, EE referring to Equation (2) [50] was used to determine the quality of retrievals, i.e., if at least 67% of retrievals fall within EE envelope, satellite retrievals are recognized as “good” match with AERONET. In addition, we employed the Mann–Whitney–Wilcoxon test [51] to determine whether there was a significant difference between ground- and satellite-based aerosol products. If the p value <0.01, the compared AOD datasets were regarded as statistically significantly different.
To conduct inter-comparison of AHI and MODIS AOD products in terms of their performance in revealing spatiotemporal variations of AOD, we resampled the 10 km MODIS product to 5 km, being comparable to AHI AOD product in spatial resolution. Spatial variation of retrieval accuracy from site-level to regional scales, and temporal variation from seasonally, monthly to hourly scales were investigated.
In heavy aerosol loading conditions, the uncertainties from assumption of aerosol models arise, while uncertainties from surface reflectance estimation are larger in low aerosol loading conditions [52]. Ångström Exponent is associated with aerosol size, as one of aerosol optical properties [49]. NDVI is associated with coverage of green vegetation, higher values are related to more densely vegetated sites. Using NDVI as a proxy for surface type and AE as a proxy for aerosol type, we analyzed the dependency of satellite-AERONET AOD differences on various parameters including AERONET AOD, Ångström Exponent and NDVI. We employed the methodology mentioned in [40,53]. Collocations were sorted according to parameters listed above and then grouped into 50 bins with equal number of collocations, thereby ensuring each bin contained approximately 70 and 20 collocations for AHI and MODIS, respectively. Since levels of NDVI are sparse, collocations were grouped into 10 bins for analysis. We also calculated the mean, median, and standard deviation of biases between satellite-based and AERONET AOD for each bin and presented satellite-based AOD biases as functions of parameters using boxplots.
3. Results
3.1. Performance of AHI and MODIS AOD Products
Comparison of AHI and MODIS AOD products with AERONET AOD values at 500 nm from 23 sites in China is presented in Figure 2. To be specific, the solid and dashed grey lines are the one-to-one line and the expected error envelope, respectively; and the solid red line is the corresponding linear regression. Results show that AHI AOD achieved a relatively moderate agreement with AERONET measurements indicated by the correlation coefficient of 0.75 and RMSE of 0.26 (Figure 2a). In terms of other quantitative statistics (Table 2), the Mann–Whitney–Wilcoxon (MWW) test reveals that there is no significant difference between AHI AOD and AERONET measurements. There are MB of 0, MAE of 0.19 and MRB of 28.15%. Specifically, 43.2%, 26.6%, and 30.2% of retrievals are falling within, above, and below EE envelope, respectively. However, in the validation result of AHI L3 Version 1.0 showed in Figure S1 and Table S2, at high aerosol loading conditions, a large percentage of AHI AOD retrievals are below the one-to-one line. Comparatively, the number of underestimations decreases noticeably in AHI L3 Version 3.0 aerosol product, i.e., the fraction of retrievals below EE envelope decreases from 41% to 30%. This result indicates that a significant improvement in the latest retrieval algorithm has been made. Specifically, the newly released retrieval algorithm employed automatic selections of optimum channels and common candidate aerosol models [39], also the hourly estimation algorithm has been enhanced [36].
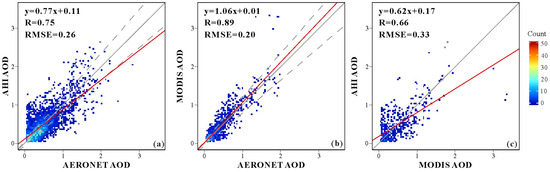
Figure 2.
Evaluation of AHI (a) and MODIS AOD with QA = 2, 3 (b) AOD values at 500 nm against AERONET AOD as well as AHI against MODIS (c) in China from February 2018 to January 2019.
Table 2.
Statistics of comparison of AHI, MODIS and AERONET AOD values at 500 nm in China from February 2018 to January 2019.
The comparison between MODIS and AERONET yields a linear regression slope of 1.06 and a negligible intercept, which is very close to a one-to-one line (Figure 2b). A higher R of 0.89, a lower RMSE of 0.20, and around 59.5% of AOD retrievals falling within EE demonstrate that MODIS AOD is very consistent with AERONET measurements, and achieves a better performance than AHI AOD. As shown in Figure 2c, we further explore the difference between AHI and MODIS AOD products. The result shows that there are considerable differences between AHI and MODIS indicated by a low R of 0.66 and high RMSE of 0.33 with a slope of 0.62 and an intercept of 0.17.
3.2. Spatial Variations of AHI and MODIS Retrieval Accuracy
Spatial distributions of mean AHI and MODIS AOD at 500 nm at 10:30 and 13:30 as well as their differences are displayed in Figure 3. MODIS achieves a larger spatial coverage than AHI since there are no AHI AOD data available in northwestern China. Generally, AHI and MODIS AOD yield a similar spatial pattern that heavy aerosol loadings are clustered in Yangtze River Delta (YRD), Beijing-Tianjin-Hebei (BTH) and northwestern regions, while the southwestern region has comparatively lower aerosol loadings. As shown in the spatial distribution of difference in AOD values between AHI and MODIS (Figure 3e,f), AHI AOD values tend to be lower than MODIS in areas with heavy aerosol loadings and vice versa in areas with low aerosol loadings at 10:30. By comparing the magnitude of AOD at 10:30 and 13:30 (i.e., the left and the right panels in Figure 3), we find that an increase in AOD from 10:30 to 13:30 has been observed in BTH and YRD regions by AHI but not by MODIS.
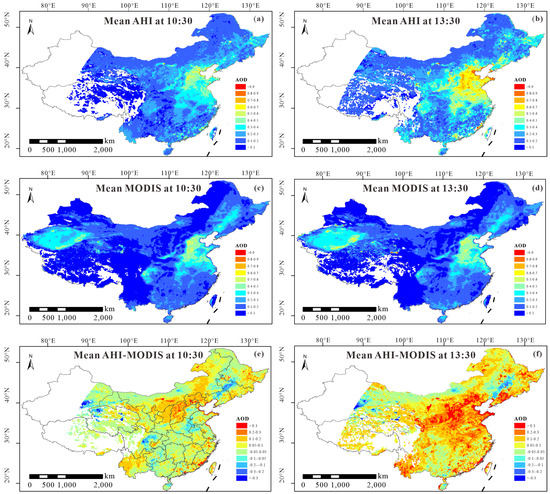
Figure 3.
Spatial distribution of average AOD at 500 nm for AHI at 10:30 (a) and 13:30 (b), MODIS at 10:30 (c) and 13:30 (d), and the difference between AHI and MODIS at 10:30 (e) and 13:30 (f) in China during February 2018–January 2019.
We further explore the spatial difference of AHI and MODIS AOD retrieval accuracy based on site-level comparison against AERONET AOD measurements, using 10 AERONET sites with valid collocations. Performances of AHI AOD accuracy at AERONET sites are presented in Figure 4 and quantitative statistics are described in Table S3. XiangHe and Lulin achieve great performances indicated by a R of above 0.80, with approximately half of retrievals falling within EE envelope and a low MB. Kaohsiung, Xuzhou-CUMT, EPA-NCU and Chiayi yield large fractions of retrievals bellow EE envelope, negative MB and negative MRB, i.e., they have considerable underestimations. Oppositely, Beijing-CAMS, Beijing and Taihu have considerable overestimations indicated by large fractions of retrievals above EE envelope with positive MB and MRB. Among these AERONET sites, Chiayi exhibited the worst performance where only 13.6% of retrievals fall within EE and the rest of retrievals fall below EE envelope with large RMSE of 0.33 and MAE of 0.30.
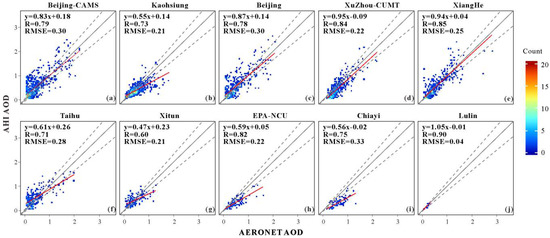
Figure 4.
AHI AOD retrievals against AERONET AOD at 500 nm for 10 sites (Beijing-CAMS (a), Kaohsiung (b), Beijing (c) XuZhou-CUMT (d), XiangHe (e), Taihu (f), Xitun (g), EPA-NCU (h), Chiayi (i) and Lulin (j)) with valid collocations.
Similarly, Figure 5 and Table S3 present a comparison of MODIS against AERONET AOD at 500 nm for the 10 sites with valid collocations. Obviously, due to the coarser temporal resolution of MODIS than AHI, there are fewer available collocations for the comparison, especially for the Kaosiung, Xitun and EPA-NCU sites. In a site-to-site comparison between AHI/MODIS AOD and AERONET measurements, it is clear that compared to AHI AOD, MODIS retrievals perform much better and yield a higher accuracy as indicated by a higher R and lower RMSE, MB, MAE and MRB values in most sites. The site-level differences in AOD retrievals between AHI and MODIS for 10 sites are also illustrated in Figure 6 and Table S3. Exactly similar as the overall comparison between AHI and MODIS retrievals displayed in Figure 2c, AHI AOD accuracy at most sites were lower than MODIS. This finding suggests that it is necessary to enhance the performance of AHI retrieval algorithm and narrow the retrieval differences between MODIS and AHI aerosol products.
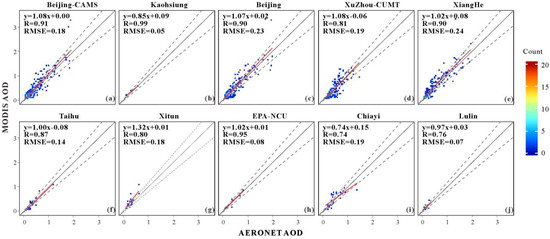
Figure 5.
MODIS AOD retrievals against AERONET AOD values at 500 nm for 10 sites (Beijing-CAMS (a), Kaohsiung (b), Beijing (c) XuZhou-CUMT (d), XiangHe (e), Taihu (f), Xitun (g), EPA-NCU (h), Chiayi (i) and Lulin (j)) with valid collocations.
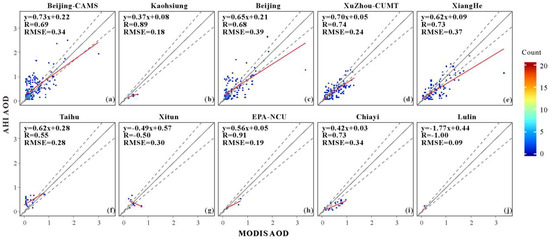
Figure 6.
AHI against MODIS AOD retrievals at 500 nm for 10 sites (Beijing-CAMS (a), Kaohsiung (b), Beijing (c) XuZhou-CUMT (d), XiangHe (e), Taihu (f), Xitun (g), EPA-NCU (h), Chiayi (i) and Lulin (j)) with valid collocations.
3.3. Temporal Variations of AHI and MODIS Retrieval Accuracy
As boxplots shown in Figure 7, we present the temporal variation in AOD for AHI, MODIS and AERONET at 500 nm at a monthly scale. The mean monthly inter quartile range (IQR) of AOD values (i.e., from first to third quartile) for AHI was 0.16–0.63, 0.19–0.59 for MODIS and 0.26–0.52 for AERONET. When it comes to medians, AHI was more consistent with AERONET during April-September while MODIS is more consistent with AERONET during October–February.
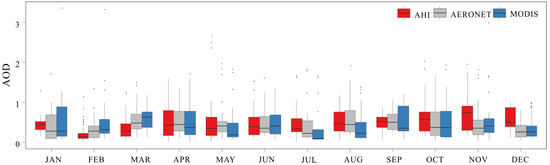
Figure 7.
Monthly variations of AHI, MODIS and AERONET AOD at 500 nm in China from February 2018 to January 2019. Lower and upper box boundaries denote the first and third quartiles, and solid line inside box is median value.
The temporal variations of AHI and MODIS AOD accuracy are explored at seasonal and hourly scales. Figure 8 and Table 3 summarize seasonal variations of AHI and MODIS retrieval accuracy against AERONET AOD. The minimum number of collocations (i.e., 564 for AHI and 144 for MODIS) for satellite-based retrievals against AERONET measurements was reached in summer, while AERONET collocations in the other three seasons had at least 700 collocations for AHI and at least 200 collocations for MODIS. The fractions of AHI retrievals falling within EE are 41.3%, 45.7%, 41.9%, and 45.5% for spring, summer, autumn, and winter, respectively. AHI showed a good agreement with AERONET in the summer with the highest R of 0.84 and the greatest fraction of retrievals falling within EE envelope. On the contrary, the performance of AHI AOD in winter is worse than other seasons as indicated by a lower slope of 0.49 and a lower R of 0.50. AHI exhibited negative MB of −0.06 and MRB of −11.00% in spring with 40.6% of retrievals below EE, denoting that AHI tends to underestimate AOD in spring. However, AHI tends to overestimate AOD in autumn indicated by 40.1% of retrievals over the EE envelope and large positive MB of 0.08.
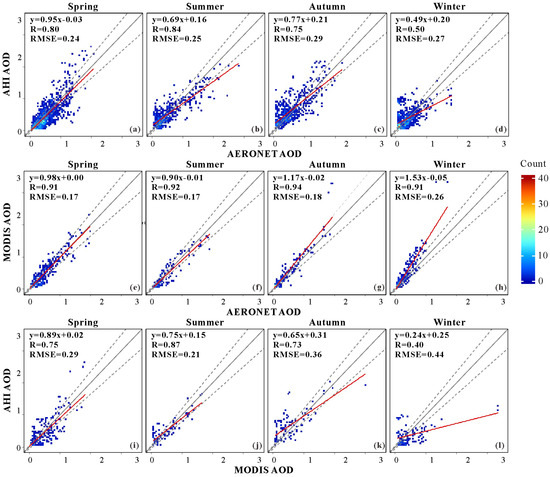
Figure 8.
AHI (a–d) and MODIS (e–h) against AERONET AOD, and AHI against MODIS (i–l) for spring (March–April–May), summer (June–July–August), autumn (September–October–November) and winter (December–January–February) in China during February 2018–January 2019.
Table 3.
Seasonal comparison of AHI and MODIS AOD retrievals against AERONET observations in China from February 2018 to January 2019.
As shown in the middle panel of Figure 8, seasonal variation of MODIS AOD accuracy was quite different from AHI. Correlation coefficients between MODIS and AERONET are above 0.90 with at least 50% of MODIS AOD retrievals falling within EE envelope for each season. To be specific, MODIS AOD achieved the best performance in autumn with an R of 0.94, with a tendency to underestimate in summer (30.6% below EE), and overestimate in winter (44.6% above EE). Generally, compared to AHI AOD, MODIS does perform better with a higher R and lower RMSE, MAE, and MRB values for each season. Additionally, as the season variation of AOD difference between AHI and MODIS shown at the bottom panel of Figure 8, AHI AOD retrievals were in relatively good agreement with MODIS AOD except for winter. The largest differences were observed in winter attributed to the fact that MODIS AOD tends to overestimate during that time.
The hourly variations of accuracy in AHI and MODIS AOD retrievals are summarized in Table 4. Due to the clouds being more likely to occur in the afternoon [54,55], the numbers of AHI collocations increase from 9:00 to 11:00, then decrease after 12:00 and reach the minimum at 18:00. As for MODIS, the number of collocations for Terra overpassing at 10:30 is larger than that overpassing at 13:30. The correlation coefficients between AHI and AERONET AOD are at least 0.65 and at least 30% of retrievals are within EE envelope for each period. In general, AHI AOD retrievals perform better in the morning than in the early afternoon (13:00–15:00) as indicated by a higher R, lower RMSE and larger fractions of retrievals falling within EE envelope. Additionally, negative MB and large fractions of retrievals below EE during 9:00–11:00 denote that AHI AOD is slightly underestimated in the morning, whereas large positive MB and large fractions of retrievals above EE during 13:00–15:00 indicate AHI AOD is overestimated in the early afternoon. Performances of MODIS in 10:30 and 13:30 are relatively robust and superior to AHI.
Table 4.
Hourly comparison of AHI and AERONET AOD at 500 nm in China for 09:0–18:00 (CST) and MODIS against AERONET for 10:30 (Terra) and 13:30 (Aqua).
3.4. Dependency on Parameters
Figure 9a,b show the dependency of difference between AHI/MODIS and AERONET on AERONET AOD. The linear fits of standard deviations of AHI-AERONET AOD are not in good agreement with EE envelope, shown in Figure 9a. There is a noticeable shift from positive-to negative AHI-AERONET difference. At low AERONET AOD values, AHI exhibits slightly positive biases, but AHI turns to show larger negative biases with the increase of AERONET AOD values. It is concluded that the bias in AHI is strongly dependent on the level of AERONET AOD. The linear fits of standard deviations of MODIS-AERONET difference in Figure 9b are close to the EE envelope and the average biases for each bin are almost negligible, implying that MODIS retrieval accuracy is independent of AERONET AOD.
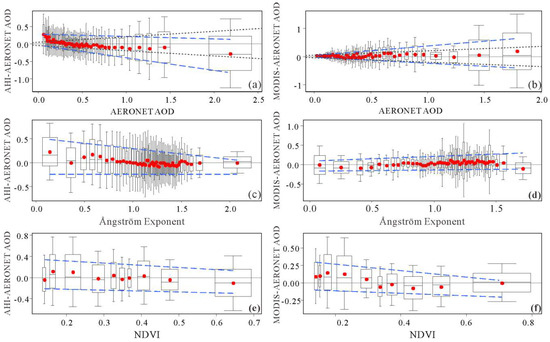
Figure 9.
Biases in satellite-based AOD as functions of AERONET AOD values at 500 nm (a,b), Ångström Exponent between 440–675 nm (c,d) and NDVI (e,f).
Figure 9c,d show the satellite-AERONET AOD differences as a function of AE at 440–675 nm from AERONET, which is regarded as an indicator of aerosol size. Positive AHI-AERONET AOD differences at low AE values shrink with the increasing of AE. In general, AHI AOD is more likely to overestimate aerosol loading for situations of coarse-dominated aerosol size, whereas for moderate and fine-dominated aerosol, AHI AOD retrievals are more accurate. As for MODIS, there is a negligible variability of average MODIS-AERONET AOD differences, suggesting that MODIS has a robust performance in retrieving AOD with various aerosol sizes. The satellite-AERONET AOD differences as a function of NDVI, presented in Figure 9e,f, show that the satellite-AERONET AOD differences are weakly dependent on NDVI, implying that AHI and MODIS aerosol retrieval algorithms are successful over land areas with various NDVI. In addition, compared to dependency of AHI L3 Version 1.0 showed in Figure S2, bias in AHI L3 Version 3.0 AOD exhibits a weak dependency on AE and NDVI.
4. Discussion
In general, AHI AOD was in a moderate agreement with AERONET and similar results also were found in previous studies [36,37]. Zang et al. evaluated AHI L3 Version 1.0 AOD against AERONET in China and results showed there were R of 0.74, RMSE of 0.24, and a slight underestimation [37]. But they did not conduct a one-to-one comparison among AERONET sites. Our results revealed that there was a spatiotemporal variation in AHI AOD accuracy through a comprehensive analysis. Spatially, we found AHI AOD at AERONET sites yielded different accuracy in Figure 4, which was perhaps caused by the differences in topographic conditions, like NDVI [36,45]. At a seasonal level, AHI AOD achieved a better performance in summer and a worst performance in winter showed in Figure 8. The land type might have attributed to seasonal variation. In winter, it is difficult to retrieve AOD values successfully over snow/ice and sparsely vegetated areas due to lack of accurate surface reflectance. In terms of hourly level, we also found a diurnal variation in AHI AOD accuracy (Table 4), which might be associated with varying aerosol size. Diurnal variation in aerosol size might be caused by emissions from traffic, industry, biomass burning and household sources evolving at their individual temporal pattern [56].
MODIS achieved a better performance than AHI when validated against AERONET as described in Section 3.1. Varying retrieval algorithms and observation geometries applied in AHI and MODIS may contribute to a considerable gap in AOD retrieval accuracy. MODIS AOD product validated in this study was retrieved by enhanced Deep Blue algorithm developed by Hsu et al. [41], while AHI Level 3 Version 3.0 AOD was preliminarily retrieved by a common algorithm [39] and further modified by a hourly-combined algorithm [36]. These algorithms adopt different assumptions in aerosol model, surface reflectance estimations and cloud screening schemes, directly leading to inconsistent retrievals. MODIS has been in operation since 1999 and a substantial understanding of the sensor has been accumulated, which can be taken advantage of to improve the retrieval algorithm. Meanwhile, observation geometries of these two sensors are discrepant. Even with the same retrieval algorithm, MODIS and AHI do not retrieve same AOD values due to the variation in the scattering angle, as displayed in [39].
In this study, we also found that there were a large amount of underestimations and overestimations in AHI Level 3 hourly AOD retrievals and spatial and temporal variances in AHI AOD retrieval accuracy, suggesting that improvements in the retrieval algorithms are still needed. Since AHI L3 aerosol retrievals are retrieved based on L2 AOD, both the common algorithm and hourly-combined algorithm applied in L2 and L3 product should be improved upon. Along with the accumulation of AHI data over a few years, surface reflectance estimation and aerosol model assumption will become more precisely. Admittedly, a deeper and more extensive study is still required for the modification of the retrieval algorithm, in other words, we still take some time to improve retrieval algorithm to achieve higher quality AHI AOD values cannot be performed in the near future.
Fortunately, the knowledge of our findings in Section 3 and a machine learning method enable us to improve AHI AOD retrievals. A random forest model is one of the popular nonparametric machine learning methods and capable of solving nonlinear classification and regression problems [57]. A random forest consists of an ensemble of uncorrelated decision trees, and each tree is constructed by a bootstrap sample and a random subset of predictors. The random forest model first selects ntree of bootstrap samples and develops a regression tree for each sample with mtry of predictors randomly chosen. Finally, RF model aggregates the predictions of ntree trees to arrive at the best possible result. In our study, given that the accuracy of AHI retrievals varies spatially and temporally and depends on several parameters, we propose a random forest model with appropriate multi-variables. In the model as in Equation (3), the target variable is AERONET AOD and eight predictor variables are AHI AOD, influential factors (AE, NDVI), temporal factors (hour, month, season) and spatial factors (latitudes and longitudes of AERONET sites). We construct the RF model using the R software with the “randomForest” package and set ntree as 500 and mtry as 3. To test model performance, we conducted a 10-fold cross-validation (CV) approach. The dataset was randomly split into 10 subsets with one-tenth of samples. In each iteration, nine subsets were used to train RF and then to predict the remaining subset. The process was repeated 10 times to ensure every subset is tested. We evaluated the accuracy of adjusted AHI AOD (predictions) with AERONET using the same quantitative metrics as described in Section 2.4.
where: AHI AODi,j and AOD Truthi,j represent AOD values at site i on time j; spatial factorsi include latitude and longitude of site i; temporal factorsj include hour, month, and season of time j.
The random forest model result shown in Figure 10 that CV R between adjusted AHI AOD and AERONET AOD is 0.92, with RMSE of 0.15 and 68.7% of predictions falling into EE envelope. Compared to the validation result of AHI with AERONET AOD described in Section 3.1, adjusted AHI AOD based on the random forest model performs better. Thereby, a machine learning model with multiple variables is a practical method to improve AHI AOD. In the future, more factors influencing retrieval accuracy, such as cloud fraction, sensor zenith angle mentioned in [54], will be considered to promote the performance of random forest. In addition, considering that MODIS has a high accuracy with AERONET and performs robustly as described in Section 3, our propose is to regard MODIS AOD retrievals as true values and match AHI with MODIS instead of AERONET AOD to obtain more samples for training optimal random forest model, with the aim of taking advantage of strengths of individual satellite.
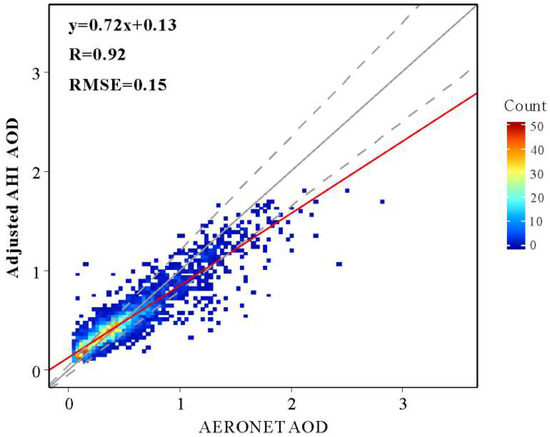
Figure 10.
Evaluation of adjusted AHI AOD based on a random forest model against AERONET AOD.
We also acknowledge some limitations in this study. Firstly, AEROENT sites were sparse in China and distributed unevenly so that we have no way of evaluating AHI AOD in most areas, especially central and western areas. In forthcoming studies, more ground monitors, such as sites established by the Sun–Sky Radiometer Observation Network (SONET) are worth exploration. Secondly, the statistical method of evaluation and comparison need to be refined. It might not be appropriate to using simple linear regression, of which results would be affected by the uncertainty of each satellite retrievals. We need to develop a more outstanding evaluation strategy in the future, for example, applying bivariate weighted regression [58] to examine their performance and using singular value decomposition analysis to effectively compare satellite and AERONET AOD product both spatially and temporally [59].
5. Conclusions
This study sought to compare the performance of the newly released AHI Level 3 Version 3.0 hourly AOD product at 500 nm to MODIS Terra/Aqua Deep Blue AOD product and AERONET from February 2018 to January 2019 in China, aiming to provide a comprehensive evaluation of performance of AHI AOD products. The results showed that AHI AOD retrievals achieved a moderate consistency with AERONET indicated by the correlation coefficient of 0.75, root-mean-square-error of 0.26 and 43.2% of retrievals falling into EE envelope. In addition, Version 3.0 significantly reduced the fraction of underestimations compared to Version 1.0 product. By contrast, MODIS AOD product yielded a better agreement with AERONET indicated by a higher R of 0.89, a lower RMSE of 0.20 and a larger 59.5% of retrievals falling into EE envelope. In the direct comparison between AHI and MODIS AOD products, our results showed that there were considerable differences in retrieval values, but they kept a relatively consistent spatial distribution. Furthermore, the retrieval accuracy of AHI and MODIS AOD was spatially and temporally varied. AHI yielded higher accuracies for XiangHe and Lulin sites than the other sites as well as in the morning and during the summer. MODIS exhibited a slightly different pattern of variances in retrieval accuracy, i.e., it performed better when overpassing at 13:30 and during the autumn. In terms of the dependency analysis, the bias in AHI AOD was dependent strongly on aerosol loading and weakly on the Ångström Exponent and NDVI, while those for MODIS appeared to be independent of the above variables. Integrated with influential factors (AE, NDVI) and spatiotemporal parameters, a random forest model was conducted to successfully reduce the biases in AHI AOD. Adjusted AHI AOD achieved a higher cross-validation R of 0.92 and lower RMSE of 0.15 than official AHI AOD. Additionally, we suggest that taking advantage of AHI AOD with a higher temporal resolution and MODIS AOD with a higher accuracy will be a promising solution to generate spatially and temporally consistent and continuous datasets to strongly support aerosol and air pollution research.
Supplementary Materials
The following are available online at https://www.mdpi.com/2072-4292/11/9/1011/s1, Table S1: The information of AERONET sites; Table S2: Statistics of comparison of AHI Version 1.0, MODIS and AERONET AOD values at 500 nm in China from July 2015 to June 2017; Table S3: Statistics of site comparison of AHI, MODIS against AERONET AOD from February 2018 to January 2019. Figure S1: Evaluation of AHI Version 1.0 and MODIS AOD with QA = 2, 3 AOD values at 500 nm against AERONET AOD as well as AHI against MODIS in China from July 2015 to June 2017. Figure S2: Biases in AHI Version 1.0 and MODIS AOD as functions of AERONET AOD values at 500 nm, Ångström Exponent between 440-675 nm and NDVI.
Author Contributions
Conceptualization, B.C.; formal analysis, T.J.; methodology, T.J.; writing—original draft, T.J.; writing—review and editing, B.C., K.K.Y.C. and B.X.
Funding
This research was funded by Ministry of Science and Technology of the People’s Republic of China under the National Key Research and Development Program (2016YFA0600104).
Acknowledgments
The authors thank Japan Aerospace Exploration Agency (JAXA) and NASA for making the Himawari-8/AHI and MODIS aerosol products publicly available. We also thank AERONET site Principal Investigators (B.N. Holben, H. Chen, Z. Cong, L. Wu, J. Hong, J. Huang, L. Tang, P. Goloub, R. Ma, J.E. Nichol, R. Wagener, P. Wang, X. Xia, and Z. Li) for making the aerosol data publicly available.
Conflicts of Interest
The authors declare no conflict of interest.
References
- Hinds, W.C. Aerosol Technology: Properties, Behavior, and Measurement of Airborne Particles; John Wiley and Sons: Los Angeles, CA, USA, 2012; ISBN 978-1-118-59197-0. [Google Scholar]
- Charlson, R.; Schwartz, S.; Hales, J.; Cess, R.; Coakley, J.; Hansen, J.; Hofmann, D. Climate Forcing by Anthropogenic Aerosols. Science 1992, 255, 423–430. [Google Scholar] [CrossRef]
- Prather, K.A. Our Current Understanding of the Impact of Aerosols on Climate Change. ChemSusChem 2009, 2, 377–379. [Google Scholar] [CrossRef] [PubMed]
- Twomey, S. Aerosols, clouds and radiation. Atmos. Environ. Ageneral Top. 1991, 25, 2435–2442. [Google Scholar] [CrossRef]
- Yang, X.; Zhao, C.; Zhou, L.; Wang, Y.; Liu, X. Distinct impact of different types of aerosols on surface solar radiation in China: Variation of Aerosol Radiative Effect. J. Geophys. Res. Atmos. 2016, 121, 6459–6471. [Google Scholar] [CrossRef]
- Yang, X.; Zhao, C.; Zhou, L.; Li, Z.; Cribb, M.; Yang, S. Wintertime cooling and a potential connection with transported aerosols in Hong Kong during recent decades. Atmos. Res. 2018, 211, 52–61. [Google Scholar] [CrossRef]
- Twomey, S. The Influence of Pollution on the Shortwave Albedo of Clouds. J. Atmos. Sci. 1977, 34, 1149–1152. [Google Scholar]
- Garrett, T.J.; Zhao, C. Increased Arctic cloud longwave emissivity associated with pollution from mid-latitudes. Nature 2006, 440, 787–789. [Google Scholar] [CrossRef]
- Yang, X.; Zhao, C.; Guo, J.; Wang, Y. Intensification of aerosol pollution associated with its feedback with surface solar radiation and winds in Beijing: Aerosol Intensification by Feedback. J. Geophys. Res. Atmos. 2016, 121, 4093–4099. [Google Scholar] [CrossRef]
- Cohen, A.J.; Brauer, M.; Burnett, R.; Anderson, H.R.; Frostad, J.; Estep, K.; Balakrishnan, K.; Brunekreef, B.; Dandona, L.; Dandona, R.; et al. Estimates and 25-year trends of the global burden of disease attributable to ambient air pollution: an analysis of data from the Global Burden of Diseases Study 2015. Lancet 2017, 389, 1907–1918. [Google Scholar] [CrossRef]
- Brunekreef, B.; Holgate, S.T. Air pollution and health. Lancet 2002, 360, 1233–1242. [Google Scholar] [CrossRef]
- Dominici, F.; Peng, R.D.; Bell, M.L.; Pham, L.; McDermott, A.; Zeger, S.L.; Samet, J.M. Fine Particulate Air Pollution and Hospital Admission for Cardiovascular and Respiratory Diseases. JAMA 2006, 295, 1127–1134. [Google Scholar] [CrossRef]
- Gakidou, E.; Afshin, A.; Abajobir, A.A.; Abate, K.H.; Abbafati, C.; Abbas, K.M.; Abd-Allah, F.; Abdulle, A.M.; Abera, S.F.; Aboyans, V.; et al. Global, regional, and national comparative risk assessment of 84 behavioural, environmental and occupational, and metabolic risks or clusters of risks, 1990–2016: a systematic analysis for the Global Burden of Disease Study 2016. Lancet 2017, 390, 1345–1422. [Google Scholar] [CrossRef]
- Kinne, S.; Schulz, M.; Textor, C.; Guibert, S.; Balkanski, Y.; Bauer, S.E.; Berntsen, T.; Berglen, T.F.; Boucher, O.; Chin, M.; et al. An AeroCom initial assessment – optical properties in aerosol component modules of global models. Atmos. Chem. Phys. 2006, 6, 1815–1834. [Google Scholar] [CrossRef]
- Zheng, C.; Zhao, C.; Zhu, Y.; Wang, Y.; Shi, X.; Wu, X.; Chen, T.; Wu, F.; Qiu, Y. Analysis of influential factors for the relationship between PM2.5 and AOD in Beijing. Atmos. Chem. Phys. 2017, 17, 13473–13489. [Google Scholar] [CrossRef]
- Holben, B.N.; Eck, T.F.; Slutsker, I.; Tanre, D.; Buis, J.P.; Setzer, A.; Vermote, E.; Reagan, J.A.; Kaufman, Y.J.; Nakajima, T.; et al. AERONET—A federated instrument network and data archive for aerosol characterization. Remote Sens. Environ. 1998, 66, 1–16. [Google Scholar] [CrossRef]
- Chen, B.; Song, Y.; Jiang, T.; Chen, Z.; Huang, B.; Xu, B. Real-Time Estimation of Population Exposure to PM2.5 Using Mobile- and Station-Based Big Data. Int. J. Environ. Res. Public Health 2018, 15, 573. [Google Scholar] [CrossRef]
- Shi, X.; Zhao, C.; Jiang, J.H.; Wang, C.; Yang, X.; Yung, Y.L. Spatial Representativeness of PM 2.5 Concentrations Obtained Using Observations From Network Stations. J. Geophys. Res. Atmos. 2018, 123, 3145–3158. [Google Scholar] [CrossRef]
- King, M.D.; Kaufman, Y.J.; Tanré, D.; Nakajima, T. Remote Sensing of Tropospheric Aerosols from Space: Past, Present, and Future. Bull. Am. Meteorol. Soc. 1999, 80, 2229–2260. [Google Scholar] [CrossRef]
- Levy, R.C.; Remer, L.A.; Dubovik, O. Global aerosol optical properties and application to Moderate Resolution Imaging Spectroradiometer aerosol retrieval over land. J. Geophys. Res.-Atmos. 2007, 112, D13210. [Google Scholar] [CrossRef]
- Kokhanovsky, A.A.; Breon, F.-M.; Cacciari, A.; Carboni, E.; Diner, D.; Di Nicolantonio, W.; Grainger, R.G.; Grey, W.M.F.; Hoeller, R.; Lee, K.-H.; et al. Aerosol remote sensing over land: A comparison of satellite retrievals using different algorithms and instruments. Atmos. Res. 2007, 85, 372–394. [Google Scholar] [CrossRef]
- Bilal, M.; Nazeer, M.; Nichol, J.E. Validation of MODIS and VIIRS derived aerosol optical depth over complex coastal waters. Atmos. Res. 2017, 186, 43–50. [Google Scholar] [CrossRef]
- Martonchik, J.V.; Diner, D.J.; Crean, K.A.; Bull, M.A. Regional aerosol retrieval results from MISR. IEEE Trans. Geosci. Remote Sens. 2002, 40, 1520–1531. [Google Scholar] [CrossRef]
- Kaufman, Y.J.; Wald, A.E.; Remer, L.A.; Gao, B.-C.; Li, R.-R.; Flynn, L. The MODIS 2.1-/spl mu/m channel-correlation with visible reflectance for use in remote sensing of aerosol. IEEE Trans. Geosci. Remote Sens. 1997, 35, 1286–1298. [Google Scholar] [CrossRef]
- Hsu, N.C.; Tsay, S.-C.; King, M.D.; Herman, J.R. Deep Blue Retrievals of Asian Aerosol Properties during ACE-Asia. IEEE Trans. Geosci. Remote Sens. 2006, 44, 3180–3195. [Google Scholar] [CrossRef]
- Wang, Y.; Yuan, Q.; Li, T.; Shen, H.; Zheng, L.; Zhang, L. Evaluation and comparison of MODIS Collection 6.1 aerosol optical depth against AERONET over regions in China with multifarious underlying surfaces. Atmos. Environ. 2019, 200, 280–301. [Google Scholar] [CrossRef]
- Wei, J.; Li, Z.; Peng, Y.; Sun, L. MODIS Collection 6.1 aerosol optical depth products over land and ocean: validation and comparison. Atmos. Environ. 2019, 201, 428–440. [Google Scholar] [CrossRef]
- Liu, Z.; Liu, Q.; Lin, H.-C.; Schwartz, C.S.; Lee, Y.-H.; Wang, T. Three-dimensional variational assimilation of MODIS aerosol optical depth: Implementation and application to a dust storm over East Asia. J. Geophys. Res.-Atmos. 2011, 116, D23206. [Google Scholar] [CrossRef]
- Van Donkelaar, A.; Martin, R.V.; Brauer, M.; Hsu, N.C.; Kahn, R.A.; Levy, R.C.; Lyapustin, A.; Sayer, A.M.; Winker, D.M. Global Estimates of Fine Particulate Matter using a Combined Geophysical-Statistical Method with Information from Satellites, Models, and Monitors. Environ. Sci. Technol. 2016, 50, 3762–3772. [Google Scholar] [CrossRef] [PubMed]
- Wang, Y.; Zhao, C. Can MODIS cloud fraction fully represent the diurnal and seasonal variations at DOE ARM SGP and Manus sites? J. Geophys. Res. Atmos. 2017, 122, 329–343. [Google Scholar] [CrossRef]
- Saide, P.E.; Kim, J.; Song, C.H.; Choi, M.; Cheng, Y.; Carmichael, G.R. Assimilation of next generation geostationary aerosol optical depth retrievals to improve air quality simulations. Geophys. Res. Lett. 2014, 41, 9188–9196. [Google Scholar] [CrossRef]
- Sowden, M.; Mueller, U.; Blake, D. Review of surface particulate monitoring of dust events using geostationary satellite remote sensing. Atmos. Environ. 2018, 183, 154–164. [Google Scholar] [CrossRef]
- Sekiyama, T.T.; Yumimoto, K.; Tanaka, T.Y.; Nagao, T.; Kikuchi, M.; Murakami, H. Data Assimilation of Himawari-8 Aerosol Observations: Asian Dust Forecast in June 2015. SOLA 2016, 12, 86–90. [Google Scholar] [CrossRef]
- Yumimoto, K.; Nagao, T.M.; Kikuchi, M.; Sekiyama, T.T.; Murakami, H.; Tanaka, T.Y.; Ogi, A.; Irie, H.; Khatri, P.; Okumura, H.; et al. Aerosol data assimilation using data from Himawari-8, a next-generation geostationary meteorological satellite. Geophys. Res. Lett. 2016, 43, 5886–5894. [Google Scholar] [CrossRef]
- She, L.; Xue, Y.; Yang, X.; Guang, J.; Li, Y.; Che, Y.; Fan, C.; Xie, Y. Dust detection and intensity estimation using Himawari-8/AHI observation. Remote Sens. 2018, 10, 490. [Google Scholar] [CrossRef]
- Kikuchi, M.; Murakami, H.; Suzuki, K.; Nagao, T.M.; Higurashi, A. Improved Hourly Estimates of Aerosol Optical Thickness Using Spatiotemporal Variability Derived From Himawari-8 Geostationary Satellite. IEEE Trans. Geosci. Remote Sens. 2018, 56, 3442–3455. [Google Scholar] [CrossRef]
- Zang, L.; Mao, F.; Guo, J.; Gong, W.; Wang, W.; Pan, Z. Estimating hourly PM1 concentrations from Himawari-8 aerosol optical depth in China. Environ. Pollut. 2018, 241, 654–663. [Google Scholar] [CrossRef]
- Bessho, K.; Date, K.; Hayashi, M.; Ikeda, A.; Imai, T.; Inoue, H.; Kumagai, Y.; Miyakawa, T.; Murata, H.; Ohno, T.; et al. An Introduction to Himawari-8/9— Japan’s New-Generation Geostationary Meteorological Satellites. J. Meteorol. Soc. Jpn. Ser. II 2016, 94, 151–183. [Google Scholar] [CrossRef]
- Yoshida, M.; Kikuchi, M.; Nagao, T.M.; Murakami, H.; Nomaki, T.; Higurashi, A. Common Retrieval of Aerosol Properties for Imaging Satellite Sensors. J. Meteorol. Soc. Jpn. Ser. II 2018, 96B. [Google Scholar] [CrossRef]
- Gupta, P.; Levy, R.C.; Mattoo, S.; Remer, L.A.; Munchak, L.A. A surface reflectance scheme for retrieving aerosol optical depth over urban surfaces in MODIS Dark Target retrieval algorithm. Atmos. Meas. Tech. 2016, 9, 3293–3308. [Google Scholar] [CrossRef]
- Hsu, N.C.; Jeong, M.-J.; Bettenhausen, C.; Sayer, A.M.; Hansell, R.; Seftor, C.S.; Huang, J.; Tsay, S.-C. Enhanced Deep Blue aerosol retrieval algorithm: The second generation: ENHANCED DEEP BLUE AEROSOL RETRIEVAL. J. Geophys. Res. Atmos. 2013, 118, 9296–9315. [Google Scholar] [CrossRef]
- Bilal, M.; Nazeer, M.; Qiu, Z.; Ding, X.; Wei, J. Global validation of MODIS C6 and C6.1 merged aerosol products over diverse vegetated surfaces. Remote Sens. 2018, 10, 475. [Google Scholar] [CrossRef]
- Dubovik, O.; Smirnov, A.; Holben, B.N.; King, M.D.; Kaufman, Y.J.; Eck, T.F.; Slutsker, I. Accuracy assessments of aerosol optical properties retrieved from Aerosol Robotic Network (AERONET) Sun and sky radiance measurements. J. Geophys. Res.-Atmos. 2000, 105, 9791–9806. [Google Scholar] [CrossRef]
- Gupta, P.; Remer, L.A.; Levy, R.C.; Mattoo, S. Validation of MODIS 3 km land aerosol optical depth from NASA’s EOS Terra and Aqua missions. Atmos. Meas. Tech. 2018, 11, 3145–3159. [Google Scholar] [CrossRef]
- Sayer, A.M.; Hsu, N.C.; Bettenhausen, C.; Jeong, M.-J. Validation and uncertainty estimates for MODIS Collection 6 “Deep Blue” aerosol data. J. Geophys. Res. Atmos. 2013, 118, 7864–7872. [Google Scholar] [CrossRef]
- Smirnov, A.; Holben, B.N.; Eck, T.F.; Dubovik, O.; Slutsker, I. Cloud-Screening and Quality Control Algorithms for the AERONET Database. Remote Sens. Environ. 2000, 73, 337–349. [Google Scholar] [CrossRef]
- Chu, D.A.; Kaufman, Y.J.; Ichoku, C.; Remer, L.A.; Tanre, D.; Holben, B.N. Validation of MODIS aerosol optical depth retrieval over land. Geophys. Res. Lett. 2002, 29, 1617. [Google Scholar] [CrossRef]
- Ichoku, C. A spatio-temporal approach for global validation and analysis of MODIS aerosol products. Geophys. Res. Lett. 2002, 29, MOD1-1. [Google Scholar] [CrossRef]
- Eck, T.F.; Holben, B.N.; Reid, J.S.; Dubovik, O.; Smirnov, A.; O’Neill, N.T.; Slutsker, I.; Kinne, S. Wavelength dependence of the optical depth of biomass burning, urban, and desert dust aerosols. J. Geophys. Res. Atmos. 1999, 104, 31333–31349. [Google Scholar] [CrossRef]
- Remer, L.A.; Mattoo, S.; Levy, R.C.; Munchak, L.A. MODIS 3 km aerosol product: algorithm and global perspective. Atmos. Meas. Tech. 2013, 6, 1829–1844. [Google Scholar] [CrossRef]
- Fay, M.P.; Proschan, M.A. Wilcoxon-Mann-Whitney or t-test? On assumptions for hypothesis tests and multiple interpretations of decision rules. Stat. Surv. 2010, 4, 1–39. [Google Scholar] [CrossRef]
- Tao, M.; Chen, L.; Wang, Z.; Tao, J.; Che, H.; Wang, X.; Wang, Y. Comparison and evaluation of the MODIS Collection 6 aerosol data in China: Comparison and Evaluation of MODIS AOD. J. Geophys. Res. Atmos. 2015, 120, 6992–7005. [Google Scholar] [CrossRef]
- Levy, R.C.; Remer, L.A.; Kleidman, R.G.; Mattoo, S.; Ichoku, C.; Kahn, R.; Eck, T.F. Global evaluation of the Collection 5 MODIS dark-target aerosol products over land. Atmos. Chem. Phys. 2010, 10, 10399–10420. [Google Scholar] [CrossRef]
- Chen, D.; Guo, J.; Wang, H.; Li, J.; Min, M.; Zhao, W.; Yao, D. The Cloud Top Distribution and Diurnal Variation of Clouds over East Asia: Preliminary Results from Advanced Himawari Imager. J. Geophys. Res. Atmos. 2018, 123, 3724–3739. [Google Scholar] [CrossRef]
- Ma, J.; Wu, H.; Wang, C.; Zhang, X.; Li, Z.; Wang, X. Multiyear satellite and surface observations of cloud fraction over China. J. Geophys. Res. Atmos. 2014, 119, 7655–7666. [Google Scholar] [CrossRef]
- Manning, M.I.; Martin, R.V.; Hasenkopf, C.; Flasher, J.; Li, C. Diurnal Patterns in Global Fine Particulate Matter Concentration. Environ. Sci. Technol. Lett. 2018, 5, 687–691. [Google Scholar] [CrossRef]
- Breiman, L. Random Forests. Mach. Learn. 2001, 45, 5–32. [Google Scholar] [CrossRef]
- Cantrell, C.A. Technical Note: Review of methods for linear least-squares fitting of data and application to atmospheric chemistry problems. Atmos. Chem. Phys. 2008, 11, 5477–5487. [Google Scholar] [CrossRef]
- Li, J.; Carlson, B.E.; Lacis, A.A. Application of spectral analysis techniques in the intercomparison of aerosol data. Part II: Using maximum covariance analysis to effectively compare spatiotemporal variability of satellite and AERONET measured aerosol optical depth: MCA COMPARISON OF AOD DATA SETS. J. Geophys. Res. Atmos. 2014, 119, 153–166. [Google Scholar]
© 2019 by the authors. Licensee MDPI, Basel, Switzerland. This article is an open access article distributed under the terms and conditions of the Creative Commons Attribution (CC BY) license (http://creativecommons.org/licenses/by/4.0/).