Optimized Spectrometers Characterization Procedure for Near Ground Support of ESA FLEX Observations: Part 1 Spectral Calibration and Characterisation


Abstract
1. Introduction
2. Methods
3. Results
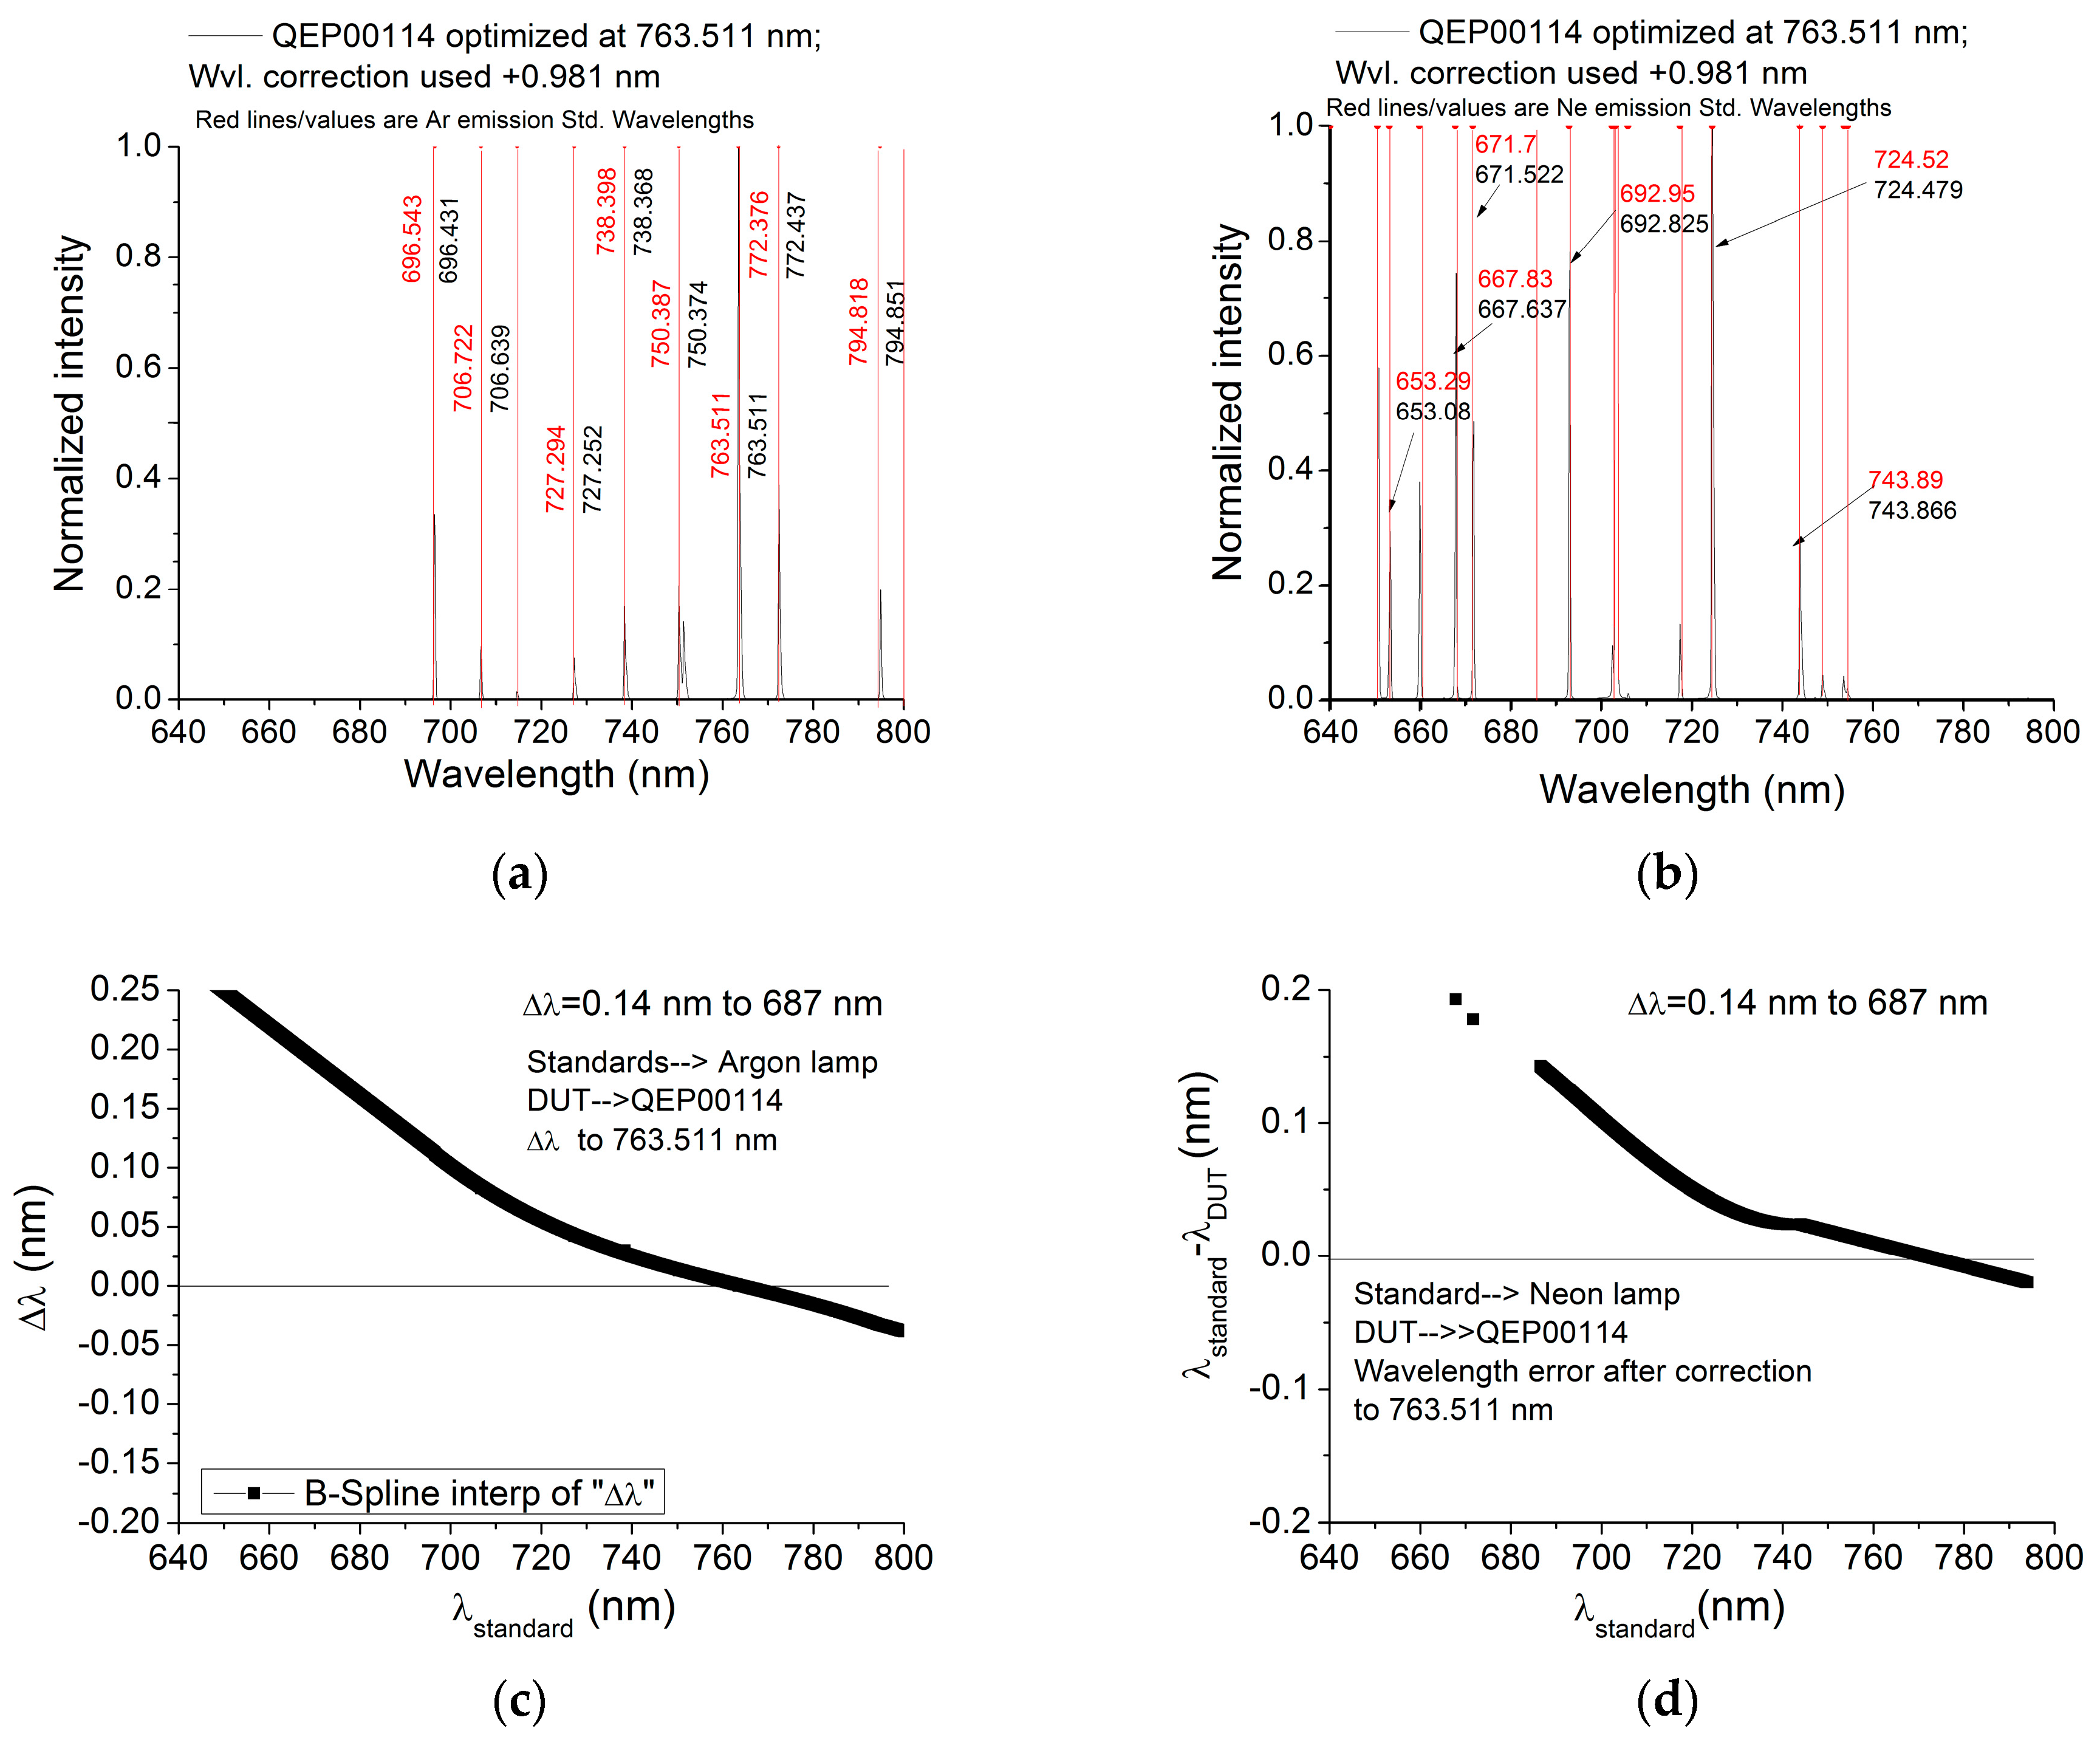
3.1. Field Spectrometers Spectral Characterization with Reference Emission Light Source
3.2. Field Spectrometers Spectral Characterization with Monochromator Light Source
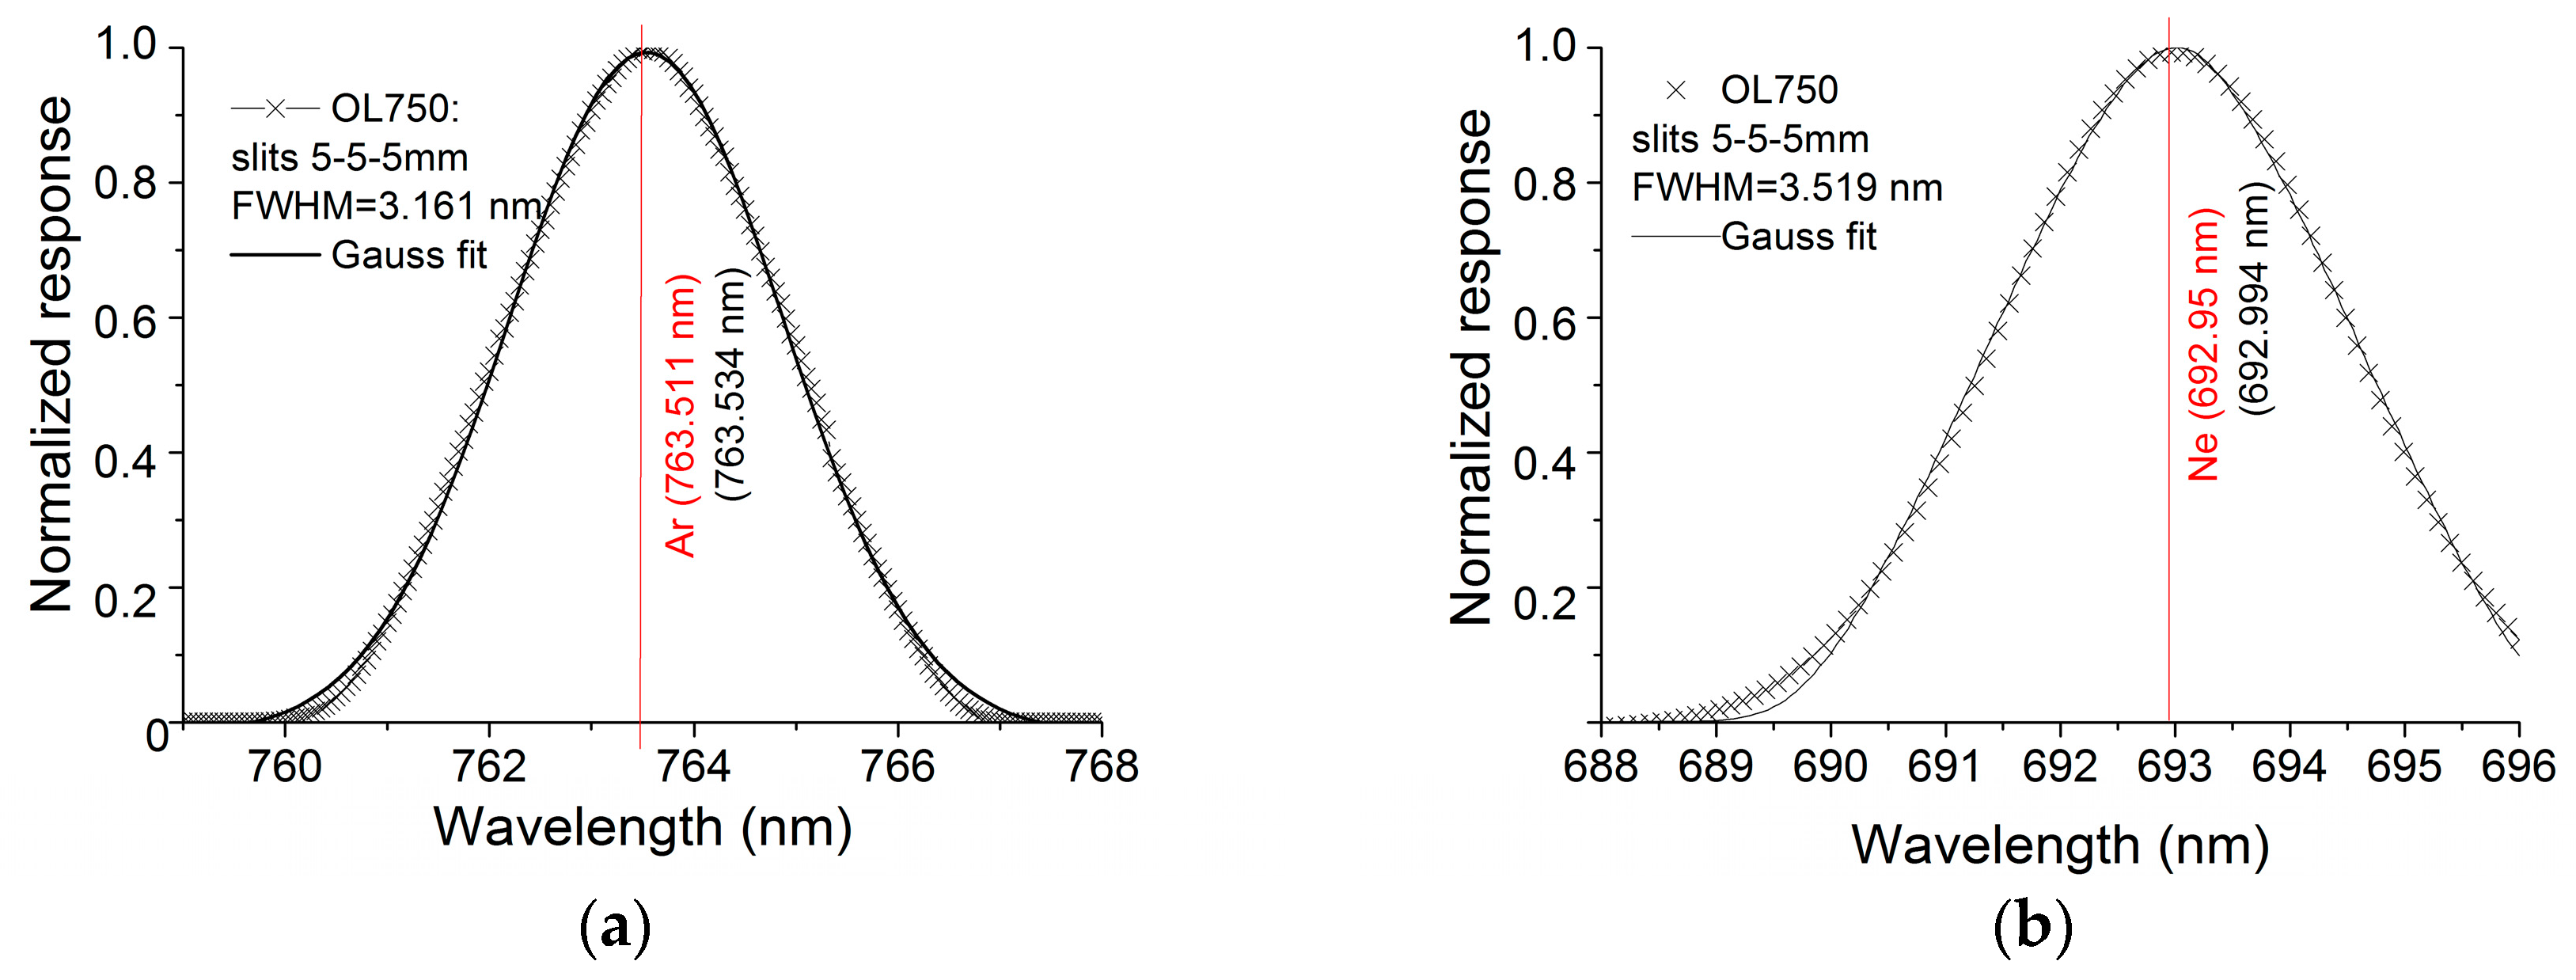
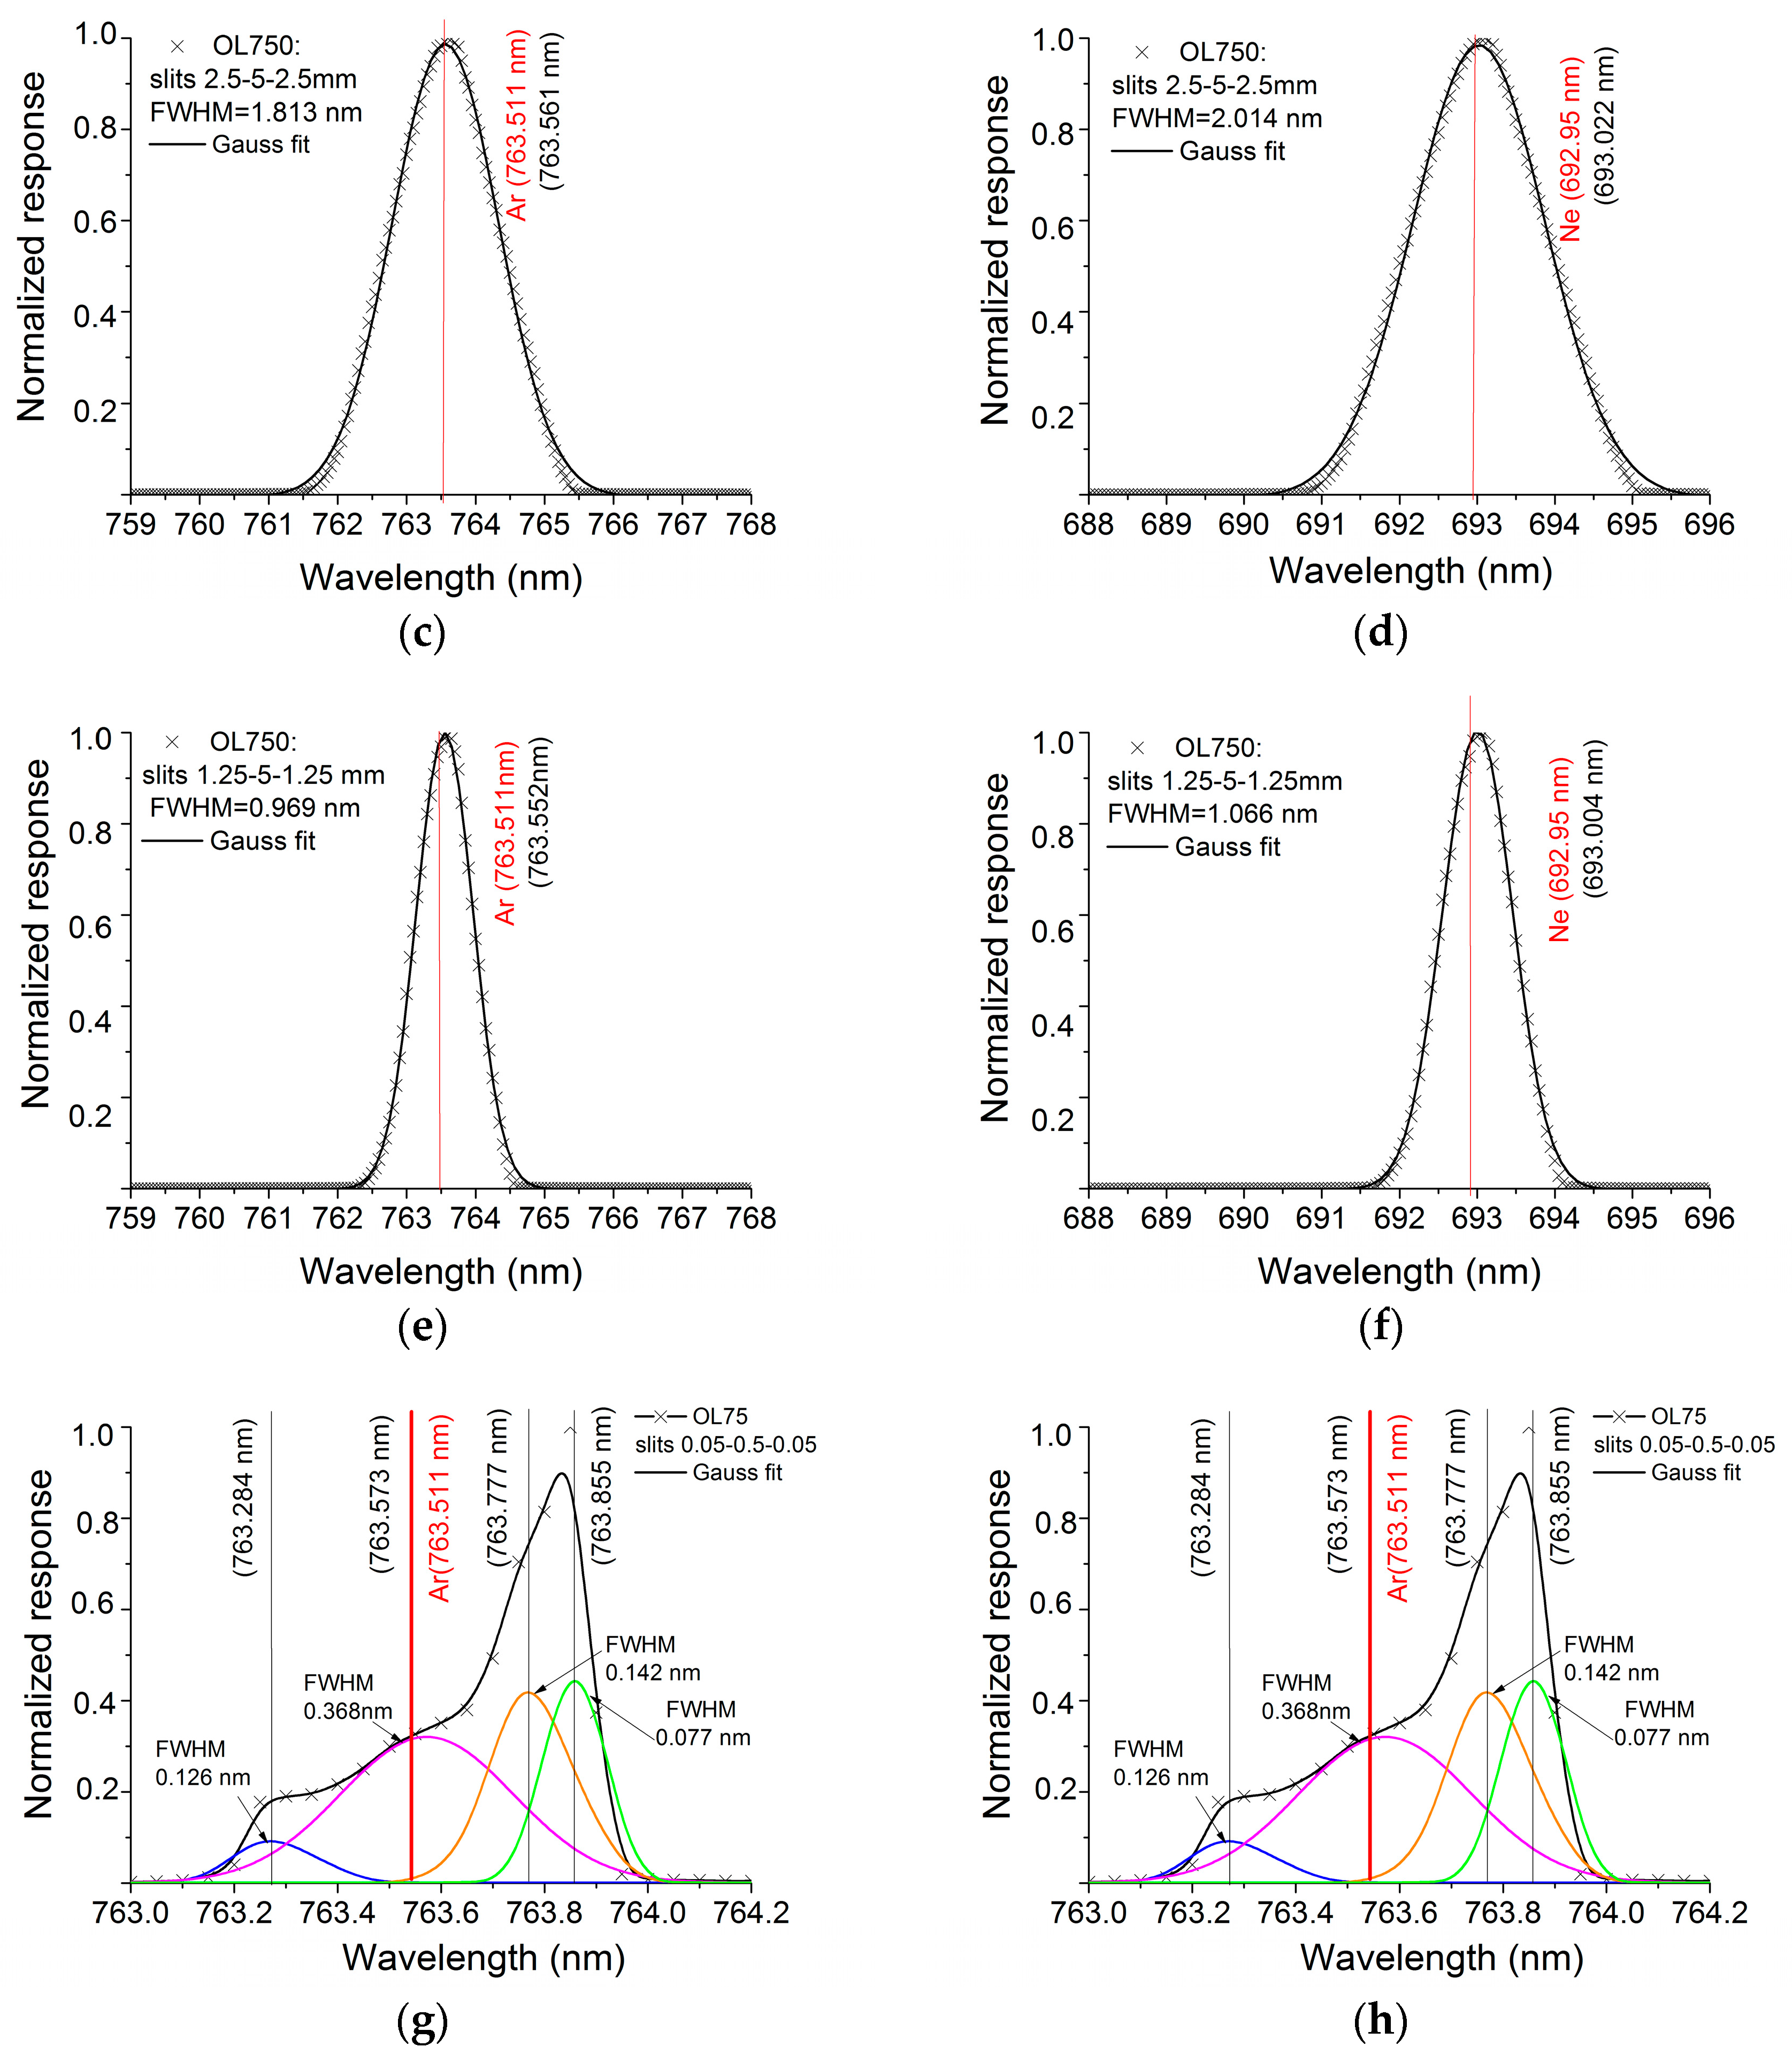
3.2.1. Monochromator Light Source Characterization with Reference Emission Lamp
3.2.2. Field Spectrometers Spectral Characterization with Monochromator Light Source
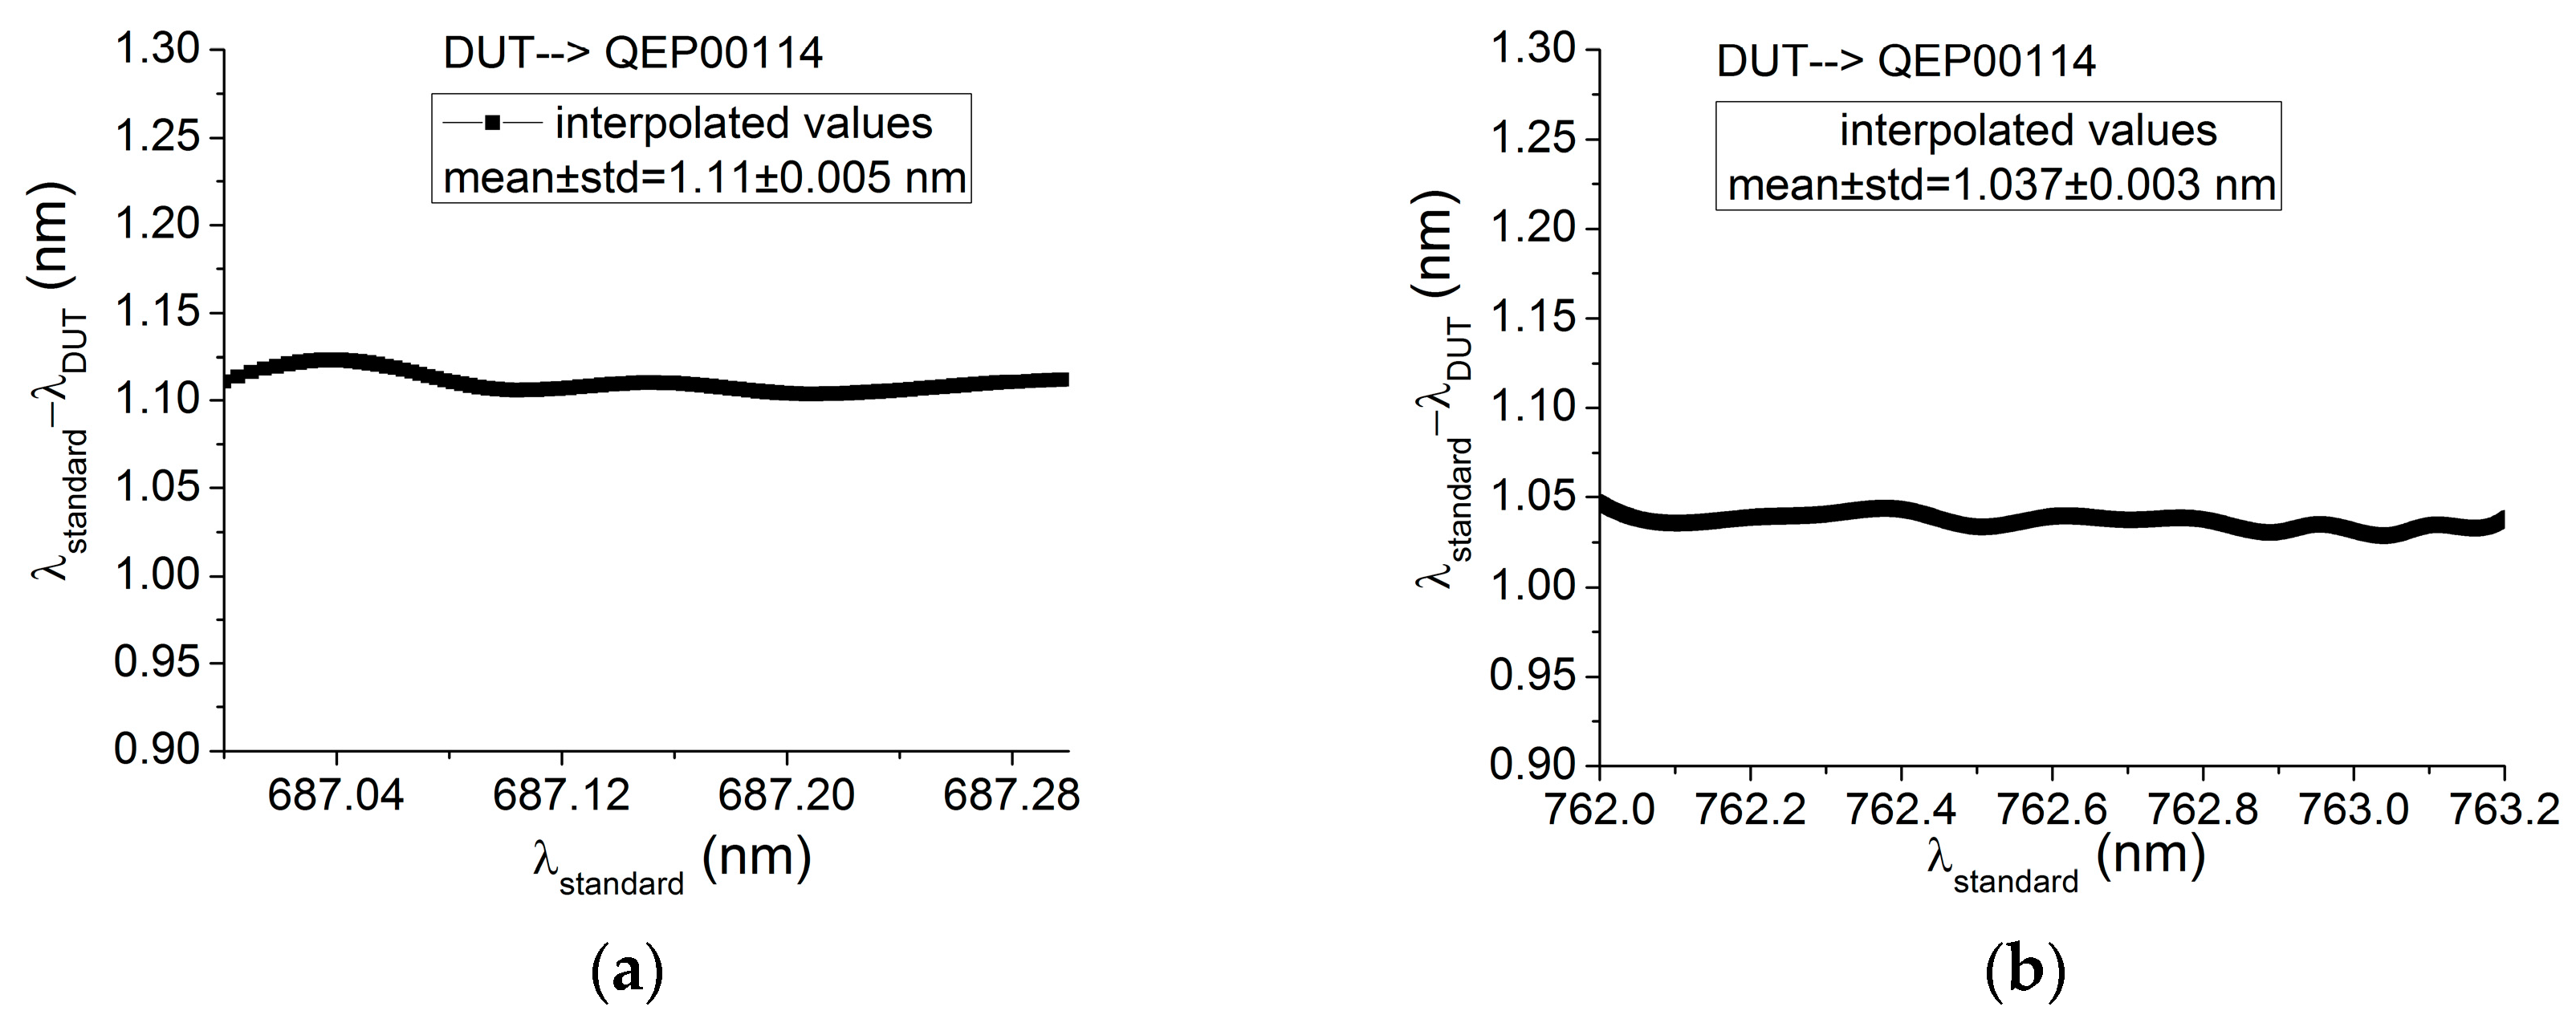
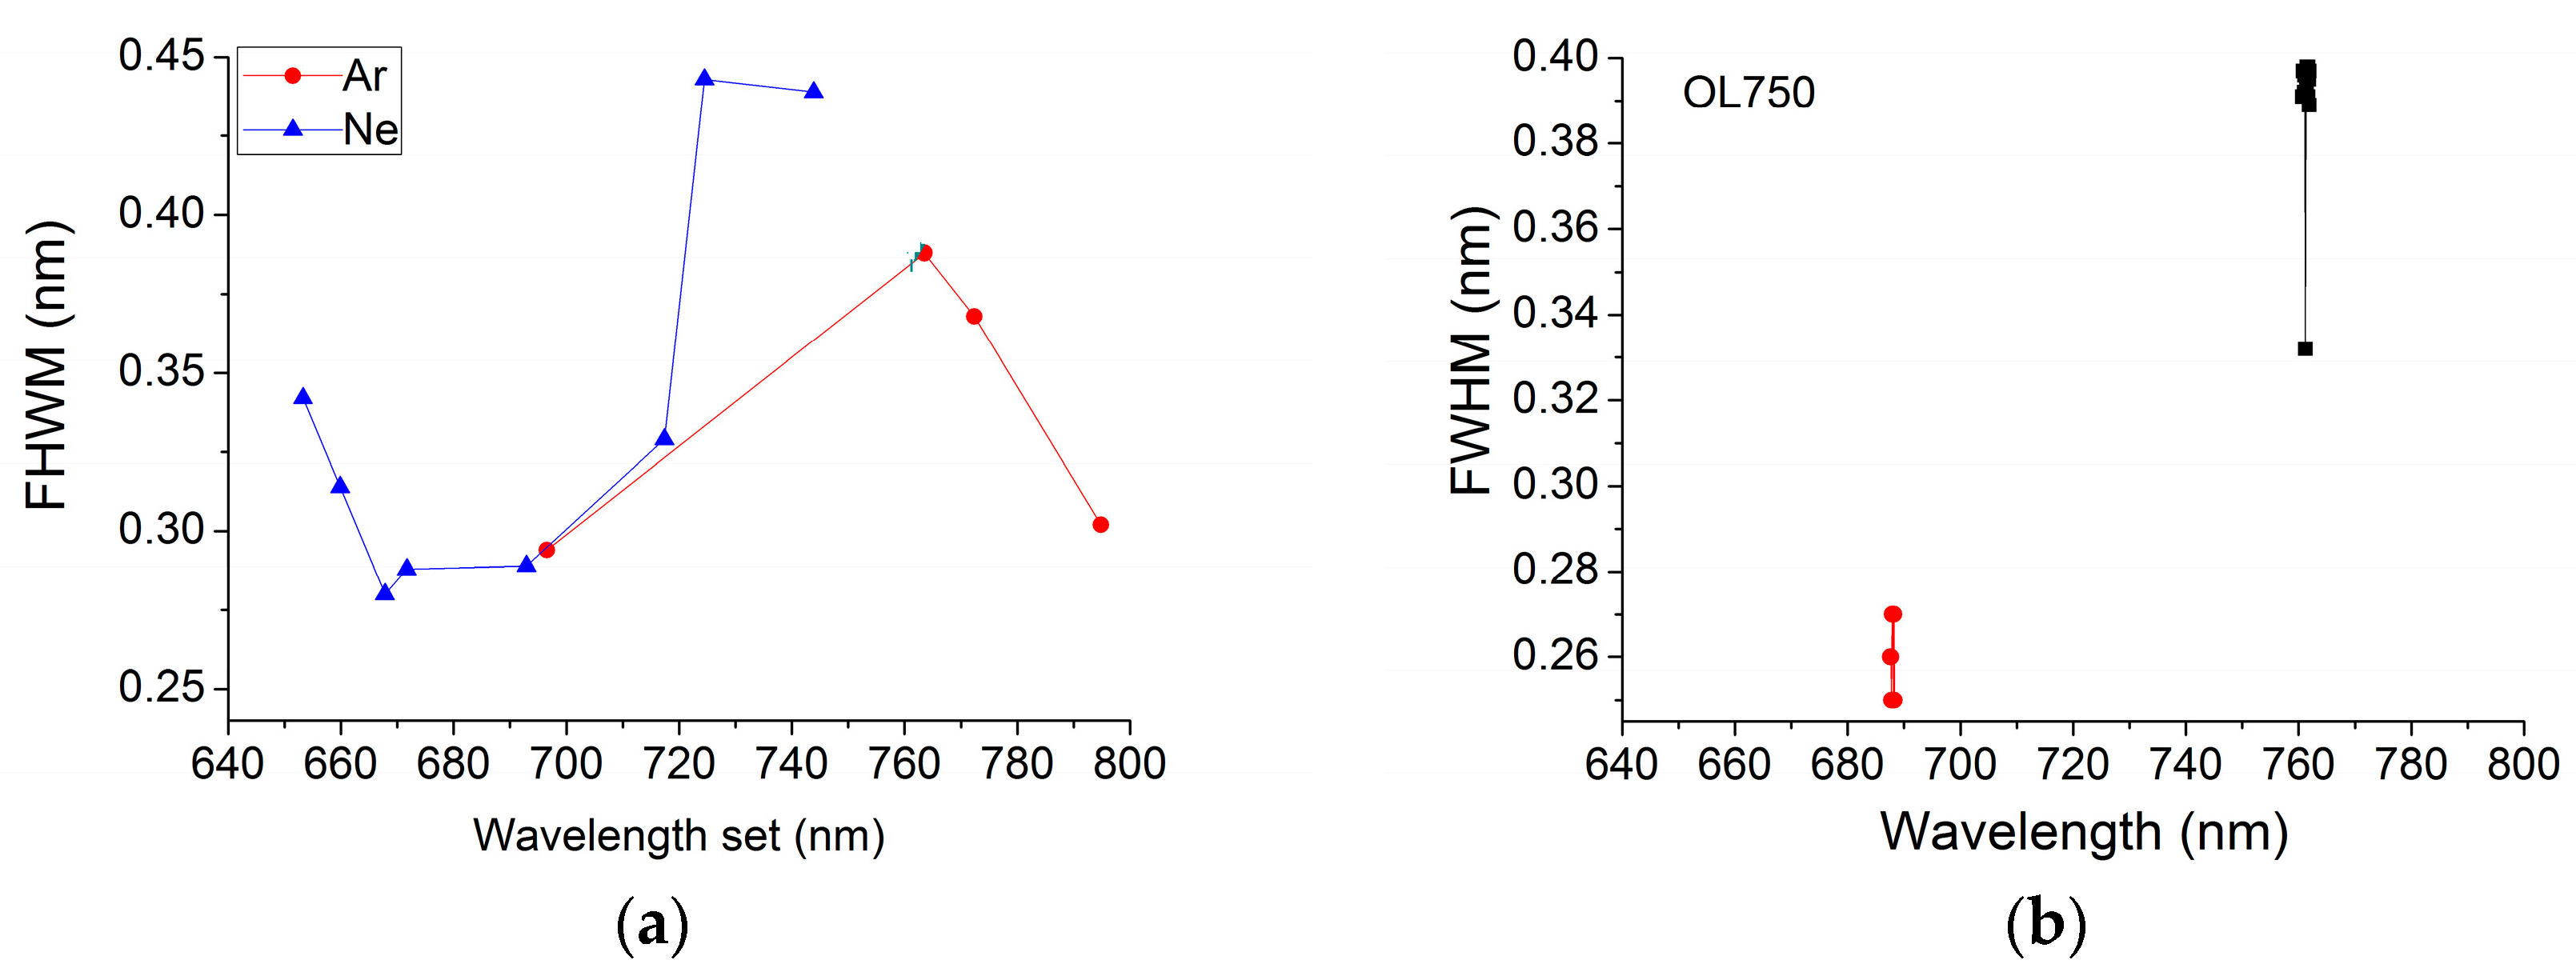
3.2.3. Fluorescence Spectrometer QEP00114 Spectral Resolution
4. Discussion
- -
- -
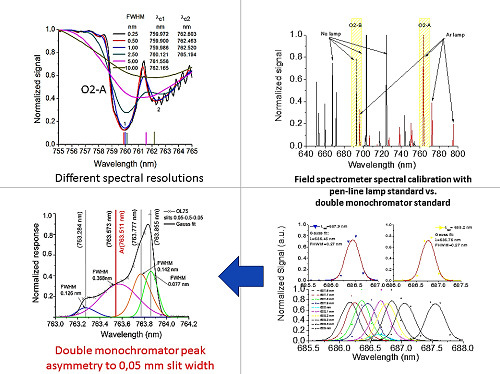
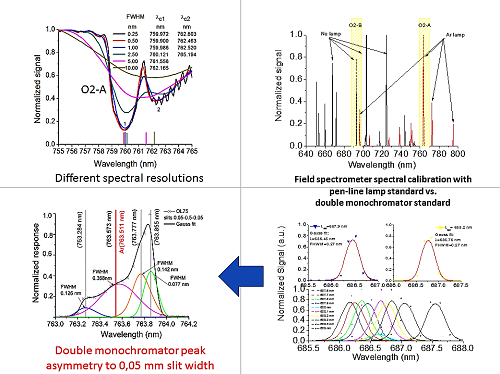
- to optimise the wavelength correction close to O2-A and/or O2-B features, obtaining minimum error at specific wavelengths, but higher error outside this range. This method still relies on a polynomial fit. This method can be a better option for high resolution spectrometers used for SIF studies. If the correction is optimised to only one wavelength close to the O2-A absorption line, an error of ±0.125 nm (Table 2) is obtained for the O2-B line. Therefore, it is highly recommended to have wavelength correction at both telluric bands using an additional line lamp (e.g., Ne) to minimize the error. Furthermore, the double monochromator could be used at any wavelength, but an uncertainty due to limited standard calibration has to be considered.
5. Conclusions
Acknowledgments
Author Contributions
Conflicts of Interest
References
- Baker, N.R. Chlorophyll fluorescence: A probe of photosynthesis in vivo. Annu. Rev. Plant Biol. 2008, 59, 89–113. [Google Scholar] [CrossRef] [PubMed]
- Papageorgiou, G.C. (Ed.) Chlorophyll a Fluorescence: A Signature of Photosynthesis; Advances in Photosynthesis and Respiration; Springer: Dordrecht, The Netherlands, 2004; Volume 19, pp. 1–42. ISBN 978-1-4020-3217-2. [Google Scholar]
- European Space Agency (ESA). Report for Mission Selection: FLEX, ESA SP-1330/2; European Space Agency: Noordwijk, The Netherlands, 2015; ISBN 978-92-9221-428-9. [Google Scholar]
- Maxwell, K.; Johnson, G.N. Chlorophyll fluorescence—A practical guide. J. Exp. Bot. 2000, 51, 659–668. [Google Scholar] [CrossRef] [PubMed]
- Jauffraud, E.; Bassaler, P.; Coppo, P.; Taiti, A.; Battistelli, E.; Rossi, M. FLEX & Sentinel 3: A tandem to monitor vegetation. In Proceedings of the 2016 European Space Agency Living Planet Symposium, Prague, Czech Republic, 9–13 May 2016. [Google Scholar]
- ESA Website. Available online: https://earth.esa.int/web/guest/missions/esa-future-missions/flex/news/-/article/sentinels-and-flex-join-forces (accessed on 10 November 2017).
- Website of Workshop on Land Product Validation and Evolution (LPVE 2018). Available online: https://nikal.eventsair.com/QuickEventWebsitePortal/lpve-conference-2018/esaconference/ExtraContent/ContentPage?page=1 (accessed on 10 November 2017).
- Schaepman, M. Calibration of a Field Spectroradiometer. Ph.D. Thesis, University of Zurich, Zürich, Switzerland, 1998. [Google Scholar]
- Kohler, D.D.R.; Bissett, W.P.; Steward, R.G.; Davis, C.O. New approach for the radiometric calibration of spectral imaging systems. Opt. Express 2004, 12, 2463–2477. [Google Scholar] [CrossRef] [PubMed]
- Klaasen, K.P.; A’Hearn, M.F.; Baca, M.; Delamere, A.; Desnoyer, M.; Farnham, T.; Groussin, O.; Hampton, D.; Ipatov, S.; Lisse, J.; et al. Invited article: Deep impact instrument calibration. Rev. Sci. Instrum. 2008, 79, 091301. [Google Scholar] [CrossRef] [PubMed]
- Schaepman, M.E.; Dangel, S. Solid laboratory calibration of a nonimaging spectroradiometer. Appl. Opt. 2000, 39, 3754–3764. [Google Scholar] [CrossRef] [PubMed]
- Meroni, M.; Rossini, M.; Guanter, L.; Alonso, L.; Rascher, U.; Colombo, R.; Moreno, J. Remote sensing of solar induced chlorophyll fluorescence: Review of methods and applications. Remote Sens. Environ. 2009, 113, 2037–2051. [Google Scholar] [CrossRef]
- Joiner, J.; Guanter, L.; Lindstrot, R.; Voigt, M.; Vasilkov, A.P.; Middleton, E.M. Global monitoring of terrestrial chlorophyll fluorescence from moderate spectral resolution near-infrared satellite measurements: Methodology, simulations, and application to GOME-2. Atmos. Meas. Tech. 2013, 6, 3883–3930. [Google Scholar] [CrossRef]
- Guanter, L.; Rossini, M.; Colombo, R.; Meroni, M.; Frankenberg, C.; Lee, J.-E.; Joiner, J. Using field spectroscopy to assess the potential of statistical approaches for the retrieval of sun-induced chlorophyll fluorescence from ground and space. Remote Sens. Environ. 2013, 133, 52–61. [Google Scholar] [CrossRef]
- Meroni, M.; Busetto, L.; Colombo, R.; Guanter, L.; Moreno, J.; Verhoef, W. Performance of spectral fitting methods for vegetation fluorescence quantification. Remote Sens. Environ. 2010, 114, 363–374. [Google Scholar] [CrossRef]
- Damm, A.; Erler, A.; Hillen, W.; Meroni, M.; Schaepman, M.E.; Verhoef, W.; Rascher, U. Modeling the impact of spectral sensor configurations on the FLD retrieval accuracy of sun-induced chlorophyll fluorescence. Remote Sens. Environ. 2011, 115, 1882–1892. [Google Scholar] [CrossRef]
- Ding, W.; Zhao, F.; Yang, L. Analyzing the impact of sensor characteristics on retrieval methods of solar-induced fluorescence. In Proceedings of the SPIE International Conference on Optical and Photonics Engineering (icOPEN 2016), Chengdu, China, 26–30 September 2016; Volume 10250. [Google Scholar]
- Hueni, A.; Damm, A.; Kneubühler, M.; Schläpfer, D.; Schaepman, M.E. Field and airborne spectroscopy cross validation—Some considerations. IEEE J. Sel. Top. Appl. Earth Obs. Remote Sens. 2017, 10, 1117–1135. [Google Scholar] [CrossRef]
- Guanter, L.; Alonso, L.; Gomez-Chova, L.; Meroni, M.; Preusker, R.; Fischer, J.; Moreno, J. Developments for vegetation fluorescence retrieval from spaceborne high-resolution spectrometry in the O2-A and O2-B absorption bands. J. Geophys. Res. Atmos. 2010, 115. [Google Scholar] [CrossRef]
- Rossini, M.; Meroni, M.; Migliavacca, M.; Manca, G.; Cogliati, S.; Busetto, L.; Picchi, V.; Cescatti, A.; Seufert, G.; Colombo, R. High resolution field spectroscopy measurements for estimating gross ecosystem production in a rice field. Agric. For. Meteorol. 2010, 150, 1283–1296. [Google Scholar] [CrossRef]
- Meroni, M.; Barducci, A.; Cogliati, S.; Castagnoli, F.; Rossini, M.; Busetto, L.; Migliavacca, M.; Cremonese, E.; Galvagno, M.; Colombo, R.; et al. The hyperspectral irradiometer, a new instrument for long-term and unattended field spectroscopy measurements. Rev. Sci. Instrum. 2011, 82, 043106. [Google Scholar] [CrossRef] [PubMed]
- Cogliati, S.; Rossini, M.; Julitta, T.; Meroni, M.; Schickling, A.; Burkart, A.; Pinto, F.; Rascher, U.; Colombo, R. Continuous and long-term measurements of reflectance and sun-induced chlorophyll fluorescence by using novel automated field spectroscopy systems. Remote Sens. Environ. 2015, 164, 270–281. [Google Scholar] [CrossRef]
- Buschmann, C.; Nagel, E.; Szabó, K.; Kocsányi, L. Spectrometer for fast measurements of in vivo reflection, absorption and fluorescence in the visible and near infrared. Remote Sens. Environ. 1994, 48, 18–24. [Google Scholar] [CrossRef]
- Julitta, T.; Rossini, M.; Burkart, A.; Cogliati, S.; Davies, N.; Hom, M.; Mac Arthur, A.; Middleton, E.M.; Rascher, U.; Schickling, A.; et al. Comparison of sun-induced chlorophyll fluorescence estimates obtained from four portable field spectroradiometers. Remote Sens. 2016, 8, 122. [Google Scholar] [CrossRef]
- Basics of Spectral Measurement. JETI Technische Instrumente GmbH. Available online: www.jeti.com/cms/images/jeti_com/down/basics/basics.pdf (accessed on 20 January 2018).
- Ocean Optics Website. Available online: https://oceanoptics.com/wp-content/uploads/Spectrometer-Wavelength-Calibration-Instructions.pdf (accessed on 20 January 2018).
- Yoon, H.W.; Kacker, R.N. Handbook (NIST HB)–157; NIST Publications: Gaithersburg, MD, USA, 2015.
- Alonso, L.; Gómez-Chova, L.; Vila-Francés, J.; Amorós-López, J.; Guanter, L.; Calpe, J.; Moreno, J. Improved Fraunhofer Line Discrimination method for vegetation fluorescence quantification. IEEE Geosci. Remote Sens. Lett. 2008, 5, 620–624. [Google Scholar] [CrossRef]
- Choi, K.Y.; Milton, E.J. Estimating the spectral response function of the CASI-2. In Proceedings of the Annual Conference of the Remote Sensing and Photogrammetry Society, Falmouth, UK, 15–17 September 2008. [Google Scholar]
- Liu, L.; Liu, X.; Hu, J. Effects of spectral resolution and SNR on the vegetation solar-induced fluorescence retrieval using FLD-based methods at canopy level. Eur. J. Remote Sens. 2015, 48, 743–762. [Google Scholar] [CrossRef]
- Centre of Nanotechnology and Materials for Nanoelectronics Website. Available online: http://nanotech.fzu.cz/26/data/PenRay.pdf (accessed on 31 January 2018).
- Pen-Ray Line Sources. Available online: http://pas.ce.wsu.edu/CE415/PenRay_lamp_spectra.pdf (accessed on 31 January 2018).
- Mac Arthur, A.; Robinson, I.; Rossini, M.; Davis, N.; MacDonald, K. A dual-field-of-view spectrometer system for reflectance and fluorescence measurements (Piccolo Doppio) and correction of etaloning. In Proceedings of the 5th International Workshop on Remote Sensing of Vegetation Fluorescence, Paris, France, 22–24 April 2014. [Google Scholar]
- Kramida, A.; Ralchenko, Y.; Reader, J.; NIST ASD Team. NIST Atomic Spectra Database (Version 5.5.2); National Institute of Standards and Technology: Gaithersburg, MD, USA, 2018. Available online: https://physics.nist.gov/asd (accessed on 29 January 2018).
- Reader, J.; Sansonetti, C.J.; Bridges, J.M. Irradiances of spectral lines in mercury pencil lamps. Appl. Opt. 1996, 35, 78–83. [Google Scholar] [CrossRef] [PubMed]
- Wang, Z.; Wang, K.; An, S. Cubic B-Spline Interpolation and Realization. In Communications in Computer and Information Science, Proceedings of the Information Computing and Applications (ICICA 2011), Qinhuangdao, China, 28–31 October 2011; Liu, C., Chang, J., Yang, A., Eds.; Springer: Berlin/Heidelberg, Germany, 2011; Volume 243. [Google Scholar]
- Ocean Optics. Calibrating the Wavelength of the Spectrometer n.d. Available online: https://oceanoptics.com/wp-content/uploads/Spectrometer-Wavelength-Calibration-Instructions.pdf (accessed on 31 January 2018).
- Mini-Spectrometers. Hamamatsu. Available online: https://www.hamamatsu.com/resources/pdf/ssd/mini-spectrometer_kacc9003e.pdf (accessed on 31 January 2018).
- Avantes Catalog, X. Available online: https://www.avantes.com/support/downloads/catalog/356-avantes-catalog-x/file (accessed on 31 January 2018).


| Entrance, Middle, Exit Slits + 5 mm Aperture at Exit (mm) | Reference Light Source | Spectral Range (nm) | Sampling Interval (nm) |
|---|---|---|---|
| 0.05, 0.5, 0.05 | Neon | 686–696 | 0.05 |
| 0.05, 0.5, 0.05 | Argon | 758–768 | 0.05 |
| 0.05, 0.5, 0.05 | Argon | 768–778 | 0.05 |
| 1.25, 5.0, 1.25 | Neon | 686–696 | 0.05 |
| 1.25, 5.0, 1.25 | Argon | 758–768 | 0.05 |
| 1.25, 5.0, 1.25 | Argon | 768–778 | 0.05 |
| 2.5, 5.0, 2.5 | Neon | 686–696 | 0.05 |
| 2.5, 5.0, 2.5 | Argon | 758–768 | 0.05 |
| 2.5, 5.0, 2.5 | Argon | 768–778 | 0.05 |
| 5.0, 5.0, 5.0 | Neon | 686–696 | 0.05 |
| 5.0, 5.0, 5.0 | Argon | 758–768 | 0.05 |
| 5.0, 5.0, 5.0 | Argon | 768–778 | 0.05 |
| DUT | Ar | Ne | ||||||
|---|---|---|---|---|---|---|---|---|
| λo | λref | λerror. | FWHM | λo | λref | λerror. | FWHM | |
| nm | nm | nm | nm | nm | nm | nm | nm | |
| QE00114 | 696..431 | 696.543 | 0.112 | 0.293 | 653.080 | 653.290 | 0.210 | 0.388 |
| 706.639 | 706.722 | 0.082 | 0.366 | 667.637 | 667.830 | 0.193 | 0.301 | |
| 727.252 | 727.294 | 0.042 | 0.439 | 671.522 | 671.700 | 0.178 | 0.290 | |
| 738.368 | 738.398 | 0.030 | 0.435 | 692.825 | 692.950 | 0.125 | 0.504 | |
| 750.374 | 750.387 | 0.013 | 0.429 | 724.479 | 724.520 | 0.041 | 0.379 | |
| 763.511 | 763.511 | 0.000 | 0.429 | - | - | - | - | |
| 772.4367 | 772.376 | −0.061 | 0.422 | - | - | - | - | |
| 794.851 | 794.818 | −0.033 | 0.331 | - | - | - | - | |
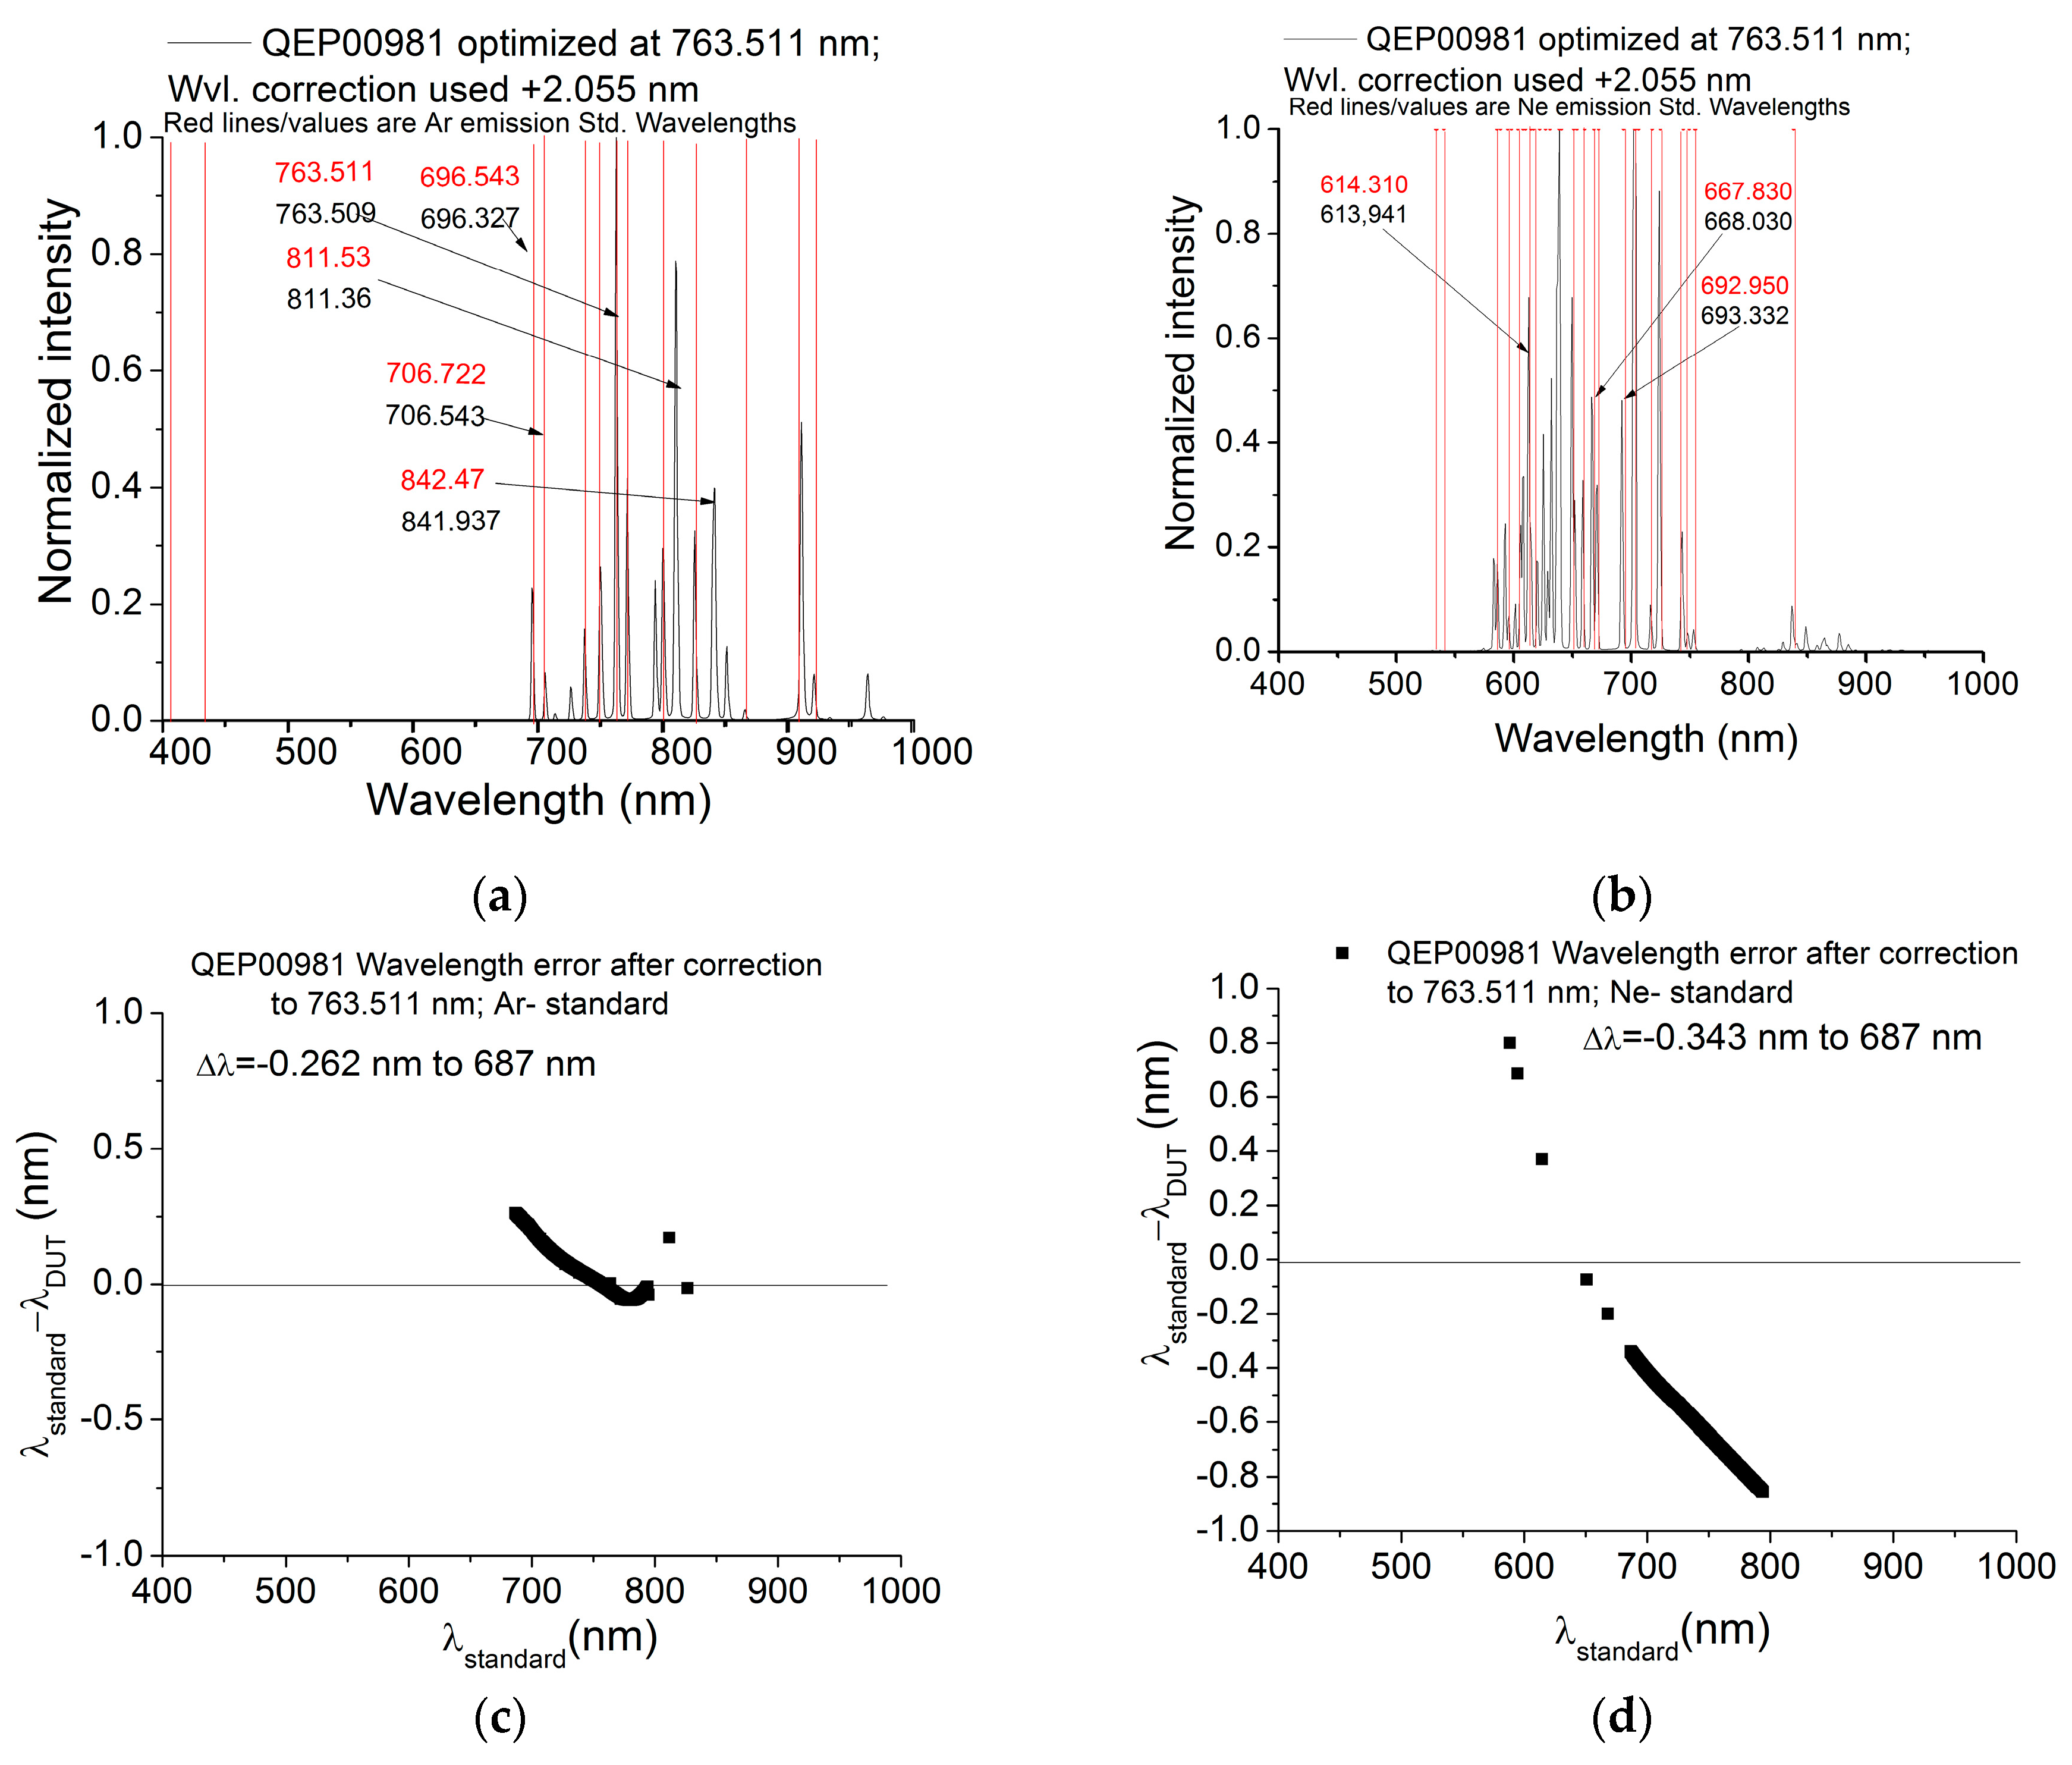
| QE00981 | 696.326 | 696.543 | 0.2170 | 1.941 | 587.390 | 588.190 | 0.800 | 1.446 |
| 706.553 | 706.722 | 0.1690 | 1.943 | 593.794 | 594.480 | 0.686 | 1.720 | |
| 727.221 | 727.294 | 0.0729 | 1.999 | 613.941 | 614.310 | 0.369 | 1.514 | |
| 738.356 | 738.398 | 0.0420 | 2.017 | 650.724 | 650.650 | −0.074 | 1.732 | |
| 750.873 | 750.387 | −0.4860 | 2.554 | 668.030 | 667.830 | −0.200 | 1.791 | |
| 763.511 | 763.511 | 0.0000 | 1.998 | 693.332 | 692.950 | −0.382 | 1.902 | |
| 772.429 | 772.376 | −0.0539 | 1.964 | 725.050 | 724.520 | −0.530 | 1.980 | |
| 794.857 | 794.818 | −0.0388 | 1.966 | - | - | - | - | |
| 811.36 | 811.531 | 0.171 | 2.461 | - | - | - | - | |
| 826.467 | 826.452 | −0.015 | 2.071 | - | - | - | - | |
| 841.938 | 842.465 | 0.5272 | 3.179 | - | - | - | - | |
| 912.031 | 912.297 | 0.2656 | 2.307 | - | - | - | - | |
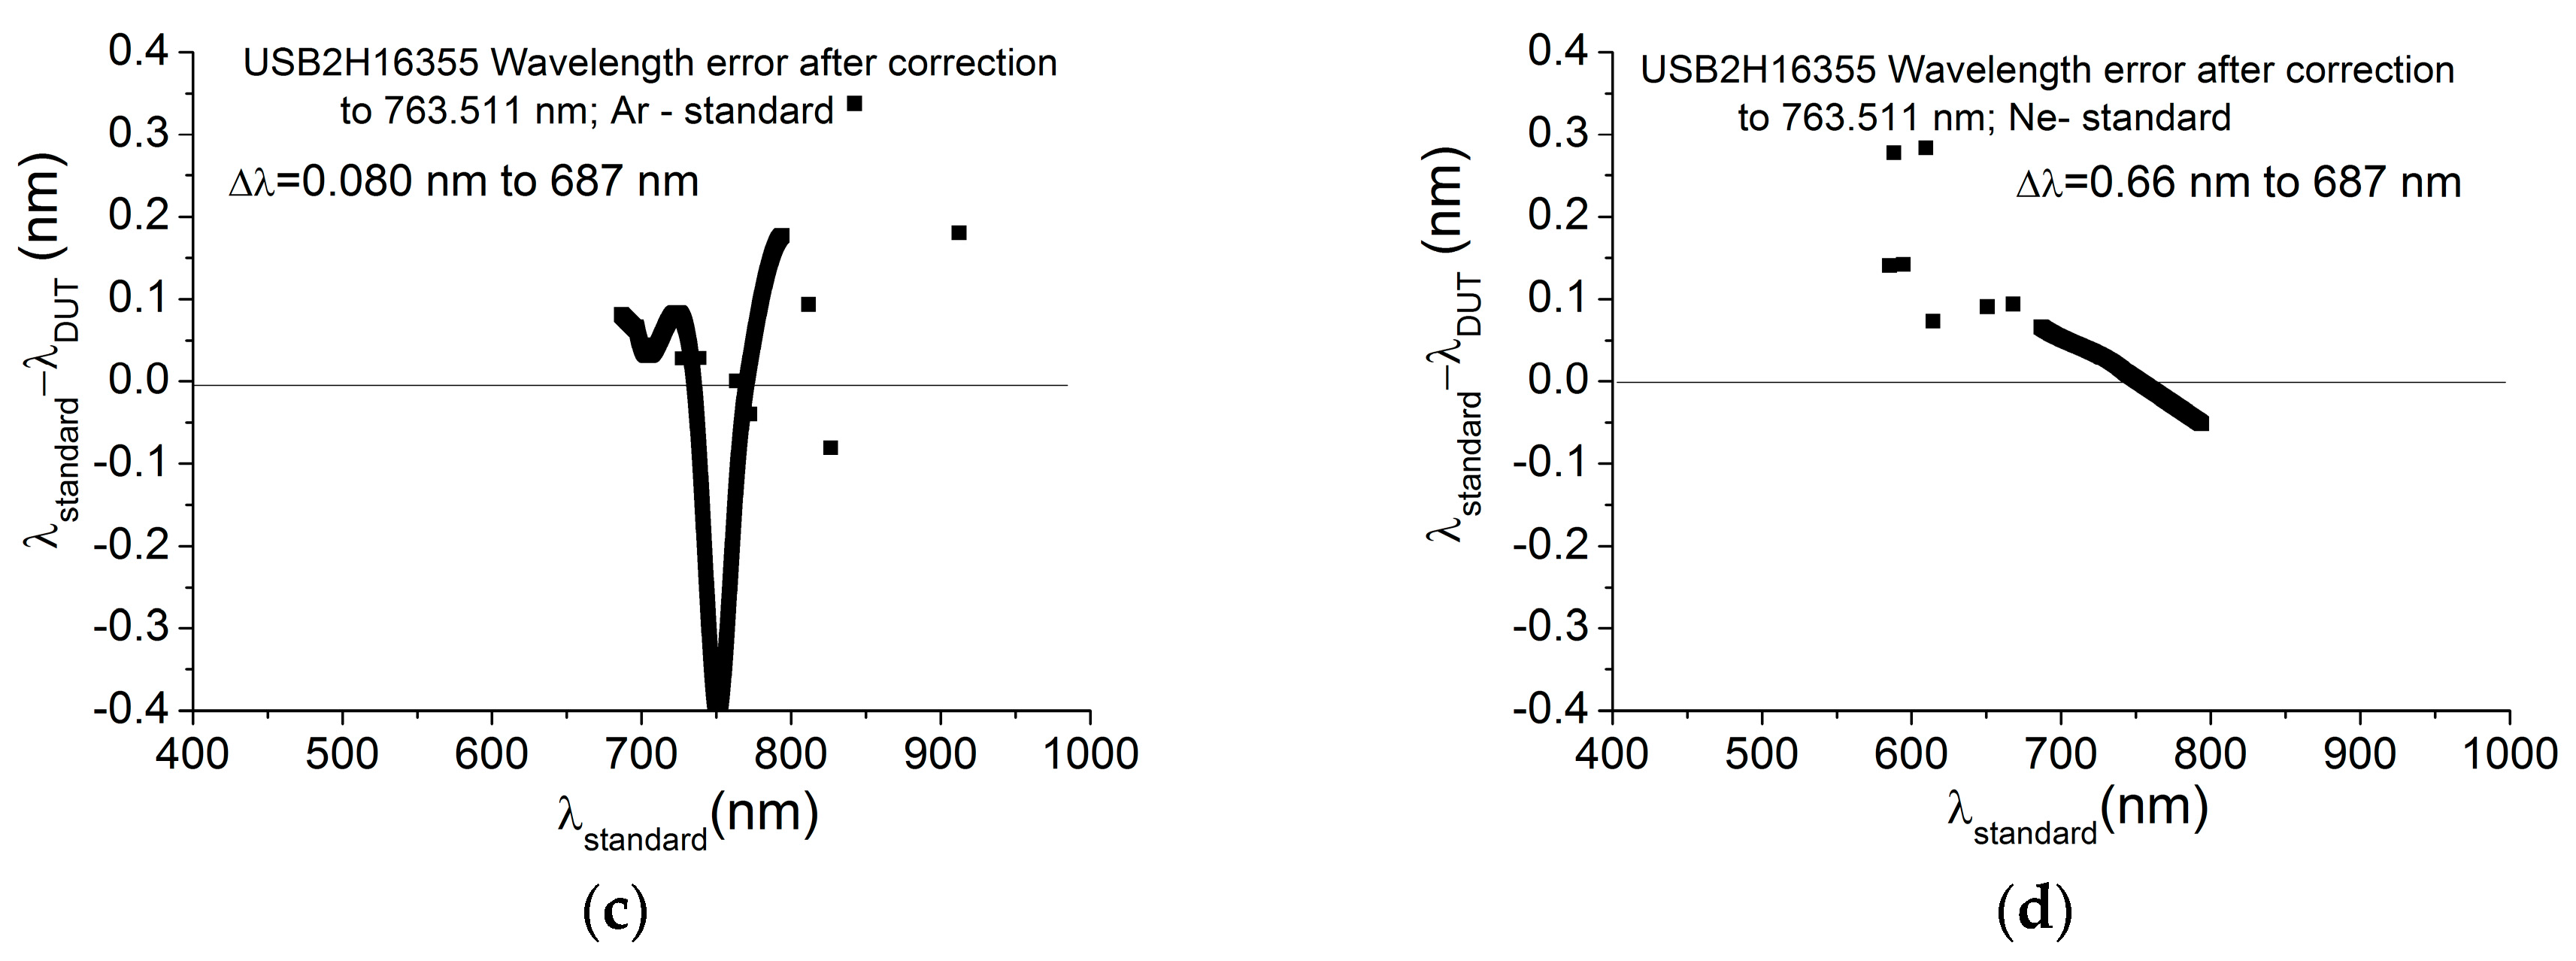
| USB2H16355 | 696.479 | 696.543 | 0.063 | 1.651 | 585.120 | 585.260 | 0.14 | 1.820 |
| 706.678 | 706.722 | 0.044 | 1.367 | 587.913 | 588.190 | 0.277 | 1.907 | |
| 727.266 | 727.294 | 0.028 | 1.693 | 594.338 | 594.480 | 0.142 | 1.720 | |
| 738.369 | 738.398 | 0.028 | 1.684 | 609.337 | 609.620 | 0.283 | 1.700 | |
| 750.920 | 750.387 | −0.533 | 2.378 | 614.236 | 614.310 | 0.074 | 1.936 | |
| 763.511 | 763.511 | 0 | 1.705 | 650.559 | 650.650 | 0.091 | 1.519 | |
| 772.416 | 772.376 | −0.04 | 1.670 | 667.736 | 667.830 | 0.094 | 1.665 | |
| 811.437 | 811.531 | 0.094 | 2.135 | 692.890 | 692.950 | 0.06 | 1.697 | |
| 826.533 | 826.452 | −0.081 | 1.833 | 724.487 | 724.520 | 0.033 | 1.672 | |
| 842.127 | 842.465 | 0.338 | 2.900 | 743.881 | 743.890 | 0.009 | 1.576 | |
| 912.117 | 912.297 | 0.181 | 1.458 | - | - | - | - | |
| Ar | Ne | |||||||
|---|---|---|---|---|---|---|---|---|
| OL750D Slits | λmeas | FWHM | λref | λcorr. | λmeas | FWHM | λref | λcorr. |
| mm | nm | nm | nm | nm | nm | nm | nm | nm |
| 0.05, 0.5 and 0.05 | 763.855 | 0.077 | 763.511 | −0.344 | 693.223 | 0.045 | 692.95 | −0.273 |
| 1.25, 5 and 1.25 | 763.552 | 0.969 | 763.511 | −0.041 | 693.004 | 1.066 | 692.95 | −0.054 |
| 2.5, 5 and 2.5 | 763.561 | 1.813 | 763.511 | −0.05 | 693.022 | 2.014 | 692.95 | −0.072 |
| 5, 5 and 5 | 763.534 | 3.161 | 763.511 | −0.023 | 692.994 | 3.519 | 692.95 | −0.044 |
© 2018 by the authors. Licensee MDPI, Basel, Switzerland. This article is an open access article distributed under the terms and conditions of the Creative Commons Attribution (CC BY) license (http://creativecommons.org/licenses/by/4.0/).
Share and Cite
Mihai, L.; Mac Arthur, A.; Hueni, A.; Robinson, I.; Sporea, D. Optimized Spectrometers Characterization Procedure for Near Ground Support of ESA FLEX Observations: Part 1 Spectral Calibration and Characterisation. Remote Sens. 2018, 10, 289. https://doi.org/10.3390/rs10020289
Mihai L, Mac Arthur A, Hueni A, Robinson I, Sporea D. Optimized Spectrometers Characterization Procedure for Near Ground Support of ESA FLEX Observations: Part 1 Spectral Calibration and Characterisation. Remote Sensing. 2018; 10(2):289. https://doi.org/10.3390/rs10020289
Chicago/Turabian StyleMihai, Laura, Alasdair Mac Arthur, Andreas Hueni, Iain Robinson, and Dan Sporea. 2018. "Optimized Spectrometers Characterization Procedure for Near Ground Support of ESA FLEX Observations: Part 1 Spectral Calibration and Characterisation" Remote Sensing 10, no. 2: 289. https://doi.org/10.3390/rs10020289
APA StyleMihai, L., Mac Arthur, A., Hueni, A., Robinson, I., & Sporea, D. (2018). Optimized Spectrometers Characterization Procedure for Near Ground Support of ESA FLEX Observations: Part 1 Spectral Calibration and Characterisation. Remote Sensing, 10(2), 289. https://doi.org/10.3390/rs10020289