Abstract
Previous studies of public transport sustainability in cities have been very limited to date, particularly in more developing countries located throughout Asia and the Middle East. This paper assesses the sustainability of urban public transport systems in cities by adopting a quantitative measurement framework containing 15 public transport sustainability indicators. It compares aggregate sustainability performance of urban public transport in international regions of cities, and then examines the relative sustainability of selected cities in the Asia and Middle East region. The world region analysis shows that Eastern Europe, Asia, and Latin America achieve the highest aggregate normalised scores for sustainable public transport, in that order. In general, the results suggest that western developed countries (Western Europe, North America, and Oceania) have better performance on environmental and social indicators but poorer performance on system effectiveness and economic indicators. Asia and Latin America perform the other way round; better on economic and system effectiveness and worse on social and environmental indicators. Eastern Europe is one of the few regions with higher level performance all round. The city-based analysis of Asia/Middle East suggested that out of the 26 cities studied, the top 3 cities in terms of sustainable public transport in the Asia and Middle East Region are: 1st, Manila (Philippines); 2nd, Tokyo (Japan); and 3rd, Chennai (India). Dubai (United Arab Emirates (UAE), rated 26th), Shizuoka (Japan, rated 25th) and Kuala Lumpur (Malaysia, rated 24th) were the lowest rated cities. The paper explores the implications of the findings and makes suggestions for future research.
1. Introduction
In 2015, the United Nations developed 17 sustainable development goals for humanity to achieve a more sustainable and peaceful world by the year 2030 [1]. Goal 11 specifically targets cities and sought to “Make cities and human settlements inclusive, safe, resilient and sustainable”. The UN goals include specific targets for transport including target 11.2 which states:
By 2030, provide access to safe, affordable, accessible and sustainable transport systems for all, improving road safety, notably by expanding public transport, with special attention to the needs of those in vulnerable situations, women, children, persons with disabilities and older persons.
So, sustainable transport and expansion of urban public transport are major features of international goals for the sustainable development of cities. Yet, how sustainable are public transport systems in cities? Do they provide the environmental, economic, social, and system effectiveness benefits which have often been stated for them? Also, how does sustainability of urban public transport systems vary by regions? Which systems are more sustainable than others, and why?
Previous studies of public transport sustainability in cities have been very limited to date, particularly in more developing countries located throughout Asia and the Middle East. This research paper seeks to assess the sustainability of urban public transport systems in cities by adopting a quantitative measurement framework containing 15 public transport sustainability indicators. There are two specific aims for the research; the first is to compare aggregate international regions of cities, and the second is to examine the relative sustainability of selected cities in the Asia and Middle East region (the authors were asked to focus on this region by the editors of this special edition of the Journal). In doing so, the paper contributes to the literature through providing an understanding of urban public transport sustainability in less developed cities and how this compares to other regions in the world.
The paper is structured as follows. The next section overviews research on sustainability in both transport and public transport, then describes research on quantitative measures of sustainability of public transport systems. The research method is then described, including a review of the available data sources, the cities and indicators selected, and the analytical approach adopted to compare the sustainability performance of urban public transport in cities and regions. The results are then described. The paper concludes with a summary of key findings, including areas for future research.
2. Research Context
This section provides context for the research through a literature review of sustainability definitions and an overview of how previous studies have considered sustainability in both transport and public transport.
2.1. Defining Sustainability
For centuries, there has been an underlying, usually unchallenged, assumption that the earth will continue to provide endless resources to support the economic and social development of human beings. In the last half century, that assumption has been challenged, with greater consideration being given to the sustainable management of the available resources. While concepts associated with sustainability, or sustainable development, have been in the literature for many years, it was a final report of a UN commission that is associated with the most commonly cited definition of the term. The Brundtland Commission [2] defined sustainable development as:
“… development that meets the needs of the present without compromising the ability of future generations to meet their own needs”.
Unfortunately, the lack of precision in that definition has meant difficulty in interpreting sustainability, measuring it, or designing policies or programs to advance it. The concept still tends to be most strongly associated with environmental issues/impacts. That is perhaps not surprising given that human existence is now regarded as placing substantial strain on the earth’s systems that sustain life [3]. Those earth systems feature in a recent refinement to the definition of sustainability [4] as being:
“Development that meets the needs of the present while safeguarding Earth’s life-support system, on which the welfare of current and future generations depends”.
While that definition highlights the intergenerational dimension of the concept, it could still be interpreted as placing the spotlight on the environment. However, those underlying earth systems are not only important for all life, but also provide the foundations for the economic and social systems, which are highly valued by humans. Consistent with that perspective, sustainability is increasingly recognised as having social, economic, and environmental dimensions.
2.2. Transport Sustainability
In the transport context, there has often been a strong focus on economic outcomes, with less consideration given to social and environmental aspects. The need to decouple transport from economic growth to include social and environmental externalities has been recognised [5], along with the importance of addressing social exclusion issues in transport [6]. Much research has been undertaken to measure the sustainability of transport systems through the use of various indicators and frameworks [7,8,9,10,11,12]. These studies have each incorporated economic, social, and environmental components, commonly referred to as the triple-bottom line of sustainability. For example, an international review undertaken by Dobranskyte-Niskota et al. [13] developed a set of 55 indicators for assessing the transport sustainability performance of countries in the European Union (EU). The 55 indicators were grouped into the following key categories:
- Economic: transport demand, costs, and infrastructure-related indicators
- Social: accessibility, mobility, safety, health, affordability, and employment-related indicators
- Environmental: transport emissions, energy, and environmental-based indicators
- Technical and operational: vehicle occupancy and technology-related indicators
- Institutional: consideration of measures to improve transport sustainability.
Their assessment showed that Germany, Belgium, and the Netherlands were among the best performing EU member states in terms of transport sustainability, while the lowest performance was found in Greece, Estonia, Bulgaria, and Lithuania [14].
Similarly, Haghshenas and Vaziri [7] assessed the transport sustainability of 90 cities using a composite index of nine economic, social, and environmental indicators. They found that cities in developed parts of Asia and Europe performed best due to a greater emphasis placed on public and non-motorised forms of transport in those cities.
In selecting sustainable transport indicators, Litman [15] describes a set of principles, noting that these should be comprehensive, of sufficient quality, comparable, easy to understand, accessible and transparent, cost effective, able to differentiate between types of impacts, and suitable for establishing performance targets. In particular, Litman [15] notes the tension that can exist between convenience and comprehensiveness when selecting indicators. He states that while a smaller set of indicators using easily available data is more convenient to collect and analyse, these may overlook other important impacts. Conversely, a large set of indicators may be more comprehensive, but are associated with excessive (or even prohibitive) data collection and analysis costs.
2.3. Public Transport Sustainability
In contrast to sustainability assessments of entire transport systems (all modes), the assessment of public transport sustainability typically requires a more specific focus on elements that are relevant to public transport, while ensuring that environmental, social, and economic aspects are addressed. Table 1 provides a summary of indicators proposed in the literature for the assessment of public transport sustainability, based on a review undertaken by Miller et al. [16]. This includes indicators reflecting triple-bottom line considerations (environmental, social, and economic), in addition to “system effectiveness” indicators (describing how effective a public transport system is in terms of elements specific to public transport). A total of 7 environmental indicators are identified, covering aspects such as energy, pollutants, noise, and land uptake. There are also 10 social indicators (covering accessibility, affordability, and safety), 8 economic indicators (covering system and user costs, subsidies, and travel time), and 4 system effectiveness indicators (covering vehicle occupancy, reliability, trip rates, and mode split). While a relatively large number of indicators are identified in the literature for assessing public transport sustainability, constraints in both the reliability and availability of data can affect the selection of indicators in practice [15].

Table 1.
Indicators proposed in the literature for the assessment of public transport sustainability.
Only a small number of studies have specifically focused on assessing public transport sustainability. Miller [17] developed a framework using composite sustainability index techniques to assess the performance of 33 public transport systems in the United States. The framework included a total of 20 environmental, economic, social, and system effectiveness indicators, and was used to compare the relative sustainability performance of heavy rail and light rail systems throughout the United States. A similar framework was then used by Miller et al. [16] to assess the sustainability of different public transport modes for the Broadway Corridor in Vancouver, Canada. This study again demonstrated the use of composite index techniques for assessing public transport sustainability, and tested a range of data normalisation and weighting techniques.
Despite the work undertaken by Miller, no studies have specifically assessed public transport sustainability outside of the United States and Canada, particularly in more developing countries located throughout Asia and the Middle East. This paper aims to address this research gap through developing an understanding of urban public transport sustainability in Asian and Middle Eastern cities as well as taking a view on separate regions of the world.
3. Research Method
This section outlines the method used to assess urban public transport sustainability in world regions and, in particular, selected Asian and Middle Eastern cities. Key data sources and cities are described first, followed by an overview of selected public transport sustainability indicators and the process used to analyse these.
3.1. Key Data Sources and Cities
A range of publicly available databases provide transport indicators for different geographical regions [18,19,20]. However, most of these only contain information at the country level (rather than city level), with relatively little information specific to public transport. The databases produced by the International Association for Public Transport (UITP, [21,22]), publicly available for purchase, overcome this limitation. Collectively, they cover more than 100 cities and include a range of indicators spanning demographics, public transport supply and demand, user and operational costs, system productivity, and environmental impacts. The data included in the UITP databases were collected and validated from a range of sources; where insufficient information was available to make a reliable estimate, the indicator was marked as not available [21,22]. A consistent approach to defining the metropolitan area of each city was also adopted by UITP to ensure that indicator values are comparable across cities [21,22].
Of the cities included in the UITP databases, 19 are located in Asia, while 7 are located in the Middle East. The remaining cities are located throughout Oceania, Africa, Europe, North America, and South America. Table 2 provides a list of the Asian and Middle Eastern cities included in the UITP databases, which are the focus of this study. A full list of all cities by world region is provided in Appendix A. In addition to the UITP databases, figures on gross domestic product (GDP) for each city were sourced from The Brookings Institution [23] and incorporated within the analysis.
Table 2.
Cities included in the assessment of public transport sustainability.
3.2. Selection of Public Transport Sustainability Indicators
Using the indicators proposed in the literature as a basis (Table 1), while taking into account data availability constraints, a total of 15 indicators were selected for the assessment of public transport sustainability in both world regions and the selected Asian and Middle Eastern cities. As shown in Table 3, the selected indicators included a range of environmental, social, economic, and system effectiveness indicators. While the UITP databases would have allowed additional system effectiveness indicators to be included, an approximate balance was sought in the number of indicators included for each dimension of public transport sustainability.
Table 3.
Indicators used for the assessment of public transport sustainability.
Where required, indicator units were adjusted to allow comparisons to be suitably made across cities. For example, the measurement units for indicator A5 (land area consumed for public transport facilities) were changed from m2 to “% of urban area” to allow cities of different sizes to be objectively compared with one another. While not included in Table 1, public transport fleet size (vehicles/million people) was added to the indicator set (see indicator D5 in Table 3), given that broader transport sustainability assessments typically include some measure of transport fleet size, (e.g., cars per 1000 people). However, it is acknowledged that vehicle size by public transport mode can vary somewhat between cities and is therefore a limitation associated with the assessment. Potential intercorrelation between indicators is also acknowledged, yet this is often inherent in triple-bottom line assessments of sustainability [12]. For example, improvements in economic performance may lead to declines in environmental and social outcomes.
3.3. Data Analysis
Using the UITP databases, the 15 selected indicators were compiled for the selected cities in Asia and the Middle East. Average indicator values were also compiled for each world region (Oceania, Africa, Asia, Middle East, Eastern Europe, Western Europe, North America, and Latin America) to facilitate regional comparisons of urban public transport sustainability.
To allow indicators to be compared within a given city, the indicator values were normalised using a distance-to-reference-based approach. This resulted in each indicator having a score between 0 (lowest performance) and 1 (highest performance). Where a lower value for an indicator was seen as more desirable (e.g., pollutants), the following equation was used to normalise the indicator value:
where:
where:
- ni negative = normalised value for negative indicator i
- xi = raw value of indicator i
- ni positive = normalised value for positive indicator i
- xi = raw value of indicator i
The distance-to-reference-based approach has been used in previous studies of transport sustainability to normalise indicator values [9,12,16]. It provides a suitable means for undertaking both intracity and intercity comparisons of sustainability, and is also easier to use in conjunction with visualisations, such as spider or spiral plots [16,24].
In the absence of any sufficient evidence to suggest that particular aspects of public transport sustainability are more important than others [7,16], all indicators were assigned equal weight in the assessment process. In using the distance-to-reference-based approach, normalised indicator values could therefore be averaged to calculate a total value for a given indicator category (e.g., “environmental”). However, where only one indicator value was available for a given category (representing about 10% of cases), the total value for the category was not reported, since this would not be representative of performance across the entire category. Because there is a lack of evidence to suggest that certain aspects of public transport sustainability are more important than others, a number of sensitivity tests were undertaken to understand the impact of applying greater importance (weight) to each element of sustainability. A total of four sensitivity tests were performed, in which each of the four categories of indicators (environmental, social, economic, system effectiveness) was separately assigned twice the importance (weight) than all other indicators.
Following the data normalisation process, the findings were presented using a series of tables and spiral plots. This helped to illustrate differences in urban public transport sustainability within and between cities, as well as differences across each of the world regions. In the final output tables, all normalised values are adjusted such that high values are good and low values are bad.
4. Results
4.1. World Region Analysis
Appendix B presents a full set of the world region data for each indicator, including the results of normalisation adjustments. Figure 1 illustrates the regional results using spiral plot analysis, including total results and separate results for the environmental, social, economic, and system effectiveness analysis.
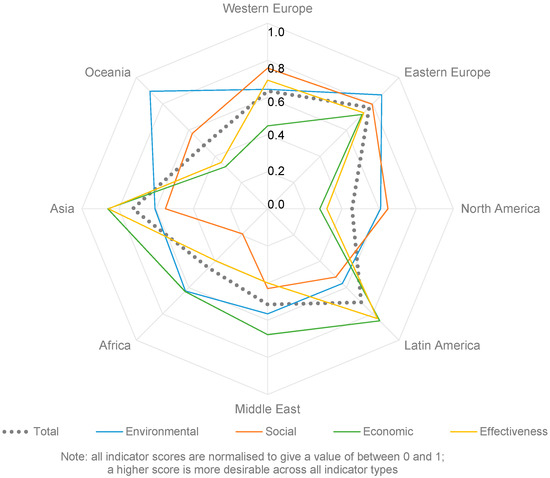
Figure 1.
Public transport sustainability scores by region.
Figure 1 (and Appendix B) illustrate that:
- Eastern Europe, Asia, and Latin America achieve the highest aggregate normalised scores (in that order).
- Eastern Europe has the highest rating results of all regions, which is a result of high scores on all scales, but particularly a first-place rating for social indicators, a second place for environmental, and third place for the others.
- Asia is second ranked because it has a first-place rating for both system effectiveness and economic indicators. It is, however, rated only fifth and sixth out of the eight regions for social and environmental indicators, respectively.
- Latin America is rated third place because it has a second-place rank for system effectiveness and economic indicators, but sixth and seventh place for social and environmental indicators.
- The Middle East, one of the two major regions of focus in this paper, is rated fifth out of the eight regions, including a last-place rating for environmental indicators, second last for social, and a fourth- and fifth-place rating for economic and system effectiveness indicators.
In general, the results suggest that western developed regions (Western Europe, North America, and Oceania) have better performance on environmental and social indicators, but poorer performance on system effectiveness and economic indicators. Asia and Latin America perform the other way round; better on economic and system effectiveness and worse on social and environmental indicators. Eastern Europe is one of the few regions with higher level performance all round.
Since Asia and the Middle East are the focus of this paper, it is worth drilling into the specific component indicators to understand why they rate third and fifth place, respectively:
- Asia rated first place for system effectiveness and economic indicators:
- -
- System effectiveness is first due to top ratings for vehicle occupancy and second-highest ratings for mode split and transit fleet per capita (service level)
- -
- Economic indicators are first due to the highest cost recovery (Asia has a value of 122%, which means fares are profitable relative to operating costs; the only other regions to achieve this are Latin America and the Middle East). Asia also has the second-highest rating of the regions for passenger kilometre per GDP and a high rating for average time cost per trip.
- Asia rated lowest fifth and sixth out of the eight regions for social and environmental indicators respectively:
- -
- Lower environmental ratings resulted because pollution levels and the land consumed were second highest of all regions
- -
- Midrange social ratings resulted from mid of group scores for affordability and travel distance, but a high rate of transit deaths.
- The Middle East rated fifth out of the eight regions including a last-place rating for environmental indicators and a second-last for social indicators:
- -
- Poor environmental performance resulted from the highest rating of pollutants and the highest land area used for transit (20%)
- -
- The Middle East has the second-least affordable systems and midrange values for all other social indicators.
- The Middle East rated a fourth- and fifth-place rating for economic and system effectiveness indicators:
- -
- Although the Middle East had the lowest time cost per trip, other economic indicators were poor, including the cost per passenger kilometre and passenger kilometre per unit GDP
- -
- The Middle East rates fifth or sixth for all system effectiveness measures (i.e., it has low mode share, ridership, occupancy, and service level).
4.2. Selected Asia/Middle East City Analysis
Appendix C presents a full set of the Asia/Middle East city data for each indicator, including the results of normalisation adjustments. Figure 2 illustrates the city-based results using spiral plot analysis, including total results and separate results for the environmental, social, economic, and system effectiveness analysis.
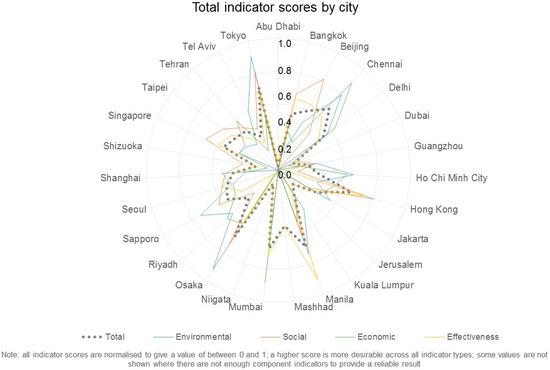
Figure 2.
Public transport sustainability scores by selected Asian/Middle Eastern cities.
Figure 2 (and Appendix C) illustrate that:
- Out of the 26 cities studied, the top 3 cities in terms of sustainable public transport in the Asia and Middle East regions are: 1st, Manila (Philippines); 2nd, Tokyo (Japan); and 3rd, Chennai (India).
- Manila gets its 1st rating as a result of a 1st rating in system effectiveness (it has the highest mode split and the highest service level of all cities in the region). It also rates 6th, 8th, and 9th for environmental, social, and economic indicators.
- Tokyo rates 2nd for sustainable public transport indicators. It has a 2nd-place ranking for social indicators, a 3rd for environmental, and a 4th for system effectiveness. However, it is let down by its economic indicators, which lies 13th out of 26. The latter appears to be because it has the highest time cost per trip (61 min) of all cities analysed. It has midrange values for all other economic indicators.
- Chennai rates 3rd of the cities studied. It rates 2nd out of 26 cities for economic indicators; it has very high passenger kilometres per GDP, the lowest operating cost, and high cost recovery (134%). It also rated 4th out of 26 for environmental indicators and 9th out of 26 for system effectiveness indicators. Its social indicators were midrange.
- Dubai (United Arab Emirates (UAE), rated 26th), Shizuoka (Japan, rated 25th), and Kuala Lumpur (Malaysia, rated 24th) were the lowest-rated cities.
- Dubai has a low rating (between 21st and 24th) for all indicators. Dubai has the highest amount of land taken up by transit facilities (an amazing 37%; this is a very high number which we have checked against the source UITP database and confirmed this is the value given), low system accessibility, and very low usage.
- Shizuoka has poorer performance in some metrics—such as system effectiveness—than Dubai, but is particularly low-rated in economic indicators (it has one of the lowest values of passenger kilometres traveller per GDP).
- Kuala Lumpur rates 15th out of 26 for environmental indicators, mainly because energy consumption and pollutants are midrange in the cities. Other indicators are at the levels of Dubai and Shizuoka (i.e., very poor).
4.3. Sensitivity Tests
This section presents the results of a number of sensitivity tests that were undertaken to understand the impact of applying greater importance (weight) to each element of sustainability. A total of four sensitivity tests were performed, in which each of the four categories of indicators (environmental, social, economic, system effectiveness) were separately assigned twice the importance (weight) than all other indicators. Table 4 presents the results of the sensitivity tests. The “base results”, as detailed in Section 4.1 and Section 4.2, are also shown in Table 4 for comparison purposes.
Table 4.
Sensitivity test results. (Bold = change in rank in sensitivity test vs base results).
The results of the sensitivity tests show only small changes in the ranking of world regions, with Eastern Europe, Asia, and Latin America still ranked as the top three world regions in all cases. However, the Middle East drops to sixth place (from fifth place) when social indicators are considered more important, given its relatively low performance initially on social indicators.
At the city level, there is little change in the lowest-ranked cities (Kuala Lumpur, Shizuoka, Dubai), although Guangzhou is included in the lowest three cities when economic indicators are given higher importance. Considerable variation in the top three ranked cities is observed under each of the sensitivity tests. Osaka is included in the top three cities when environmental, social, and economic indicators are each assigned a high level of importance. Given Chennai’s relatively high performance on economic sustainability initially, this city is ranked first when economic indicators are given more importance.
5. Discussion and Conclusions
This research paper measures the sustainability of urban public transport in cities, using available indicators, with a dual focus on world regions and a separate analysis of cities in the Asian and Middle East region. In this final section, key results are first outlined, a critique and discussion of the results are then presented, and implications of the results for world practice are briefly considered.
The world region analysis shows that Eastern Europe, Asia, and Latin America achieve the highest aggregate normalised scores for sustainable public transport, in that order. Eastern Europe has consistently high indicator scores on all scales, but particularly a first-place rating for social indicators, a second-place for environmental, and third-place for the others. In general, the results suggest that western developed regions (Western Europe, North America, and Oceania) have better performance on environmental and social indicators but poorer performance on system effectiveness and economic indicators. Asia and Latin America perform the other way round; better on economic and system effectiveness and worse on social and environmental indicators. Eastern Europe is one of the few with higher level performance all round.
Asia and the Middle East rated third and fifth place out of the eight regions studied. Asia rated first place for system effectiveness and economic indicators; system effectiveness is first due to top ratings for vehicle occupancy and second-highest ratings for mode split and transit fleet per capita (service level). Economic indicators for Asia are first due to the highest cost recovery (Asia has a value of 122%, which means fares are profitable; the only other regions to achieve this are Latin America and the Middle East). Asia also has the second-highest rating of the regions for passenger kilometre per GDP and a high rating for average time cost per trip.
The Middle East rated fifth out of the eight regions, including a last-place rating for environmental indicators and a second-last for social indicators. Poor environmental performance resulted from the highest rating of pollutants and the highest land area used for transit (20%). The Middle East also has the second-least affordable systems and midrange values for all other social indicators.
There is also much scope to improve the approach used to measure sustainability performance in cities. Perhaps the biggest problem is lack of consistent data. Even the UITP databases had missing data for some indicators. In general terms, 10% of the cities where data were collected included only some of the indicators used in Table 3, so we did not report result for indicator groups for some cities. In addition, in selected cities we had to rely on multiple data sets several years apart to achieve the limited coverage achieved in this paper. In the end, the research outputs are something of a first pass for the likely sustainability performance of public transport in cities and regions, rather than a definitive snapshot in time, which might be updated in later years to understand changes in performance. Concern must also be reasonably noted about the indicators selected; data availability limited the analysis to those identified in Table 3, yet it is reasonable to ask if they fairly represent the categories of environmental, social, economic, and system effectiveness performance. Disability access, for example, is not represented in social indicators. There are no measures of spatial city coverage or temporal coverage during the evening and weekends, yet numerous studies have shown these to be important system effectiveness indicators.
There are also some interesting secondary implications of what the indicators adopted tell us about public transport systems and how sustainability performance measurement might be improved. Asian and South American city regions have been demonstrated to have excellent system effectiveness performance, but to what extent is this the product of their urban form and land use densities, and to what extent does the public transport system itself act to drive higher performance? Can cities in low-density environments enhance system effectiveness, or is sustainability effectiveness only achievable in certain high-density cities? This raises a new question: Should the indicators be adjusted to show what is achievable given an urban (and environmental) context? If yes, how? Can and should adjustments also apply to other sustainability indicator groups? For example, the energy performance of public transport in tropical equatorial or wintery polar regions will naturally vary from more temperate regions of the earth due to needs for cooling and heating to maintain a “reasonable” environment for the transport of human beings. Advocates promoting the development of public transport in cities might also voice concern over the use of cost recovery (C4) as an indicator of economic sustainability performance. Numerous studies have now demonstrated the strong economic benefits of financial subsidies applied to urban public transport, but these are not considered in the framework developed. So, overall, there are many questions raised by the indicator framework first developed in this research.
Despite these clear limitations, there is much value that can be derived from a framework where sustainability performance is quantified. The results present some clear indications of where to better target improvements in sustainability performance for the public transport systems that were assessed. In general, western developed regions, notably North America and Oceania, should target improvements in economic and system effectiveness. This is not by any means news to agencies in these regions, since the provision of public subsidies in difficult economic times has been a major constraint on system development. Low service levels and poor ridership performance are also common concerns in these regions, so to some extent the results on system effectiveness make sense in this context. So, if the findings are not new, why adopt measures of this kind? One obvious retort is that it is always of value to understand where a city lies in its relative performance to others. While subsidies and low service effectiveness are major concerns of these regions, the links these issues imply for world sustainability are almost never articulated, yet they are as valid as the environmental and social sustainability issues, which are more commonly associated with urban sustainability.
Results also suggest that Western Europe needs to improve economic performance, which has long been a priority for EU transit policies, which have stressed greater private sector involvement in market development and cost management and, more recently, policies re-emphasising a focus on the (transit) customer experience. As an aside, these observations raise a new question: How is the regulatory performance of public- vs private-based agency involvement in public transport acting to influence sustainability outcomes?
Meanwhile, the results suggest that Asia and Latin America need to improve environmental and social sustainability performance. Pollution is a major urban concern in these regions, so results are perhaps (again) no surprise. Public transport has much potential to act as a catalyst to improve both the social and environmental performance of cities in these regions, yet it needs to be effective within the context of peer public transport systems to achieve these aims. The results demonstrate much scope to improve performance in this context, and perhaps act to emphasise a need to target these issues for future policy.
It is interesting that Eastern Europe seems to be the best-performing world region in the results. This is perhaps something of a surprise, but might be explained by its political and social history where social issues were an ideological priority and car dependence was low. So, is there an ideological facet to the sustainability performance of urban public transport? If yes, how can capitalist or commercially founded economies be restructured to improve sustainability performance?
The results also suggest that the Middle East needs to address its sustainability performance in all areas, notably in cities such as Dubai. However, there are lessons in the results for all cities, including those with better performance, since no city performed best on all indicators.
This paper, although limited by data constraints, has provided useful insights into the sustainability performance of public transport systems in world regions and, in particular, the Asian/Middle Eastern cities. The results help to highlight specific areas that can be targeted to improve public transport sustainability in each of the regions and selected cities. They also aid in understanding the public transport sustainability performance of various cities relative to others. It will be interesting to see how sustainability performance improves into the future. Will the 2030 sustainability target suggested by the United Nations [1] be achieved? Repeating this analysis after 2030 will provide a useful means of assessing progress into the future.
Acknowledgments
The authors would like to express their sincere thanks to the anonymous reviewers for their constructive comments on an earlier version of this manuscript.
Author Contributions
Chris De Gruyter undertook the data analysis and wrote selected parts of the paper. Graham Currie provided an interpretation of the results and wrote the majority of the paper. Geoff Rose contributed to the literature review reported in the paper.
Conflicts of Interest
The authors declare no conflict of interest.
Appendix A
Table A1.
Full List of Cities by World Region.
| World Region | Cities |
|---|---|
| Western Europe | Amsterdam, Athens, Barcelona, Berlin, Berne, Birmingham, Bologna, Brussels, Copenhagen, Dublin, Dusseldorf, Frankfurt, Geneva, Glasgow, Gothenburg, Graz, Hamburg, Helsinki, Lille, Lisbon, London, Lyon, Madrid, Manchester, Marseille, Milan, Munich, Nantes, Newcastle, Oslo, Paris, Rome, Ruhr, Stockholm, Strasbourg, Stuttgart, Turin, Vienna, Zurich |
| Eastern Europe | Ankara, Budapest, Cracow, Istanbul, Izmir, Kocaeli, Moscow, Prague, Tallinn, Warsaw |
| North America | Atlanta, Calgary, Chicago, Denver, Houston, Los Angeles, Montreal, New York, Ottawa, Phoenix, Portland, San Diego, San Francisco, Toronto, Vancouver, Washington |
| Latin America | Bogota, Brasilia, Buenos Aires, Caracas, Curitiba, Mexico City, Rio de Janeiro, Salvador, Santiago, Sao Paulo |
| Middle East | Abu Dhabi, Dubai, Jerusalem, Mashhad, Riyadh, Tehran, Tel Aviv |
| Africa | Abidjan, Addis Ababa, Cairo, Cape Town, Casablanca, Dakar, Harare, Johannesburg, Lagos, Nairobi, Tshwane, Tunis |
| Asia | Bangkok, Beijing, Chennai, Delhi, Guangzhou, Ho Chi Minh City, Hong Kong, Jakarta, Kuala Lumpur, Manila, Mumbai, Osaka, Sapporo, Seoul, Shanghai, Shizuoka, Singapore, Taipei, Tokyo |
| Oceania | Brisbane, Melbourne, Perth, Sydney, Wellington |
Appendix B. Data Results for the World Region Analysis of Public Transport Sustainability
Table B1.
Raw indicators by world region.
| ID | Indicator | Units | Western Europe | Eastern Europe | North America | Latin America | Middle East | Africa | Asia | Oceania |
|---|---|---|---|---|---|---|---|---|---|---|
| A | Environmental | |||||||||
| A1 | Quantity of energy consumed | MJ/pkm | 14.67 | 11.77 | 24.86 | 15.41 | 12.20 | 14.48 | 12.59 | 14.88 |
| A3 | Mass of total pollutants emitted (e.g., NOx, VOC, CO2) | kg/ha | 5298 | 4543 | 3905 | 7368 | 15,044 | 6591 | 10,115 | 2749 |
| A5 | Land area consumed by public transport facilities | % of urban area | 18 | 11 | 17 | - | 20 | 17 | 18 | - |
| B | Social | |||||||||
| B1 | System accessibility | pkm/capita | 2134 | 2119 | 763 | 2556 | 815 | 168 | 2615 | 938 |
| B4 | Average user trip distance | km | 10.13 | 7.27 | 11.97 | 11.80 | 9.52 | 20.50 | 11.66 | 16.00 |
| B5 | Affordability | 10−4 per capita GDP/trip | 30.31 | 23.92 | 33.16 | 77.04 | 89.90 | 161.89 | 74.34 | 49.51 |
| B9 | Public transport related deaths | fatalities/billion-pkm | 9.61 | 18.07 | 7.01 | 38.93 | 18.03 | 34.35 | 26.66 | 6.81 |
| C | Economic | |||||||||
| C1 | Annual operating cost | $US/pkm | 0.28 | 0.04 | 0.29 | 0.05 | 0.10 | 0.04 | 0.05 | 0.19 |
| C4 | Cost recovery (proportion of costs recovered) | % of total costs | 59.2 | 58.2 | 41.9 | 115.6 | 108.2 | 95.6 | 122.6 | 52.7 |
| C6 | Passenger km travelled per unit GDP | pkm/$US | 0.05 | 0.06 | 0.01 | 0.13 | 0.06 | 0.01 | 0.13 | 0.02 |
| C8 | Average time per trip | min | 36 | 29 | 52 | 42 | 28 | 45 | 43 | 57 |
| D | System effectiveness | |||||||||
| D1 | Average occupancy rate of passenger vehicles | % of seated capacity | 19.77 | 30.35 | 15.62 | 24.10 | 19.58 | 26.53 | 39.97 | 16.95 |
| D3 | Annual public transport trips per capita | trips/capita | 345 | 319 | 105 | 256 | 106 | 46 | 255 | 94 |
| D4 | Public transport mode split | % of all trips | 23.69 | 21.57 | 8.88 | 41.82 | 10.06 | 25.36 | 28.30 | 6.60 |
| D5 | Public transport fleet size | vehicles/million people | 1313.9 | 1346.1 | 684.6 | 1850.7 | 1030.2 | 328.7 | 1758.4 | 1035.7 |
| E | Other | |||||||||
| E1 | Population of metropolitan area | persons | 2,736,120 | 3,108,727 | 4,040,400 | - | 3,060,600 | 7,398,800 | 13,713,540 | 3,916,667 |
| E2 | Urban population density | persons/ha | 55.7 | 47.2 | 22.3 | 89.7 | 69.7 | 101.7 | 155.0 | 12.8 |
| E3 | Metropolitan Gross Domestic Product (GDP) | $US/capita | 43,576 | 38,081 | 58,685 | 19,773 | 28,410 | 11,893 | 28,907 | 48,586 |
Table B2.
Normalised indicators by world region.
| ID | Indicator | Units | Western Europe | Eastern Europe | North America | Latin America | Middle East | Africa | Asia | Oceania |
|---|---|---|---|---|---|---|---|---|---|---|
| A | Environmental | |||||||||
| A1 | Quantity of energy consumed | MJ/pkm | 0.802 | 1.000 | 0.473 | 0.764 | 0.964 | 0.813 | 0.935 | 0.791 |
| A3 | Mass of total pollutants emitted (e.g., NOx, VOC, CO2) | kg/ha | 0.519 | 0.605 | 0.704 | 0.373 | 0.183 | 0.417 | 0.272 | 1.000 |
| A5 | Land area consumed by public transport facilities | % of urban area | 0.611 | 1.000 | 0.647 | 0.550 | 0.647 | 0.611 | ||
| B | Social | |||||||||
| B1 | System accessibility | pkm/capita | 0.816 | 0.810 | 0.292 | 0.978 | 0.312 | 0.064 | 1.000 | 0.359 |
| B4 | Average user trip distance | km | 0.718 | 1.000 | 0.607 | 0.616 | 0.764 | 0.355 | 0.623 | 0.454 |
| B5 | Affordability | 10−4 per capita GDP/trip | 0.789 | 1.000 | 0.721 | 0.310 | 0.266 | 0.148 | 0.322 | 0.483 |
| B9 | Public transport related deaths | fatalities/billion-pkm | 0.709 | 0.377 | 0.971 | 0.175 | 0.378 | 0.198 | 0.255 | 1.000 |
| C | Economic | |||||||||
| C1 | Annual operating cost | $US/pkm | 0.143 | 1.000 | 0.138 | 0.800 | 0.387 | 1.000 | 0.817 | 0.211 |
| C4 | Cost recovery (proportion of costs recovered) | % of total costs | 0.483 | 0.475 | 0.342 | 0.943 | 0.883 | 0.780 | 1.000 | 0.430 |
| C6 | Passenger km travelled per unit GDP | pkm/$US | 0.379 | 0.430 | 0.101 | 1.000 | 0.441 | 0.109 | 0.970 | 0.149 |
| C8 | Average time per trip | min | 0.783 | 0.972 | 0.542 | 0.671 | 1.000 | 0.627 | 0.655 | 0.495 |
| D | System effectiveness | |||||||||
| D1 | Average occupancy rate of passenger vehicles | % of seated capacity | 0.495 | 0.759 | 0.391 | 0.603 | 0.490 | 0.664 | 1.000 | 0.424 |
| D3 | Annual public transport trips per capita | trips/capita | 1.000 | 0.925 | 0.304 | 0.742 | 0.308 | 0.133 | 0.769 | 0.272 |
| D4 | Public transport mode split | % of all trips | 0.566 | 0.516 | 0.212 | 1.000 | 0.241 | 0.606 | 0.705 | 0.158 |
| D5 | Public transport fleet size | vehicles/million people | 0.710 | 0.727 | 0.370 | 1.000 | 0.557 | 0.178 | 0.950 | 0.560 |
| ID | Indicator category | |||||||||
| A | Environmental | 0.644 | 0.868 | 0.608 | 0.568 | 0.566 | 0.626 | 0.606 | 0.895 | |
| B | Social | 0.758 | 0.797 | 0.648 | 0.520 | 0.430 | 0.191 | 0.550 | 0.574 | |
| C | Economic | 0.447 | 0.719 | 0.281 | 0.854 | 0.678 | 0.629 | 0.861 | 0.321 | |
| D | System effectiveness | 0.693 | 0.732 | 0.319 | 0.836 | 0.399 | 0.395 | 0.856 | 0.353 | |
| Total | 0.635 | 0.773 | 0.454 | 0.713 | 0.515 | 0.449 | 0.726 | 0.485 |
Appendix C. Data Results for the City Analysis of Public Transport Sustainability
Table C1.
Raw indicators by city.
| ID | Abu Dhabi | Bangkok | Beijing | Chennai | Delhi | Dubai | Guangzhou | Ho Chi Minh City | Hong Kong | Jakarta | Jerusalem | Kuala Lumpur | Manila |
| A | |||||||||||||
| A1 | - | 32.19 | 9.91 | 9.94 | - | - | 13.19 | 5.72 | 16.12 | 7.78 | - | 12.75 | 4.87 |
| A3 | - | 21,515 | 9919 | 2084 | 3933 | - | 14,137 | 24,231 | 7602 | 14,558 | - | 7889 | 19,477 |
| A5 | 5 | - | 10 | - | - | 37 | - | - | - | - | 18 | - | - |
| B | |||||||||||||
| B1 | 128 | 2,799 | 2692 | 3025 | - | 789 | 1127 | 101 | 4606 | 1,389 | - | 726 | 1417 |
| B4 | 4.60 | 6.89 | 10.85 | 15.69 | 16.90 | - | 9.46 | 9.73 | 12.30 | 8.17 | 5.90 | 10.13 | 3.22 |
| B5 | - | 20.43 | 15.12 | 201.17 | - | - | 57.62 | 287.19 | 29.17 | 109.17 | - | 92.29 | 85.06 |
| B9 | - | 24.15 | 7.49 | 14.29 | - | - | 51.90 | 79.03 | 7.64 | 73.19 | - | 42.05 | 19.30 |
| C | |||||||||||||
| C1 | - | 0.02 | 0.01 | 0.00 | - | - | 0.06 | 0.01 | 0.08 | 0.02 | - | 0.06 | 0.02 |
| C4 | - | 90.0 | 21.8 | 134.2 | - | - | 26.2 | 317.1 | 136.2 | 118.3 | - | 83.7 | 219.8 |
| C6 | 0.00 | 0.14 | 0.12 | 0.47 | - | 0.03 | 0.04 | 0.01 | 0.08 | 0.14 | - | 0.03 | 0.10 |
| C8 | 17 | 49 | 51 | 50 | 40 | - | 47 | 31 | 43 | 39 | 24 | 43 | 45 |
| D | |||||||||||||
| D1 | - | 25.21 | 75.94 | 71.19 | - | - | 23.55 | 9.72 | 25.21 | 13.19 | - | 22.92 | 3.37 |
| D3 | 30 | 402 | 352 | 193 | 135 | 83 | 120 | 11 | 564 | 172 | - | 73 | 438 |
| D4 | 4.90 | 42.72 | 27.85 | 42.28 | 21.50 | 10.90 | 14.20 | 1.67 | 52.20 | 25.50 | 15.30 | 7.23 | 59.04 |
| D5 | - | 1,890.4 | 1248.3 | 539.8 | 443.9 | 790.2 | 736.9 | 671.8 | 1950.3 | 2044.6 | 1637.2 | 428.5 | 13,375.4 |
| E | |||||||||||||
| E1 | 913,000 | - | 20,693,000 | - | 16,753,000 | 2,003,000 | - | - | 7,071,000 | - | 1,130,000 | - | - |
| E2 | 5.3 | 138.7 | 164.0 | 133.2 | 238.7 | 19.6 | 119.0 | 355.7 | 255.2 | 173.4 | 88.3 | 57.9 | 206.4 |
| E3 | 61,009 | 19,705 | 23,390 | 6469 | 12,747 | 24,866 | 29,014 | 8660 | 57,244 | 9984 | 32,819 | 28,076 | 14,222 |
| ID | Mashhad | Mumbai | Osaka | Riyadh | Sapporo | Seoul | Shanghai | Shizuoka | Singapore | Taipei | Tehran | Tel Aviv | Tokyo |
| A | |||||||||||||
| A1 | - | 9.90 | 11.38 | 7.24 | 19.14 | 12.30 | 8.78 | - | 15.67 | 12.99 | 14.01 | 15.36 | 11.35 |
| A3 | - | 10,750 | 1454 | 16,664 | 1757 | 7541 | 11,703 | - | 7172 | 14,864 | 25,468 | 3001 | 1484 |
| A5 | - | - | - | - | - | 29 | - | - | 16 | 17 | - | - | - |
| B | |||||||||||||
| B1 | - | 3,312 | 6011 | 107 | 1789 | 2781 | 1872 | 1303 | 2659 | 3772 | 1648 | 1402 | 5684 |
| B4 | - | 17.08 | 21.02 | 10.35 | 9.20 | 7.60 | 10.77 | - | 10.00 | 9.28 | 12.90 | 13.84 | 21.60 |
| B5 | - | 64.15 | 71.01 | 130.85 | 56.19 | 41.30 | 30.62 | - | 24.25 | 30.95 | 43.54 | 95.32 | 48.05 |
| B9 | - | 23.71 | 6.69 | 15.22 | 7.20 | 23.05 | 30.62 | - | 10.01 | 27.61 | 27.97 | 10.89 | 5.37 |
| C | |||||||||||||
| C1 | - | 0.00 | 0.08 | 0.04 | 0.24 | 0.05 | 0.01 | - | 0.06 | 0.04 | 0.02 | 0.25 | 0.07 |
| C4 | - | 84.5 | 172.6 | 209.6 | 94.1 | 86.3 | 74.3 | - | 113.8 | 135.0 | 74.2 | 40.8 | 175.8 |
| C6 | - | 0.47 | 0.17 | 0.00 | 0.06 | 0.08 | 0.08 | 0.03 | 0.04 | 0.08 | 0.21 | 0.03 | 0.13 |
| C8 | - | 36 | 27 | 17 | 22 | 36 | 60 | - | 50 | 45 | 32 | 51 | 61 |
| D | |||||||||||||
| D1 | - | 129.27 | 56.77 | 6.35 | 30.23 | 25.94 | 60.10 | - | 28.59 | 20.02 | 24.16 | 28.22 | 58.29 |
| D3 | 191 | 194 | 285 | 10 | 192 | 307 | 175 | 73 | 422 | 458 | 221 | 102 | 477 |
| D4 | - | 45.00 | 32.13 | 1.27 | 20.48 | 36.90 | 15.10 | 7.70 | 44.00 | 32.00 | 12.70 | 15.31 | 33.00 |
| D5 | - | 349.7 | 951.1 | 466.3 | 1018.5 | 1122.3 | 738.0 | - | 868.6 | 1904.4 | 1088.7 | 1168.4 | 1368.9 |
| E | |||||||||||||
| E1 | 2,857,000 | 20,748,395 | - | - | - | 24,734,000 | - | 1,101,000 | 5,312,000 | 2,673,000 | 8,400,000 | - | 37,239,000 |
| E2 | 122.6 | 337.4 | 98.1 | 44.0 | 72.1 | 125.5 | 196.3 | 17.8 | 104.6 | 205.7 | 136.0 | 72.3 | 87.7 |
| E3 | 7711 | 7005 | 35,902 | 22,139 | 32,446 | 34,355 | 24,065 | 41,472 | 66,864 | 46,102 | 7711 | 42,614 | 43,664 |
Table C2.
Normalised indicators by city.
| ID | Abu Dhabi | Bangkok | Beijing | Chennai | Delhi | Dubai | Guangzhou | Ho Chi Minh City | Hong Kong | Jakarta | Jerusalem | Kuala Lumpur | Manila |
| A | |||||||||||||
| A1 | 0.151 | 0.491 | 0.490 | 0.369 | 0.851 | 0.302 | 0.626 | 0.382 | 1.000 | ||||
| A3 | 0.068 | 0.147 | 0.698 | 0.370 | 0.103 | 0.060 | 0.191 | 0.100 | 0.184 | 0.075 | |||
| A5 | 1.000 | 0.500 | 0.135 | 0.278 | |||||||||
| B | |||||||||||||
| B1 | 0.021 | 0.466 | 0.448 | 0.503 | 0.131 | 0.188 | 0.017 | 0.766 | 0.231 | 0.121 | 0.236 | ||
| B4 | 0.700 | 0.467 | 0.297 | 0.205 | 0.191 | 0.340 | 0.331 | 0.262 | 0.394 | 0.546 | 0.318 | 1.000 | |
| B5 | 0.740 | 1.000 | 0.075 | 0.262 | 0.053 | 0.518 | 0.138 | 0.164 | 0.178 | ||||
| B9 | 0.222 | 0.717 | 0.376 | 0.103 | 0.068 | 0.703 | 0.073 | 0.128 | 0.278 | ||||
| C | |||||||||||||
| C1 | 0.050 | 0.100 | 1.000 | 0.017 | 0.100 | 0.013 | 0.050 | 0.017 | 0.050 | ||||
| C4 | 0.284 | 0.069 | 0.423 | 0.083 | 1.000 | 0.430 | 0.373 | 0.264 | 0.693 | ||||
| C6 | 0.004 | 0.300 | 0.243 | 0.989 | 0.067 | 0.082 | 0.025 | 0.170 | 0.294 | 0.055 | 0.211 | ||
| C8 | 1.000 | 0.347 | 0.333 | 0.340 | 0.425 | 0.362 | 0.548 | 0.395 | 0.436 | 0.708 | 0.395 | 0.378 | |
| D | |||||||||||||
| D1 | 0.195 | 0.587 | 0.551 | 0.182 | 0.075 | 0.195 | 0.102 | 0.177 | 0.026 | ||||
| D3 | 0.053 | 0.713 | 0.624 | 0.342 | 0.239 | 0.147 | 0.213 | 0.020 | 1.000 | 0.305 | 0.129 | 0.777 | |
| D4 | 0.083 | 0.724 | 0.472 | 0.716 | 0.364 | 0.185 | 0.241 | 0.028 | 0.884 | 0.432 | 0.259 | 0.122 | 1.000 |
| D5 | 0.141 | 0.093 | 0.040 | 0.033 | 0.059 | 0.055 | 0.050 | 0.146 | 0.153 | 0.122 | 0.032 | 1.000 | |
| ID | |||||||||||||
| A | 1.000 | 0.109 | 0.379 | 0.594 | 0.370 | 0.135 | 0.236 | 0.456 | 0.247 | 0.363 | 0.278 | 0.283 | 0.537 |
| B | 0.361 | 0.474 | 0.615 | 0.290 | 0.191 | 0.131 | 0.223 | 0.117 | 0.562 | 0.209 | 0.546 | 0.183 | 0.423 |
| C | 0.502 | 0.245 | 0.186 | 0.688 | 0.425 | 0.067 | 0.136 | 0.418 | 0.252 | 0.288 | 0.708 | 0.183 | 0.333 |
| D | 0.068 | 0.443 | 0.444 | 0.412 | 0.212 | 0.130 | 0.173 | 0.043 | 0.556 | 0.248 | 0.191 | 0.115 | 0.701 |
| Total | 0.409 | 0.348 | 0.408 | 0.482 | 0.270 | 0.121 | 0.186 | 0.230 | 0.427 | 0.265 | 0.383 | 0.178 | 0.493 |
| ID | Mashhad | Mumbai | Osaka | Riyadh | Sapporo | Seoul | Shanghai | Shizuoka | Singapore | Taipei | Tehran | Tel Aviv | Tokyo |
| A | |||||||||||||
| A1 | 0.492 | 0.428 | 0.673 | 0.254 | 0.396 | 0.555 | 0.311 | 0.375 | 0.348 | 0.317 | 0.429 | ||
| A3 | 0.135 | 1.000 | 0.087 | 0.828 | 0.193 | 0.124 | 0.203 | 0.098 | 0.057 | 0.485 | 0.980 | ||
| A5 | 0.172 | 0.313 | 0.294 | ||||||||||
| B | |||||||||||||
| B1 | 0.551 | 1.000 | 0.018 | 0.298 | 0.463 | 0.311 | 0.217 | 0.442 | 0.628 | 0.274 | 0.233 | 0.946 | |
| B4 | 0.189 | 0.153 | 0.311 | 0.350 | 0.424 | 0.299 | 0.322 | 0.347 | 0.250 | 0.233 | 0.149 | ||
| B5 | 0.236 | 0.213 | 0.116 | 0.269 | 0.366 | 0.494 | 0.624 | 0.489 | 0.347 | 0.159 | 0.315 | ||
| B9 | 0.226 | 0.803 | 0.353 | 0.746 | 0.233 | 0.175 | 0.536 | 0.194 | 0.192 | 0.493 | 1.000 | ||
| C | |||||||||||||
| C1 | 1.000 | 0.013 | 0.025 | 0.004 | 0.020 | 0.100 | 0.017 | 0.025 | 0.050 | 0.004 | 0.014 | ||
| C4 | 0.266 | 0.544 | 0.661 | 0.297 | 0.272 | 0.234 | 0.359 | 0.426 | 0.234 | 0.129 | 0.554 | ||
| C6 | 1.000 | 0.354 | 0.010 | 0.117 | 0.171 | 0.165 | 0.066 | 0.084 | 0.173 | 0.452 | 0.070 | 0.275 | |
| C8 | 0.472 | 0.630 | 1.000 | 0.773 | 0.472 | 0.283 | 0.340 | 0.378 | 0.531 | 0.333 | 0.279 | ||
| D | |||||||||||||
| D1 | 1.000 | 0.439 | 0.049 | 0.234 | 0.201 | 0.465 | 0.221 | 0.155 | 0.187 | 0.218 | 0.451 | ||
| D3 | 0.339 | 0.344 | 0.505 | 0.018 | 0.340 | 0.544 | 0.310 | 0.129 | 0.748 | 0.812 | 0.392 | 0.181 | 0.846 |
| D4 | 0.762 | 0.544 | 0.022 | 0.347 | 0.625 | 0.256 | 0.130 | 0.745 | 0.542 | 0.215 | 0.259 | 0.559 | |
| D5 | 0.026 | 0.071 | 0.035 | 0.076 | 0.084 | 0.055 | 0.065 | 0.142 | 0.081 | 0.087 | 0.102 | ||
| ID | |||||||||||||
| A | 0.314 | 0.714 | 0.380 | 0.541 | 0.254 | 0.339 | 0.275 | 0.256 | 0.202 | 0.401 | 0.705 | ||
| B | 0.300 | 0.542 | 0.199 | 0.416 | 0.371 | 0.320 | 0.217 | 0.481 | 0.414 | 0.266 | 0.279 | 0.602 | |
| C | 0.685 | 0.385 | 0.424 | 0.298 | 0.234 | 0.196 | 0.066 | 0.200 | 0.250 | 0.317 | 0.134 | 0.281 | |
| D | 0.339 | 0.533 | 0.390 | 0.031 | 0.249 | 0.363 | 0.272 | 0.130 | 0.445 | 0.413 | 0.219 | 0.186 | 0.489 |
| Total | 0.339 | 0.479 | 0.478 | 0.241 | 0.352 | 0.309 | 0.273 | 0.136 | 0.355 | 0.338 | 0.258 | 0.229 | 0.493 |
References
- United Nations. Transforming our World: The 2030 Agenda for Sustainable Development; Department of Economic and Social Affairs, United Nations: New York, NY, USA, 2015. [Google Scholar]
- Brundtland Commission. Our Common Future; World Commission on Environment and Development, Ed.; Oxford University Press: London, UK, 1987. [Google Scholar]
- Rockström, J.; Steffen, W.; Noone, K.; Persson, A.; Chapin, F.; Lambin, E.; Lenton, T.; Scheffer, M.; Folke, C.; Schellnhuber, H.; et al. A safe operating space for humanity. Nature 2009, 461, 472–475. [Google Scholar] [CrossRef] [PubMed]
- Griggs, D.; Stafford-Smith, M.; Gaffney, O.; Rockström, J.; Öhman, M.; Shyamsundar, P.; Steffen, W.; Glaser, G.; Kanie, N.; Noble, I. Sustainable development goals for people and planet. Nature 2013, 495, 305–307. [Google Scholar] [CrossRef] [PubMed]
- Loo, B.P.Y.; Banister, D. Decoupling transport from economic growth: Extending the debate to include environmental and social externalities. J. Transp. Geogr. 2016, 57, 134–144. [Google Scholar] [CrossRef]
- Currie, G. New Perspectives and Methods in Transport and Social Exclusion Research; Emerald Group Publishing Limited: Bingley, UK, 2011. [Google Scholar]
- Haghshenas, H.; Vaziri, M. Urban sustainable transportation indicators for global comparison. Ecol. Indic. 2012, 15, 115–121. [Google Scholar] [CrossRef]
- Litman, T. Sustainable Transportation Indicators: A Recommended Research Program for Developing Sustainable Transportation Indicators and Data. In Proceedings of the 88th Transportation Research Board (TRB) Annual Meeting, Washington, DC, USA, 1–15 January 2009.
- Jeon, C.M.; Amekudzi, A.; Guensler, R.L. Evaluating Plan Alternatives for Transportation System Sustainability: Altanta Metropolitan Region. Int. J. Sustain. Transp. 2010, 4, 227–247. [Google Scholar] [CrossRef]
- Barford, M.B.; Salling, K.B. A new composite decision support framework for strategic and sustainable transport appraisals. Transp. Res. Part A 2015, 72, 1–15. [Google Scholar]
- Castillo, H.; Pitfield, D. ELASTIC—A methodological framework for identifying and selecting sustainable transport indicators. Transp. Res. Part D 2010, 15, 179–188. [Google Scholar] [CrossRef]
- Jeon, C.M. Incorporating Sustainability into Transportation Planning and Decision Making: Definitions, Performance Measures, and Evaluation, in School of Civil and Environmental Engineering. Ph.D. Thesis, Georgia Institute of Technology, Atlanta, GA, USA, 2007. [Google Scholar]
- Dobranskyte-Niskota, A.; Perujo, A.; Pregl, A. Indicators to Assess Sustainability of Transport Activities, Part 1: Review of the Existing Transport Sustainability Indicators Initiatives and Development of an Indicator Set to Assess Transport Sustainability Performance; European Commission—DG Joint Research Centre Institute for Environment and Sustainability: Ispra, Italy, 2007. [Google Scholar]
- Dobranskyte-Niskota, A.; Perujo, A.; Pregl, A. Indicators to Assess Sustainability of Transport Activities, Part 2: Measurement and Evaluation of Transport Sustainability Performance in the EU27; European Commission—DG Joint Research Centre Institute for Environment and Sustainability: Ispra, Italy, 2009. [Google Scholar]
- Litman, T. Developing Indicators for Comprehensive and Sustainable Transport Planning; Victoria Transport Policy Institute (VTPI): Victoria, BC, Canada, 2011. [Google Scholar]
- Miller, P.; de Barros, A.G.; Kattan, L.; Wirasinghe, S.C. Analyzing the sustainability performance of public transit. Transp. Res. Part D 2016, 44, 177–198. [Google Scholar] [CrossRef]
- Miller, P. Sustainability and Public Transportation: Theory and Analysis; Department of Civil Engineering, University of Calgary: Calgary, AB, Canada, 2014. [Google Scholar]
- World Council on City Data (WCCD). World Council on City Data Open Data Portal; World Council on City Data: Toronto, ON, Canada, 2016. [Google Scholar]
- The World Bank. World DataBank; The World Bank: Washington, DC, USA, 2016. [Google Scholar]
- Organisation for Economic Co-Operation and Development (OECD). OECD.Stat; Organisation for Economic Co-operation and Development: Paris, France, 2016. [Google Scholar]
- Union Internationale des Transports Publies (UITP). Millenium Cities Database for Sustainable Mobility; International Association of Public Transport: Brussels, Belgique, 2001. [Google Scholar]
- Union Internationale des Transports Publies (UITP). Mobility in Cities Database 2015; International Association of Public Transport: Brussels, Belgique, 2015. [Google Scholar]
- The Brookings Institution. Global Metro Monitor 2014: An Uncertain Recovery; The Brookings Institution: Washington, DC, USA, 2016. [Google Scholar]
- Currie, G.; Delbosc, A. Variation in Perceptions of Urban Public Transport Performance between International Cities Using Spiral Plot Analysis. Transp. Res. Record J. Transp. Res. Board 2015, 2538, 54–64. [Google Scholar] [CrossRef]
© 2016 by the authors; licensee MDPI, Basel, Switzerland. This article is an open access article distributed under the terms and conditions of the Creative Commons Attribution (CC-BY) license (http://creativecommons.org/licenses/by/4.0/).