Abstract
We study how the information and communications technology (ICT) ecosystem affects the sustainable growth of ICT firms. For our study, we analyze the efficiencies of ICT firms in China, South Korea, the United States, and Japan, which are the current leaders in the global ICT industry, each with different ICT ecosystem structures. We use metafrontier analysis (MFA) to compare the efficiencies among countries with different structures, and then use Tobit regression to identify the causes of the efficiency gaps. Our results reveal that the US has the highest efficiency, followed by Japan, South Korea, and China, in that order, and the countries with more balanced ICT ecosystems across sub-industries—manufacturing, software and IT services, content, and telecommunications—have more efficient ICT industries. This suggests that a more balanced industrial development is important to enhancing the overall competitiveness of the ICT industry.
1. Introduction
Apple’s iPhone changed people’s expectations of mobile devices and the way firms compete in the information and communications technology (ICT) industry. While it was not the first smartphone introduced to the market, the iPhone was the first smartphone to deeply affect people’s lives with its easy to use and expandable functions and its reliable and seamless internet access. The reason Apple was so successful was because it delivered a holistic user experience, capitalizing on its own hardware and software capabilities that allowed for an integrated design and an ecological collaboration (e.g., with telecommunication companies to support voice and data network access, as well as with third-party developers to secure a variety of software applications and content) that enabled destructive innovation. The iPhone’s success made many firms recognize the importance of understanding consumers and creating an entire ICT ecosystem to win in the market.
However, it would be inefficient for a single firm to internally build all of the necessary capabilities to compete in the rapidly changing ICT market. Therefore, it may also be crucial to develop a well-balanced ICT ecosystem at a national level that facilitates open innovation and collaboration among firms with different strengths and weaknesses. Indeed, like Apple, firms tend to focus on their core competencies, taking advantage of various strategies, such as mergers and acquisitions (M and A), strategic alliances, and collaborative R and D, so as to quickly respond to the demand of the market [1]. Additionally, as ICTs converge on the internet, researchers have suggested the ecosystem approach for the ICT industry and emphasized the interoperability among different players in the ecosystem as a key driver of innovation [2,3,4,5]. Fransman [3,4] claims that the widespread use of the internet has reshaped the ICT ecosystem into an evolving innovation system made up of four layers (ICT equipment providers; network operators; platform, content and applications providers; and final consumer-users), and that innovation occurs through symbiotic interactions between the four layers within their environment. The author further argues that national systems can affect the relative performances of firms. Bauer [6] addresses the idea that convergence is not technology-driven but instead co-evolutionary with technology changes involving market and policy decisions.
However, to our knowledge, little empirical work has been conducted regarding the ICT ecosystem’s impact on the ICT industry’s performance. In this paper, we evaluate how the ICT ecosystem structure affects the performance of firms and provide policy implications for the sustainable growth of ICT firms based on the results. Specifically, we measure the efficiencies of ICT firms in four countries, the United States (US), China, South Korea, and Japan, which are major players in the global ICT industry with different paths of growth, thereby having different ICT ecosystem structures. We investigate the connection between the structures of the ICT ecosystems and the efficiency levels of firms. The data used in this study are obtained from the ThomsonONE database [7] and the efficiency is estimated based on stochastic frontier analysis (SFA) and metafrontier analysis (MFA). While SFA is commonly used to estimate efficiency levels, it is limited in that the results obtained by SFA can only be compared among firms with the same production function. Thus, to compare the efficiencies of the firms across countries, we use MFA, which allows for comparisons across different groups with different technologies. In addition, we perform Tobit regression to examine if the ICT ecosystem structures affect the firms’ efficiency levels.
Our results show that the US with the most balanced ICT ecosystem has the highest efficiency, followed by Japan, South Korea, and China, in that order. Tobit regression results provide an empirical evidence that the more balanced ICT ecosystems across sub-industries—content, software, telecommunications, and manufacturing—are attributed to higher efficiency. This suggests that policy-makers should take a more holistic approach to improving the ICT industry’s overall competitiveness.
2. Methodology
We first use SFA and MFA to measure the efficiencies of firms. Then we conduct Tobit regression to identify the linkage between the structures of the ICT ecosystems and the efficiencies of firms. Details of our methodologies are explained in Section 2.1 and Section 2.2.
2.1. Measuring Efficiency
In the literature, SFA and data envelope analysis (DEA) are commonly used to measure the efficiency of firms (e.g., [8,9,10,11,12,13]). However, both SFA and DEA are limited in that the efficiencies obtained from using them can only be compared among groups with the same production function. In addition, given that DEA does not assume a production function or an error term, stochastic errors arise from estimation of the inefficiency term, thereby overestimating the inefficiency. Thus, in this paper, we use SFA to estimate the efficiencies of ICT firms and MFA for the comparison of efficiencies among groups with different production functions. SFA and MFA are explained in the following sections.
2.1.1. Stochastic Frontier Analysis (SFA)
In order to assess the technical efficiency (TE) of firms, SFA first estimates a frontier production function, the maximum output that firms are able to produce with a given input and technology. Next, SFA evaluates the TE of a firm based on the distance between the output of the firm and the frontier; here, as the distance increases, the efficiency of the firm decreases. Specifically, we adopt a random-effect, time-varying production model suggested by [14]. The stochastic frontier production function is given by:
where Yit is the output of the i-th firm in the t-th period; xit is a vector of firm i’s input set in the t-th period; is the production function; β is a vector of unknown parameters that is to be estimated; Vit is an independent and identically distributed (iid) random variable that follows a normal distribution of ; and Uit is the appropriate inefficiency, a non-negative random variable that follows a truncated normal distribution of . The technical inefficiency effects are defined as , where and are parameters to be estimated.
From Equation (1), the technical efficiency of firm i at period t, TEit, is as follows:
Typically, the production function of SFA takes a translog or Cobb-Douglas production function. The Cobb-Douglas production function is inflexible because it is assumed to be a log-linear combination of input variables. Thus, we use the translog function, as shown in Equation (3):
where x1it, x2it, and x3it denote the capital (K), cost of revenue (M), and labor (L), respectively, of the i-th firm in the t-th period.
2.2.2. Metafrontier Analysis (MFA)
MFA has been applied to various areas in the ICT industry, such as broadcasting, telecommunications, and the content industry (e.g., see [15,16,17,18]). To compare efficiencies across different groups with different technologies, MFA introduces a metafrontier production function that envelops the production functions of the different groups [19]. From [20], the metafrontier production function is defined as follows:
where is the vector of the metafrontier parameters to be estimated and j is the country: South Korea (j = 1); China (j = 2); US (j = 3); and Japan (j = 4). Equation (4) implies that a metafrontier production function envelops all of the group frontiers. For simplicity, the function f in Equation (1) is assumed to be of the form , and Equation (1) is rewritten as shown below:
By dividing both sides of Equation (5) by , we obtain Equation (6):
The first part of the right-hand side of Equation (6) is the technical efficiency (TE). The second part is the technical gap ratio (TGR) (or meta-technology ratio [MTR]), which represents the frontier to metafrontier ratio for each country. The metafrontier technical efficiency (TE*) is the product of TE and TGR. It is expressed as follows:
There are two ways to calculate the parameters of the metafrontier production function: linear programming (LP) and quadratic programming (QP). From [20], the LP and QP are given by:
2.2. Identifying the Link between the ICT Ecosystem Structure and Firm Efficiency
We use Tobit regression to analyze the ICT ecosystem’s impact on firm efficiency, since the technical gap ratio takes values between 0 and 1. In the regression, the total assets, number of employees, cost of revenue, and intangible assets (e.g., patents and copyrights) are included as independent variables. In addition, since we hypothesize that a more balanced ICT ecosystem at the country level leads to higher technical efficiency at the firm level, we introduce a variable to capture the balanced ICT ecosystem at the country level. We first define the balance of an ICT ecosystem as balance across the four sub-industries—content, software, telecommunications, and manufacturing—and then measure it with the Herfindahl-Hirschman Index (HHI) formula. In this paper, the HHI is the sum of the squares of the portion of each sub-industry in terms of the firm number. A higher HHI value indicates a higher concentration on a particular sub-industry (or particular sub-industries) and, therefore, a less balanced ICT ecosystem. Let , , and be the total assets, number of employees, and cost of revenue in logarithmic form, respectively. Let , and be the balance of an ICT ecosystem and intangible assets, respectively, and let be the dummy variable for the year effect. Then, the Tobit model used in this paper is given by:
3. Data
Using the firm-level data from year 2000 to 2014 available in the ThomsonONE database [7], we analyze 2709 ICT firms in the US, China, South Korea, and Japan. The four countries were chosen because they are major players in the global ICT industry and have grown along different paths and with different ICT ecosystems. The US has successfully developed in all ICT sectors and is characterized by having the most advanced software capability and an open ICT ecosystem. On the other hand, Japan, South Korea, and China have grown rapidly around the hardware industry with hardware-centric ecosystems, as the industrial momentum has shifted from Japan to South Korea to China. Japan, who once dominated the global electronics market, was particularly notable for its manufacturing excellence that had relied on the long-term relationships between manufacturers and suppliers, but Japan failed to adapt to the global trend changes and lost its comparative advantage in the market to South Korea [21]. Japan, however, remains strong in the components market, generating high profits. South Korea, which has the most hardware-oriented industry structure of the four countries, has achieved rapid industrial growth based on their advanced internet infrastructure [22] and their fast-follower strategy. However, the country is now struggling to cope with the paradigm shift to software-centric innovation. China has gained its manufacturing capabilities by serving as the world’s factory. Its growth has been based on its huge domestic market, expanding its penetration in the global market through low-cost labor. In recent years, China has aggressively invested in R and D and has sought partnerships and M and A, resulting in world-class internet firms and manufacturing excellence that goes beyond low-cost labor. Now, China is not only the largest exporter of ICT goods, but is also a major exporter of ICT services, although the US shows higher performance in terms of the value-added terms [23]. Figure 1 depicts the annual net sales of ICT firms in the four countries.
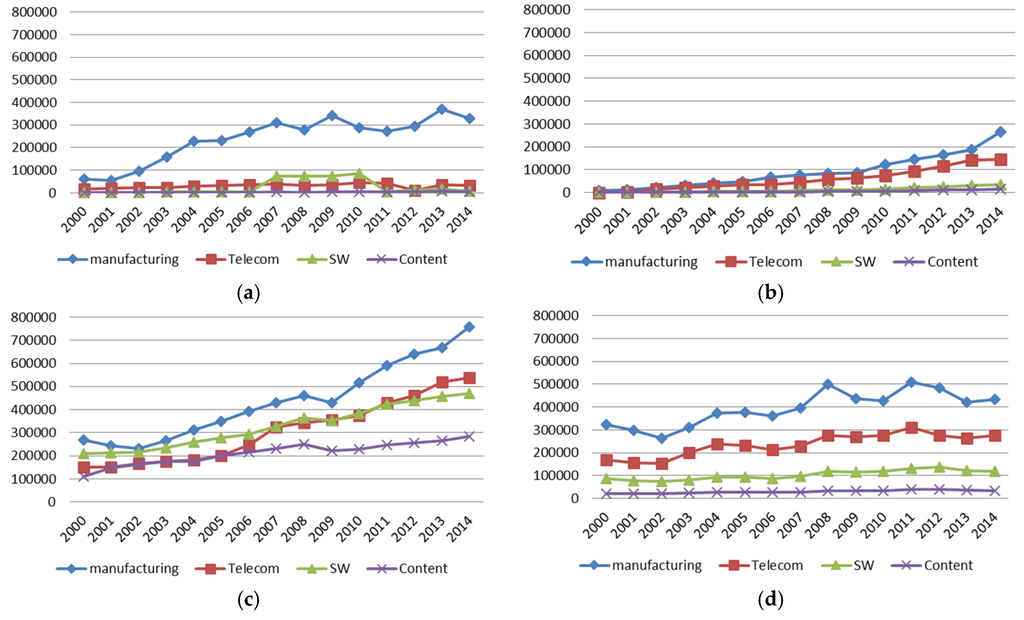
Figure 1.
Net sales of ICT firms in the four countries by year (Unit: USD million). (a) South Korea; (b) China; (c) US; (d) Japan.
In measuring the firms’ efficiency, we choose variables based on the theoretical background. We use net sales for the output variable (e.g., see [8,16,18,24,25,26,27]), the total capital for K (e.g., see [8,16,17]), the number of employees for L (e.g., see [8,16,17,18,24,25,26]), and the cost of revenue for M (e.g., see [17,24,28,29]). These are available through the ThomsonONE database [7] and are standardized to compare data from firms with different accounting rules. Table 1 reports the summary statistics for the input and output variables.

Table 1.
Summary statistics.
4. Results
We estimate the parameters of the production function for each country and the metafrontier production function, using Frontier (version 4.1, University of New England, Armidale, Australia) and Matlab (version 7.1.0.246, The MathWorks, Inc., Natick, MA, United States), respectively. Table 2 shows the results.
Table 2.
Estimation results of group and metafrontier production functions.
Note that the results in Table 2 are obtained under the assumption that ICT firms of the four countries have different product functions and this assumption can be verified by the likelihood ratio (LR) test (we estimated the stochastic frontier with the pooled data of all countries (See [20] for details of the pooled model) as well as with the data by country and conducted the generalized likelihood ratio (LR) test to verify the null hypothesis: the group stochastic frontiers are identical. The value of LR is 1616.116, which is highly significant. Therefore, the null hypothesis is rejected).
Based on the results of the group frontier production functions, we obtain TEs from SFA, and TGRs and TE*s from MFA (while we used both LP and QP to calculate TGRs and TE*s, we only discussed the results of LP since the results from LP and QP were similar), as shown in Table 3. The SFA results show that firms in Japan have the highest TE (89.05%), followed by firms in South Korea (85.09%), China (80.97%), and the US (72.10%). This indicates that the distance between the frontier and the firms within a country increases in the following order: Japan, South Korea, China, and the US. However, as mentioned earlier, it is inappropriate to conclude which countries work better based on their TEs since the efficiencies obtained by SFA can only be compared within groups with the same production function. Thus, we compare the efficiencies among the countries based on TGRs and TE*s and find that the TGR results are totally opposite from the TE results; the firms in the US (83.03%) had the highest TGR, followed by Japan (74.41%), South Korea (67.25%), and China (51.54%). Given that a lower TGR means that the frontier production function is farther from the metafrontier production function, this result indicates that the efficiency of the ICT firms in these countries increases in the following order: China, South Korea, Japan, and the US.
Table 3.
SFA estimates of technical efficiencies and meta-technology ratios.
Table 4 shows the Tobit regression results. In the table, the year effect results are omitted for simplicity. The coefficient of is negative and statistically significant. This supports our hypothesis that a better balanced ICT ecosystem makes firms more efficient. Second, the coefficient of is positive. This result may imply that a firm’s intangible assets are positively associated with its efficiency. Third, our results reveal that a firm’s efficiency is positively related to total assets and negatively related to the number of employees. These results are intuitive because the labor share has declined [30].
Table 4.
Estimation results of the Tobit model.
5. Conclusions
To understand what determines the ICT industry’s performance, we analyzed the efficiency of ICT firms in four countries (US, China, South Korea, and Japan) with different industrial characteristics. We performed metafrontier analysis, which allows for the comparison of efficiencies among different groups with different production functions, and then Tobit regression, to identify what caused the efficiency gaps.
The key findings are as follows. First, the MFA result shows that the US has the highest TGR with 83.03% (i.e., highest efficiency), followed by Japan (74.41%), South Korea (7.25%), and China (51.54%). Second, the Tobit regression results reveal that when a country’s ICT ecosystem is more balanced across sub-industries—content, software, telecommunications, and manufacturing—firms in the country have a higher TGR.
Our results highlight the importance of achieving a balanced industrial development to enhancing the overall competitiveness of the ICT industry. As the era of the Internet of Things (IoT) emerges, in which everything is digitally connected, it is expected that the ICT ecosystem will expand and interdependencies among the players in the ecosystem will increase. In order to better exploit ICT in all areas, policy makers should understand their ICT ecosystem and use a holistic view when strengthening it. In particular, although the four countries have established ICT policies for complementing the weaknesses of their ICT industries. For example, the Japanese government has the “Smart Japan ICT” policy that includes an overseas expansion strategy and the utilization of ICT in non-ICT industries; The Chinese government supports the ICT industry through the “Internet Plus strategy”, which promotes convergence on the Internet, as well as the “Made in China 2025” program for boosting ICT manufacturing; the South Korean government tries to strengthen the competitiveness of SW platforms through the “K-ICT Strategy”; and the US government has focused on providing better environment for fostering the ICT industry and start-ups. These governments should put more effort into promoting collaborations across different layers of their ICT ecosystems and create opportunities for innovative start-ups. Deregulation and providing a more entrepreneurial environment are also crucial to building an innovative and competitive ICT ecosystem. Our study may be limited in that the data of small-sized firms, which the ThomsonONE database [7] does not cover, is excluded, and in that we measured the structure of the ICT ecosystems using distributions of the number of firms. However, since our data covers 2709 firms in the major countries that affect the global ICT industry, we believe that our results still provide meaningful implications that policy-makers need to consider.
Author Contributions
Kyoungsun Lee conceived the research concept and collected data. Daeho Lee analyzed the data and contributed to progress of the research idea. Kyoungsun Lee, Yuri Park, and Daeho Lee wrote the paper. All authors have read and approved the final manuscript.
Conflicts of Interest
The authors declare no conflict of interest.
References
- Hagedoorn, J.; Duysters, G. External sources of innovative capabilities: The preference for strategic alliances or mergers and acquisition. J. Manag. Stud. 2002, 39, 168–188. [Google Scholar] [CrossRef]
- Arlandis, A.; Ciriani, S. How firms interact and perform in the ICT ecosystem? Commun. Strateg. 2010, 79, 121–141. [Google Scholar]
- Fransman, M. Innovation in the New ICT Ecosystem. Commun. Strateg. 2007, 68, 89–110. [Google Scholar]
- Fransman, M. The New ICT Ecosystem: Implications for Policy and Regulation; Cambridge University Press: Cambridge, UK, 2010. [Google Scholar]
- Kaplan, J.A. Roadmap for Open ICT Ecosystems; Berkman Center for Inetrnet and Society at Harvard School: Cambridge, MA, USA, 2005. [Google Scholar]
- Bauer, J.M. Bundling, Differentiation, Alliances and Mergers: Convergence Strategies in U.S. Communication Markets. Commun. Strateg. 2005, 60, 59–83. [Google Scholar]
- ThomsonONE Database. Available online: http://www.thomsonone.com (accessed on 10 May 2016).
- Barua, A.; Brockett, P.L.; Cooper, W.W.; Deng, H.; Parker, B.R.; Ruefli, T.W.; Whinston, A. DEA evaluations of long-and short-run efficiencies of digital vs. physical product “dot com” companies. Soc.-Econ. Plan. Sci. 2004, 38, 233–253. [Google Scholar] [CrossRef]
- Giokas, D.I.; Pentzaropoulos, G.C. Efficiency ranking of the OECD member states in the area of telecommunications: A composite AHP/DEA study. Telecommun. Policy 2008, 32, 672–685. [Google Scholar] [CrossRef]
- Ho, C.B. Measuring dot com efficiency using a combined DEA and GRA approach. J. Oper. Res. Soc. 2010, 62, 776–783. [Google Scholar]
- Li, K.; Lin, B. Measuring green productivity growth of Chinese industrial sectors during 1998–2011. China Econ. Rev. 2015, 36, 279–295. [Google Scholar] [CrossRef]
- Serrano-Cinca, C.; Fuertes-Callin, Y.; Mar-Molinero, C. Measuring DEA efficiency in internet companies. Decis. Support Syst. 2005, 38, 557–573. [Google Scholar] [CrossRef]
- Thompson, H.G., Jr.; Garbacz, C. Mobile, fixed line and Internet service effects on global productive efficiency. Inform. Econ. Policy 2007, 19, 189–214. [Google Scholar] [CrossRef]
- Battese, G.E.; Coelli, T.J. A model for technical inefficiency effects in a stochastic frontier production function for panel data. Empir. Econ. 1995, 20, 325–332. [Google Scholar] [CrossRef]
- Kim, H.; Lee, D.; Hwang, J. Measuring the Efficiency of Standardisation Policy Using Meta-Frontier Analysis: A Case of Mobile Platform Standardisation. Int. J. Mobile Commun. 2016, 14, 79–98. [Google Scholar] [CrossRef]
- Lee, C.; Lee, D.; Hwang, J. Platform openness and the productivity of content providers: A meta-frontier analysis. Telecommun. Policy 2015, 39, 553–562. [Google Scholar] [CrossRef]
- Lee, D.; Hwang, J. Network neutrality and difference in efficiency among Internet application service providers: A meta-frontier analysis. Telecommun. Policy 2011, 35, 764–772. [Google Scholar] [CrossRef]
- Yang, A.; Lee, D.; Hwang, J.; Shin, J. The influence of regulations on the efficiency of telecommunications operators: A meta-frontier analysis. Telecommun. Policy 2013, 37, 1071–1082. [Google Scholar] [CrossRef]
- Battesse, G.E.; Rao, D.S.P. Technology gap, efficiency, and a stochastic metafrontier function. Int. J. Bus. Econ. 2002, 1, 87–93. [Google Scholar]
- Battesse, G.E.; Rao, D.S.P.; O’Donnell, C.J. A metafrontier production function for estimation of technical efficiencies and technology gaps for firms operating under different technologies. J. Prod. Anal. 2004, 21, 91–103. [Google Scholar] [CrossRef]
- Vogel, S.K. Japan’s Information Technology Challenge. In The Third Globalization: Can Wealthy Nations Stay Rich in the Twenty-First Century? Breznitz, D., Zysman, J., Eds.; Oxford University Press: Oxford, UK, 2013; pp. 350–372. [Google Scholar]
- Lee, C.; Chan-Olmsted, S.M. Competitive advantage of broadband Internet: a comparative study between South Korea and the United States. Telecommun. Policy 2004, 28, 649–677. [Google Scholar] [CrossRef]
- OECD. OECD Digital Economy Outlook 2015; OECD: Paris, France, 2015. [Google Scholar]
- Ferreira, N.B.; Oliveira, M.M. Portfolio efficiency analysis with SFA: The case of PSI-20 companies. Appl. Econ. 2016, 48, 1–6. [Google Scholar] [CrossRef]
- Janang, J.T.; Suhaimi, R.; Salamudin, N. Technical efficiency estimation of government linked companies in Malaysia. J. Modern Account. Audit. 2011, 7, 555–564. [Google Scholar]
- Stiakakis, E.; Sifaleras, A. Combining the priority rankings of DEA and AHP methodologies: A case study on an ICT industry. Int. J. Data Anal. Tech. Strateg. 2013, 5, 101–114. [Google Scholar] [CrossRef]
- Tsai, H.C.; Chen, C.M.; Tzeng, G.H. The comparative productivity efficiency for global telecoms. Int. J. Prod. Econ. 2006, 103, 509–526. [Google Scholar] [CrossRef]
- Reynolds, D.; Biel, D. Incorporating satisfaction measures into a restaurant productivity index. Hosp. Manag. 2007, 26, 351–361. [Google Scholar] [CrossRef]
- De Vries, G.J.; Koetter, M. ICT Adoption and Heterogeneity in Production Technologies: Evidence for Chilean Retailers. Oxf. Bull. Econ. Stat. 2011, 73, 539–555. [Google Scholar] [CrossRef]
- Karabarbounis, L.; Neiman, B. The Global Decline of the Labor Share. Quart. J. Econ. 2014, 129, 61–103. [Google Scholar] [CrossRef]
© 2016 by the authors; licensee MDPI, Basel, Switzerland. This article is an open access article distributed under the terms and conditions of the Creative Commons Attribution (CC-BY) license (http://creativecommons.org/licenses/by/4.0/).