1. Introduction
With the development of technical capabilities of GNSS (Global Navigation Satellite Systems) measurements and improvement of accuracy of coordinate determination, GNSS observations become more and more applicable in other branches of science: meteorology, atmospheric physics, aviation, etc.
The operation principle of the remote monitoring of the atmosphere is based on registering and processing radio signals of GNSS. A propagation of radio signals from navigation satellites to ground receivers through the atmosphere is accompanied by a propagation rate decrease. This is due to the presence of nitrogen, oxygen, carbon dioxide molecules, and water vapour in the atmosphere. Under the influence of external radio waves, these molecules are polarized and provide additional electrical currents in the atmosphere. As a result, the total current is different from the currents in vacuum, which leads to decreases in the phase velocity of the radio waves that directly depend on the concentration of molecules. Therefore, measurements of an additional delay of signal passing in the atmosphere provide information on the integrated properties of the atmosphere along the propagation path of signal. When processing observational data from space vehicles, one can get additional information in the form of files of radio signal atmospheric delays that are registered by GNSS receivers. Due to a strong correlation between water vapour in the atmosphere and the tropospheric delay of GNSS-signal propagation, one can estimate the IPWV (Integrated Precipitable Water Vapour) in the atmosphere based on GNSS measurements [
1].
A main objective of this paper is an analysis of the spatiotemporal instability of the atmosphere in the territory covered by active reference stations. The results of this research can be used to improve the quality of weather forecasts and help prevent of natural disasters.
An important application of this investigation may also be to study the occurrence conditions of such phenomena as the over-the-horizon propagation of ultra-short radio waves (USWs). Interest in the propagation of USWs is primarily caused by the fact that the spatiotemporal instability of the refraction index of the troposphere changes the nature of USW propagation and leads to the appearance of such phenomena as multi-radiance and over-the-horizon propagation of radio waves (super-refraction) having a negative influence on radio communication, navigation, and the radar system.
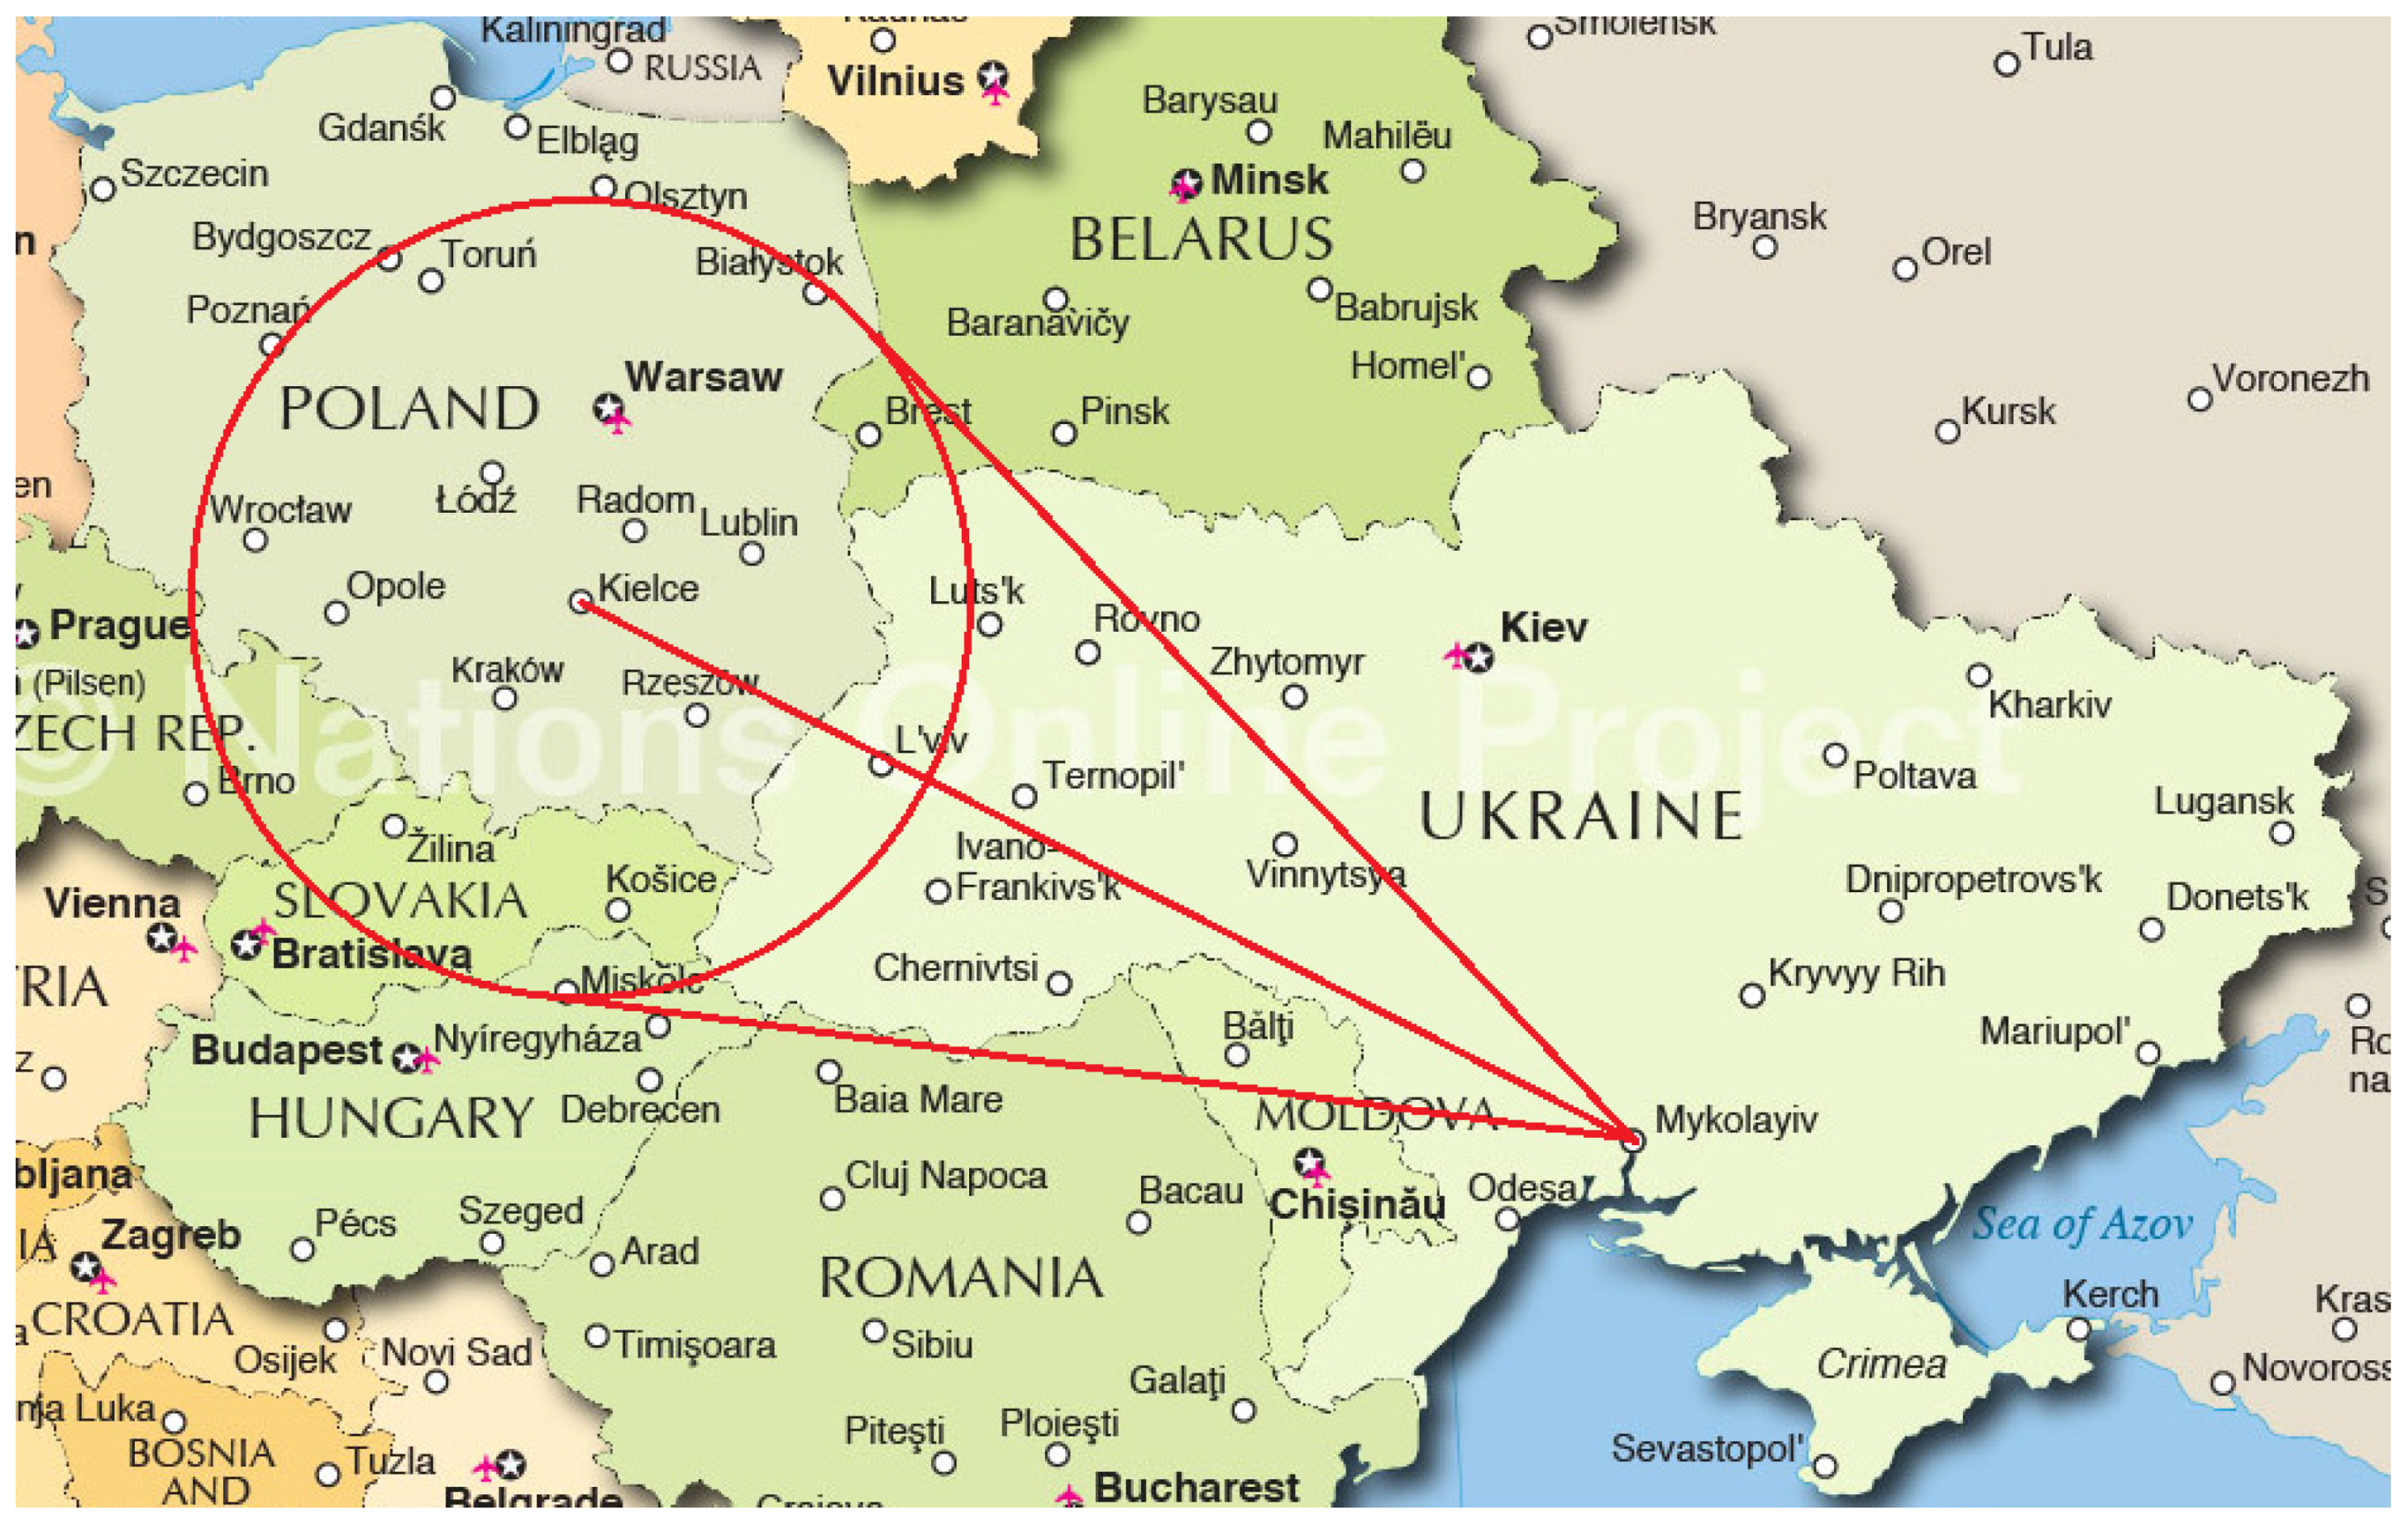
Another mechanism for ultra-long propagation is a reflection of USW radio signals from ionized trails of meteoroids burning up in Earth’s atmosphere. The hardware and software system developed by the Research Institute “Mykolayiv Astronomical Observatory” allows us to detect such signals automatically at a frequency of 88.2 MHz in Mykolayiv by means of the registration of the signal of over-the-horizon FM stations located in Kielce (Poland) [
2]. Due to the difference in time characteristics, we can detect a group of signals that are not related to the meteor. The appearance of these signals is probably caused by other mechanisms of the very long propagation of USWs. As will be shown below, the appearance of the parts of such signals is probably caused by the presence of perturbations of the refractive index of the troposphere on the radio propagation route Mykolayiv–Kielce. Here, the value of height difference on tropospheric delay isosurface is used as a criterion of the instability of the atmosphere.
2. Materials and Methods
Modern GNSS networks provide a significant supplement to other geophysical networks (e.g., seismic, geodynamic, gravimetric ones) because they have high precision, a sensitivity to the duration of an observation period, an ease of deployment, and an ability to perform measurements of shifts in both local and global scales.
At the present time, studies of troposphere using GNSS observations are directed towards a better understanding of weather and climate processes [
3,
4] is the largest project in Central Europe, within which the determination of zenith tropospheric delays on the regional network of GNSS stations is carried out in near real-time. Its main computer center is located in the Royal Observatory of Belgium (ROB). The network currently includes approximately 200 stations, most of which belong to the EPN permanent network of EUREF and International GNSS Service (IGS).
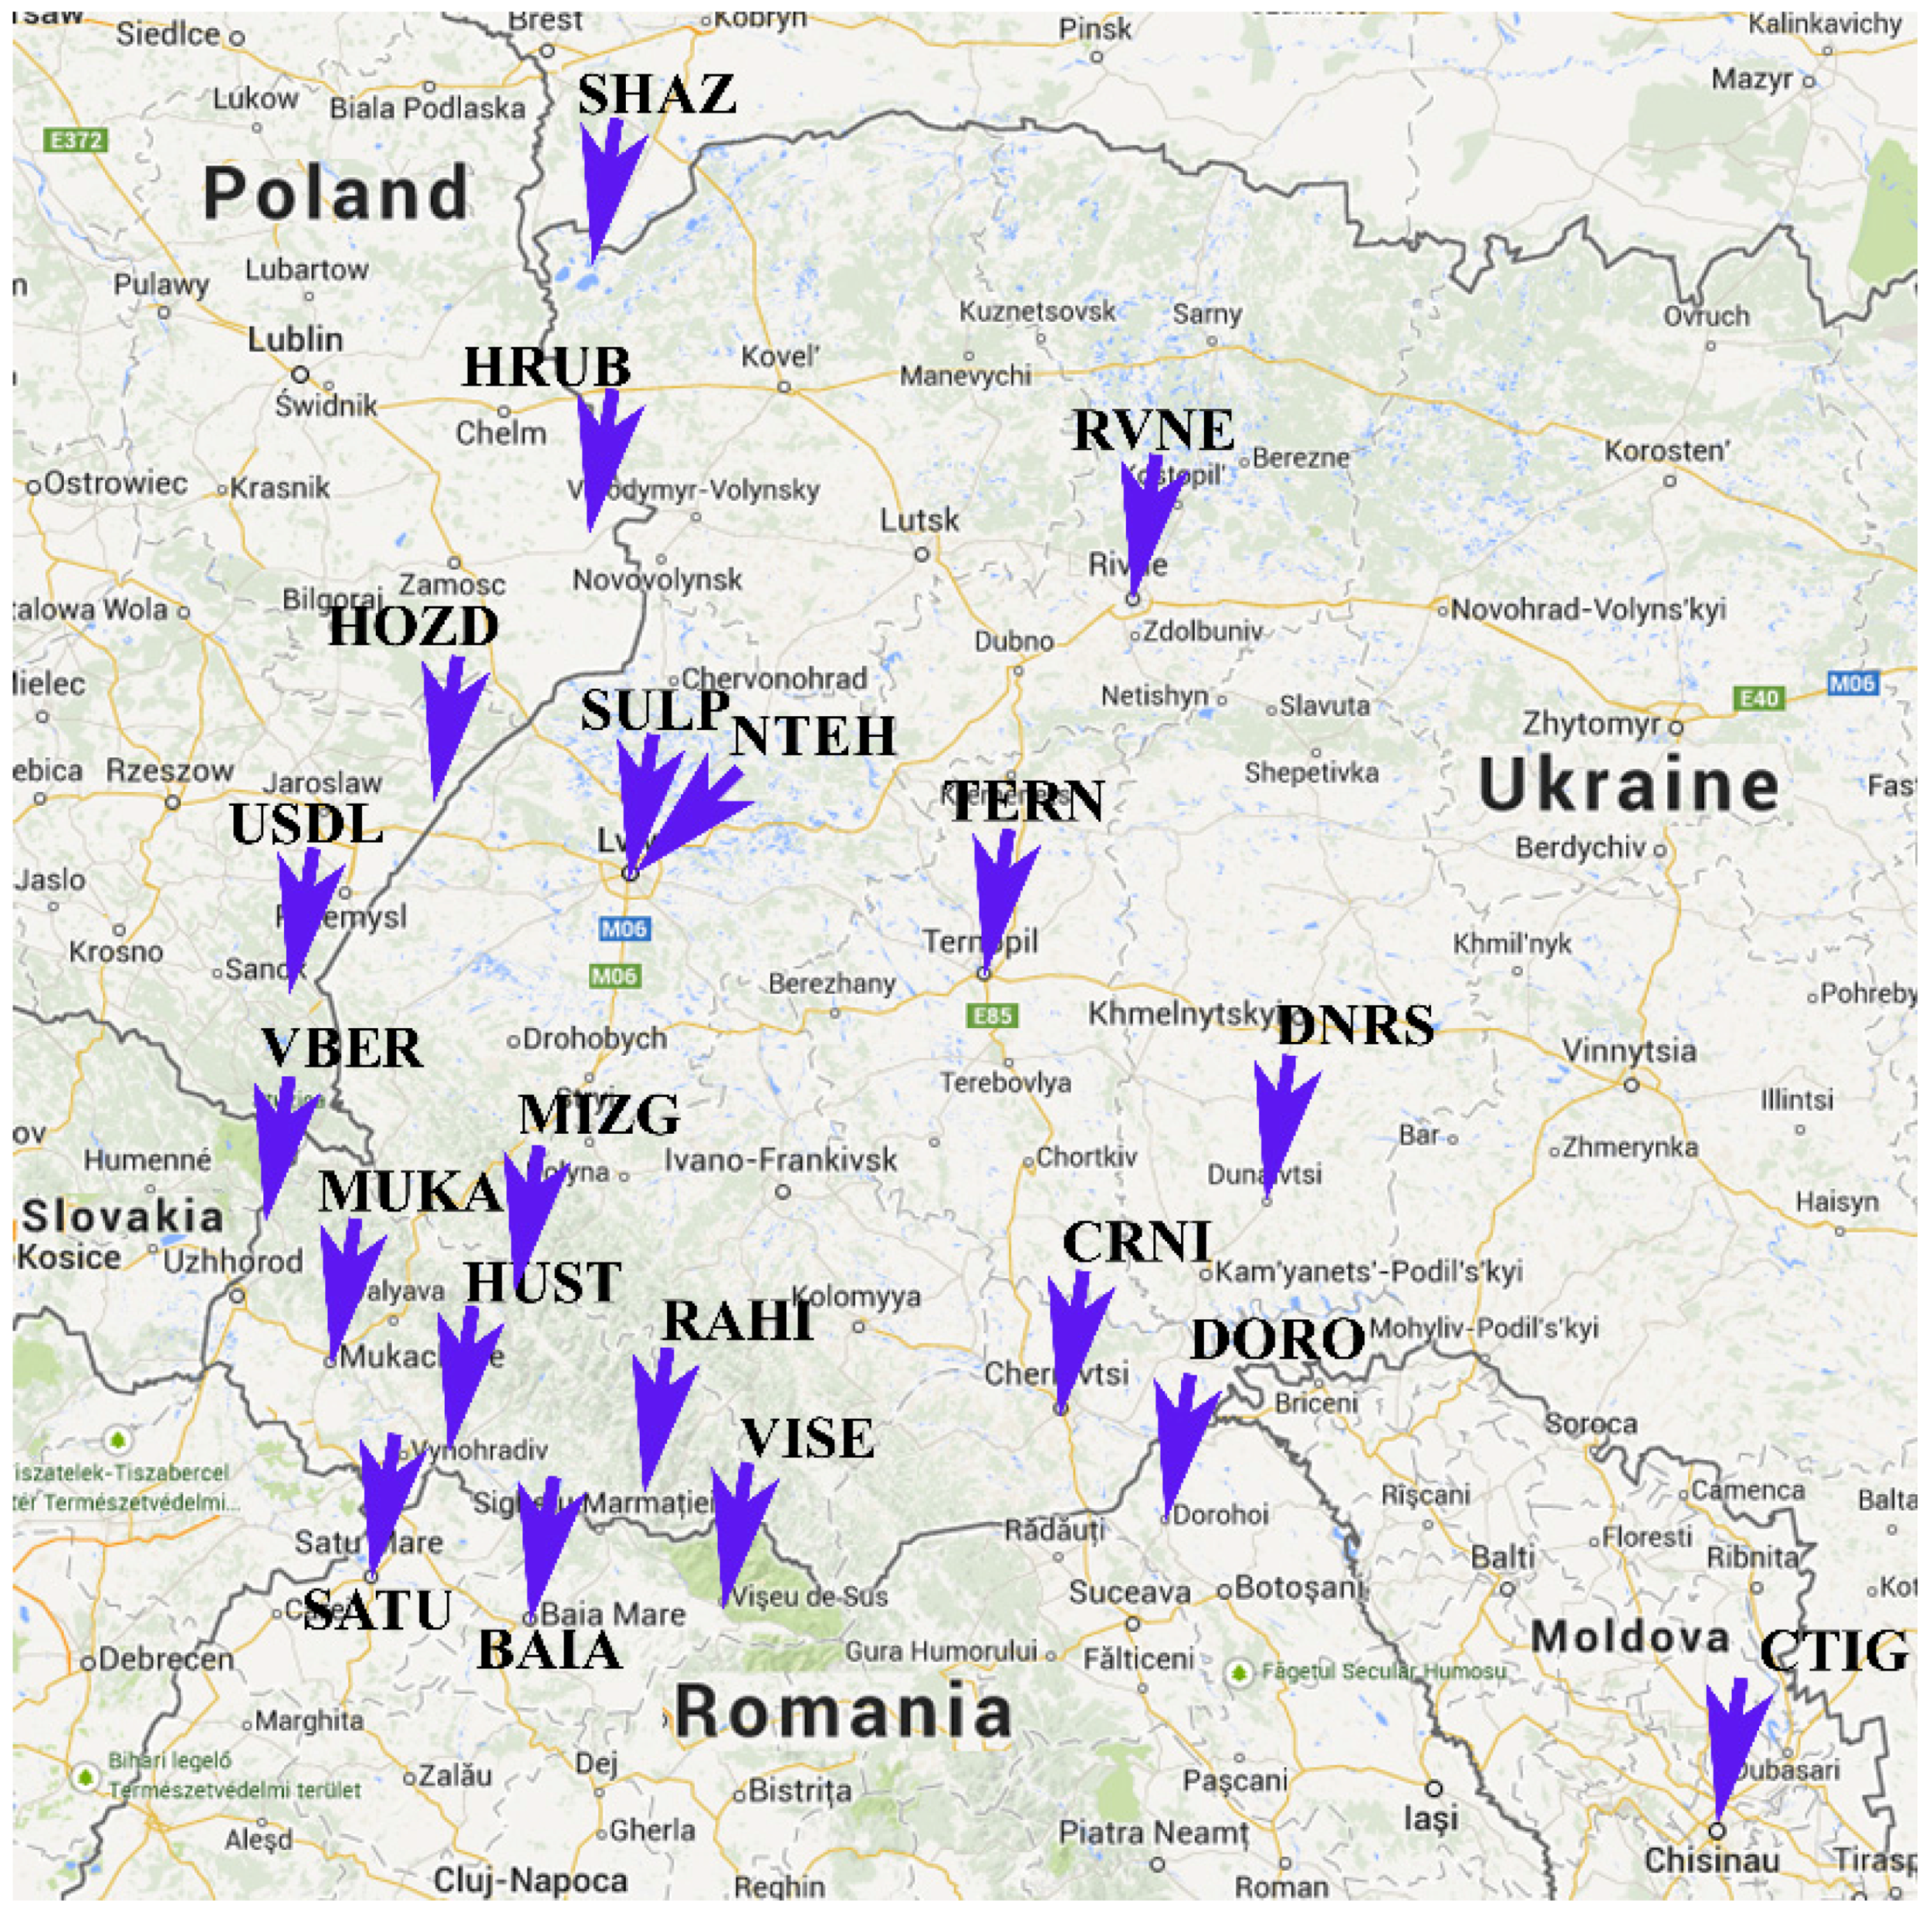
Currently in UA-EUPOS/ZAKPOS network of active reference stations data from 90 GNSS stations located in the Ukraine, Poland, Slovakia, Hungary, Romania, and Moldova are processed [
5] (see also pages of these networks:
www.asgeupos.pl,
www.skpos.gku.sk,
www.rompos.ro,
www.gnssnet.hu and
Figure 1). In the data center of UA-EUPOS/ZAKPOS, the network software of Trimble (USA) is exploited. This allows us to obtain zenith tropospheric delays (ZTDs) at reference stations each minute.
The main conceptual advantage of any active GNSS network in comparison with single (permanent) GNSS stations is the possibility of generating a so-called network solution [
4]. From a network solution at the sites of reference stations, we get tropospheric delays within millimeter accuracy. Tropospheric delay gives information about the content of water vapour in the atmosphere (IPWV). For the monitoring of severe weather events, the information about integral properties of the atmosphere along the trajectory of signal propagation is necessary with high spatial and temporal distribution. Therefore, tropospheric delay values measured at stations of network should be interpolated at any point location (both horizontally and vertically). The main divergences between approaches is in choice of approximating functions [
6,
7,
8]. From our analysis, it follows that, at altitudes higher than the altitudes of reference stations, known methods produce a considerable amount of errors (about 5–6 cm).
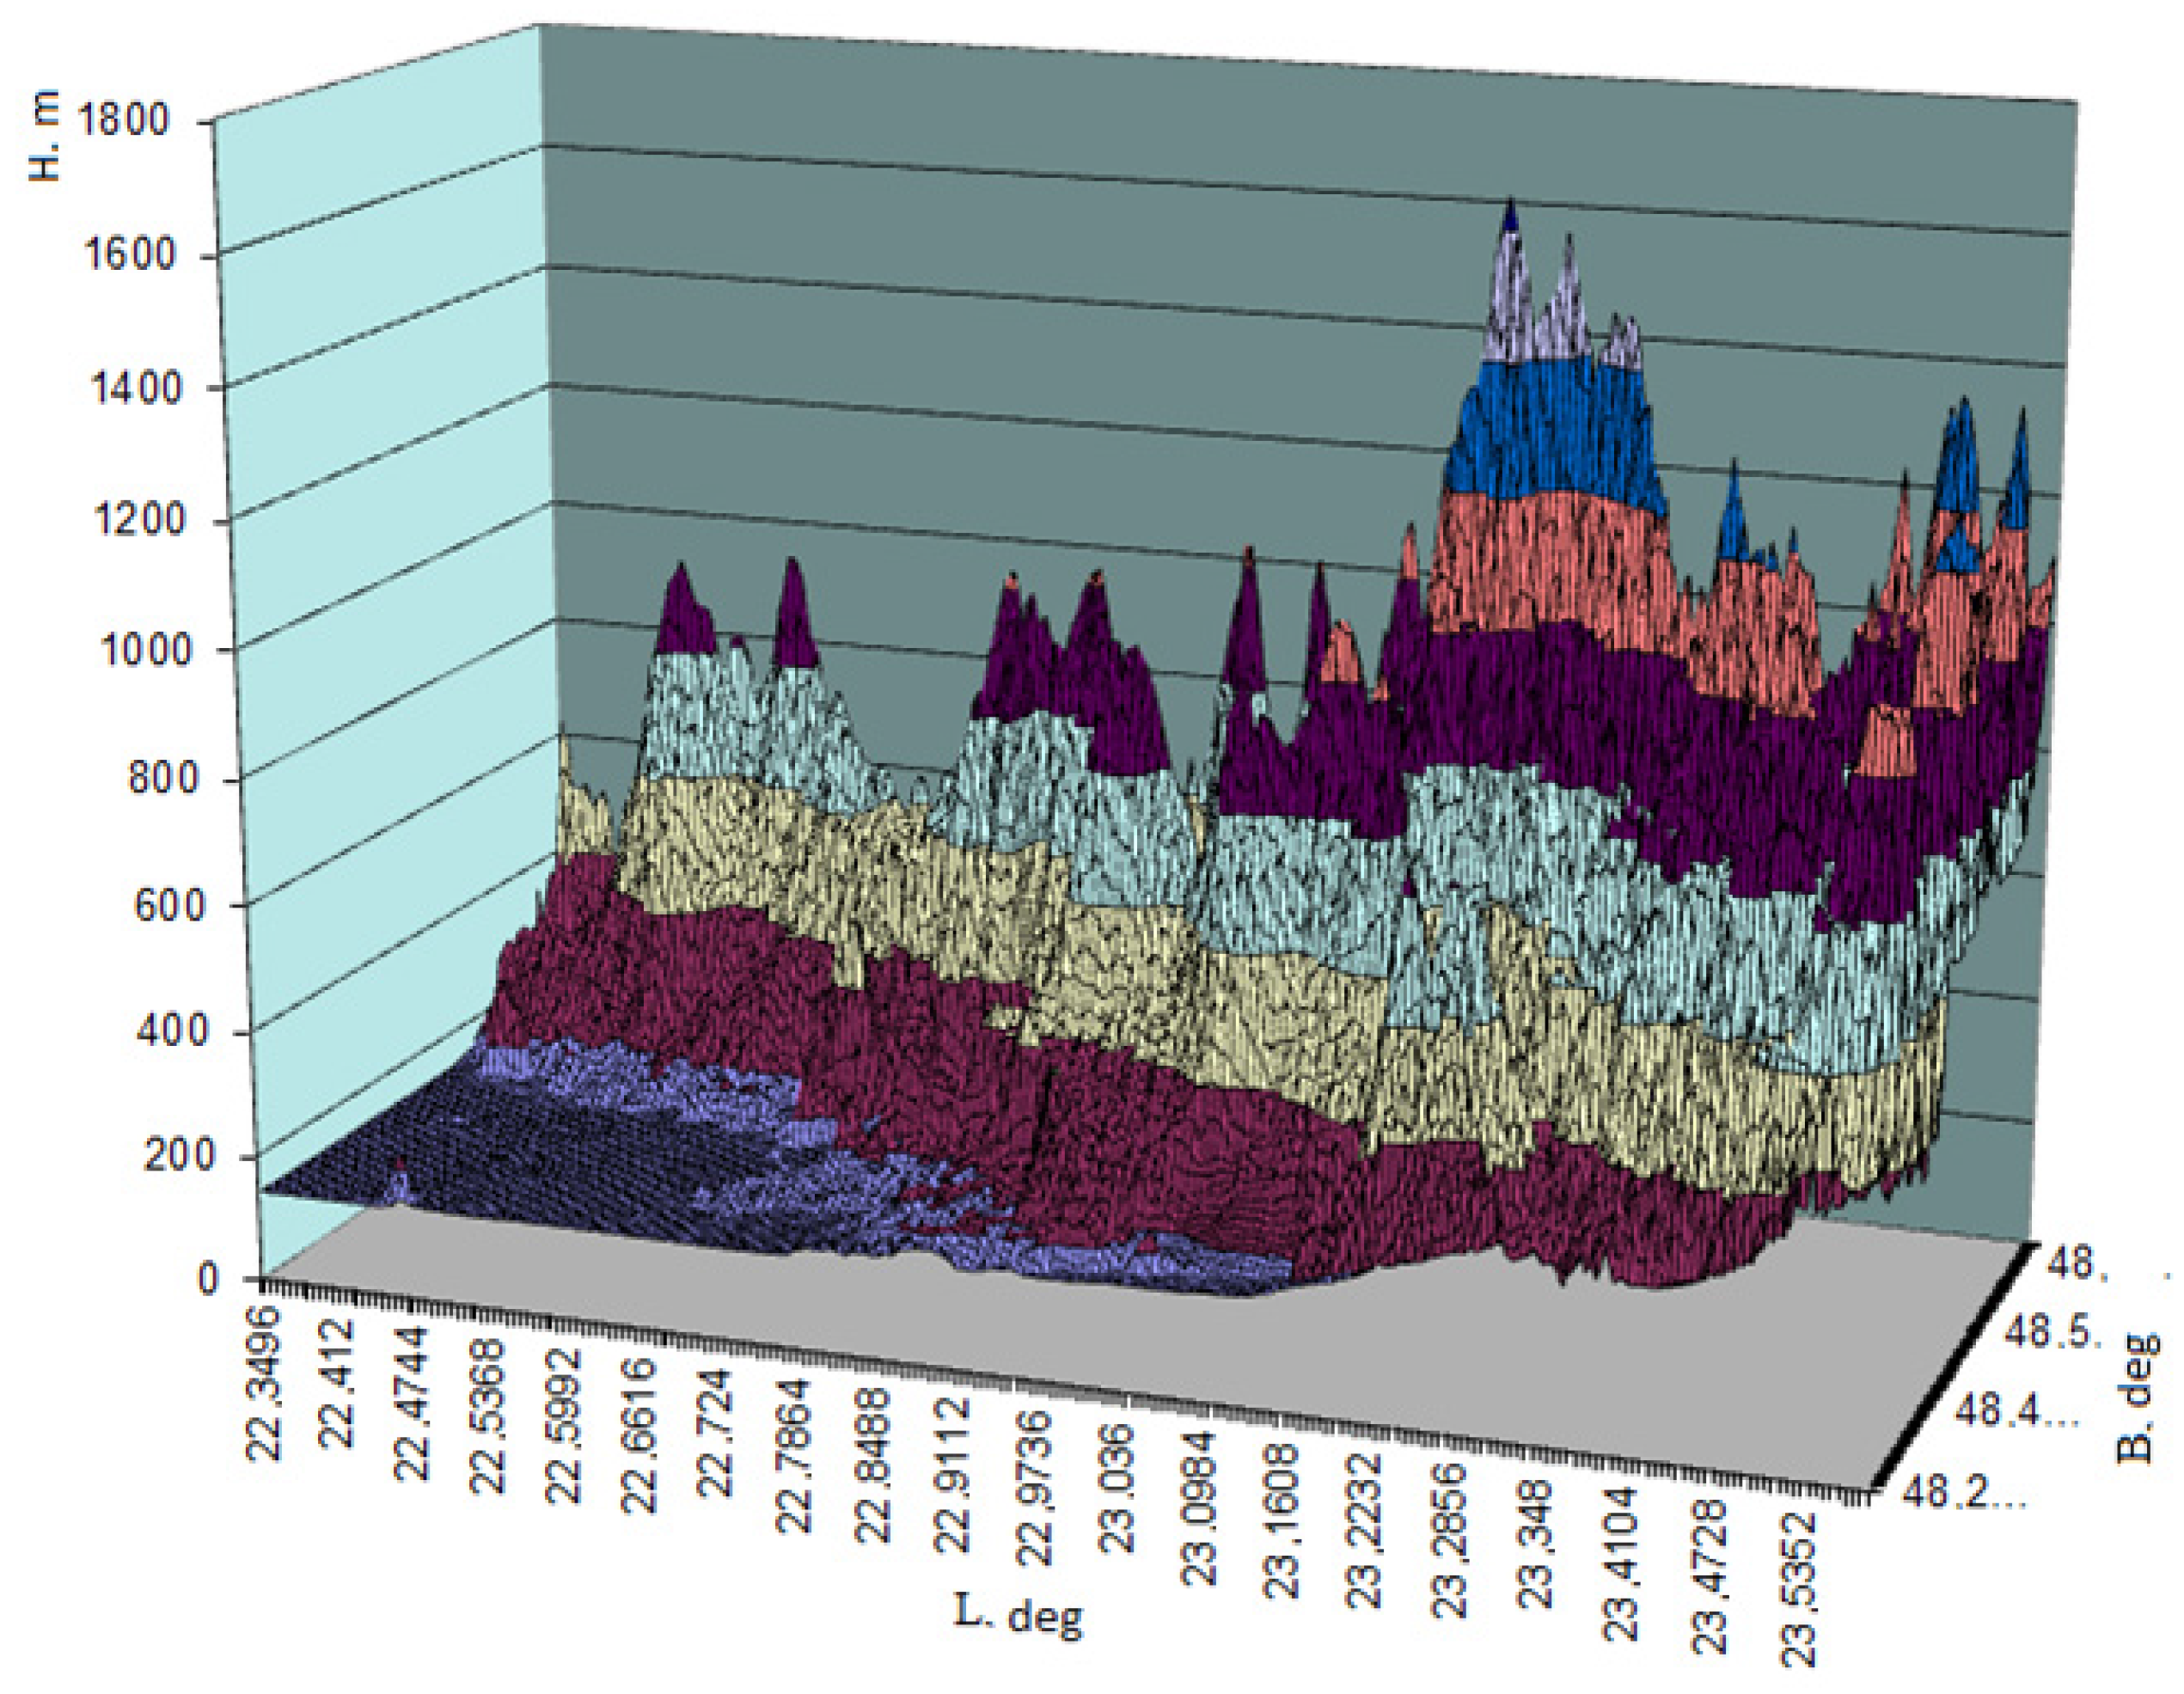
Note that the Carpathian region is mountainous and complicated for a description since there are large differences in elevation. The highest point is the Hoverla Mountain at 2061 m, and the lowest one is located near Rus’ki Heyivtsi of the Uzhhorod district at 101 m above sea level. Elevation change on the part of the Transcarpathian region is shown in
Figure 2.
One aim of this work is to find tropospheric delays at any point and at any height based on tropospheric delays defined over the active reference GNSS stations of the ZAKPOS/UA-EUPOS network in real time [
6]. We have elaborated the method of determination of tropospheric delay in arbitrary point of coverage area of the UA-EUPOS/ZAKPOS network in real time that takes the relief of the region into account. For this purpose, the Transcarpathian region is divided by grid squares of size 250 m × 250 m. The coordinates of more than 200,000 points distanced by 250 m (here, the range of latitude is 47.9°–49.1°, and the range of longitude is 22.1°–24.6°) were obtained.
As is known, the value of tropospheric delay is given by the expression [
7]
An analysis of values of the refractive index
N obtained from the aerological sounding of the atmosphere [
8,
9] shows that the dependence of
N on altitude
H is well approximated by the following formula:
where
and
are functions of geodetic longitude
L and geodetic latitude
B of point,
is the point altitude with known refractive index
. Substituting Equation (2) into Equation (1) and calculating the integral, we obtain tropospheric delay of the form
Due to large values of
(
km), a contribution of the second term in Equation (3) is of the order of 1–2 mm (the layer of atmosphere from 50 km up to 100 km contributes about 2 mm into tropospheric delay). Taking this fact into account allows us to neglect the last term in Equation (3). Selecting a few (4–6) active reference GNSS stations with a known ZTD and located nearest to
i-th point, and taking nearest station among them as a basic one, we write the system of equations
where
,
,
,
are ZTD and geodetic coordinates of
i-th reference station,
i = 1, 2…,
S;
S = the number of active reference stations or of the
i-th required point,
i = 1, 2,…,
P;
P is the number of required points (
is the geodetic latitude, in degrees,
is the geodetic longitude, in degrees,
is the geodetic altitude in meters);
,
,
,
are ZTD and geodetic coordinates of the basic station, and coefficients
,
,
,
are calculated by means of interpolation methods (e.g., the least squares method, the Gauss–Newton algorithm, the method of gradient descent, the Levenberg–Marquardt algorithm
etc.).
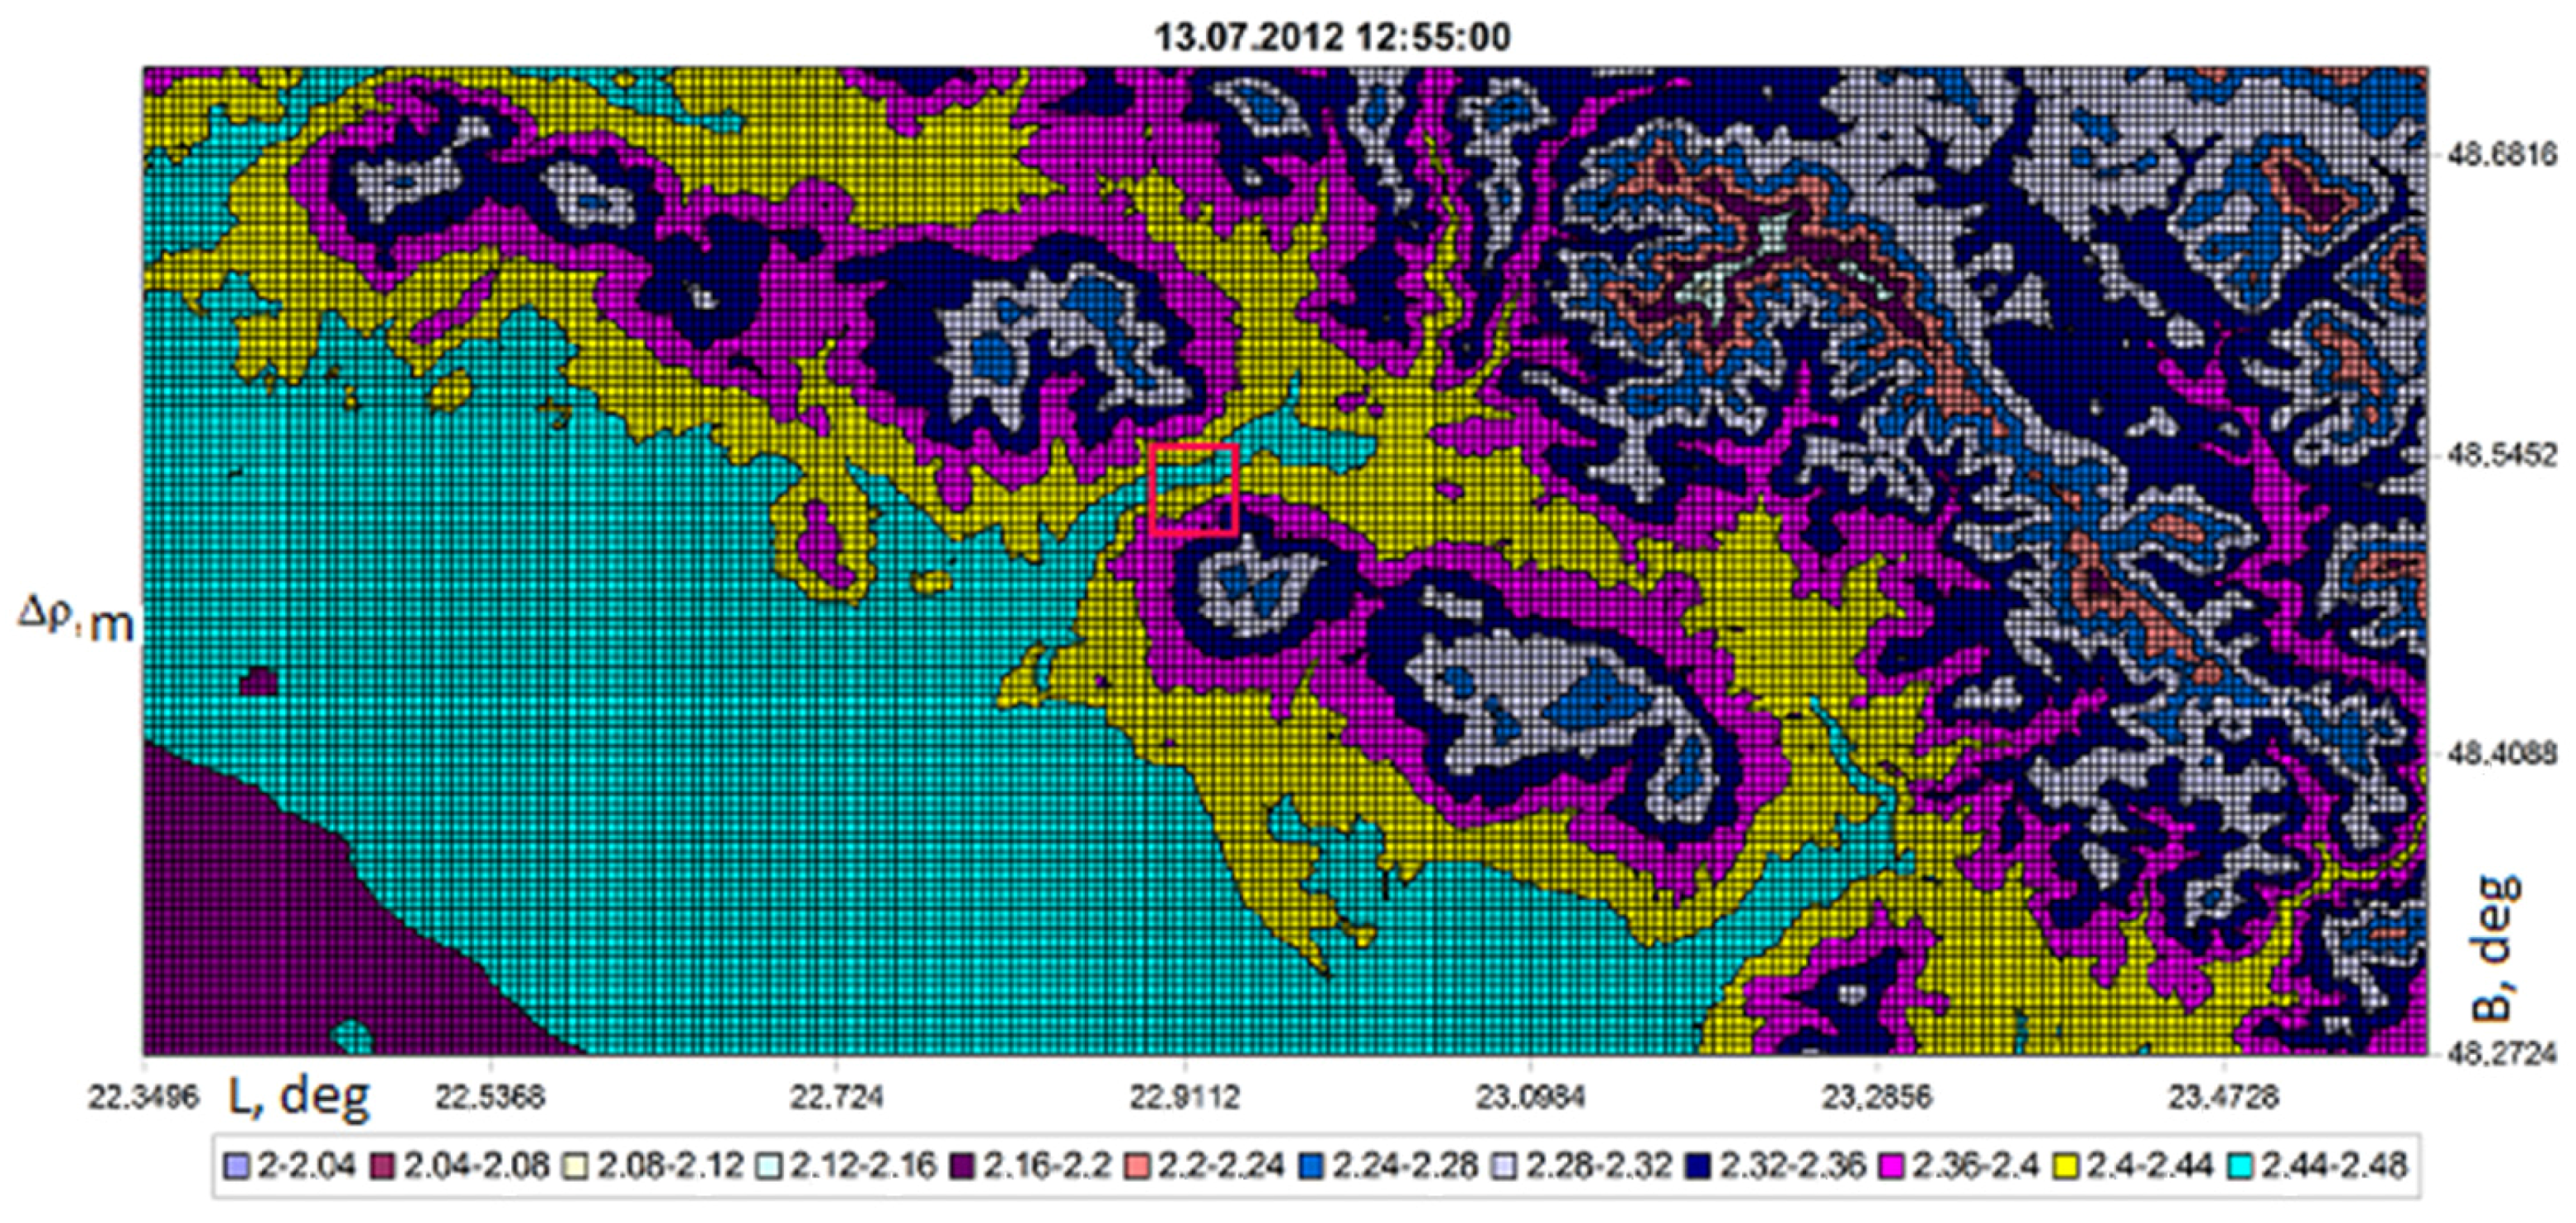
To construct the surface of tropospheric delay changes in the territory covering by the network of active reference stations in real time, 845 temporal measurements of tropospheric delay at 20 stations of the UA-EUPOS/ZAKPOS network and technology of determination of tropospheric delay at any point and of any altitude above these points of the UA-EUPOS/ZAKPOS network has been employed. For example, in
Figure 3, tropospheric delays in the part of Transcarpathian region on 13 July 2012, UT = 12 h 55 m is shown in a form of isolines.
By constructing maps of tropospheric delays over a certain period of time, e.g., 15 min, 30 min, or (if necessary) 1 min, it is possible to determine the dynamics of changes in the state of the troposphere over the coverage area of the network of reference stations. The advantage of this technique is not only in speed, clarity, and continuity (1 min) but also in the fact that it does not require information about weather parameters at the level of the location of reference stations or carrying out upper air sounding of the atmosphere. It is sufficient to find the tropospheric delays at reference stations of network. In addition, we can quickly find the tropospheric delay for any point with known geodetic coordinates.
In order to study the stability of the atmosphere in real time, the algorithm for the construction of the isosurfaces (surfaces consisting of points with equal ZTD) of the tropospheric delay is designed by us as follows.
Let us choose the
i-th reference station with a known ZTD equal to
and write the system of equations
where coefficients
,
,
, and
are calculated by the means of the method of least squares. To construct isosurfaces, we divide the plane of station coverage by squares with sides
and in vertices of these squares have coordinates
and
where
, and
N is the number of squares. Rewriting Equation (5) for nodal points with coordinates
,
, and
(here
i = k) and substituting
, one can obtain the equation
for finding altitude
. Plotting
in coordinates
and
, we obtain isosurface for
. By changing
up or down in the range from
km (Earth’s surface) until
km (height of the tropopause) by a certain step (e.g.,
m), one can similarly construct other isosurfaces.
3. Results
Using the method described in the previous section, the isosurfaces of tropospheric delays from 7 to 15 July 2012 at different instants of time were constructed.
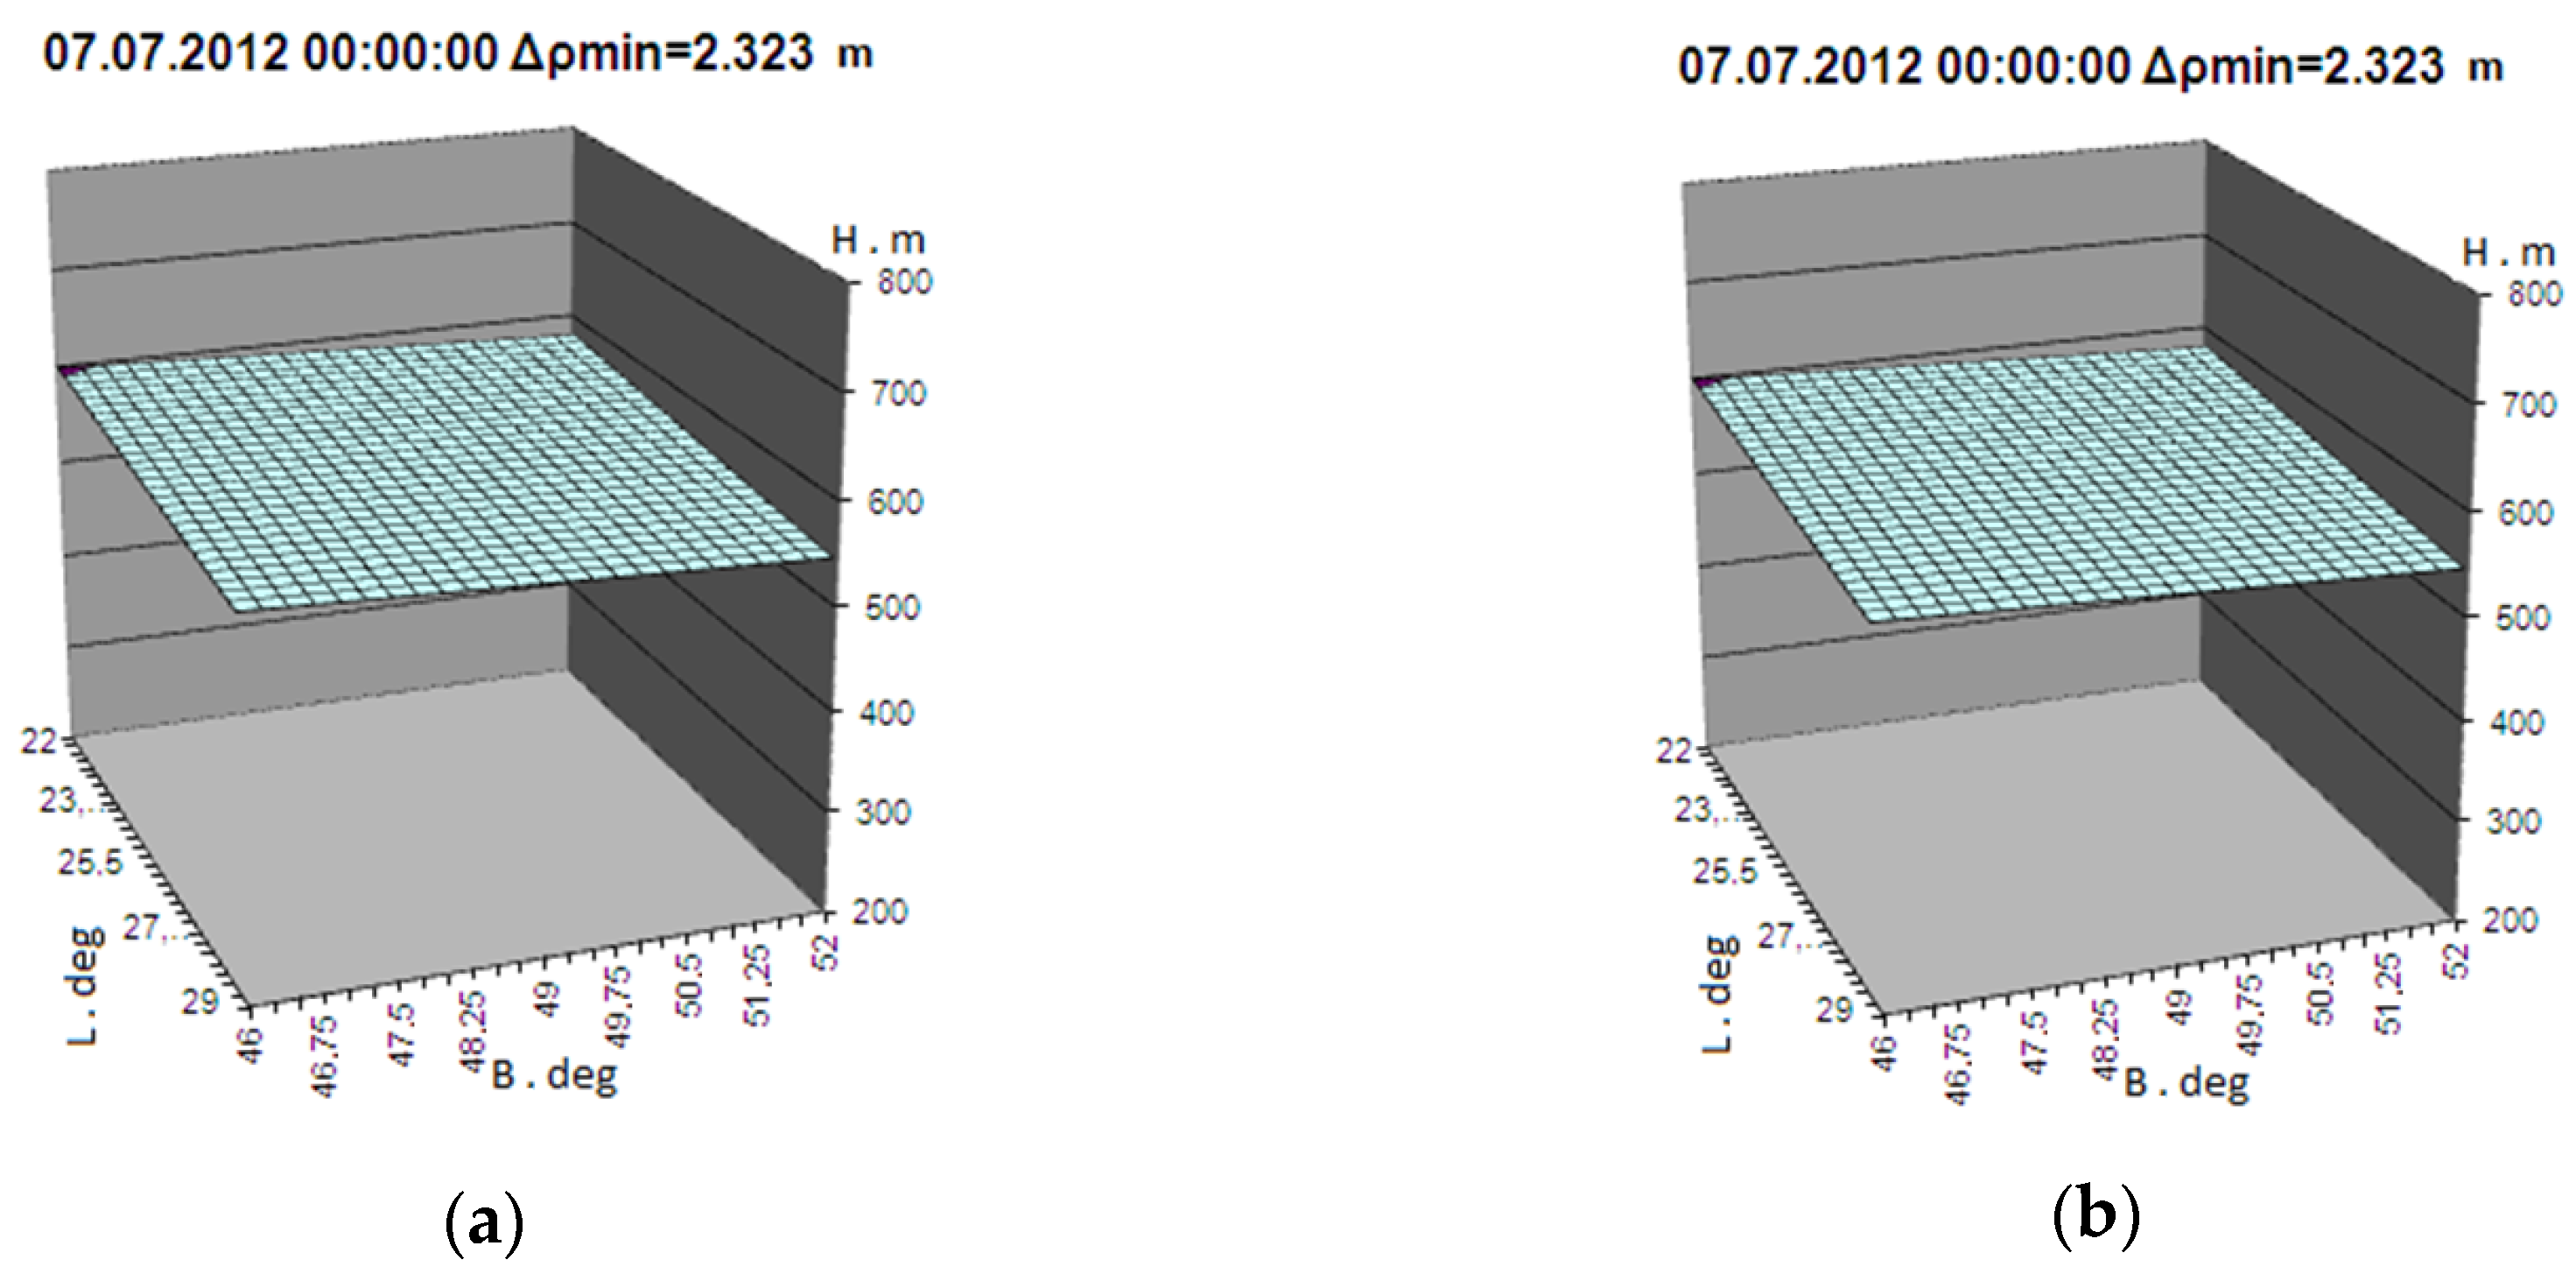
Figure 4 shows the isosurface on 7 July 2012, UT = 00 h 00 m and 15 July 2012, UT = 00 h 00 m.
Table 1 shows the maximum and minimum heights over various points of the UA-EUPOS/ZAKPOS coverage with a fixed value
and elevation change
on four dates of observation.
Comparison of the isosurfaces for 7 July 2012, 7 August 2013, 13 July 2013, and 15 July 2012, at the certain instants of time, gives reason to believe that, on 7 July 2012 and 7 August 2013, the situation in the troposphere was stable; thus, over various points of coverage of active reference stations of the UA-EUPOS/ZAKPOS, the isosurface has a height difference that is equal to 58 m and 160 m, respectively. On 13 and 15 July 2013, the troposphere was obviously unstable, and changes in altitudes ( m and m) were extremely large ( is about 670–1000 m).
To analyze the situation during the period from 7 to 15 July 2012 in specific instants of time, we used data of the aerological sounding of the atmosphere in Chernivtsi and Lviv on UT = 00 h, data of the weather conditions at weather stations of the Transcarpathian region, and data of presence of signals from over-the-horizon FM stations on the route Kielce–Mykolayiv, which were not classified as meteoric ones.
Information about the existence of such signals on a line Kielce–Mykolayiv is given in [
2], which considered the aspects of observation and results of studies on meteoric activity by means of radio aids in the Institute MAO. The processing of data sets is performed using a program of the automatic detection of meteors, developed in the Institute MAO. Fragments of the audio signal of FM stations shorter than 10 s are considered meteors. Fragments having more than 10 s are phenomena caused by other mechanisms of over-the-horizon propagation of waves, including the presence of over-refractivity due to the perturbations of refractive index of troposphere.
Figure 5 clearly shows that, on 7 and 8 July 2012, the signals of over-the-horizon FM stations unclassified as meteors is almost not observed, and
vice versa, on 13 July 2012, the duration of such signals was significant. More non-meteor signals were observed on 15 July 2012.
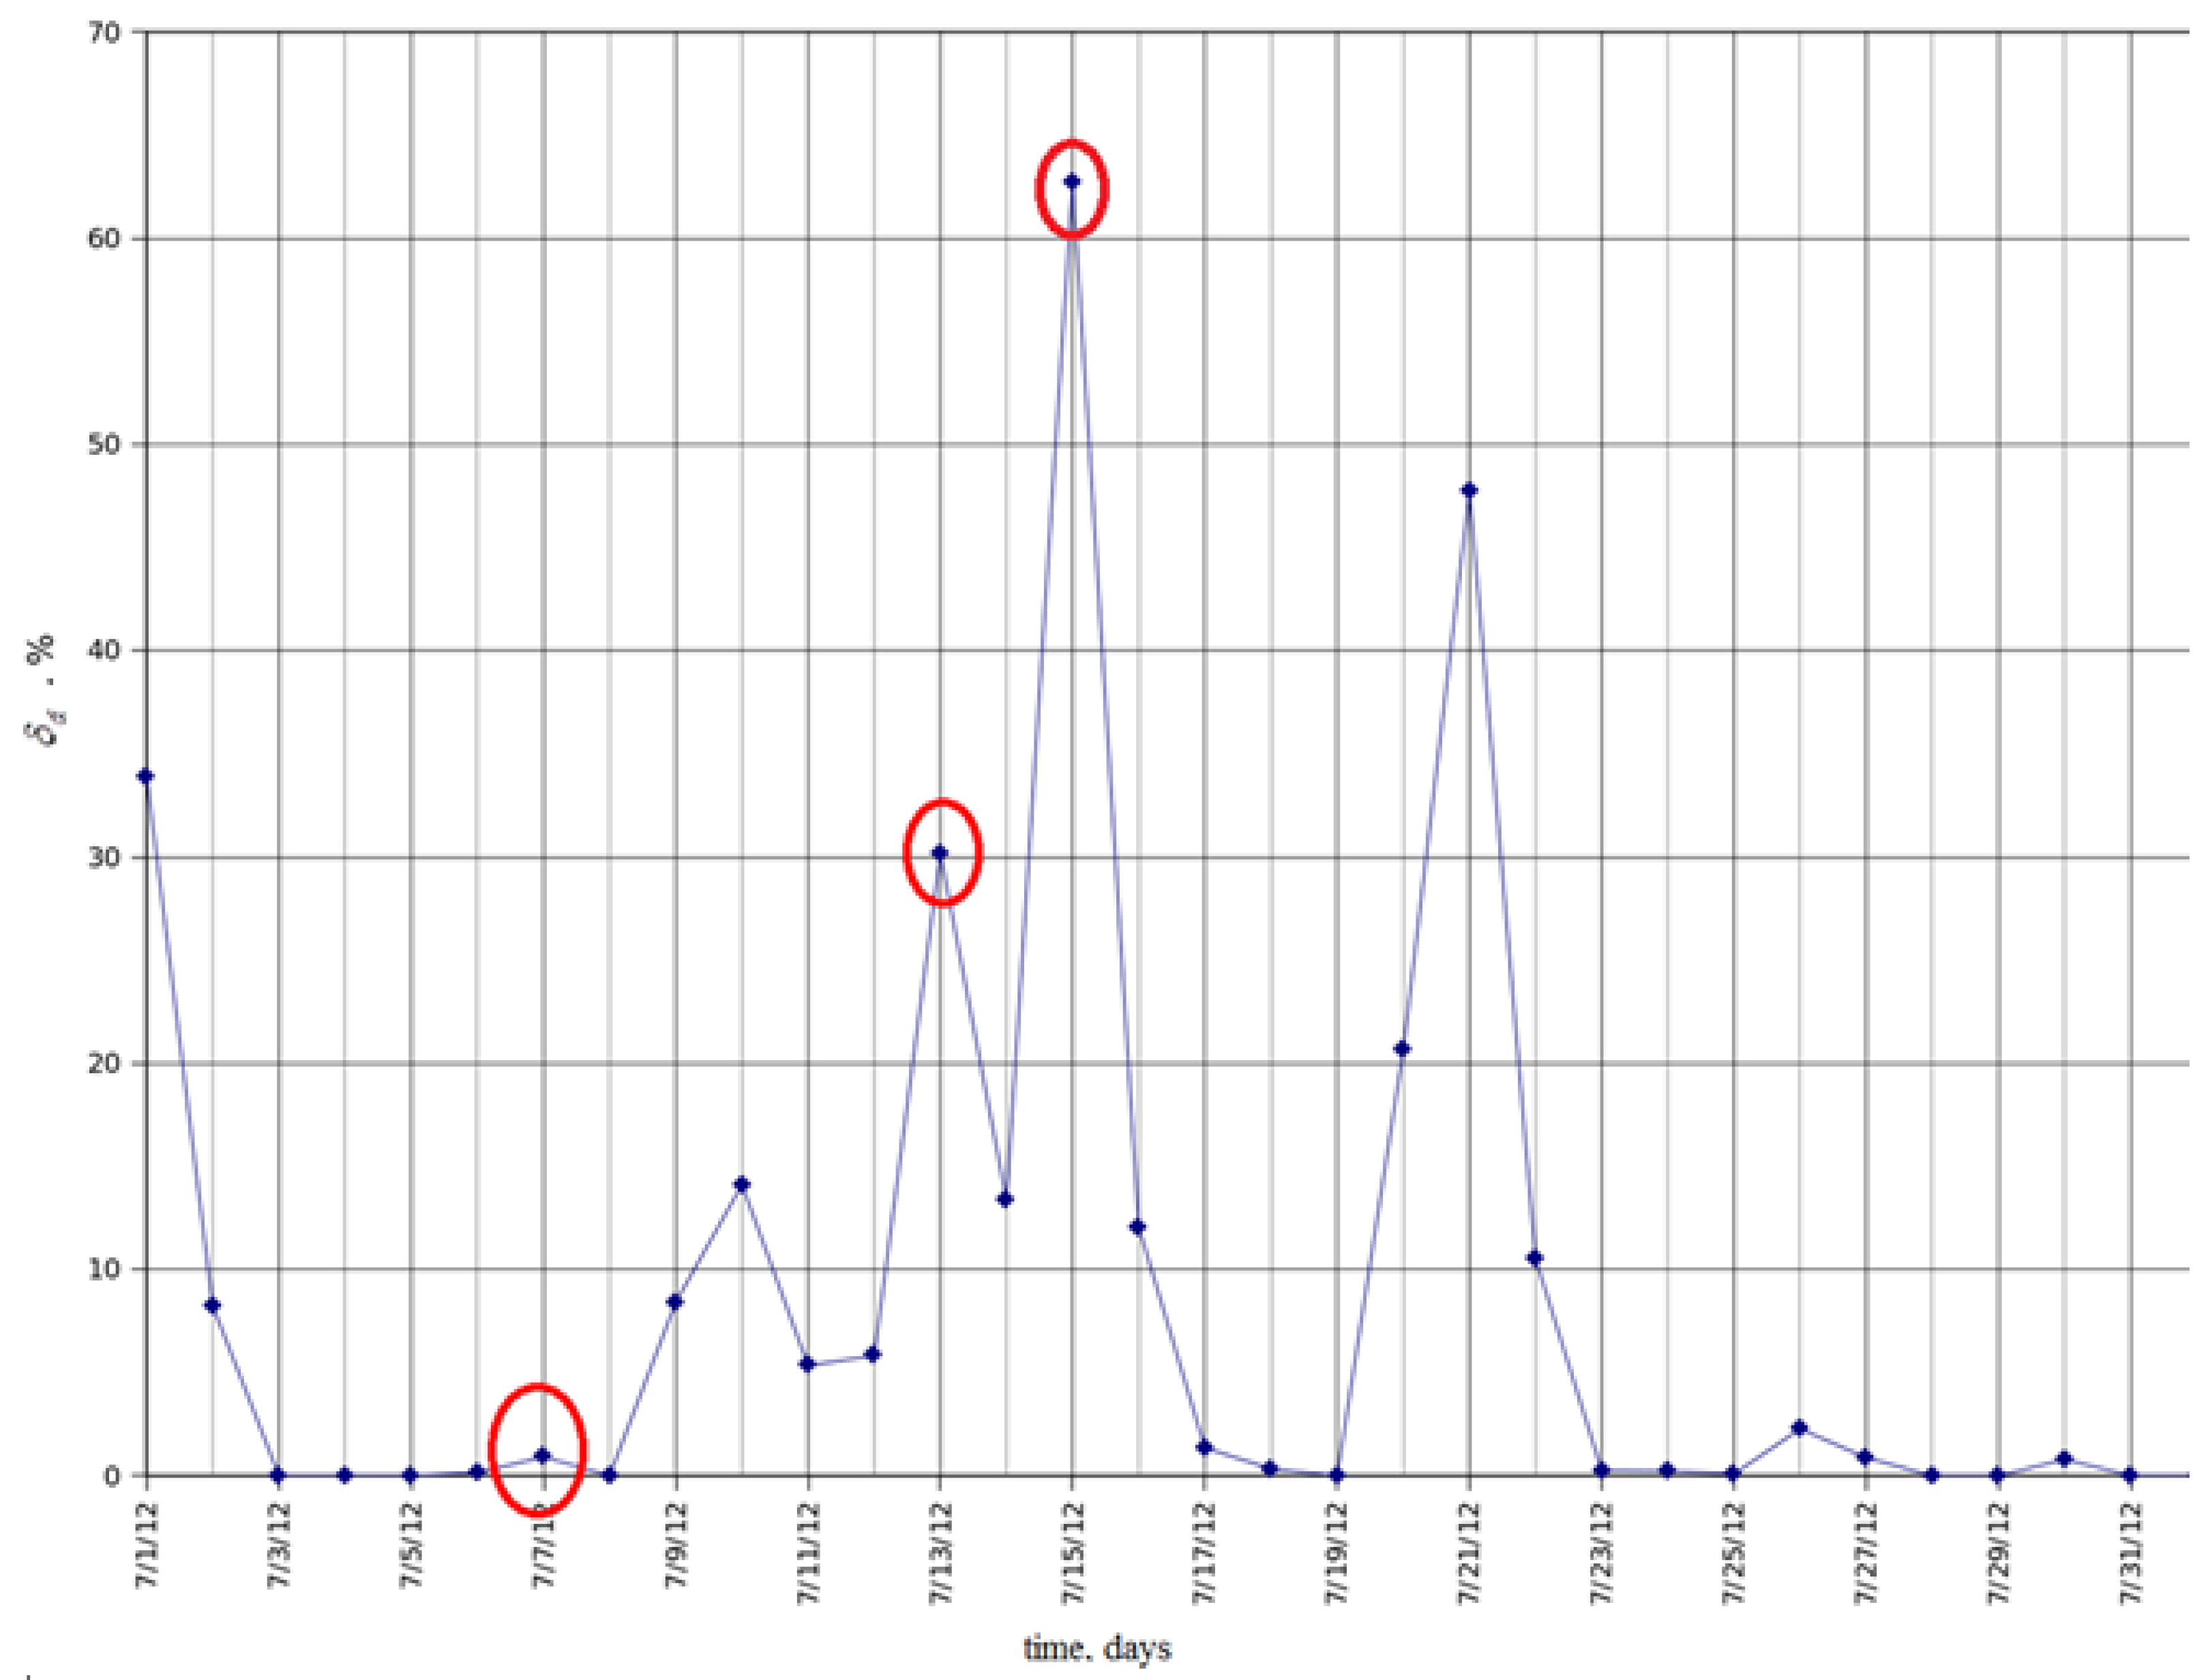
To specify the meteorological situation on the route Kielce–Mykolayiv in
Figure 6, the hourly changes in the duration non-meteor over-the-horizon signals (
) from 13 to 16 July 2012 are shown. The values of
are marked for UT = 13 h 00 m on 13 July 2012 and 15 July 2012.
Therefore, from 3 July 2012 to 9 July 2012, the non-meteor over-the-horizon signals on route Kielce–Mykolayiv were unobserved (
Figure 5). On 7 July 2012, the isosurface was located with height difference
m (see
Table 1,
Figure 4a) and a difference of atmospheric delay
m. Weather conditions at weather stations in the coverage of the reference stations of the ZAKPOS network were stable. This gives reason to believe that the meteorological situation was stable at altitudes of reference stations situated and higher.
Let us give a similar analysis on 13 and 15 July 2012. On 12 July 2012, the duration non-meteor signals was negligible (
Figure 5), but at 6 h of 13 July 2012, their duration has increased drastically (
Figure 6), followed by a decrease. Moreover, from 9 h up to 12 h, they are hardly observed. At 13 h, the duration of the non-meteoric signal reached 30%. At 12 h and 55 m, three isosurfaces of tropospheric delays are constructed. Change in elevation,
(
Table 1), is extremely high,
m. Signals of over-the-horizon FM stations are not classified as meteor and observed until the beginning of the next day.
On 14 July 2012, more stable atmosphere was observed. However, in the first half of the night from 14 to 15 July, the situation changed to a dramatic increase in the duration of non-meteor signals. Thus, 15 July 2012 at UT = 00 h 00 m, a maximum value of
is observed (
Figure 6). In
Figure 4b, the isosurface is constructed on UT = 12 h 55 m, the value of
at this instant of time is 60% (
Figure 6)
m (
Table 1), and
m. From 14 h to 20 h, the duration of non-meteor signals increases drastically and reaches a maximum value.
The considered changes of duration of signals of over-the-horizon FM stations in route Kielce–Mykolayiv, which are not classified as meteor signals, suggest that these signals are likely due to the advent over-refractive perturbations of the refractive index of the troposphere, and, therefore, in some part (if not all) of the coverage of the ZAKPOS network of reference stations, the atmosphere was unstable.
To confirm this conclusion, let us give the description of the meteorological situation observed during this period. In the Transcarpathian region, 7 and 8 July 2012, the weather was overcast with no rain. On 12 July 2012, from UT = 06 h 00 m to UT = 18 h 00 m, there is torrential rain with gusts of wind. On 13 July 2012, there is no rain. On 14 July 2012, in the night, rain was observed at UT = 06 h 00 m, and then no rain existed. On 15 July 2012, there were gusts of wind, storm, rain, thunder, and hail in the Transcarpathian region.
The Transcarpathian hydrometeorology center reported this fact. On 12 July 2012 in the Berezny district, the strong squally winds have damaged 200 roofs and ripped electrical wires. Then, a cyclonic vortex from the Carpathian Mountains passed into the territory of the Ivano–Frankifsk region and further east. Thus, there were damages in five regions in Ukraine. Therefore, the Lviv Meteorological Center always takes the storm warning from Uzhhorod forecasters into account. This situation according to experts happens every 2–3 years.
Thus, by constructing isosurfaces of tropospheric delays at the time of the observations, we can determine the area of stable atmospheric conditions at altitudes during a certain time interval.
If constructed isosurfaces indicate spatiotemporal instability of the atmosphere, the power of which increases in time, and IPWV is high, tropospheric disturbances transfer over a given territory. We conclude that the dynamic map of isosurfaces of over the network of reference stations makes it possible to predict not only the spherically symmetric state of the troposphere, but also the appearance and movement of tropospheric disturbances. 4D fields of tropospheric delay can be used to predict natural disasters, i.e., to apply for the purposes of meteorology.
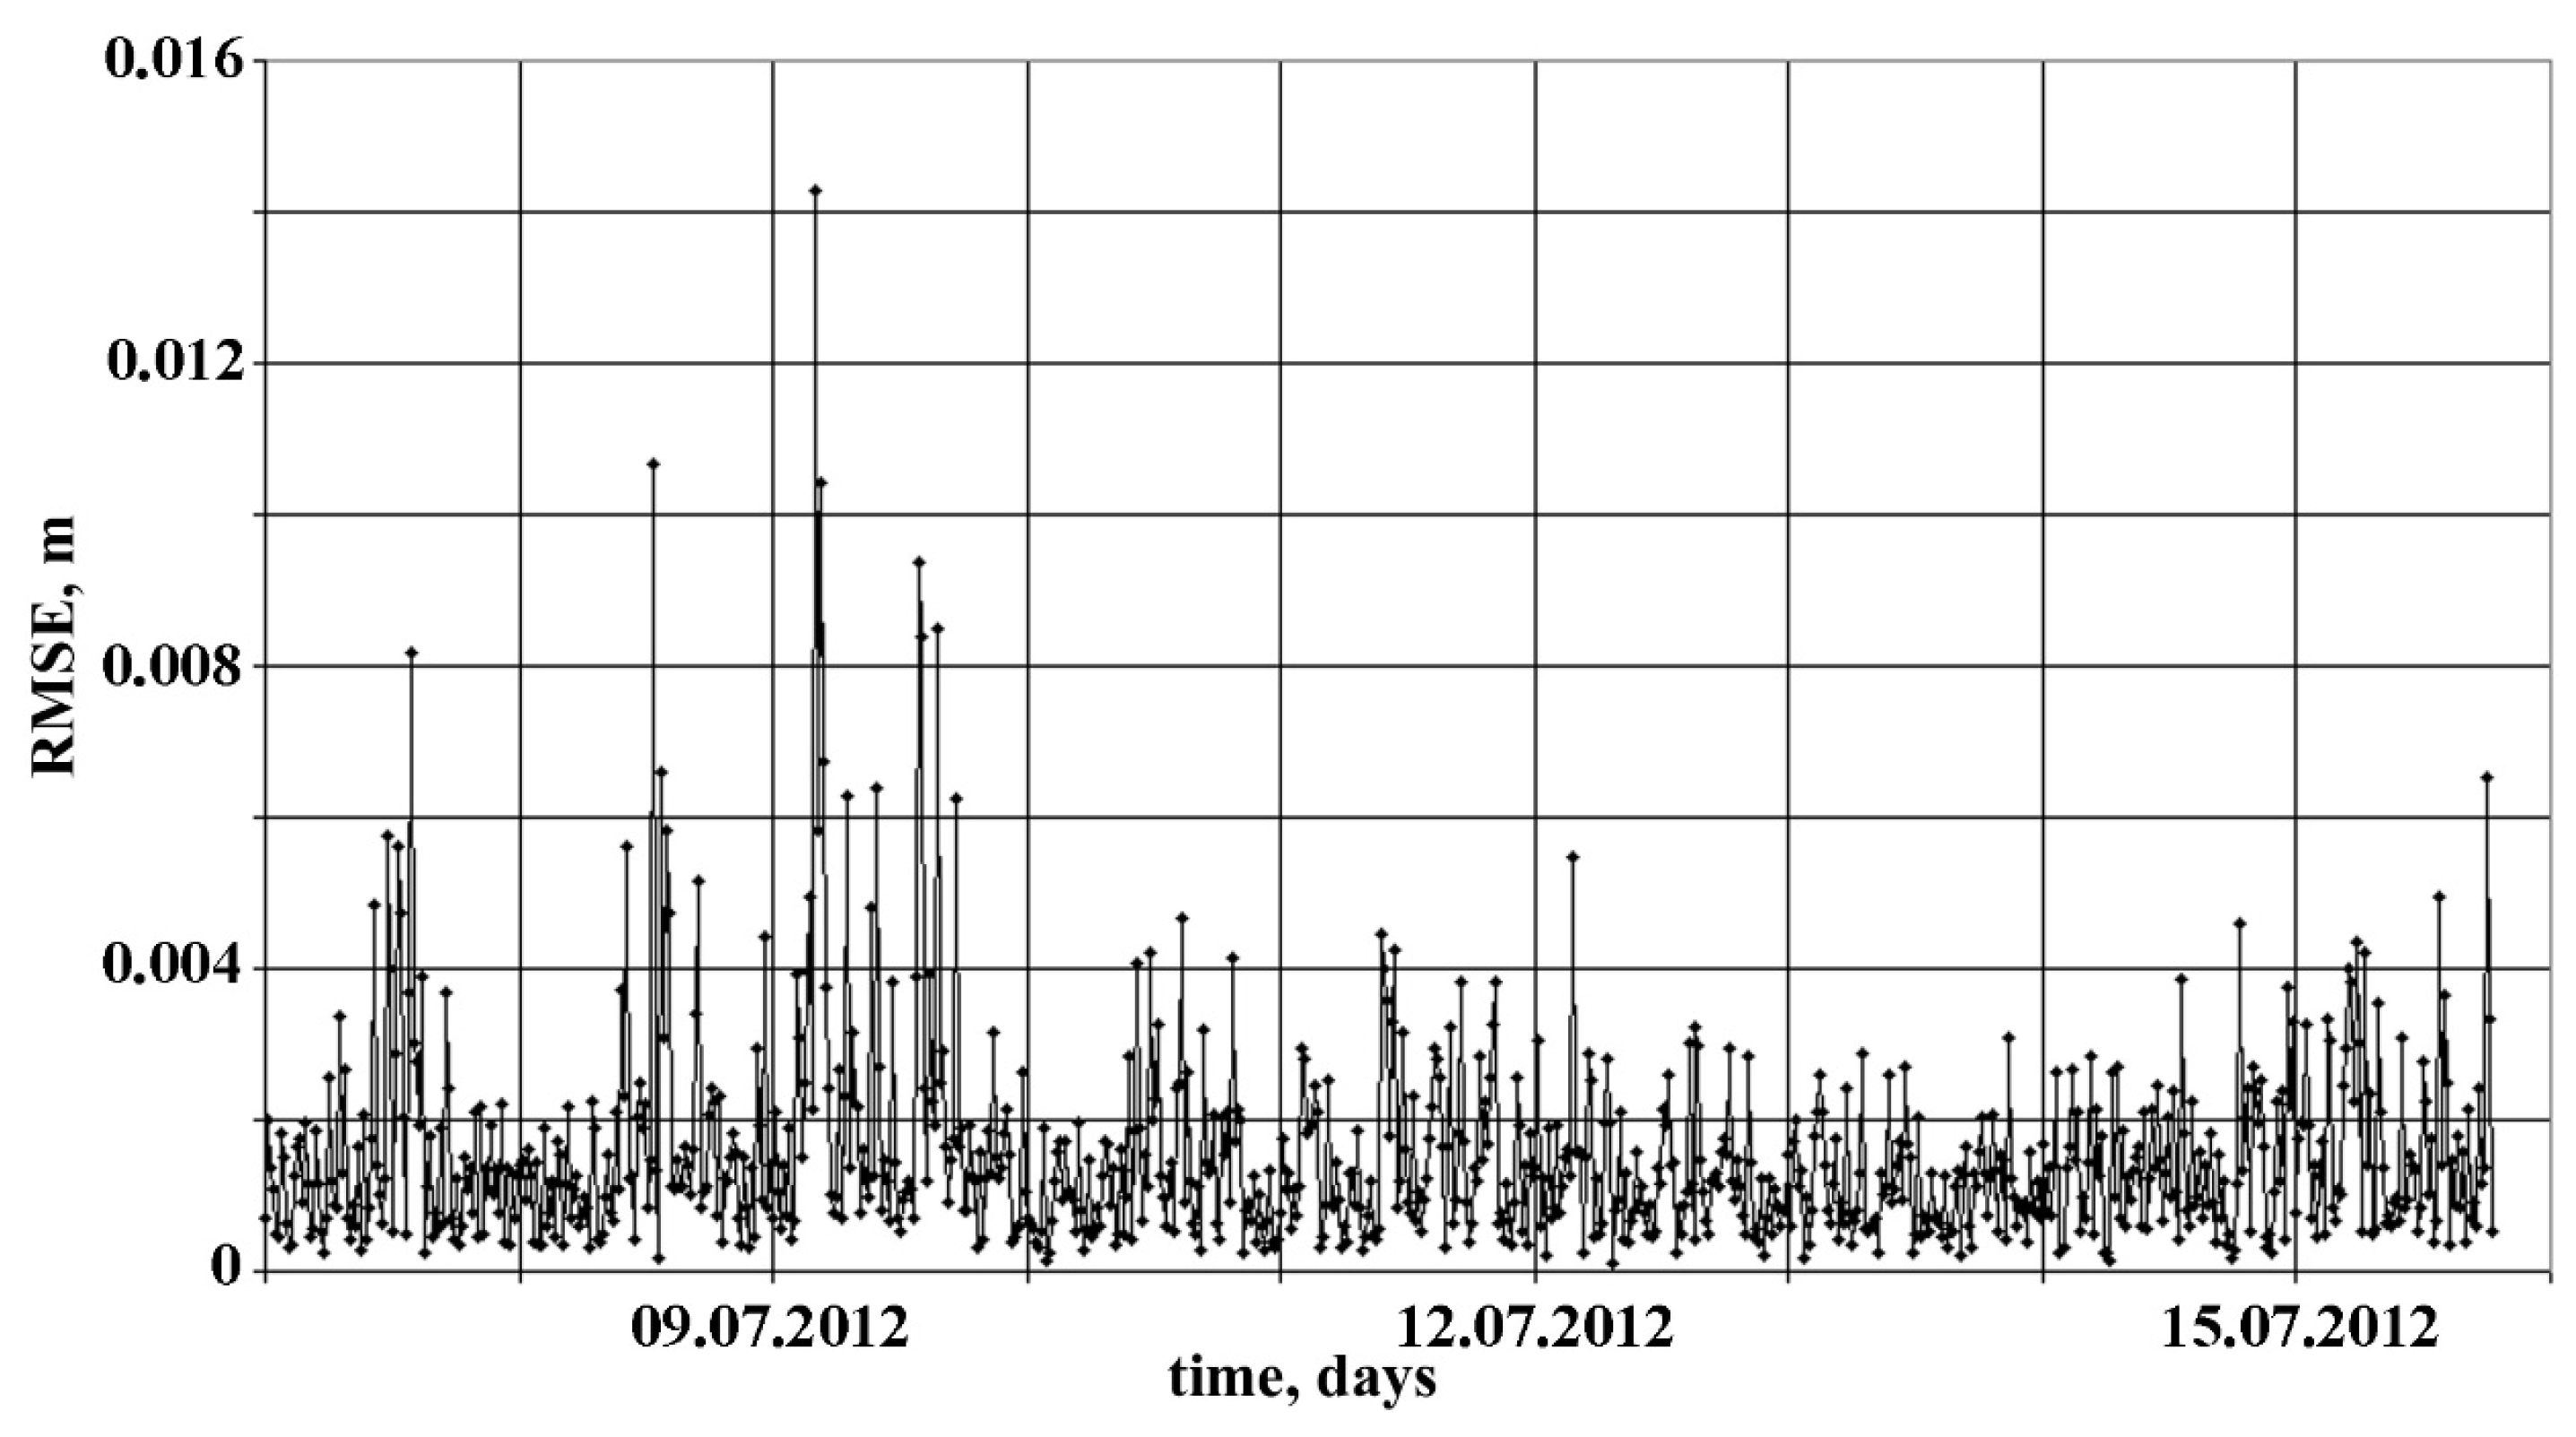
Estimating the accuracy of approximation methods was carried out as follows. We selected 20 stations in the ZAKPOS/UA-EUPOS network. Excluding consistently one of the stations HUST, MIZG, MUKA, RAHI, and VBER, we sought coefficients
,
,
,
(or
,
,
,
) using ZTDs at the other 19 stations (
i.e. the ZTD of the selected station was not taken into account). Then, we calculated the ZTD of this station by means of Equation (4) (or (5)) and compared it with the ZTD measured. An example of RMSE (root mean square error) distributions is shown in
Figure 7. As can be seen, maximal RMSE does not exceed 1.5 cm, and the average RMSE is about 1.5 mm, which is very good accuracy. A similar accuracy was also observed for other stations.
This study and joint work of Uzhhorod National University (Uzhhorod, Ukraine) together with partners: University of Miskolc (Miskolc, Hungary), Vihorlat Observatory (Humenne, Slovakia), the Center for Association Research, Innovation and Technology Transfer “NORDTech” (Baia-Mare, Romania), the International Association of Institutions for Regional Development “IARDI” (Uzhhorod, Ukraine), have resulted in the international project HUSKROUA/1101/252 “Space Emergency System, a cross-border system for the prediction of natural disaster incidents on the basis of the exploitation of satellite technologies in Hungary, Slovakia, Romania, and Ukraine” in the framework of the Cross Border Cooperation Programme HU-SK-RO-UA 2007–2013. It started on 1 January 2014 and finished on 31 December 2015. This project aims to address the problem of the untimely prediction of occurrence of natural emergencies in cross-border regions of Hungary, Slovakia, Romania, and Ukraine.
4. Conclusions
The surface changes of tropospheric delay based on the data of 18 reference stations and interpolation methods to determine the tropospheric delay of 200,000 nodal points of a regular planned altitude grid in the example of the Transcarpathian region was constructed. This method of building surfaces of tropospheric delay changes can be applied to any area covered by the GNSS network of reference stations. The results of this research have shown that the mean error of spatial interpolation is about 2 cm with a standard deviation of 0.2 cm within the coverage territory. For the first time, the technology for constructing the isosurface of tropospheric delay is elaborated. The idea of this technology is to find the heights of reference stations having identical values of the tropospheric delays. The dynamic map of the isosurface of the reference station coverage territory makes it possible to predict the occurrence and movement of tropospheric disturbances. 4D field tropospheric delay can be used to predict natural disasters.
A comparative analysis of changes in height differences of the isosurface of tropospheric delay and the duration non-meteor signals of over-the-horizon FM stations registered on the route Kielce–Nicholas from 7 to 15 July 2012 showed that the most likely cause of most of the occurrences of such signals is super-refractive perturbations caused by the refractive index of the troposphere due to intense meteorological processes observed during this time at radio-road Kielce–Mykolayiv.
Operation of this approach, full automatization, and the absence of supplies in the work of remote sounding open opportunities for the wide implementation in practice of operational control of the atmosphere to enhance the detailing of data and improve the accuracy of regional short-term weather forecasts.
Remote monitoring of the atmosphere creates a powerful system and basis for cross-border cooperation in the direction of improving the prediction accuracy of severe weather events in cross-border area (e.g., heavy rains, snowing, hail, icing, strong squalls, etc.), forecasts of dangerous natural phenomena (e.g., floods, mudslides, landslides, avalanches in mountains, etc.), and possible environmental threats associated therewith (e.g., ingress of sewage into the river, sources of drinking water, the threat of dangerous infections, air pollution, environmental disasters, etc.) because enlarging the study area leads to a more accurate forecast. Therefore, the system of remote monitoring of the atmosphere created in the framework of HUSKROUA/1101/252 project ensures sustainable development of the entire Carpathian region.


