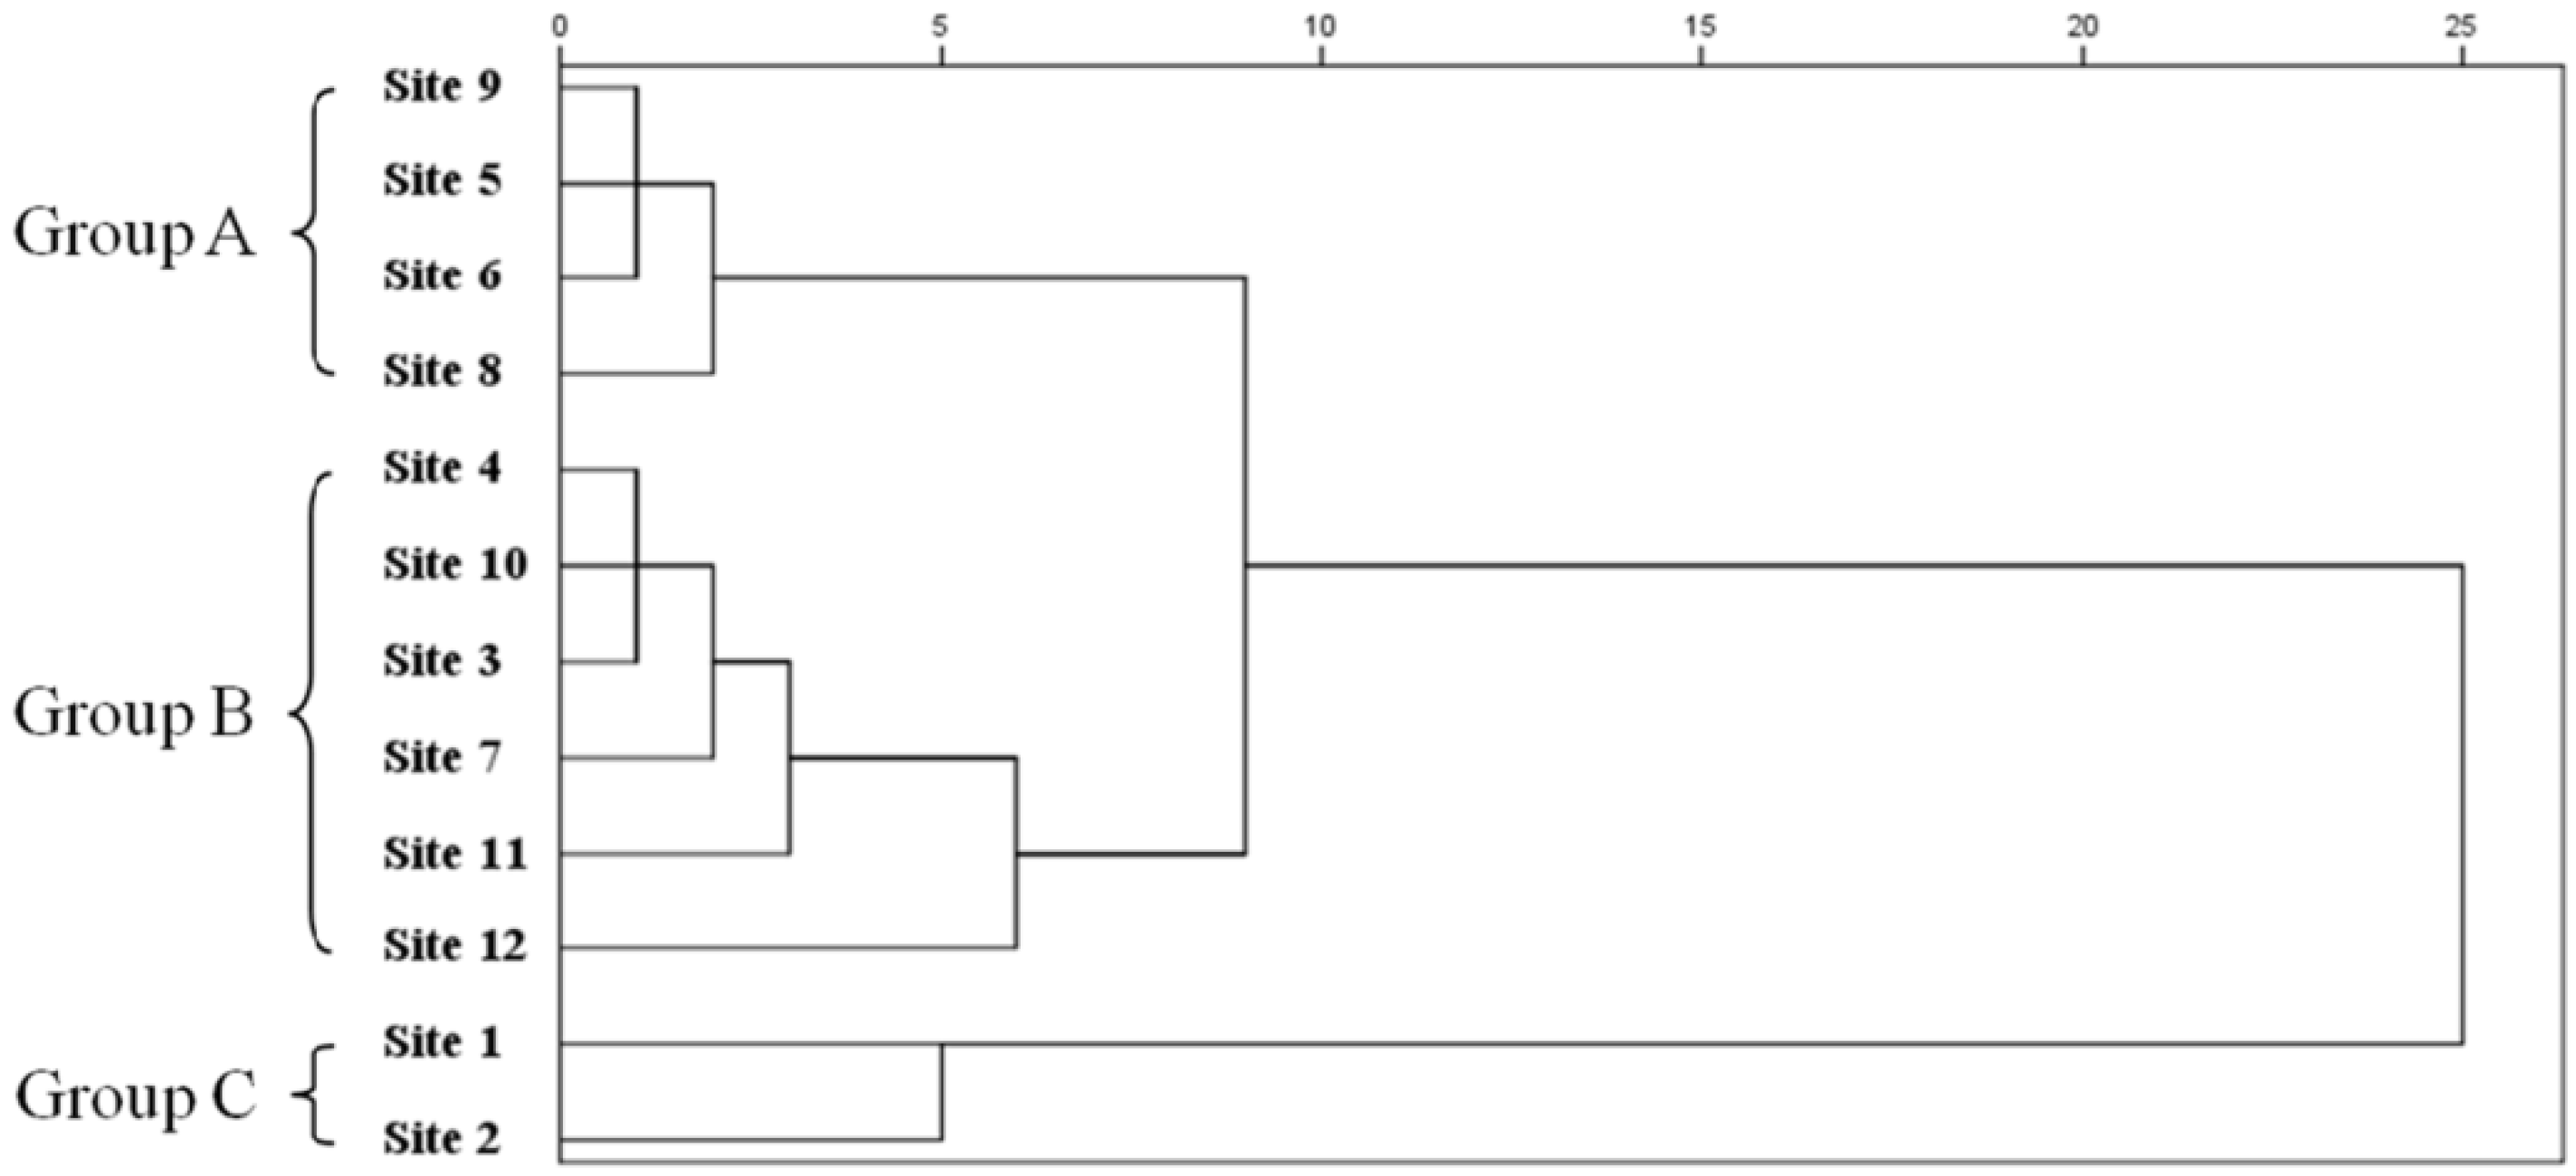
3.2. Cluster Analysis
The 12 sampling sites were clustered through CA process into groups A, B and C (
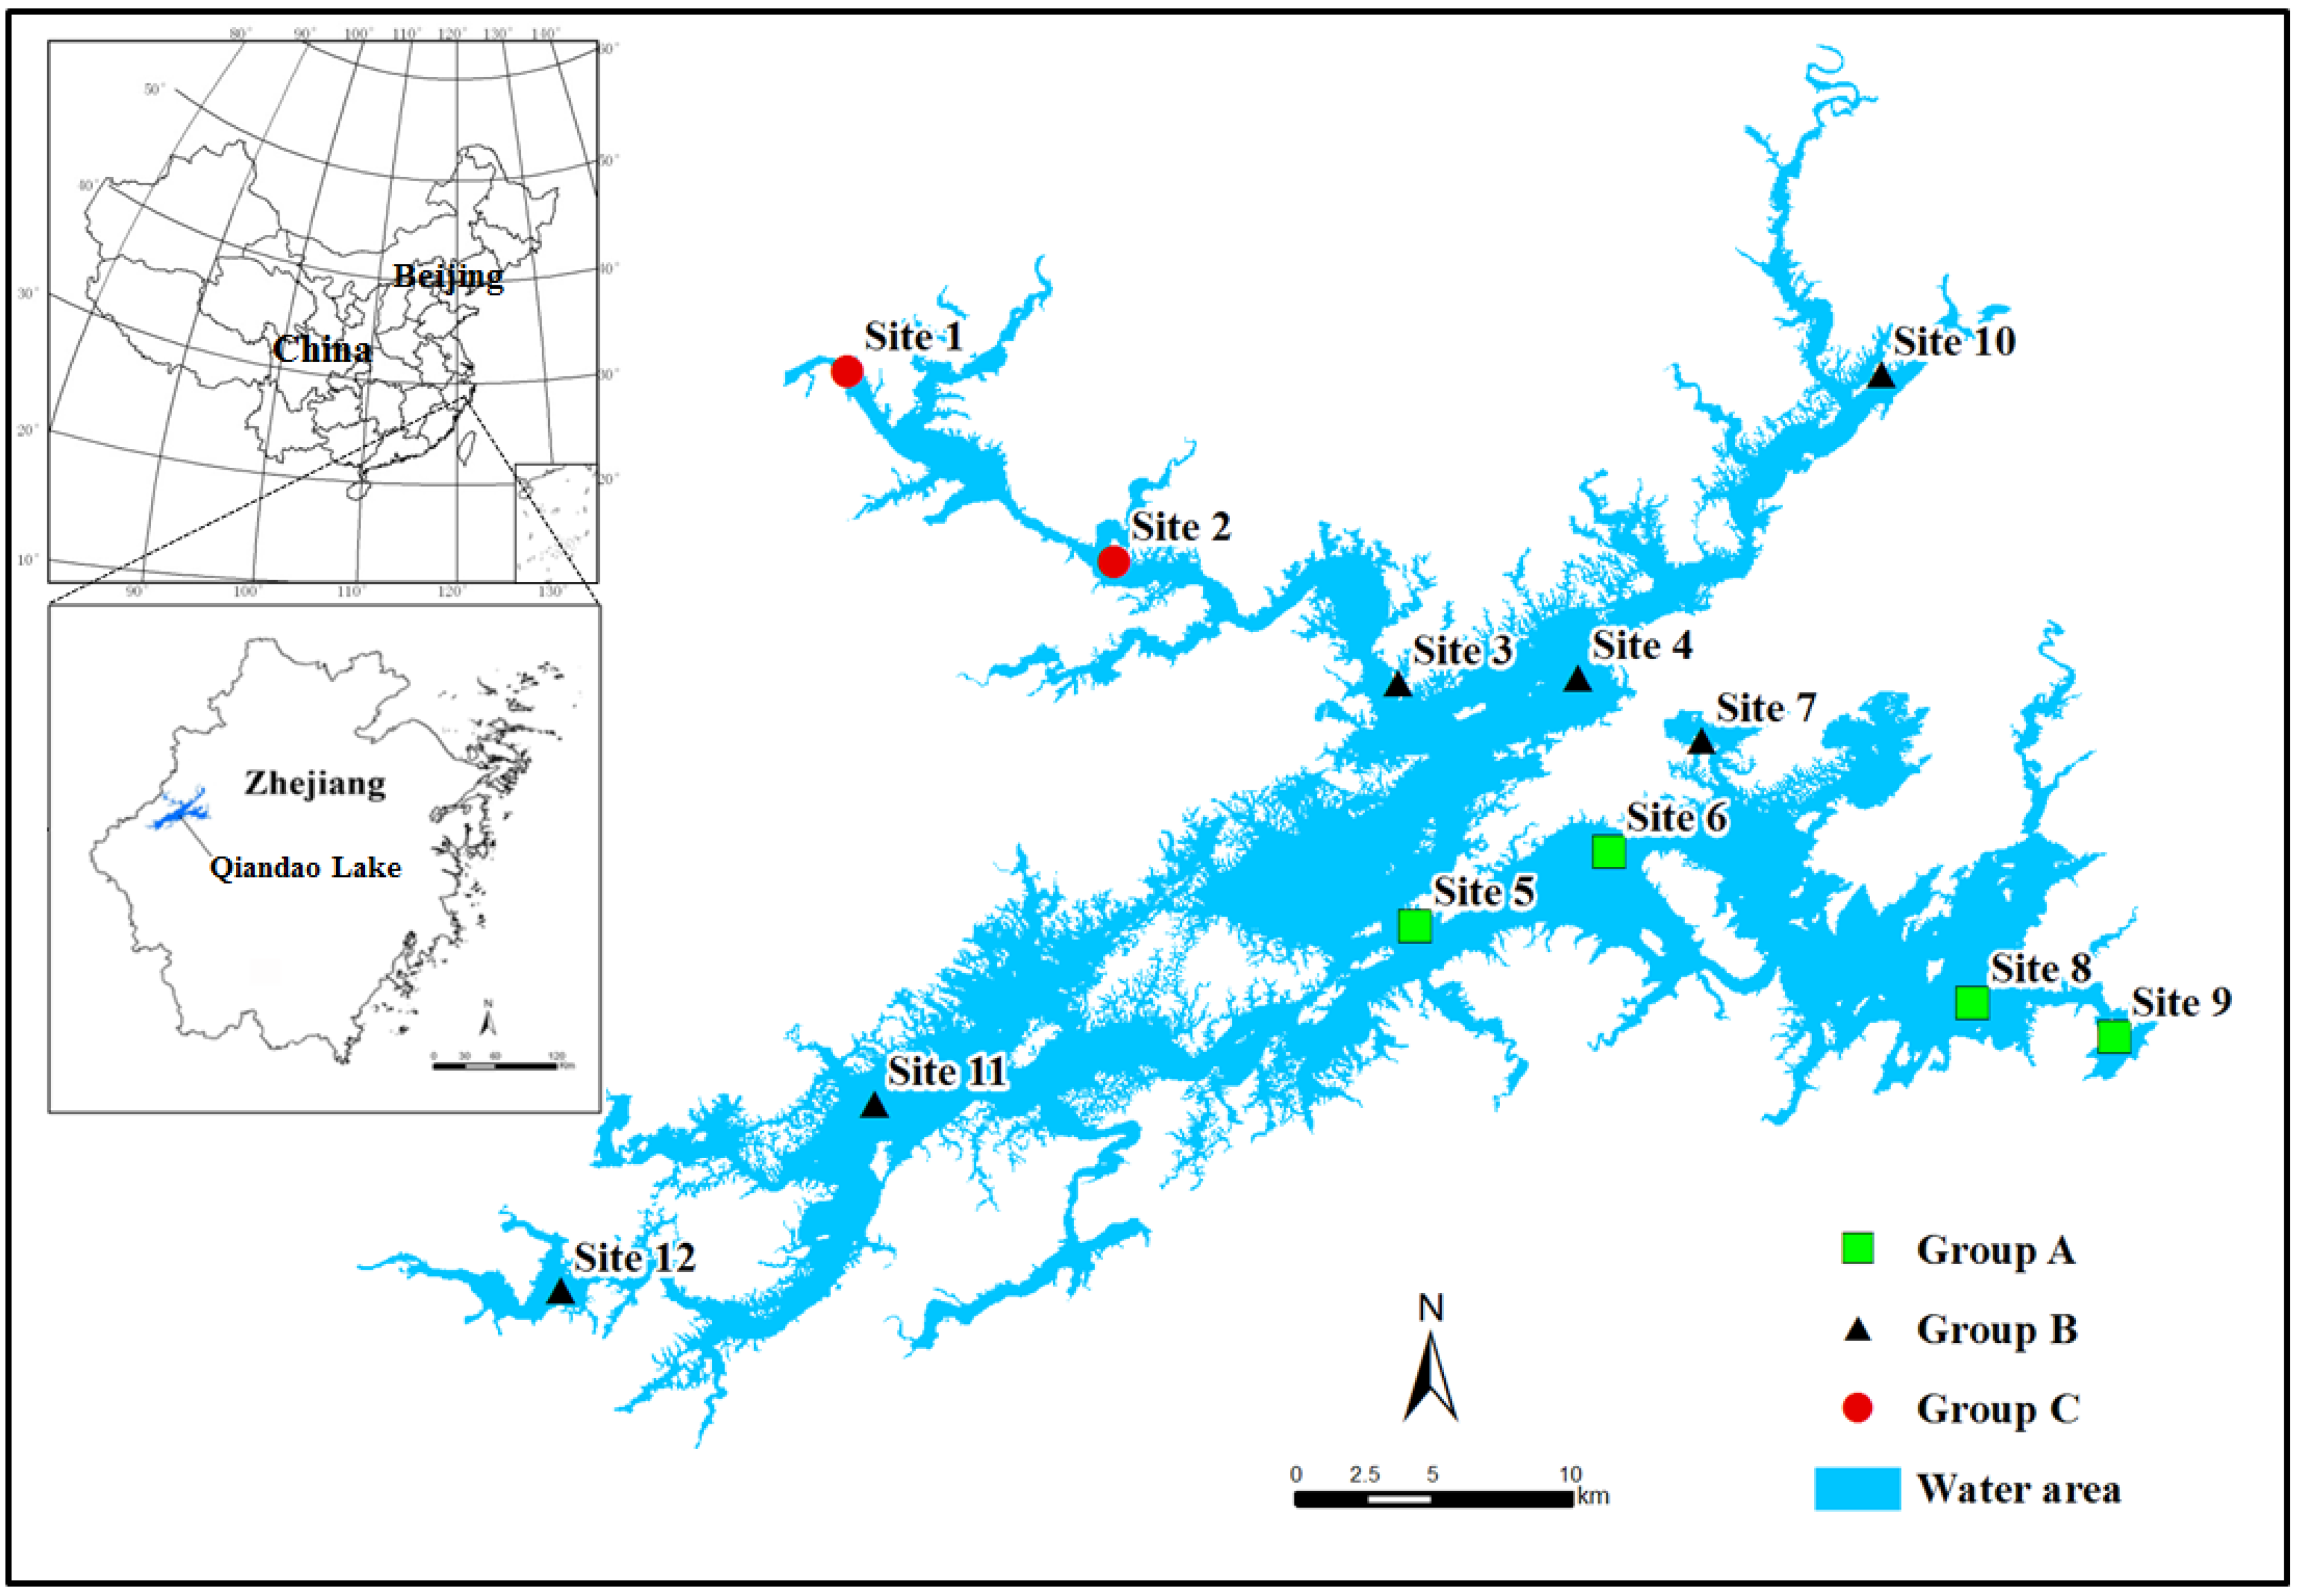
Figure 2). Group A included four sites (sites 9, 5, 6 and 8), Group B included six sites (sites 4, 10, 3, 7, 11 and 12), and group C consisted of two sites (sites 1 and 2). As shown in
Figure 1, sites in Group A were situated near the center and the outflow of Qiandao Lake, corresponding to low-pollution regions. The sites in Group B were distributed from northeast to southwest of the lake, corresponding to moderate-pollution regions. The Group C sites were located in areas of high-risk pollution, where they accepted pollutants mostly from inflow from the Xin’an Jiang River. Site 1 presented the highest average values of most parameters, especially Chl-a, TN, TP and NH
3-N. Overall, water quality presented a tendency of improvement from the inflow to the outflow of the lake.
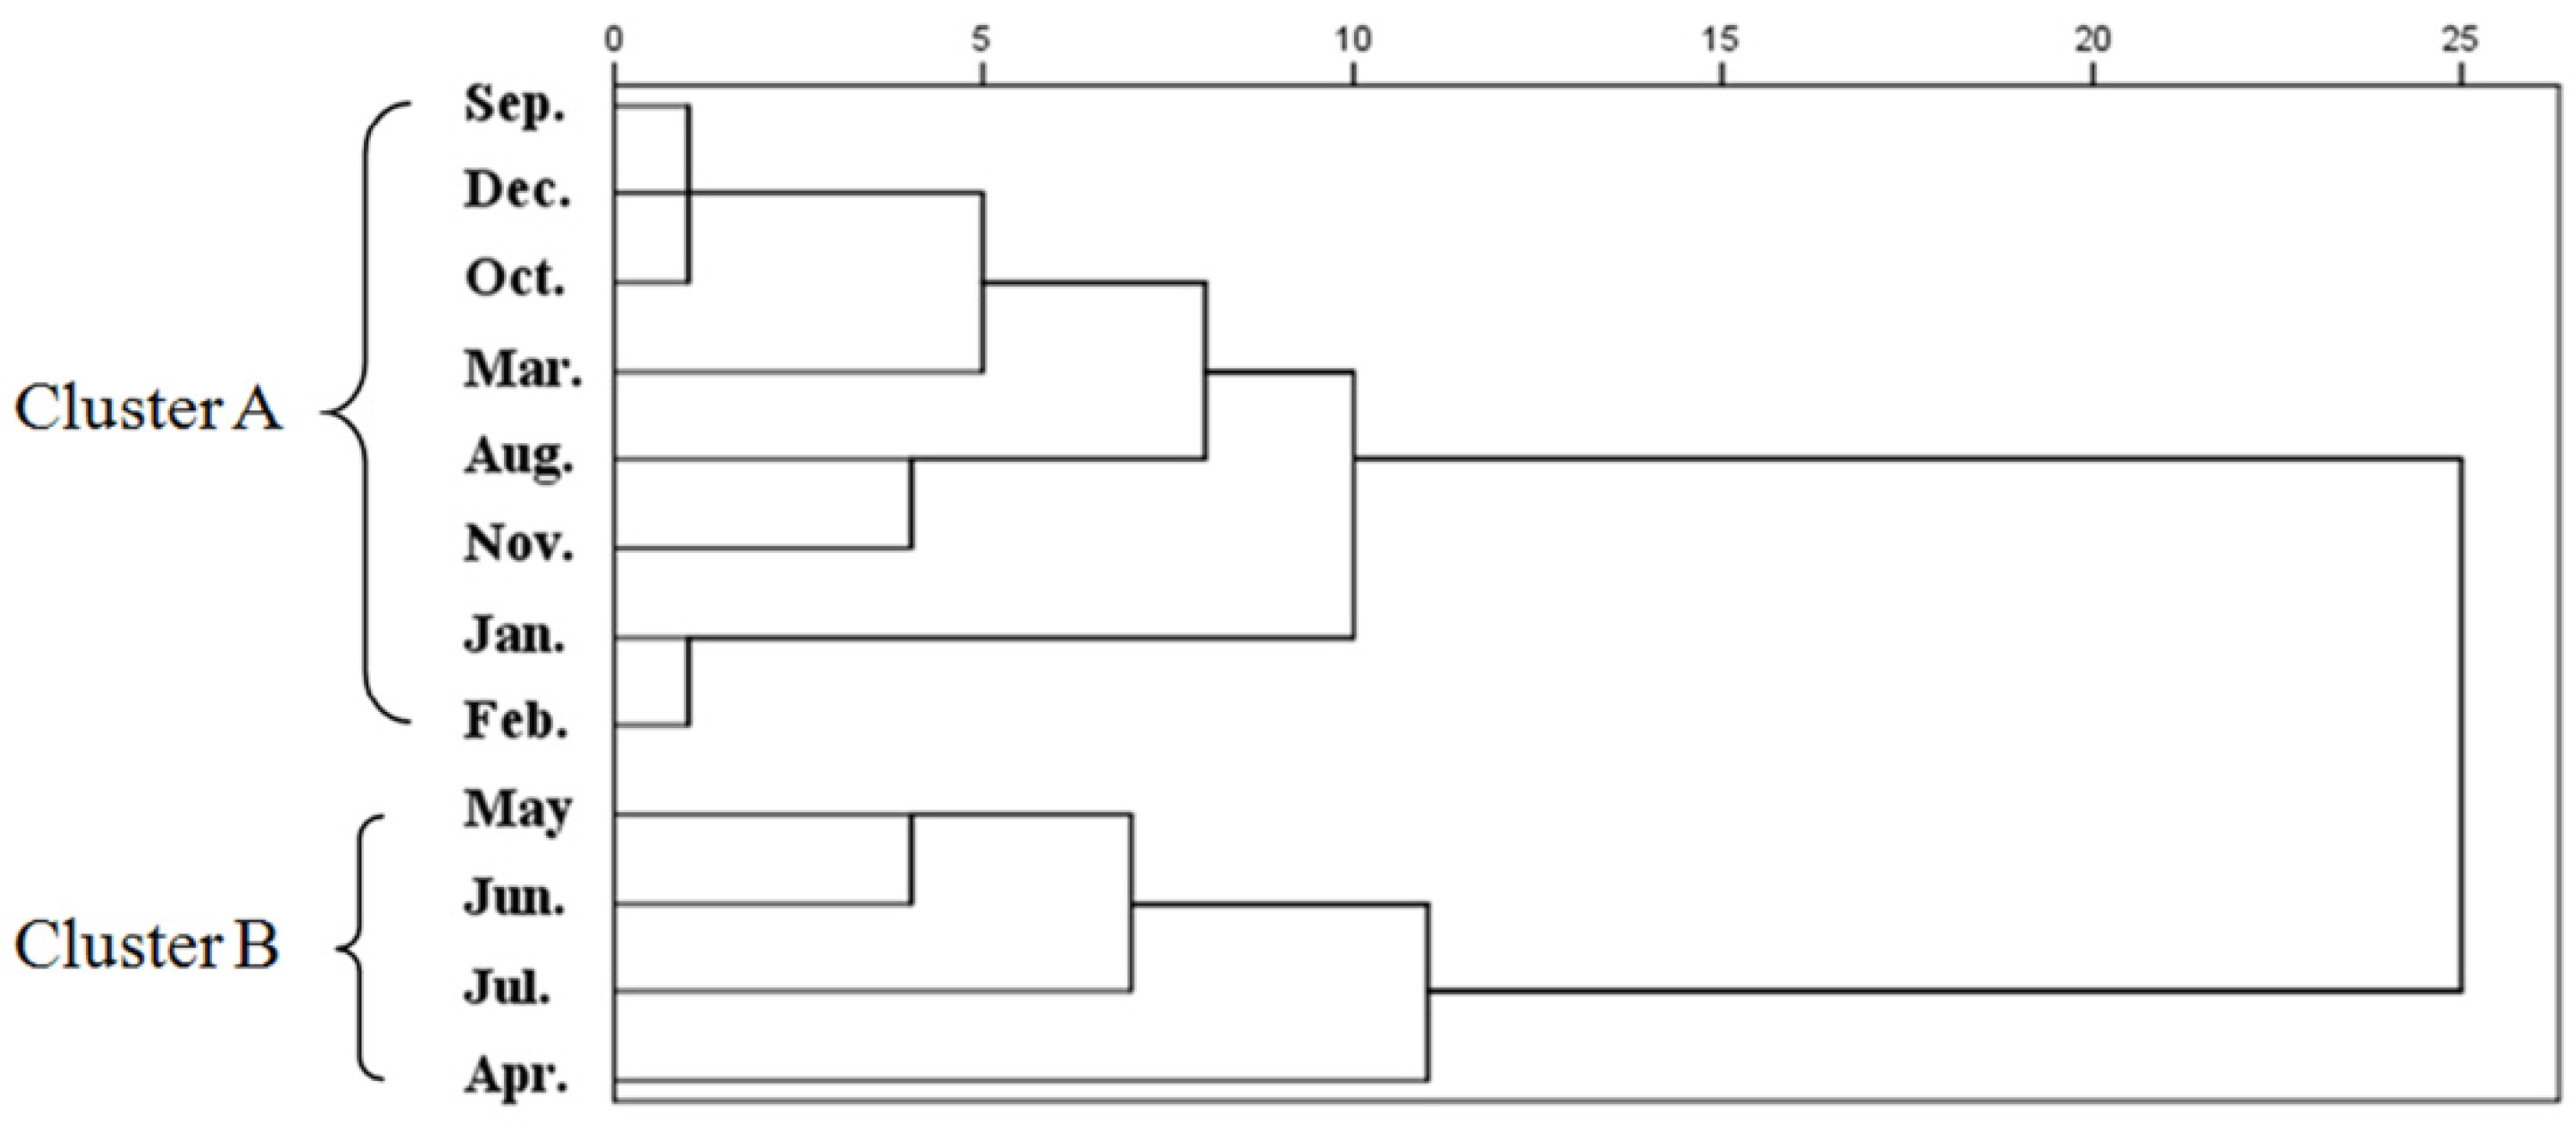
Temporal CA clustered the 12 sampling months into two groups, as presented by the dendrogram (
Figure 3). Cluster A consisted of six months (January, February, March, August, September, October, November, and December), corresponding approximately to the drought period in the study area (September to February). Cluster B consisted of four months (April, May, June, and July), roughly equal to the wet period (March to August). Thus, 12 months were classified into two clusters by the actual water quality rather than the drought/wet period. This partition of sampling periods is more practical because the water quality variation was not strictly consistent with the natural seasons and the drought/wet period.
3.3. Discriminant Analysis
To characterize the temporal pattern of water quality among the four years, DA was applied to recognize the most significant discriminant parameters according to the differences between the years. The values of Wilk’lambda, chi-square and p-level for each discriminant function are shown in
Table 3, where the values of Wilk’lambda varied between 0.091 and 0.943, chi-square varied between 5.7 and 118.3, and the p-levels were below 0.01, denoting that the DA performance was statistically meaningful. The proposed three modes of DA were performed on the raw data, from which the discriminant functions (DFs) were obtained, as shown in
Table 4. The DFs constructed by standard DA mode, including all of the nine independent variables, produced the classification matrices (CMs), rightly identifying 87.5% of the cases. The coefficients for the FC were zero. The DFs obtained through the forward-stepwise mode, selecting SD, DO, COD
Mn, TN and TP as the discriminant parameters, generated CMs identifying 81.4% of the cases rightly. The DFs constructed by the backward-stepwise DA mode provided CMs with 79.9% correct assignations using SD, DO, COD
Mn and TP as the discriminant variables. Therefore, the parameters SD, DO, COD
Mn and TP were the most significant expected to interpret the temporal variations in water quality during the study years.
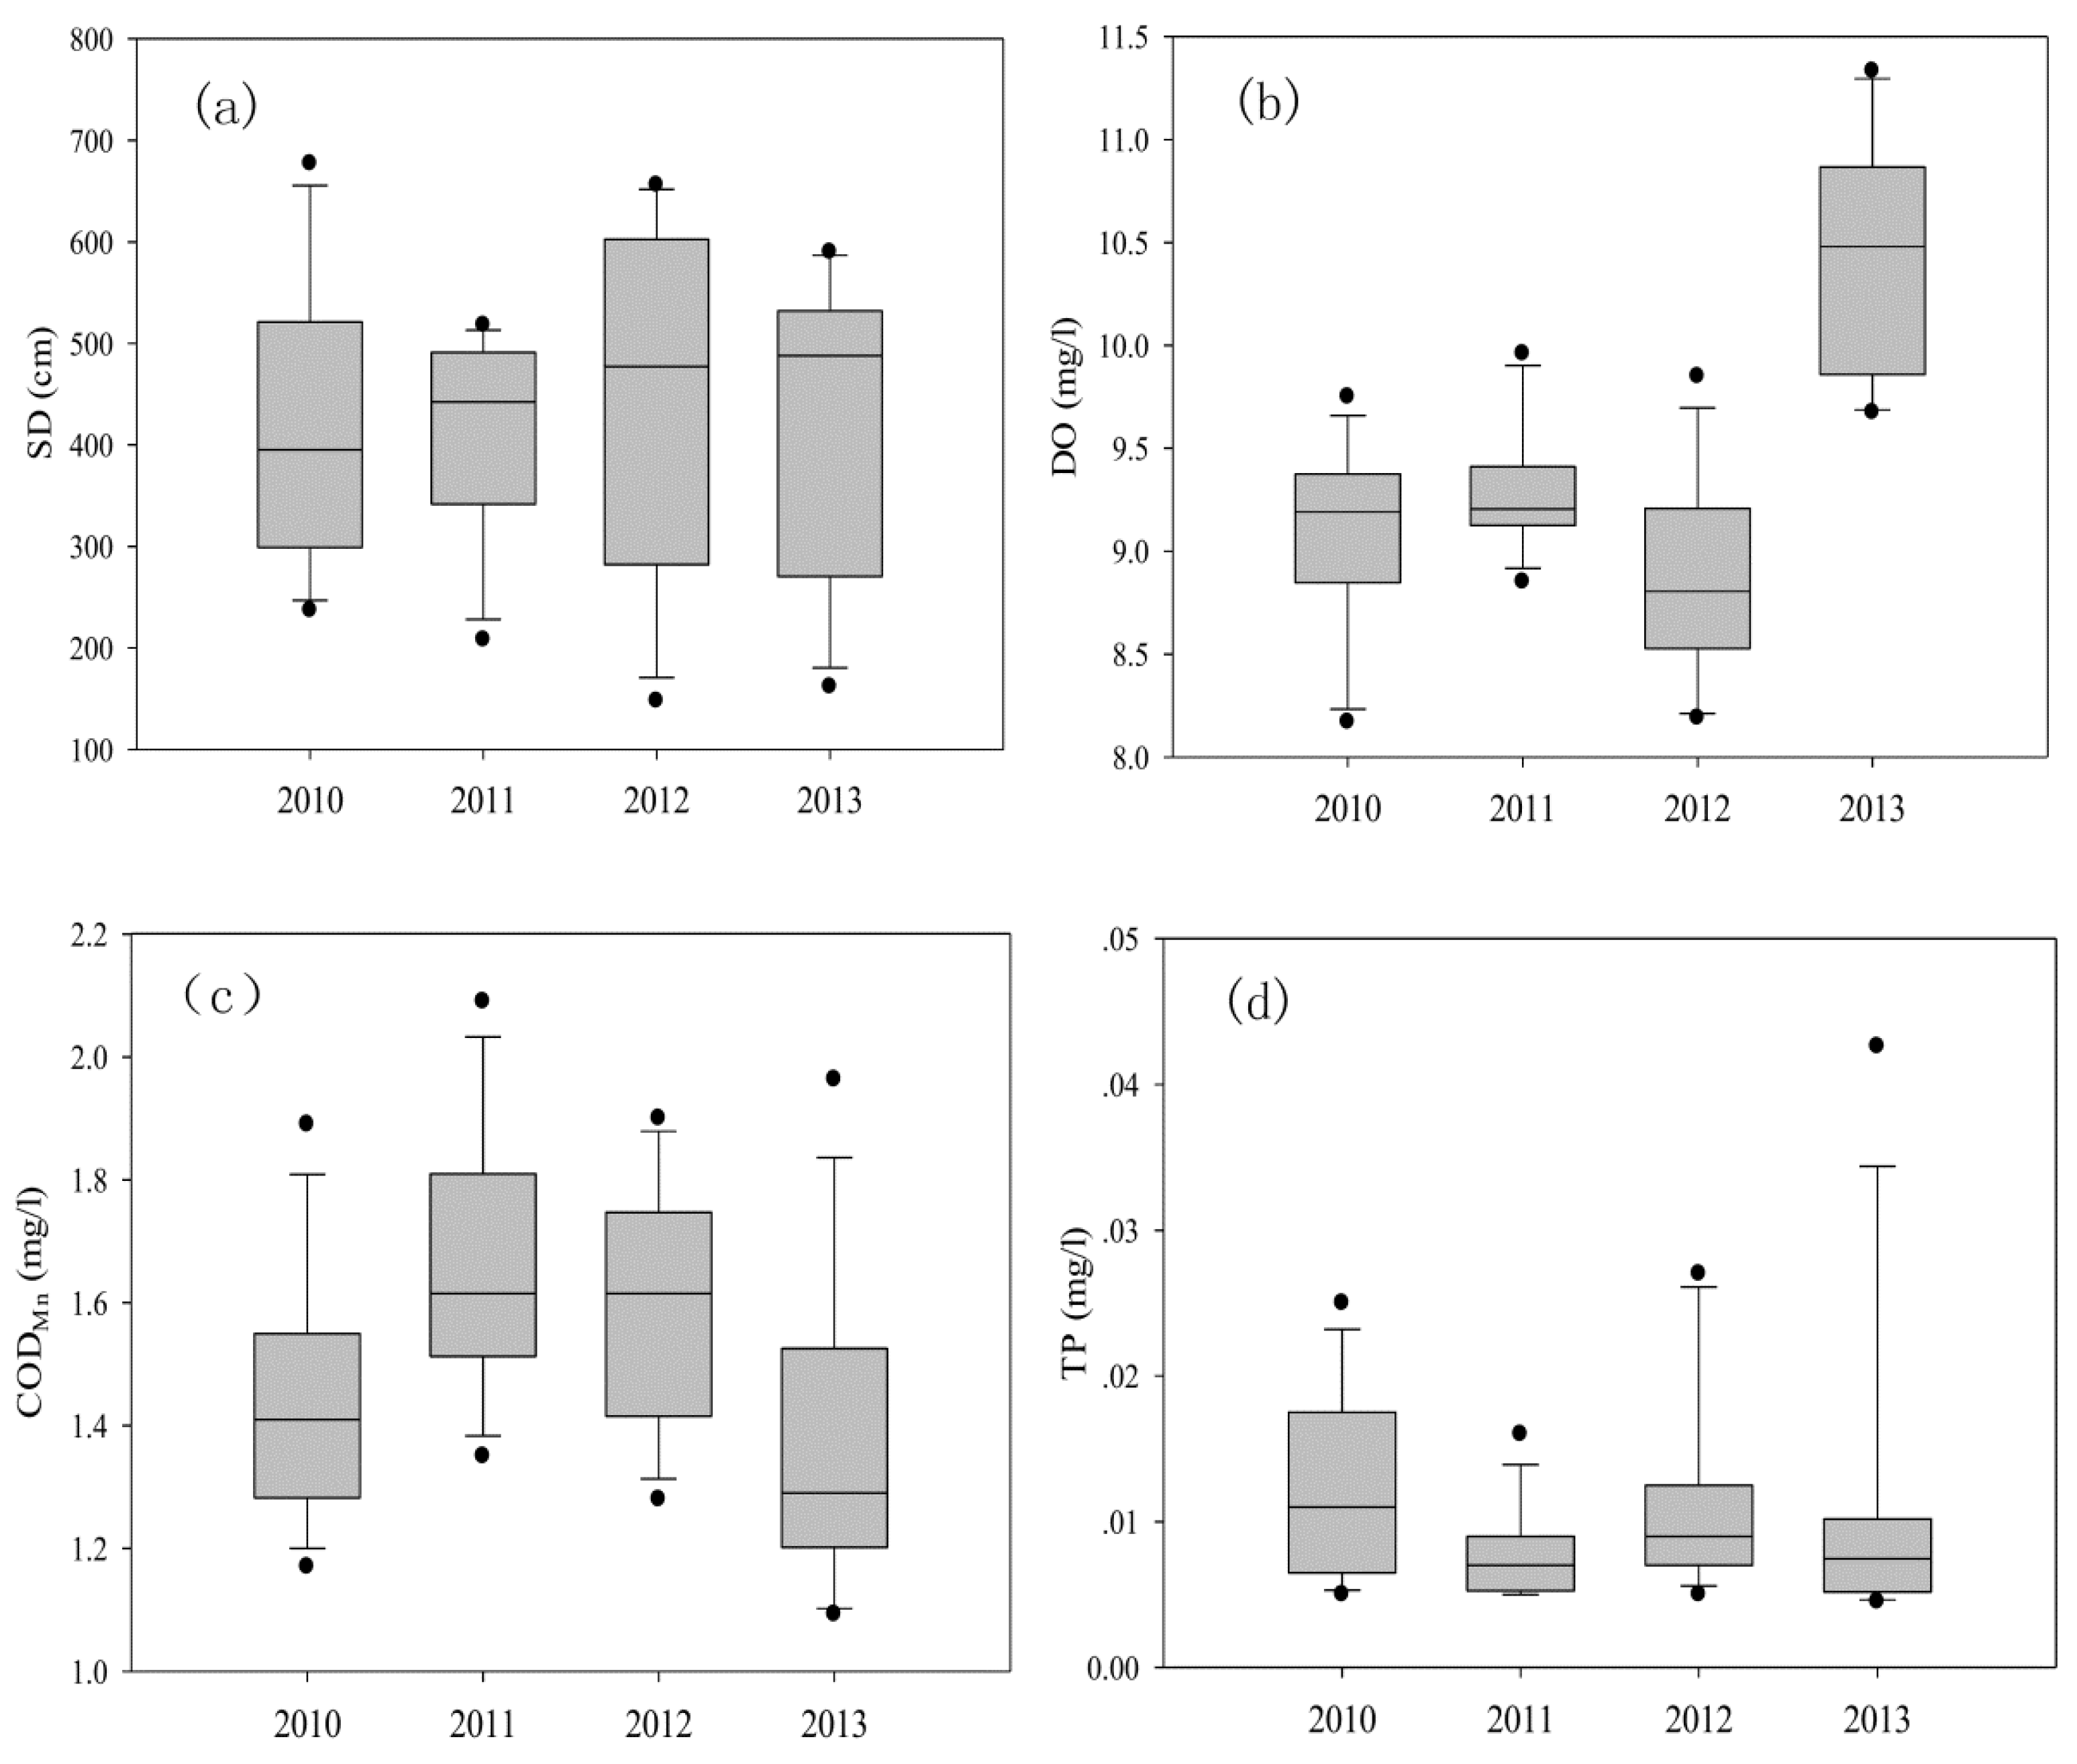
Figure 4 shows the temporal trend of the four discriminant variables obtained through DA. The variation in SD was larger in 2012 compared with the other three years, and significant sudden changes were not detected. The concentration of DO was higher in 2011, with a smaller variation than in 2010, and it was highest in 2012. The concentration of COD
Mn was observed to be the highest in 2011, and then it declined from 2011 to 2013. The trend for TP showed that the variation in 2011 was the smallest, followed by 2010 and 2012, and it was the largest in 2013. According to the tendencies of the four parameters during 2010 to 2013, the water quality in 2013 was somewhat superior compared with 2010.
Temporal DA was applied to the two clusters (Cluster A and Cluster B) obtained through CA to recognize the most significant discriminant water quality parameters among the sampling periods. The values of Wilk’lambda and chi-square and the p-levels showed in
Table 5 indicate that the DA performance was statistically meaningful. The DFs yielded from the different modes of DA are shown in
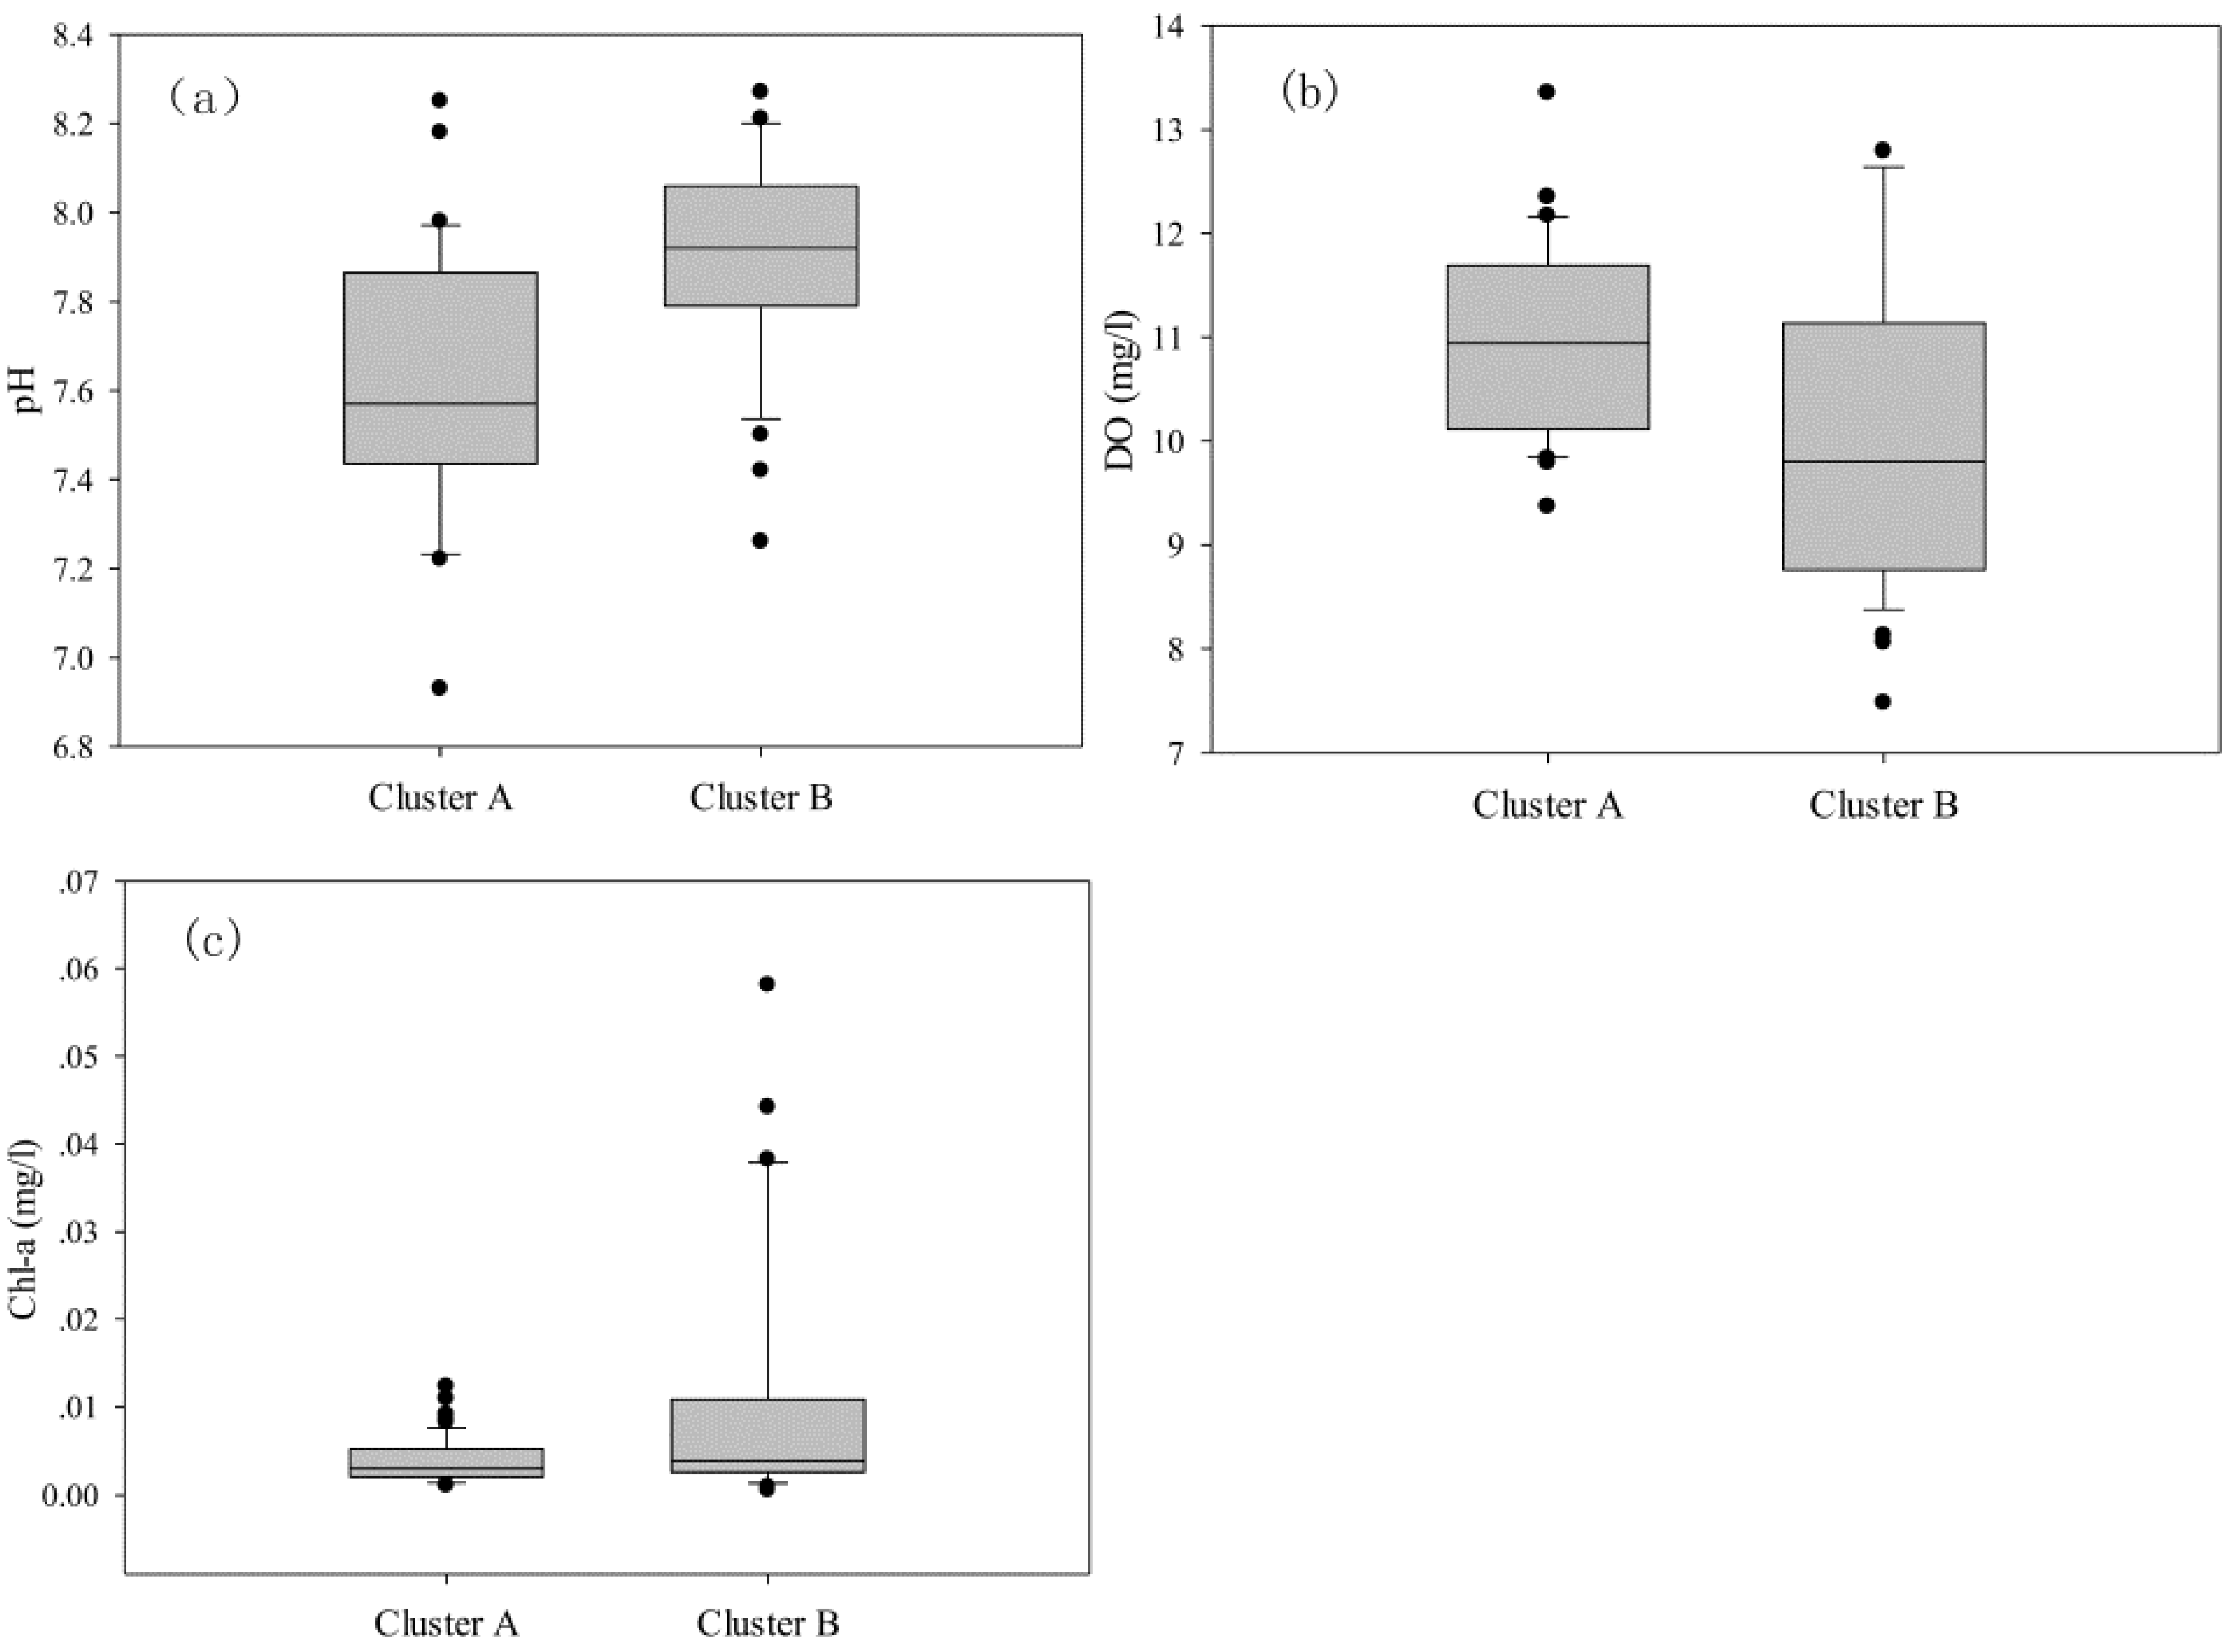
Table 6. The DFs from the standard and forward-stepwise modes, comprising nine and five parameters, respectively, produced CMs with total correct assignments close to 90% (88.5% and 88.2%, respectively). The DFs from the backward-stepwise mode yielded a similar result, identifying 87.8% of the cases using three variables: pH, DO and Chl-a. Thus, it indicated that pH, DO and Chl-a were the most significant parameters accounting for the variations in water quality between the two sampling periods.
Box plots of pH, DO and Chl-a show the temporal trends between the sampling periods (
Figure 5). The pH value was significantly higher in Cluster B than in Cluster A, and some dispersed points were observed, which indicated very high or very low values. The concentration of DO decreased in Cluster B, with a larger variation than in Cluster A. An opposite relationship between DO and Chl-a can be found. Compared with Cluster A, the Chl-a values in Cluster B was higher, and the values were more dispersed. Additionally, some points with very high concentrations were found in Cluster B. The temporal trend of significant parameters suggested that the water quality in Qiandao Lake was inferior in the wet period (Cluster B) compared with the drought period (Cluster A), which can be attributed to the increased agricultural activities during the wet period and the higher river contribution leading to washout of agricultural soils [
27].
Spatial DA was applied to characterize the spatial variations in water quality between the three groups of sampling sites delineated by CA.
Table 7 shows the values of Wilk’lambda, chi-square and
p-level for each discriminant function, where the values of Wilk’lambda varied between 0.080 to 0.660, and chi-square varied between 18.5 and 103.8. The DA results were significant, as indicated by the p-levels below 0.01. The three DA modes were again performed to obtain the DFs, as shown in
Table 8. The DFs produced by the standard and forward-stepwise modes, including nine and six discriminant variables, correctly assigned 85.1% and 83.3% of the cases, respectively. The DFs constructed by the backward-stepwise mode obtained CMs with 81.6% right assignations using SD and NH
3-N, suggesting that they were the significant discriminating parameters.
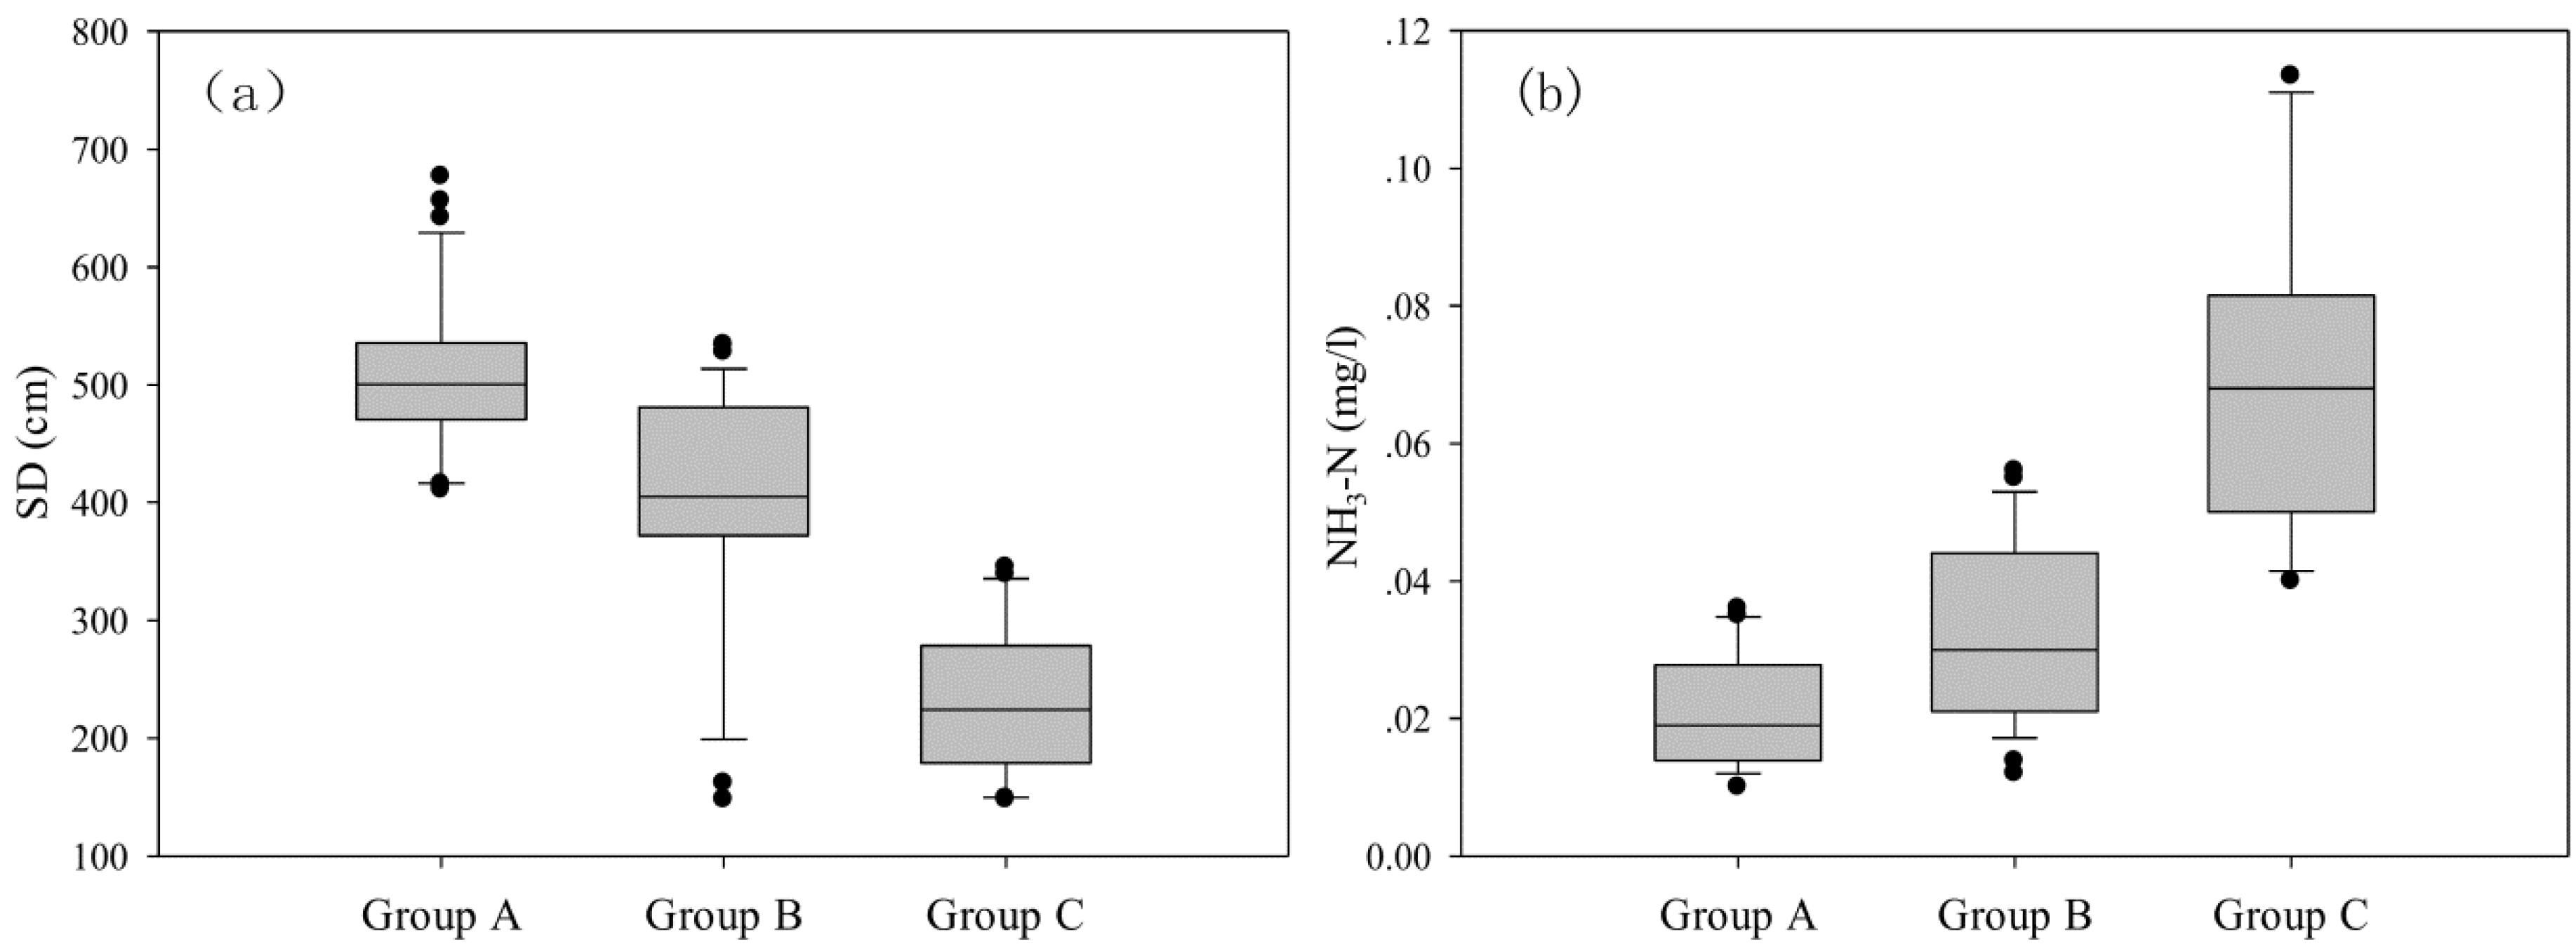
Box plots of SD and NH
3-N show different spatial patterns of the water quality of Qiandao Lake (
Figure 6). The SD was highest in the Group A sites, followed by Group B, whereas Group C had the lowest. An obvious opposite relationship between SD and NH
3-N can be found. The concentration of NH
3-N was highest at the Group C sites, and it was lowest at the Group A sites. The spatial pattern in the water quality of Qiandao Lake exhibited a trend of improvement from the northwest (inflow) to the southeast (outflow) of the lake. Among all of the sampling sites, the Group C sites were located at the most upstream site, and the water quality was mostly impacted by inflow from the Xin’an Jiang River, which received substantial amounts of domestic sewage, agricultural pollution, and industrial wastewater discharge from the upstream contributing area.
3.4. Identification of Potential Pollution Sources
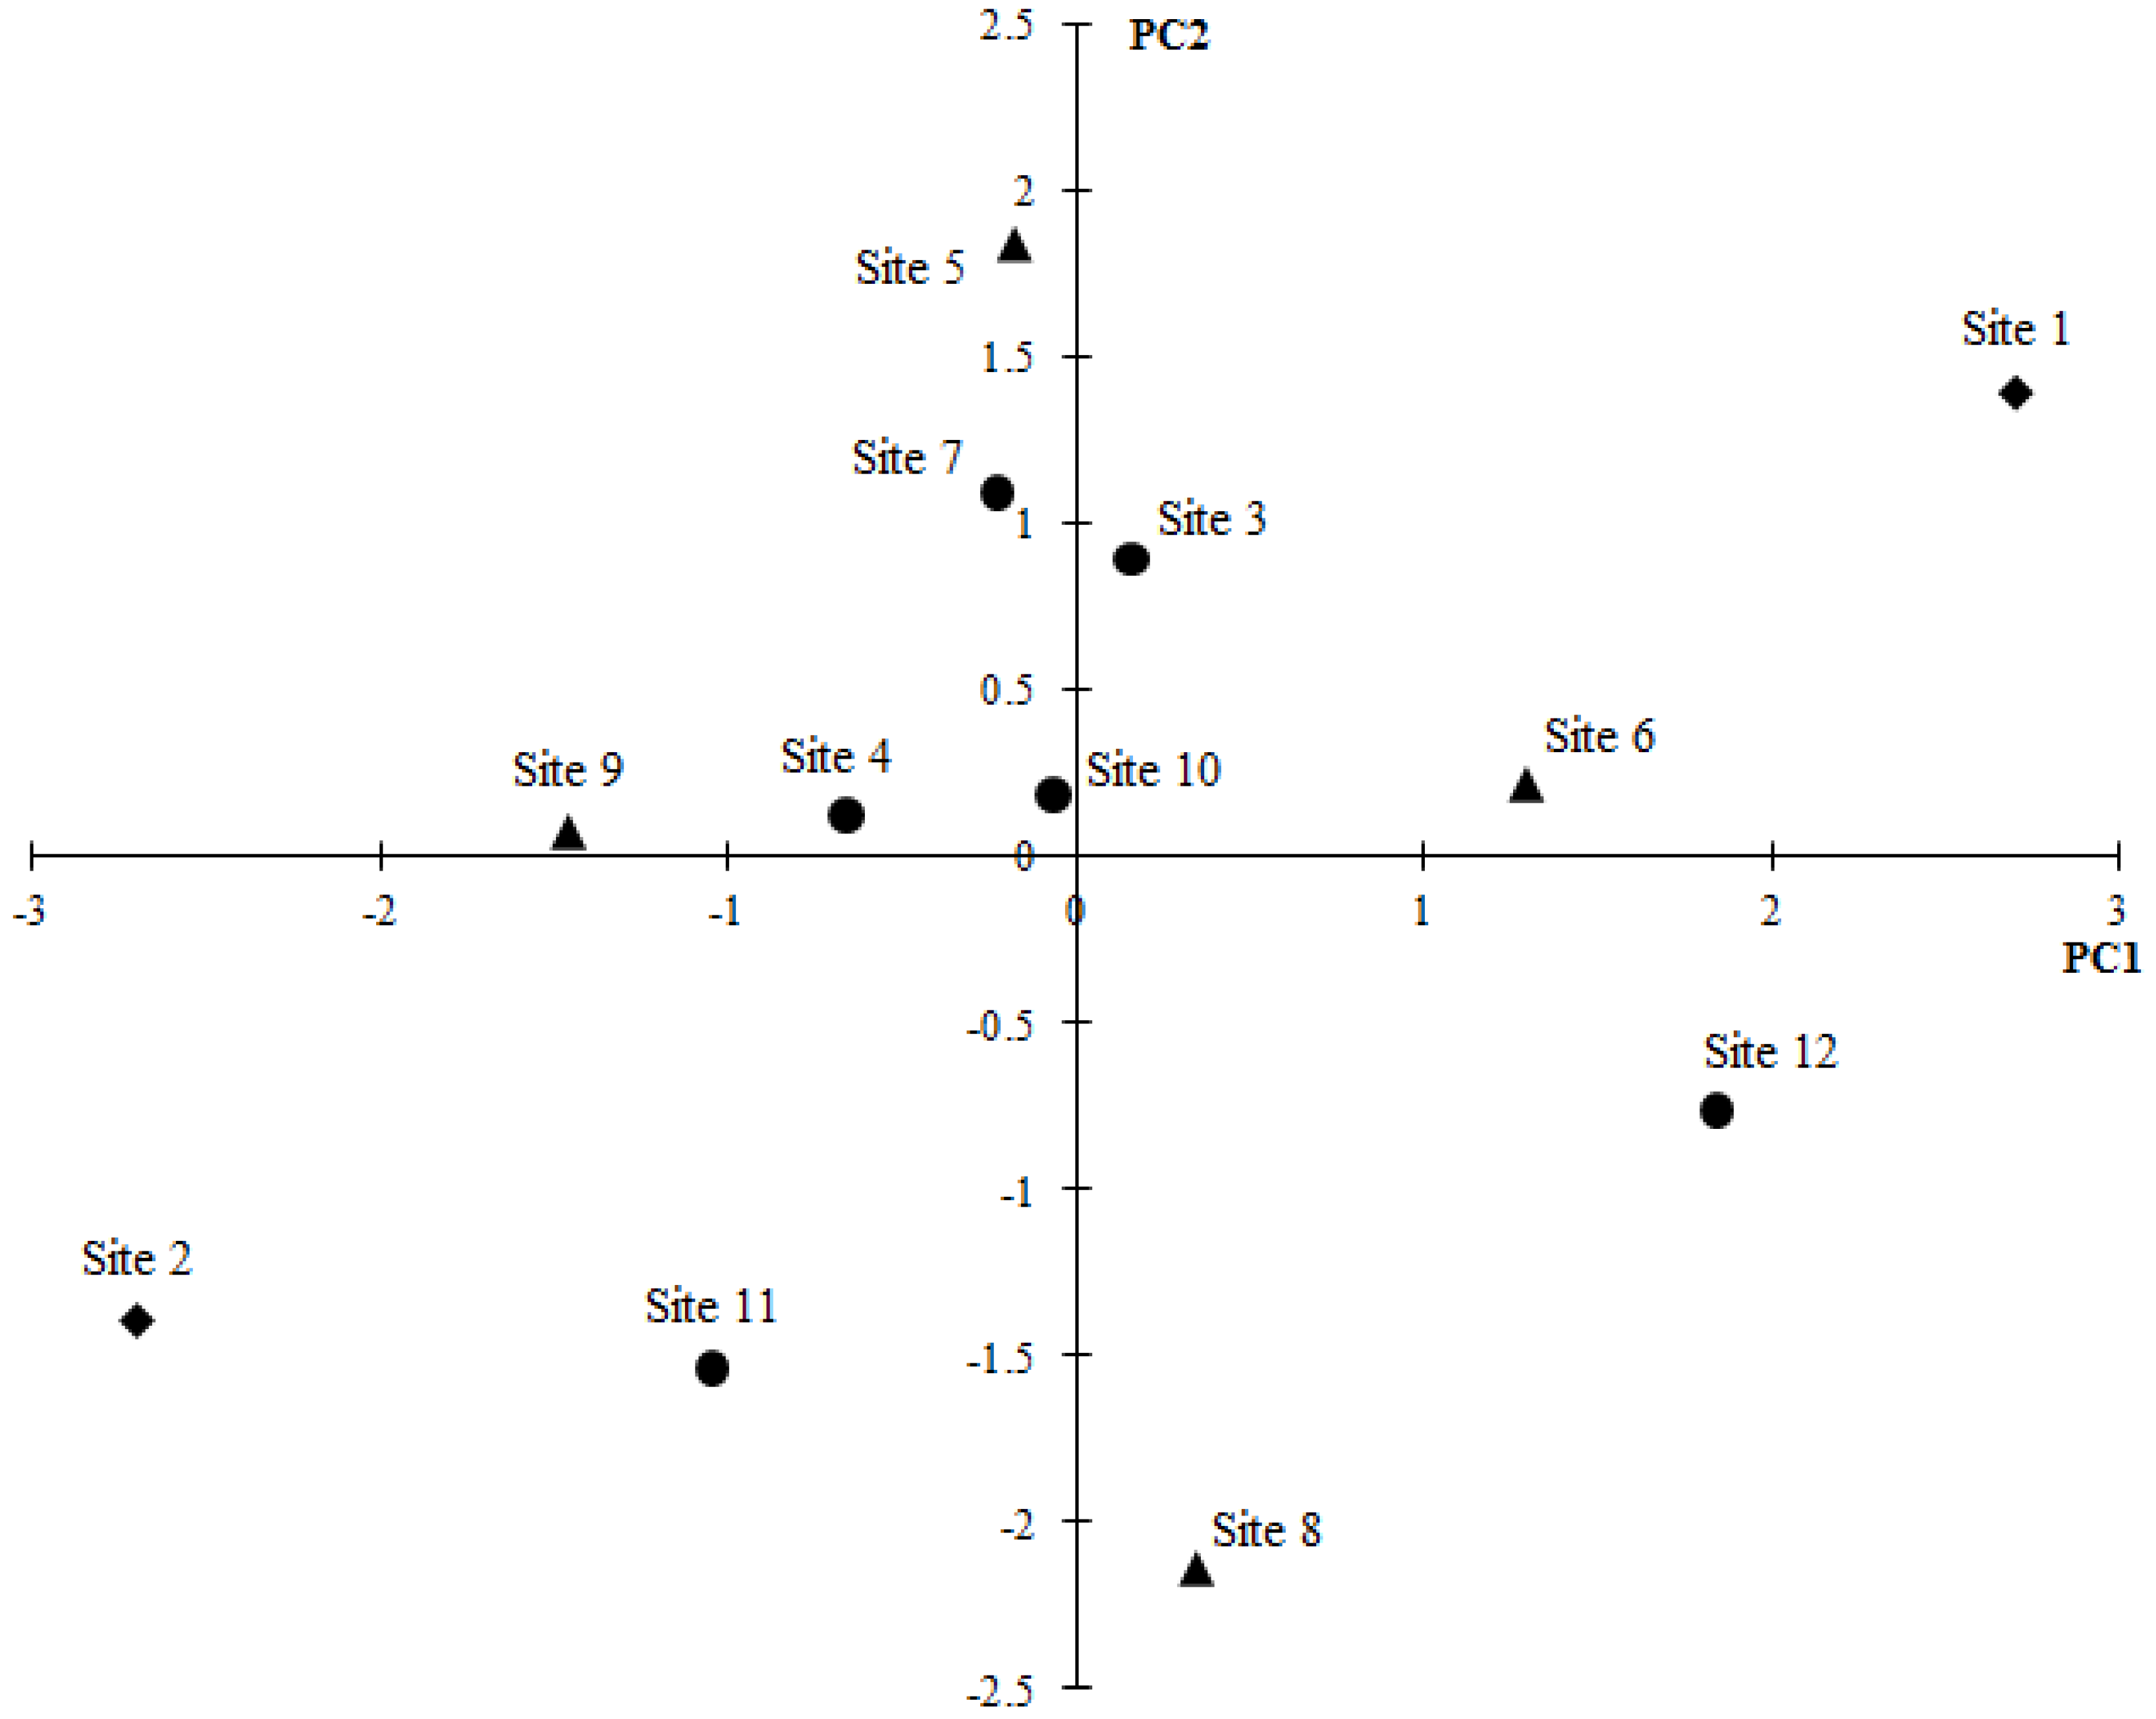
After normalization for the data sets of the three groups of sampling sites (as obtained through CA), PCA was applied to assess the compositional patterns between variables and to detect the sources influencing water quality for different regions. PCA produced four PCs for Groups A and B and three PCs for Group C with eigenvalues greater than 1, explaining 84.58%, 81.61% and 78.68% of the total variance in Groups A, B and C, respectively.
Table 9 shows the parameter loadings and explained variance.
Figure 7 shows the scores of sampling sites for the first two principal components. The variable loadings were classified as strong, moderate and weak, corresponding to absolute loading values of >0.75, 0.75–0.50 and 0.50–0.30, respectively [
39].
For Group A, the VF1 accounted for 29.43% of the variance, and it had strongly positive loadings on COD
Mn and Chl-a and a moderately positive loading on NH
3-N. COD
Mn was an organic pollution indicator, and it could be attributed to uncontrolled domestic discharges [
3]. Chl-a was an index for phytoplankton abundance, and it likely represented the impacts of anthropogenic activities, including fish culture and agricultural runoff [
40]. NH
3-N can originate from various sources, including municipal waste, soil erosion and fertilizer applications [
3,
41]. Therefore, VF1 represented the contribution of nutrient pollution such as domestic wastewater and agricultural runoff. VF2, accounting for 24.50% of the variance, displayed a strongly positive loading on DO and a strongly negative loading on SD, and it can be ascribed to biochemical pollution [
31]. VF3, which explained 17.54% of the variance, showed a strongly positive loading on FC and a moderately positive loading on TN. This factor can be ascribed to pollution from domestic discharge and agricultural and surface runoff [
31,
42]. VF4 explained the lowest variance (13.11%) and had a strongly positive loading on pH, representing the variability in physico-chemical aspects [
21,
32].
Among the four significant VFs of Group B, VF1 accounted for 30.46% of the total variance, and it was weighted on NH
3-N, SD, TP, FC and TN. VF1 identified the nutrient pollution from anthropogenic activities such as domestic sewage and agricultural non-point source pollution [
31,
43]. VF2 represented 22.65% of the variance and had a strongly positive loading on Chl-a. It may be ascribed to organic pollution from domestic wastewater. VF3 constituted 15.20% of the variance, and it had a strongly negative loading on COD
Mn and a moderately positive loading on DO. This factor can be resulted from biochemical pollution [
42]. VF4 explained 13.31% of the variance and was only marked by pH, representing the physico-chemical source of variability.
The sources in Group C were similar to that in Group B. VF1 explained 38.28% of the variance, and it was weighted on TN, TP and NH
3-N. Agricultural non-point source pollution can be the explanation for this factor [
27,
43]. VF2, accounting for 25.25% of the variance, had strongly positively loadings on Chl-a and FC and a moderately positive loading on SD, likely representing organic pollution from domestic wastewater [
31]. As with VF3 of Group B, VF3 (15.15% of the total variance) had a strongly positive loading on DO and a moderately negative loading on COD
Mn, and it can be attributed to biochemical pollution [
42].
3.5. Water Quality Variations within the Lake
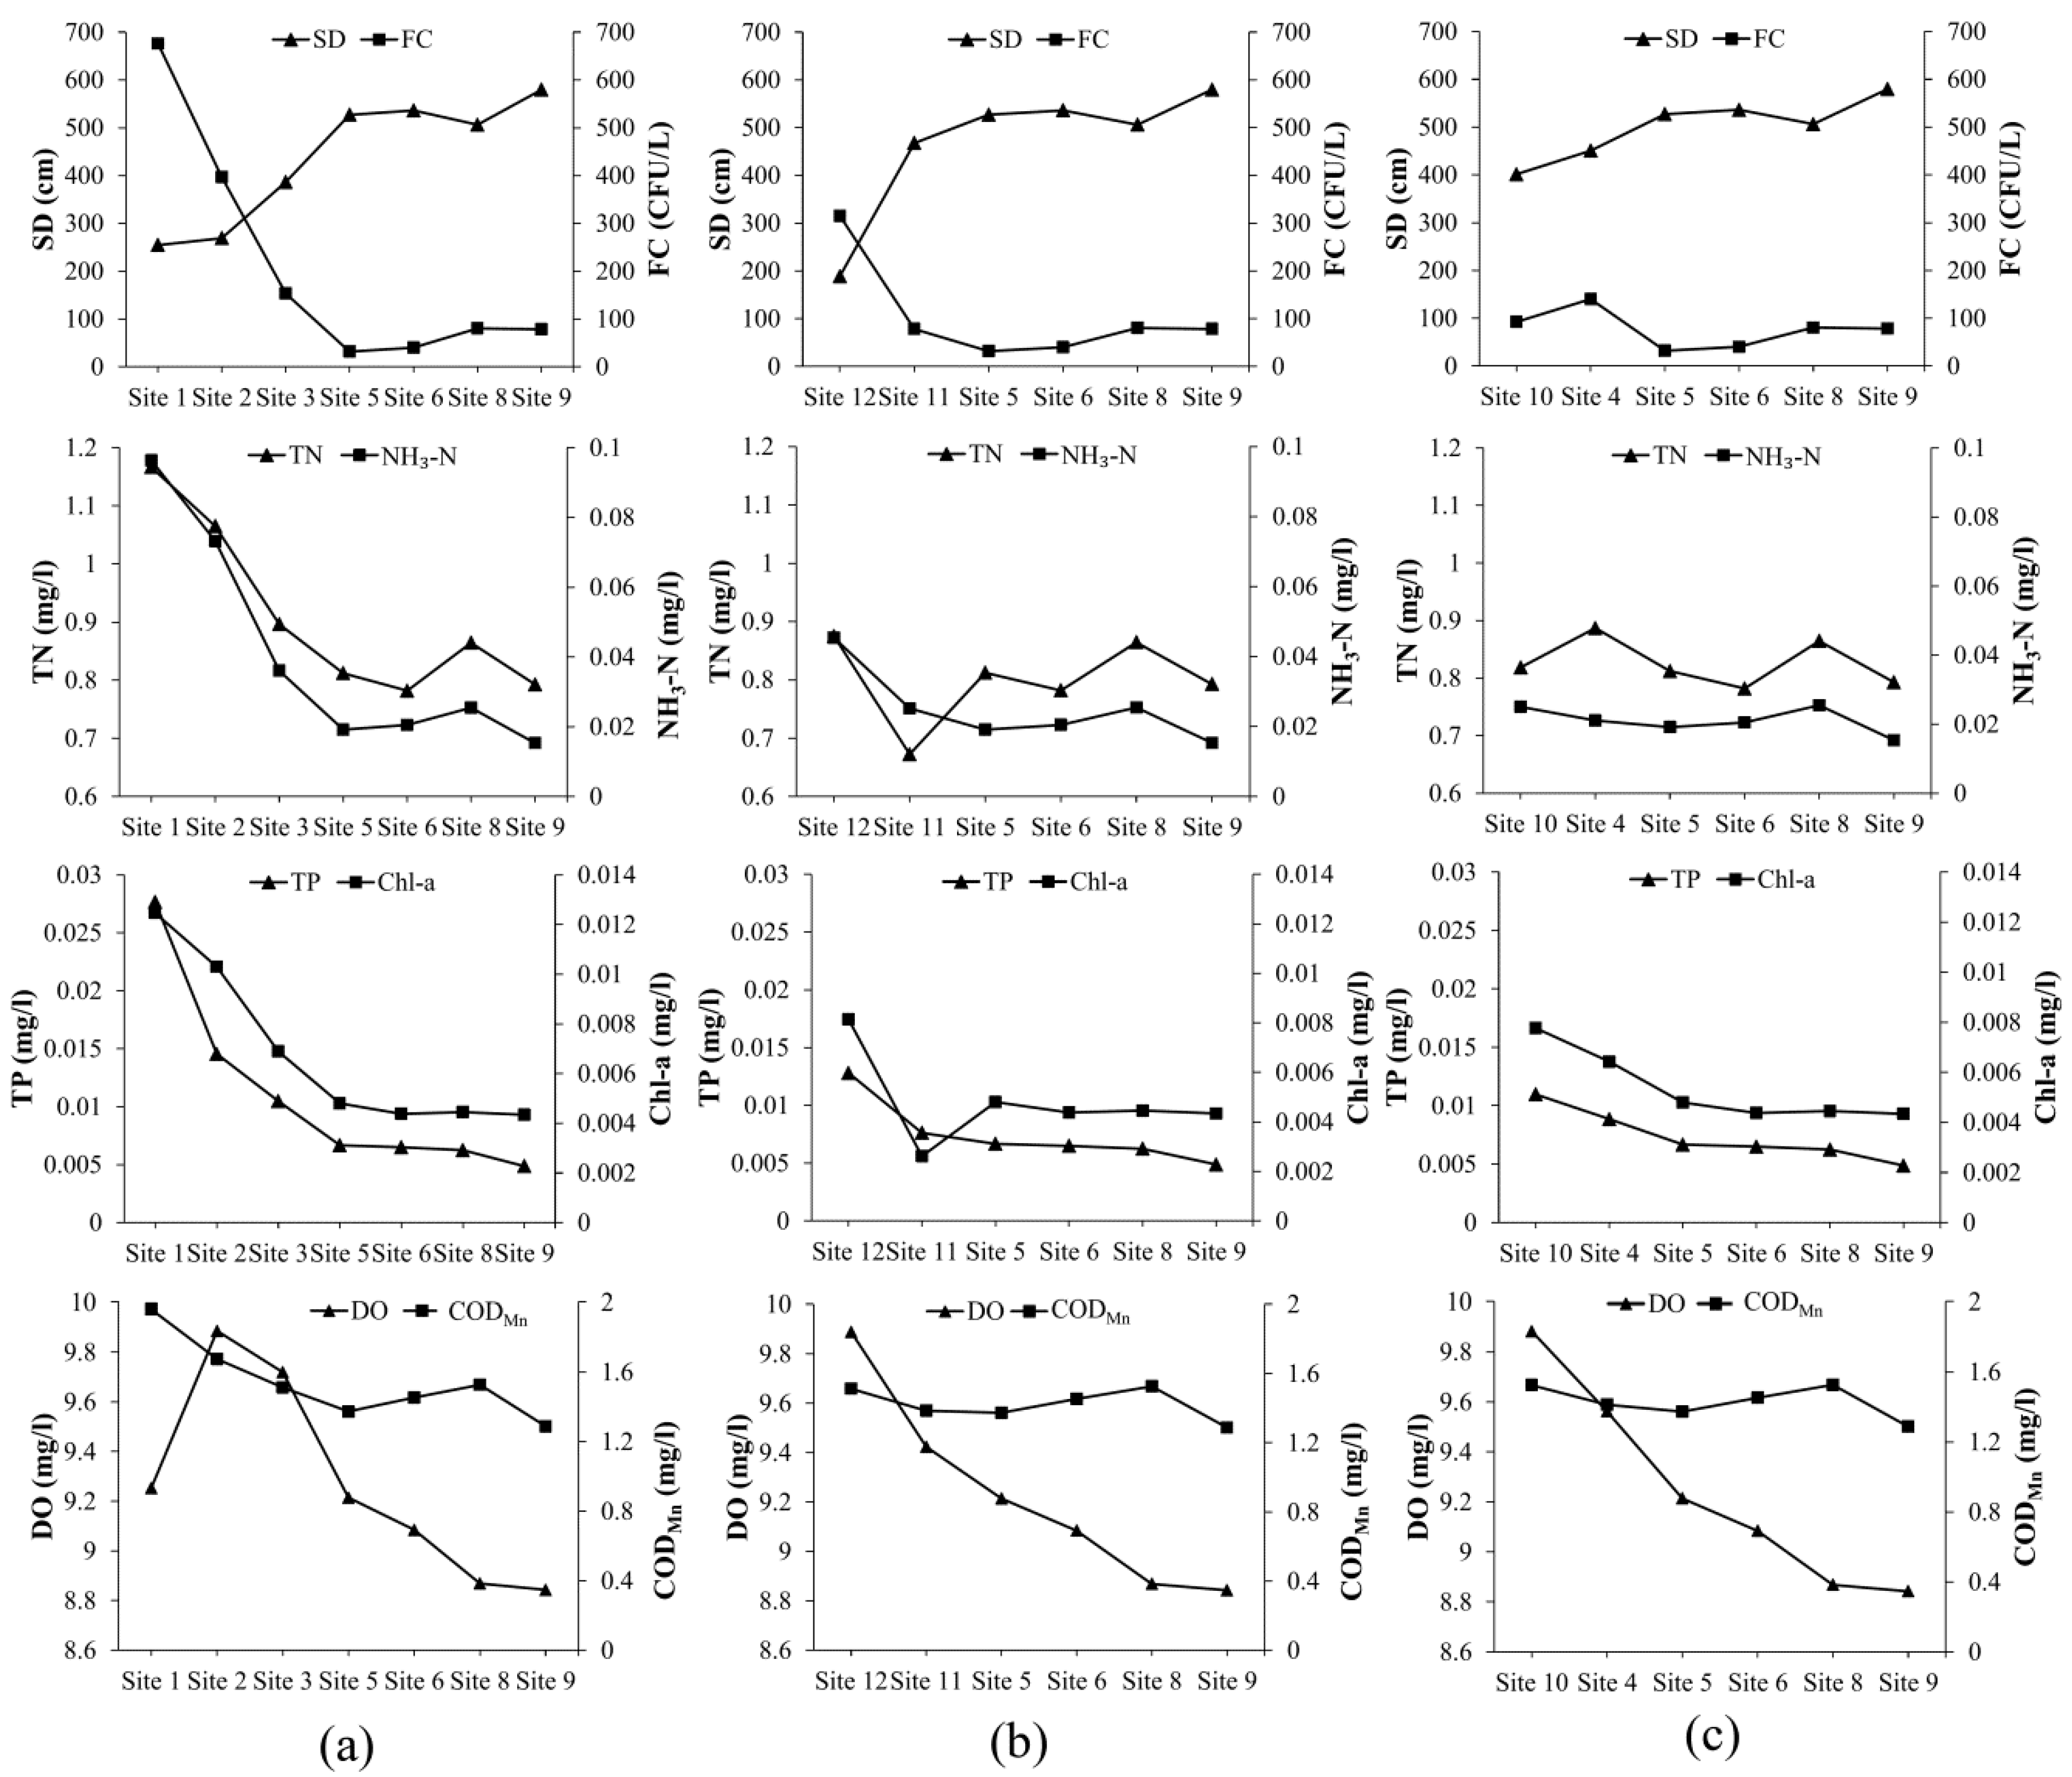
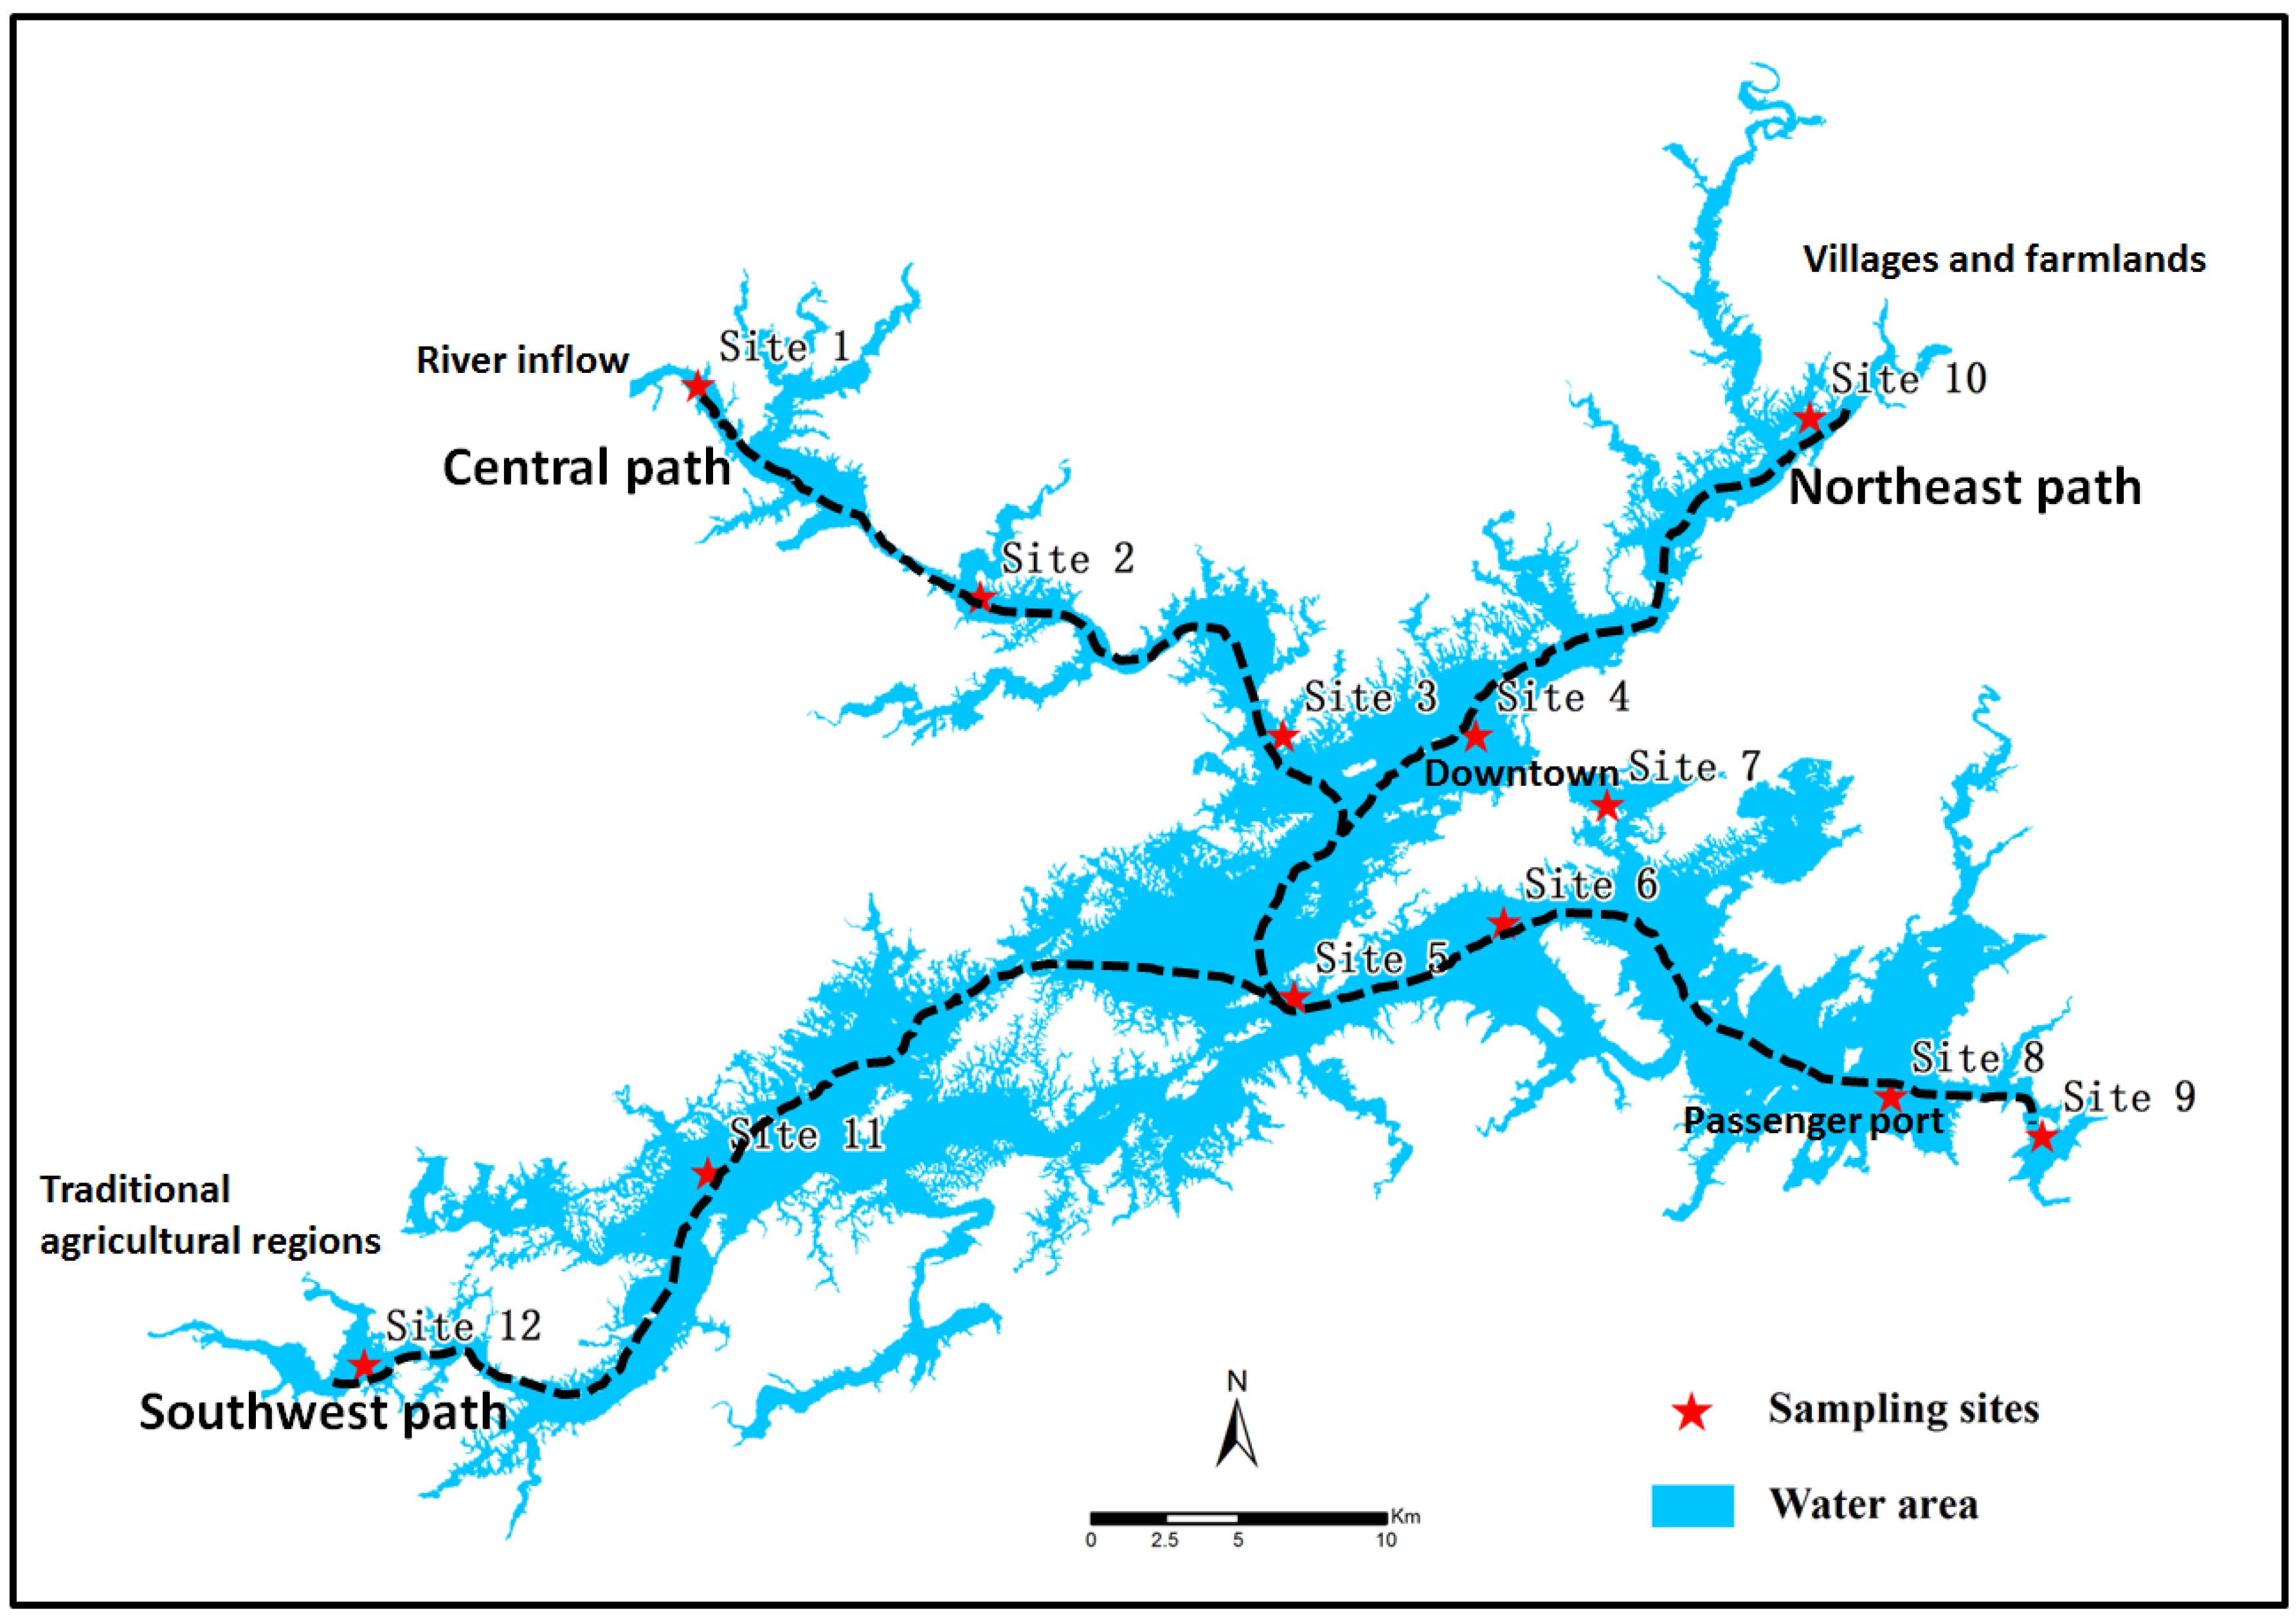
Pollutant transport from the river to the water reservoir is strongly controlled by hydrology. We roughly divided Qiandao Lake into three parts based on the water flow direction, which was indicated using three flow paths constituted by the sampling sites (
Figure 8), to analyze the water quality variations within the lake. The three paths are the central path (site 1-site 2-site 3-site 5-site 6-site 8-site 9), the southwest path (site 12-site 11-site 5-site 6-site 8-site 9) and the northeast path (site 10-site 4-site 5-site 6-site 8-site 9). The potential pollutant sources of the drainage basin were also described in
Figure 8.
Figure 9 showed the trends of 4-year averages of the water quality parameters for the three paths.
The Xin’an Jiang River received substantial amounts of domestic sewage, agricultural pollution, and industrial wastewater discharge from the upstream contributing area. Therefore, the water quality of the inflow into Qiandao Lake was undesirable. Site 1 was nearest to the river inflow, and the 4-year averages of most of the parameters (COD
Mn, TN, TP, NH
3-N, Chl-a, and FC) were the highest and the SD values were the lowest among all of the sampling sites. SD, TN, TP, COD
Mn, NH
3-N, Chl-a and FC showed similar variation trends along the central path (
Figure 9a), presenting an overall improvement of water quality from the inflow to the outflow, which suggested a strong capacity for self-purification in Qiandao Lake. Appreciably increased levels of COD
Mn, TN, NH
3-N and FC, as well as a decreased level of SD, were observed at site 8 compared with the adjacent sites, indicating degraded water quality at this location. The explanation was that site 8 was an important passenger port with intensified anthropogenic activities. The variation along the southwest path was similar to that along the central path (
Figure 9b), showing an overall improvement of water quality from site 12 to site 9. Three peaks can be found at sites 12, 5 and 8, reflecting the purification process of water quality within the lake. Site 12 is close to traditional agricultural regions where amounts of nutrients can be easily shifted from the surrounding arable lands into the lake. Site 5 is located at the intersection of waters from the central, southwest and northeast directions, resulting in increased TN concentrations at this site. Along the northeast path, we can see peak values of TP, NH
3-N and Chl-a at site 10, and TN and FC at sites 4 and 8 (
Figure 9c). Site 10 was close to villages and farmlands, and it was mainly impacted by agricultural runoff and domestic sewage. Site 4 received waters from the central and northeast directions and was close to the downtown where rapid urbanization and population growth had recently occurred, and thus it was strongly influenced by the pollutants brought by the central path and domestic sewage from the dense population. Site 7 was also near the downtown and was impacted by the intense human activities, leading to the relatively inferior water quality compared with sites 6 and 8. In addition, compared with the other parameters, a larger decline in TP concentration was found for each path, without an increase at site 8. There are two possible explanations. First, phosphorus was mainly transferred into water in a granular state, and its transmission distance is shorter than those of nitrogen and other pollutants in the reservoir. Second, phytoplankton absorbed more phosphorus than the other nutrients during the growth period [
44].
In addition, we have also explored the water quality variation in different depths. Overall, the higher DO values were observed in surface water compared with the bottom and the medium waters. The relatively active photosynthetic oxygen production associated with phytoplankton growth in surface water may be responsible for the variation in depth [
45]. As for the other parameters (COD
Mn, TN, TP, NH
3-N, Chl-a, and FC), the deeper samplers showed decreased levels of concentrations, and this can be ascribed mainly to the fluxion of surface water and the dilution of pollutants with depth [
46].


