Abstract
Microbiological contamination in public buildings is closely linked to human presence, such as airborne bacteria, fungi, and particulate matter, which strongly influence indoor air quality (IAQ). This study examined the distribution of microorganisms in a museum building in relation to time of day, air-handling unit (AHU) type, and ventilation operating mode. Exhibition rooms without natural light relied entirely on a central heating, ventilation and air conditioning (HVAC) system. Microbiological contamination was assessed using Koch’s passive sedimentation method over a 24 h cycle for two AHUs (I and III) and selected rooms, while CO2 levels were monitored as indicators of occupancy and ventilation demand in line with EN 16798-1:2019 and ASHRAE 62.1-2022. Although the demand-controlled ventilation system increased the outdoor air fraction from 40% to 70–100% during peak visitor density, localized increases in microbial contamination occurred. AHU I showed higher loads of Staphylococcus sp. and fungi, while AHU III exhibited pronounced fungal peaks influenced by elevated humidity from an open water reservoir. Psychrophilic bacteria reached 140–230 CFU·m−3, mesophilic bacteria 230–320 CFU·m−3, and fungi up to 740 CFU·m−3. Most CFU values remained below commonly referenced upper limits (<1000 CFU·m−3), but several peaks exceeded lower recommended thresholds, indicating a need for improvements. Enhanced filtration, humidity control, increased airflow during high occupancy, and reducing moisture sources in AHUs may mitigate microbial growth and improve IAQ in public buildings.
1. Introduction
Modern societies spend over 90% of their time indoors, making indoor air quality (IAQ) a critical determinant of health, comfort, and performance [1]. Indoor pollutants originate from outdoor infiltration, emissions from materials, and most significantly from human occupants, who are the primary source of CO2 and microorganisms [2]. Poor IAQ often remains unnoticed by building users, yet contributes to symptoms such as irritation, headaches, and sick building syndrome (SBS) [3]. Global estimates indicate that polluted indoor and outdoor air cause over 5.5 million premature deaths annually [4]. Despite this, IAQ remains far less regulated than outdoor air, a gap highlighted by the COVID-19 pandemic [5]. Historical observations by Lavoisier and Pettenkofer established that both metabolic gases and biological contaminants associated with human presence influence IAQ, as supported by the literature [6,7,8].
The main indoor air pollutants are divided into three categories: suspended dust (e.g., PM10, PM2.5, ultrafine particles, settled dust), volatile organic pollutants (e.g., CO, CO2, formaldehyde, volatile organic compounds, PAHs), and biological pollutants [9].
Biological contaminants including airborne bacteria, fungi, and viruses constitute a substantial fraction of indoor air pollution (approximately 5–34%) [6,7,8,10]. Their presence depends on building function, occupancy, and the interaction between outdoor and indoor sources [11,12,13,14,15]. The dominant airborne bacteria identified in the indoor environment are Staphylococcus sp. and Micrococcus spp., both originating from the human commensal microbiota (skin, respiratory tract) [15]. No universal indoor microbiome exists; instead, buildings develop unique microbial signatures shaped by occupants, climate, ventilation, and building operation [16,17]. Bioaerosols may cause infections, allergic reactions, and respiratory diseases, with effects modulated by temperature, humidity, and particle size [18,19,20,21,22,23,24]. Seasonal variations, antimicrobial resistance, and the ability of microorganisms to persist through biofilms or spores further complicate IAQ assessment [20,21,22,23,24]. Gram-negative bacteria generally survive better at high relative humidity and low temperatures. Most airborne fungi thrive at temperatures between 10 and 35 °C. Bioaerosols smaller than 5 μm remain airborne for extended periods and can settle deep into the respiratory tract, increasing the likelihood of infection. Seasonal variations also influence bioaerosol concentrations and the incidence of infectious diseases. For example, Legionella species occur in higher concentrations in summer, while influenza viruses peak in winter [19,20,21,22].
Advances in energy efficiency have accelerated the shift from natural ventilation to centralized mechanical ventilation and heating, ventilation and air conditioning (HVAC) systems [8,25]. However, growing evidence indicates that air-handling units (AHUs) can operate as secondary sources of biological contamination, contributing 42–53% of indoor bioaerosols in some buildings [7]. National Institute for Occupational Safety and Health (NIOSH) reports that roughly 50% of IAQ problems are attributable to HVAC systems. As a result, systems designed to deliver fresh air and remove bioaerosols may unintentionally increase microbial exposure, particularly when recirculating return air [26]. Buildings equipped with HVAC systems show 30–200% higher SBS incidence than naturally ventilated buildings, especially when maintenance is inadequate [5,27].
Ventilation systems supply conditioned outdoor air or mixtures of outdoor and recirculated air. Thus, IAQ depends not only on the quality of outdoor air but also on how recirculated air is managed. Cooling processes in AHUs introduce additional risks due to condensation and the potential accumulation of microorganisms in condensate trays, filters, and ducts [28,29]. Despite the widespread use of air recirculation in central HVAC systems, there is still a lack of evidence on how recirculated air affects microbial contamination during real-time system operation.
Polish and international regulations do not define clear biological contamination limits for public buildings; existing standards apply mainly to controlled environments such as hospitals or pharmaceutical facilities. This regulatory gap underscores the need for systematic research on microbiological contamination in buildings equipped with HVAC systems [5,29]. Such research is crucial for identifying HVAC components that support microbial growth, determining the physicochemical factors driving proliferation, and mapping the transmission pathways of biological contaminants.
Museum spaces are unique, playing a significant role in community life by hosting visitors of all ages. Air quality in these buildings serves a dual purpose: protecting the health of visitors and staff and preserving museum collections, distinguishing museums from typical buildings where the primary focus is on occupant public comfort and health [30,31]. Museums also differ from other facilities due to their unique profile of chemical contaminants, such as organic acids and aldehydes emitted from exhibition materials, as well as ammonia and formaldehyde associated with high occupancy, and the need to protect collections from fungi and microorganisms linked to human microbiota [32,33].
In museums, it has been observed that visitor flow dictates a change in the microclimate. Carbon dioxide levels in museum spaces are closely related to the number of people and their duration of stay. CO2 concentrations increase dramatically after the museum opens, and excess CO2 serves as an indicator of insufficient ventilation. Many studies (especially in naturally ventilated spaces) have found a very strong correlation (often above 0.80) between carbon dioxide concentration and humidity. This is because both parameters have a common source as human respiration and perspiration [30,32,34,35,36]. Practical studies of IAQ in museum galleries have shown that inadequate air conditioning and ventilation systems can lead to poor IAQ, despite meeting certain CO2 targets. The sources of particles contributing to indoor air pollution were found to be very small, with the main contributors being visitors and their activities in the galleries, museum and maintenance staff, and outdoor PM10 [37]. Museum spaces are very often equipped with demand control ventilation (DCV) systems. They play a crucial role in museums, balancing the often-conflicting needs of protecting sensitive exhibits, ensuring the comfort and health of visitors and staff, and optimizing energy consumption. DCV allows for precise control of conditions in specific zones (e.g., smaller, more crowded galleries), a feat difficult to achieve with natural ventilation [38].
This study forms part of a broader project examining the influence of ventilation and air-conditioning systems on microbiological cleanliness in public buildings. The primary objective of this article is to investigate the distribution of selected microbial groups within an existing, operational museum building equipped with a DCV system in relation to the time of day and AHU operating mode, with particular emphasis on the role of central return-air recirculation.
2. Materials and Methods
2.1. Research Facility
This study was conducted in a museum open to the public, located in the city center of Wroclaw, Poland. The facility is a multimedia museum in which the exhibits and exhibitions do not impose specific conservation requirements. However, due to the extensive use of electronic equipment, indoor environmental conditions must be controlled to maintain relative humidity within the range of 40% to 80%. The facility was selected due to its unique structural characteristics: it is partially embedded in the ground, has no windows, and its only external building envelope element in contact with outdoor air is a concrete flat roof; furthermore, it operates as a highly popular and frequently visited multimedia museum.
The building discussed in this article has a total volume of 12,800 m3. It is divided into three main exhibition zones (1, 2 and 3), each served by a separate air-handling unit. A schematic view of the building is shown in Figure 1. In Zone 1, two sections are distinguished—Zone 1.a and Zone 1.b—separated by a partially open partition wall. Zone 2 is an open area featuring temporary exhibitions that are periodically changed. Zone 3 consists of three rooms (Zone 3.a, 3.b and 3.c), one of which—the central room—is enclosed and remains permanently closed. This room hosts multimedia shows. Within this enclosed space, there is an open water tank that forms part of the interior design and complements the multimedia displays. All the rooms are located below ground level. The walls of the rooms are in direct contact with the surrounding soil, while only the flat roof separates the interior from the outdoor air. The supply of outdoor air to the rooms is provided by three central air conditioning systems.
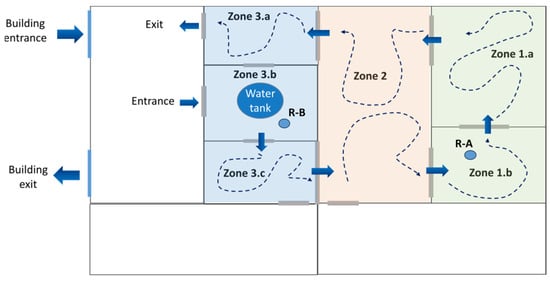
Figure 1.
Outline of the building with division into zones, showing visitor pathways and the locations of indoor microbial samplings marked as R-A and R-B.
None of the rooms have access to natural daylight. The supply of outdoor air to the rooms is provided by three central air conditioning systems. The location of the air-handling units, as well as the air supply and exhaust arrangement for the rooms, is shown in Figure 2.
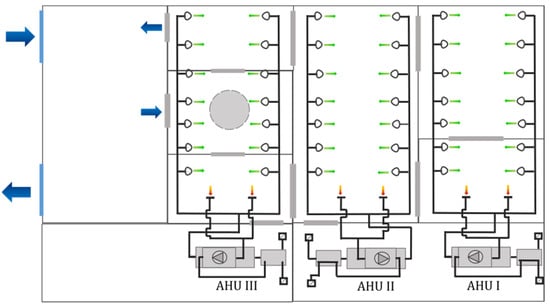
Figure 2.
The organization of air exchange in the individual zones, along with the location of the air-handling units.
Each system is designed to allow air recirculation, variable ventilation air flow, and a variable outdoor air flow controlled by the CO2 concentration in the exhaust air. The design values of the ventilation air flow, outdoor air flow, and the air change rates for both ventilation and outdoor air in the individual zones are presented in Table 1.

Table 1.
The design values of the ventilation air flow, outdoor air flow, and the air change rates for both ventilation and outdoor air in the individual zones.
Due to the nature of the facility, a museum, both the variability and the number of people present in the individual rooms are highly dynamic and difficult to predict with precision. The minimum occupancy typically ranges between 0 and 5 people, which mainly occurs during off-peak hours or in rooms with lower exhibition attractiveness. In contrast, the highest concentration of visitors is consistently observed in the area containing the water tank, where the number of occupants may increase to as many as 45–50. Typical visitor pathways, illustrating the movement of visitors and thus the movement of microbiological contamination sources within the individual zones of the facility, are shown in Figure 1.
The highest occupant density, regardless of the time of day, is recorded in Zones 1.b and 3.b. For this reason, these rooms were selected as representative for further analysis. Sampling locations are indicated as R-A and R-B in Figure 1.
2.2. Configuration of the Air-Handling Units’ Operation
Measurements of microbiological contamination were carried out over a full daily operating cycle of the museum rooms for two air-handling units: AHU I and AHU III, as well as in the representative rooms where many visitors were continuously present. Due to technical issues, AHU II was not included in the measurements; however, it was maintained in the same manner as AHU I and AHU III. Samples were collected during four characteristic time intervals: (a) early in the morning, immediately after the museum opened at 08:00; (b) at midday, at 12:00; (c) in the afternoon, at 14:00; (d) just before closing time, at 18:00. The operation of AHU’s depended on the carbon dioxide concentration in the exhaust air, in accordance with the adopted system control strategy. The implemented control strategy was consistent with the principles defined for demand-controlled ventilation (DCV). The researchers had no influence over the regulation of the system. During the designated measurement times, the ventilation system operated in three different modes (Mode-1, Mode-2, Mode-3).
In Mode-1, all AHUs worked with 60% recirculated air and 40% outdoor air. Mode-2 worked with 30% recirculated air and 70% outdoor air. Mode-3 worked with outdoor air only. The sampling times and AHU operating modes are listed in Table 2.
Table 2.
Sampling times as well as the operating modes and airflow rates of the air handling unit (AHU).
Schematics of all three modes of maintenance of AHUs are presented in Figure 3, Figure 4 and Figure 5, while the explanation of the symbols used in the figures is provided in Table 3. The table also indicates the locations where the microbiological samples were collected.
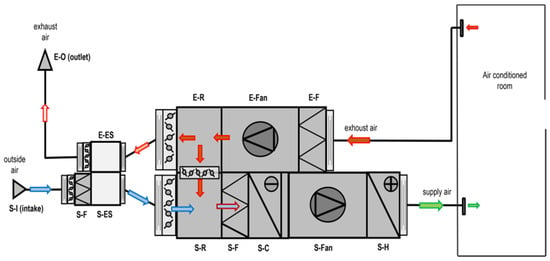
Figure 3.
Schematic diagram of the air handling unit operating in the air-handling unit I (AHU I) and AHU III configurations.
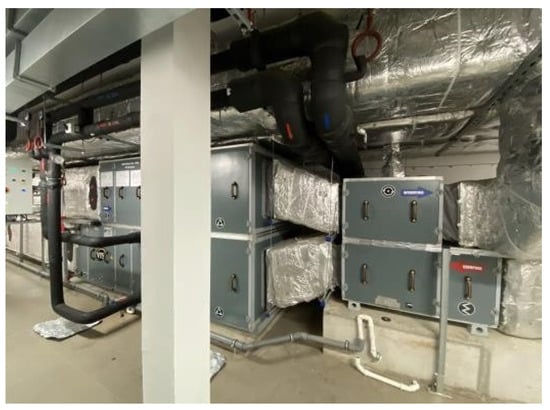
Figure 4.
Photograph of the AHU I located in the technical area.
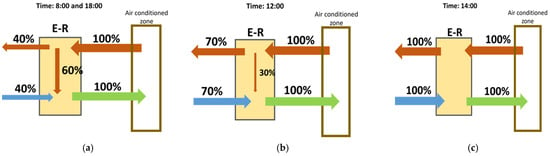
Figure 5.
AHU I and AHU III operating modes: (a) Mode-1, (b) Mode-2, (c) Mode-3. The colors of the arrows are as follows: blue—outside air, green—supply air, brown—exhaust and recirculated air.
2.3. Measurement of Indoor Air Parameters
To determine the thermal–humidity and hygienic parameters of the air in R-A and R-B, measurements of temperature, relative humidity, and carbon dioxide concentration in the indoor air were carried out. The measurements were performed using instruments manufactured by LABEL (Warsaw, Poland): the LB-856 for CO2 concentration, equipped with an external air temperature probe, and the LB-710 for temperature and relative humidity. Data was recorded at 1 min intervals.
2.4. Sampling and Microbiological Analysis
The microbiological quality of the air was assessed using Koch’s passive sedimentation method. This method is based on the gravitational settling of airborne microorganisms onto Petri dishes containing solidified culture media. Microorganisms present in the air impact the surface of the medium and settle on it, forming colonies that can later be counted and identified following appropriate incubation. Open Petri dishes with selective microbiological media were placed in the sampling locations (Table 3) for 15 min each time. After this period, the dishes were sealed and transported to the laboratory for incubation at the required temperatures. Subsequently, the colony-forming units (CFUs) on the plates were enumerated.
The study quantified the following groups of microorganisms: (1) Total number of psychrophilic and mesophilic bacteria (TNB), cultured at two temperatures: 22 °C for 72 h (TNB22) and 37 °C for 48 h (TNB37), using BD BBL™ Trypticase™ Soy Agar (TSA), Fischer Scientific, Waltham, MA, USA. (2) Number of Gram-positive Staphylococcus sp., cultured at 37 °C for 48 h on Baird–Parker LAB-AGAR™ (BP), BioMaxima S.A., Lublin, Poland. (3) Total number of microscopic fungi (TNF), cultured at 26 °C for 24–48 h on three different media: Czapek–Dox LAB-AGAR™ (TNF Cz-D), Malt Extract LAB-AGAR™ (TNF ME), and Sabouraud LAB-AGAR™ (TNF S), BioMaxima S.A., Lublin, Poland. These media differ in carbon source, pH and selectivity, allowing isolation of a broad spectrum of fungi, from fast-growing pathogenic species to slower-growing organisms that require specific nutrients and environmental conditions.
Subsequently, the Omeliansky formula was applied to calculate the number of microorganisms per cubic meter of air. This formula assumes that, on a 100 cm2 plate, the number of microorganisms settling within 5 min corresponds to the number present in 0.01 m3 of air. By incorporating the actual exposure time and plate area, the microbial load per 1 m3 of air was estimated. The sedimentation method was selected despite its limitations: it provides only an approximation of the potential surface contamination risk and does not enable quantitative monitoring of airborne microbial contamination. The limited possibilities for applying alternative sampling techniques, such as active air samplers, prevented their use in the present study. These constraints included restricted space within the ventilation ducts and the need to open and subsequently seal the air-handling unit to ensure representative operating conditions during sampling, without external air supply or exhaust. As a result, a sedimentation-based sampling method was adopted [6]. The selection of microorganisms was based on the groups most commonly found in outdoor and indoor air. Psychrophilic and mesophilic bacteria (including Staphylococcus sp.) and microscopic fungi present in indoor air originate from various sources, primarily the ingress of microorganisms from outdoors and biological activity within the building itself. Psychrophilic bacteria naturally occur in low-temperature environments such as soil, water and atmospheric air; their presence indoors is usually the result of outdoor air infiltration, although they can occasionally colonize cool indoor niches, albeit less frequently than mesophiles. Mesophilic bacteria, which grow best at moderate temperatures close to human body temperature, are mainly introduced by humans and animals. Staphylococcus sp., such as Staphylococcus aureus, are typical components of human skin and mucosal microbiota. They enter indoor air through skin shedding, coughing, sneezing and other activities of occupants. Fungal spores are ubiquitous in the air and constitute a large portion of the bioaerosol; many species (e.g., Cladosporium, Alternaria, Aspergillus) enter indoor environments from the outside.
3. Results
3.1. Air Parameters at Sampling Points R-A and R-B
The results of air temperature, relative humidity, and carbon dioxide concentration measurements in the zones where microbiological samples were collected are presented in Figure 6 for both R-A and R-B sampling places. The air parameters were measured 1 day snapshot.
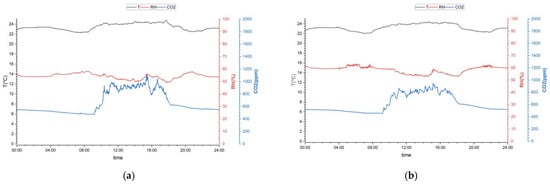
Figure 6.
All-day fluctuation in air temperature, relative humidity, and CO2 concentration: (a) at sampling point R-A, (b) at sampling point R-B.
The first set of measurements was carried out at the beginning of the museum’s operating hours (08:00, AHU I Mode-1, AHU III Mode-1). At this time, the CO2 concentration remained 478 ppm in R-A and 458 ppm in R-B, despite an outdoor air fraction of 40%. The air temperature in R-A was 22 °C with a relative humidity of 58%, while in R-B the average temperature was 22.7 °C and the relative humidity was nearly 60%.
The second series of measurements (12:00, AHU I Mode-2, AHU III Mode-2) was conducted when the air-handling units were operating in a mode supplying 70% outdoor air. During this period, the air temperature in R-A was 23.4 °C with a relative humidity of 52%. In R-B, the air temperature reached 23.7 °C and the relative humidity 54%. The CO2 concentration was 890 ppm in R-A and 781 ppm in R-B.
A third series of measurements took place at 14:00 (14:00, AHU I Mode-3, AHU III Mode-3). The CO2 concentration increased to average values of 934 ppm in R-A and 849 ppm in R-B, with an outdoor air fraction of 100%. At the same time, the air temperature in R-A was 23.8 °C with a relative humidity of 51%, while in R-B the mean temperature was 24.1 °C and the relative humidity 54%.
The final measurements were conducted at the end of the museum’s operating hours (18:00, AHU I Mode-1, AHU III Mode-1). At this time, the mean CO2 concentration reached 630 ppm in R-A and 611 ppm in R-B. The average air temperature in R-A was 22.9 °C with a relative humidity slightly below 52%, while in R-B the temperature averaged 22.6 °C with a relative humidity just under 55%. The temperature and relative humidity values were in relatively narrow ranges during 24 h in both locations.
3.2. Microbiological Measurements
Examples of microbial colonies developed on the plates containing the selective microbiological media used in the studies are shown in Figure 7.
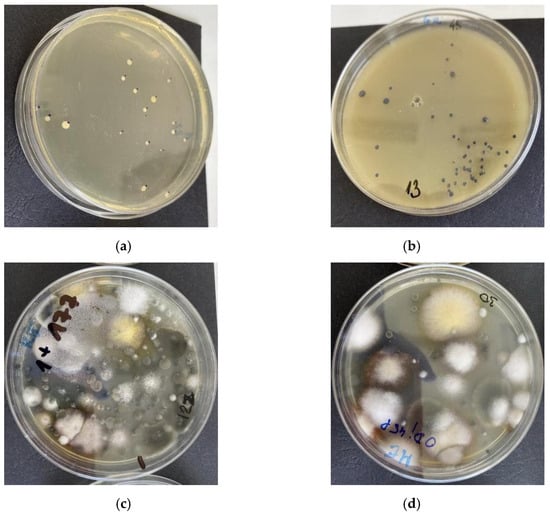
Figure 7.
Examples of microbial colonies developed on the plates: (a) total number of bacteria cultured on BD BBL™ Trypticase™ Soy Agar (TSA) medium, (b) Staphylococcus sp. bacteria cultured on Baird–Parker LAB-AGAR™ (BP) medium, (c) fungi cultured on Sabouraud LAB-AGAR™ (TNF S) medium, (d) fungi cultured on Malt Extract LAB-AGAR™ (TNF ME).
Microbiological concentrations measured at AHU I and AHU III varied considerably depending on the operating mode, sampling time, and location (Figure 8, Figure 9, Figure 10 and Figure 11).
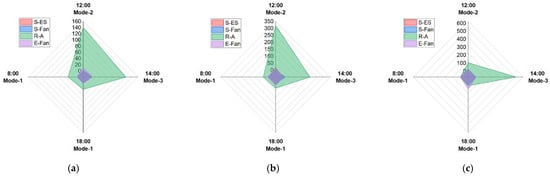
Figure 8.
Total number of bacteria depending on the time of day and the AHU I operating modes: (a) TNB22; (b) TNB37, (c) Staphylococcus sp.
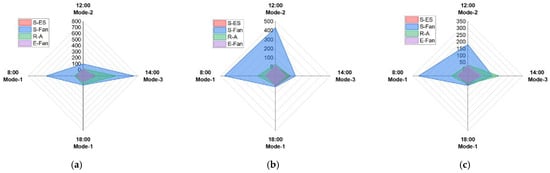
Figure 9.
Total number of fungi depending on the time of day and the AHU 1 operating configuration: (a) TNF Cz-D; (b) TNF M-E, (c) TNF S.
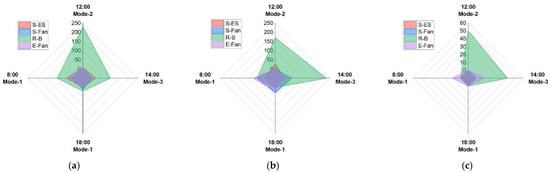
Figure 10.
Total number of bacteria depending on the time of day and the AHU III operating configuration: (a) TNB22; (b) TNB37, (c) Staphylococcus sp.
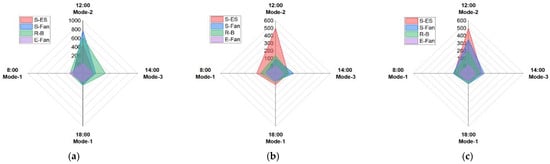
Figure 11.
Total number of fungi depending on the time of day and the AHU 3 operating configuration: (a) TNF Cz-D; (b) TNF M-E, (c) TNF S.
In the case of AHU I, the maximum concentration of TNB22 (Figure 8a) was 140 CFUm−3 at location R-A (12:00), when the ventilation unit was operating with a 70% outdoor air supply. When the same unit operated in Mode-3 at 14:00, the concentration at this point decreased to 120 CFUm−3. At 18:00 and 08:00, when the AHU operated in Mode-1, the values were 20 CFUm−3 and 30 CFUm−3, respectively. At the remaining sampling points, the TNB22 counts were low.
For TNB37 (Figure 8b) at location R-A, the values were different; however, the trends were similar, with a maximum of 320 CFUm−3 at R-A at 12:00 in Mode-2, decreasing to 200 CFUm−3 at 14:00 in Mode-3. At the remaining sampling points, TNB37 counts were either absent or low.
Gram-positive Staphylococcus sp. (Figure 8c) were also mainly detected at R-A. The highest concentration, 510 CFUm−3, was recorded in Mode-3 at 14:00. At the same location, the count at 12:00 in Mode-2 was 80 CFUm−3. No Staphylococcus sp. was detected at the SES and S-Fan sampling points. At the E-Fan point, Staphylococcus sp. was found at 50 CFUm−3 at 18:00.
The presence of microscopic fungi (TNF) was investigated using three different culture media: Malt Extract (ME), Czapek-Dox (Cz-D), and Sabouraud (S). For AHU I (Figure 9), the CFUm−3 values varied with sampling location and time. The highest concentration was observed on Czapek-Dox medium and S-Fan sampling point.
At the S-Fan location, elevated fungal counts were also recorded on the other culture media, with the highest values observed in the morning (8:00, Mode −1), when the AHU was operating with the lowest outdoor air fraction. On Malt Extract medium (Figure 9b), the count reached 460 CFUm−3 while on Sabouraud medium (Figure 9c) it reached 310 CFUm−3.
High fungal counts were also recorded on Czapek-Dox medium at the R-A sampling point, where TNF Cz-D reached 450 CFUm−3 at 14:00, while TNF S reached 180 CFUm−3. At the R-A sampling point, the highest fungal counts were observed during periods of the greatest visitor flow.
For AHU III, a variability in bacterial counts like that observed for AHU I was recorded, although the CFUm−3 values for most microorganisms were lower. Psychrophilic bacteria (TNB22; Figure 10a) reached a maximum of 230 CFUm−3 at R-A at 12:00, while the initial level was 90 CFUm−3 (8:00). Over time, from midday to 14:00, the count decreased to 100 CFUm−3 at 14:00 and further to 20 CFUm−3 at 18:00. At the remaining sampling points, TNB22 values ranged from 0 to 40 CFUm−3.
TNB37 (Figure 10b) also exhibited its highest counts at the R-A sampling point, reaching 170 CFUm−3 at 12:00 and 230 CFUm−3 at 14:00. At the remaining sampling points, TNB37 levels ranged from 0 to 70 CFUm−3.
Staphylococcus sp. (Figure 10c) was present in very low concentrations. The highest values were recorded at R-A, with 50 CFUm−3 at 12:00 (Mode-1) and 40 CFUm−3 at 14:00.
For microscopic fungi (Figure 11), very high concentrations were recorded for AHU III at 12:00, reaching the following values: TNF ME = 500 CFUm−3 (S-ES), TNF Cz-D = 460–780 CFUm−3, and TNF S = 350–500 CFUm−3. Similarly to AHU I, the microscopic fungal counts recorded in the morning, before the museum opened, were higher than those observed at closing time, ranging from 10 to 140 CFUm−3.
3.3. Correlation Analysis
For the conducted measurements, Pearson correlation coefficients were calculated, and the statistical significance of the correlations was tested using Student’s t-distribution with two degrees of freedom (n − 2). It was assumed that the relationships between the analyzed parameters should be similar in both rooms. Statistically significant correlations were obtained for: (1) CO2 concentration and mesophilic bacteria (TNB 37), with correlation coefficients of 0.75 for R-A and 0.87 for R-B, and (2) CO2 concentration and Staphylococcus sp., with correlation coefficients of 0.75 for R-A and 0.89 for R-B. No statistically significant correlations were observed with the remaining parameters. Statistically significant relationships are indicated in Table 4.
Table 4.
Statistical significance of correlations for measurements conducted in the facility.
4. Discussion
The results presented in the article are based on measurements conducted at different times of the day. Long-term measurements are typical in the context of HVAC system assessments. However, it is rarely applied in microbiological research, primarily due to the methodological constraints of such analyses. Bioaerosol sampling requires strict control of experimental conditions, including the prevention of cross-contamination, and involves microorganism cultivation over several days, which precludes rapid temporal assessment. Although these limitations contrast with real-time HVAC monitoring, they nevertheless provide valuable insight into peak contamination events [39].
The analysis of system performance, carried out in the context of regulating the outdoor air supply to the occupied zones, indicates that the investigated facility operates using a control strategy consistent with demand-controlled ventilation [40,41]. At the beginning and end of the measurement period (08:00 and 18:00), when occupancy was negligible, the outdoor air fraction in the supply airflow remained at the minimum setpoint of 40% (Mode-1). As the indoor CO2 concentration increased, serving as an indicator of occupancy and ventilation demand, in accordance with EN 16798-1:2019 [42] and ASHRAE 62.1-2022 [43], the outdoor air fraction rose proportionally. The system increased the outdoor air fraction to approximately 70% at 12:00 (Mode-2), and ultimately to 100% (Mode-3) during periods of highest occupancy.
This increase in outdoor rate is reflected in the measured indoor air quality parameters. The peak CO2 concentration reached 1114 ppm in Room A at 15:25 and 949 ppm in Room B at 15:10. Assuming relatively uniform visitor activity throughout the exhibition period, these peak values indicate that the highest occupancy occurred between 15:00 and 16:00. The measured CO2 concentrations fall within levels considered acceptable, corresponding to IAQ categories defined in EN 16798-1:2019 [42] and within the limits typically associated with adequately ventilated spaces under ASHRAE Standard 62.1-2022 [43].
The overall increase in indoor CO2 concentration, from background levels to the observed maximum, was approximately 700 ppm, which aligns with recommended thresholds for maintaining acceptable indoor air quality in occupied public buildings [44]. This pattern confirms that the DCV system responded appropriately to varying occupancy loads, increasing ventilation during peak demand and reducing outdoor air intake during low-occupancy periods, thereby supporting both IAQ and energy efficiency objectives.
The fluctuations in the measured CO2 concentration values were comparable to those reported by other researchers [44,45,46], but also significantly higher than those measured in rooms with special ventilation requirements that are supplied with large volumes of outdoor air [47]. As mentioned by Wargocki [48], ventilation is a common method for diluting or removing indoor pollutants; however, the number of conclusive studies on the direct effects of ventilation on human health remains very limited. Therefore, obtaining additional scientific evidence is essential, particularly in systems that rely on central recirculation of return air. In this context, the following discussion focuses on the concentration of microbiological contaminants within the ventilation system and in selected rooms of the operating building.
In the case of AHU I, elevated concentrations of mesophilic bacteria (TNB37) and fungi were observed in the room with sampling point R-A during periods of high visitor traffic, despite the system operating at the maximum outdoor air rate. For example, the maximum measured TNB37 concentration at R-A reached 320 CFU·m−3, while fungal concentrations (TNF Cz-D) peaked at 740 CFU·m−3 at sampling point S-Fan (14:00, Mode-3). A similar pattern was observed for Staphylococcus sp., which exhibited a local maximum of 510 CFU·m−3 in Room R-A at 14:00 while the AHU was operating in Mode-3. Thus, the main issue in this unit is the high load of fungi and mesophilic bacteria occurring precisely during periods of intense visitor occupancy, despite the absence of return-air recirculation.
AHU III, on the other hand, was characterized by markedly elevated fungal counts at sampling points S-ES and S-F (12:00, Mode-2). For example, TNF ME reached up to 500 CFU·m−3, TNF Cz-D up to 460 CFU·m−3, and TNF S up to 500 CFU·m−3 at S-ES, while TNF Cz-D reached 460 CFU·m−3 at S-F. With respect to bacteria, particularly TNB22, a greater variability in concentrations was observed compared with AHU I. The highest TNB22 level (230 CFU·m−3) occurred at sampling point R-A at 12:00 in Mode-2. Mesophilic bacteria (TNB37) showed a similar pattern, reaching 230 CFU·m−3 at R-B at 14:00 (Mode-3), matching the level measured at R-A. Staphylococcus sp. concentrations were relatively low compared with AHU I and with Room R-B, with maximum values of 40–50 CFU·m−3 observed in Modes 2 and 3, and were essentially undetected in Mode-1.
Overall, at 18:00 and 08:00, evening/night and morning (Mode-1), when the system supplied only 40% outdoor air, the lowest CFU·m−3 values were observed across all microbial groups and sampling locations. The highest microbial loads were detected during periods of high visitor traffic, particularly at R-A and S-Fan, at 12:00 and 14:00, when the AHUs were operating with 70% and 100% outdoor air, respectively. Although mesophilic bacteria were often present at lower levels in the AHU sections, the overall pattern indicates an increased microbiological burden during periods of intensive visitor traffic and system operation with mostly outdoor air, and a pronounced decline when visitor activity is reduced or absent, even when the ventilation system operates with a low level of outdoor air.
Additional observations indicate that AHU I exhibited more pronounced problems with mesophilic bacteria and Staphylococcus sp., particularly at R-A, whereas AHU III showed higher fungal loads and greater fluctuations in psychrophilic bacteria. In both cases, the indoor air was associated with the highest bacterial contamination, while the AHU chambers exhibited the highest fungal concentrations.
Museum exhibition halls, due to the presence of organic materials and constant visitor traffic, create a unique ecosystem conducive to the development of diverse microorganisms. In such facilities, filamentous fungi (molds), yeasts, and bacteria are most commonly identified. Molds and yeasts threaten collection conservation through biodeterioration (the physical and chemical degradation of artifacts) and pose risks of allergies and opportunistic infections to staff and visitors. Fungal spores easily penetrate interiors, settling in dust or adhering to surfaces, including exhibits and the air (examples: Aspergillus sp., Penicillium sp., Alternaria sp., Trichoderma sp., Botrytis sp.; yeasts: Candida guilliermondii, Candida sphaerica, Cryptococcus albidus, Cryptococcus laurentii, Cryptococcus neoformans, Sporobolomyces salmonicolor). Primary sources include outdoor air and human activity, while growth is favored by temperatures of 10–35 °C, relative humidity above 60%, and poor ventilation. Cladosporium sp. is associated with external influences and HVAC systems, whereas Stachybotrys sp. is linked to moisture. Bacteria mainly originate from human microbiota (visitors and staff) or dust; Staphylococcus sp. dominates, correlating with human presence, alongside Bacillus sp., which is resilient in harsh conditions due to spore formation [30].
In the EU and in Poland, no uniform, legally binding CFU·m−3 limits exist for all indoor environments. Instead, various documents provide reference ranges that are either experimentally derived or country-specific. The WHO guidelines [49] suggest that total bioaerosol concentrations should generally not exceed approximately 1000 CFU·m−3, while some countries adopt lower thresholds, for example, 500 CFU·m−3 for fungal spores during winter in Finland. Scientific reviews report substantial variability, with reference values ranging from <100 CFU·m−3 to >1000 CFU·m−3. Examples of proposed limits include 150 CFU·m−3 for mixed fungal species or 500 CFU·m−3 for common indoor fungi such as Cladosporium.
In Poland, expert reports [50] indicate alarm thresholds of several thousand CFU·m−3 for industrial environments, whereas public-use spaces typically cite recommended cleanliness classes in the range of 50–500 CFU·m−3. Therefore, total bacterial and fungal concentrations below 1000 CFU·m−3 are generally regarded as indicating slight to moderate pollution, depending on the type of space. However, the local peaks observed in this study (e.g., TNF Cz-D: 740–780 CFU·m−3, Staphylococcus sp.: 510 CFU·m−3) warrant attention, particularly in public areas. Many measured values (e.g., 320 CFU·m−3, 500–780 CFU·m−3) fall within ranges that are not considered alarming in most reference documents, yet they exceed the lower recommended thresholds (e.g., 150–500 CFU·m−3) used in some countries and expert assessments. The analyzed existing building did not reach extreme contamination levels (on the order of several thousand CFU·m−3); however, notable local concentrations of fungi and Staphylococcus sp. were detected, indicating the need for targeted control measures.
Consequently, air filters should be inspected, replaced, or cleaned, and humidity and condensation on cooling coils and within ductwork should be monitored, as excess moisture promotes fungal growth. It may also be advisable to partially cover the open water reservoir, thereby reducing moisture emission into the room and, consequently, into the ventilation system.
The increase in microbiological contamination during peak hours, despite the AHUs operating with 100% outdoor air, suggests that the ventilation airflow rate supplied to the rooms is insufficient. Under conditions of substantially higher visitor density, such as during holidays, vacation periods, or special events, this may lead to significant exceedances in CO2 concentration (as reported by facility personnel responsible for system operation), as well as to further increases in microbiological contamination.
5. Conclusions and Future Work
Despite the DCV strategy responding appropriately to indoor CO2 concentrations, raising the outdoor air fraction from 40% to 70% and 100% during peak occupancy, local increases in microbial contamination were detected. Peak CO2 levels (949–1114 ppm) remained within acceptable IAQ categories defined in EN 16798-1:2019 and ASHRAE 62.1-2022, yet they coincided with an elevated total number of Staphylococcus sp., and mesophilic bacteria.
Across all microbial groups, the lowest CFU·m−3 values were observed at low-occupancy times (08:00 and 18:00), whereas the highest occurred during peak visitor traffic (12:00–14:00), even when the system operated with 100% outdoor air. However, the building did not reach extreme contamination levels (>1000 CFU·m−3).
A correlation was observed between mesophilic bacteria and CO2 concentration, as well as between Staphylococcus spp. and CO2, in both examined AHU systems. These correlations were present only within the occupied zones. While elevated CO2 levels in the occupied areas coincided with increased concentrations of mesophilic bacteria and Staphylococcus sp., the microbial environment inside the AHUs remained relatively clean. The findings suggest that the AHU air filters effectively limit microbial contamination and that air recirculation can operate safely. Nevertheless, additional research is required to confirm this conclusion.
Future research should explore several directions:
- Long-term monitoring across multiple seasons, daytime and ventilation mode
Extended measurement campaigns would help capture the influence of outdoor climate, seasonal and daily humidity, and visitor patterns on microbiological air quality.
- 2.
- Quantitative assessment of ventilation effectiveness
Measurements of CO2 concentration during daytime could identify airflow shortfalls in exhibition rooms with high occupancy.
- 3.
- Microbial source tracking (MST)
Molecular methods (e.g., qPCR, metabarcoding) could provide deeper insight into the origin of microorganisms—distinguishing between human-associated, outdoor-derived, and system-related bioaerosols.
- 4.
- Evaluation of filtration performance under dynamic loads
Performance testing of filters under varying humidity and airflow conditions could clarify the causes of fungal peaks in AHU III.
- 5.
- Visitor behavior analytics
Integrating occupancy sensors or people-flow models may help optimize ventilation schedules and anticipate microbiological load during large events.
Therefore, further interdisciplinary work combining microbiology, HVAC engineering, and indoor environmental science is required to develop evidence-based ventilation strategies for public buildings with highly variable occupancy, such as museums.
Author Contributions
Conceptualization, S.S. and K.P.; methodology, S.S. and A.T.; validation, S.S., J.W. and K.P.; formal analysis, S.S. and K.P.; investigation, S.S. and A.T.; resources, S.S. and A.T.; data curation, S.S., A.T. and J.W.; writing—original draft preparation, S.S. and K.P.; writing—review and editing, S.S., J.W. and K.P.; visualization, S.S.; supervision, K.P. All authors have read and agreed to the published version of the manuscript.
Funding
The work was supported by the National Science Centre, Poland, under research project entitled: “Impact of condensate in air-conditioning systems on secondary microbiological pollution of indoor air”, no 2021/41/B/ST8/03402.
Institutional Review Board Statement
Not applicable.
Informed Consent Statement
Not applicable.
Data Availability Statement
The data presented in this study are available on request from the corresponding author.
Conflicts of Interest
The authors declare no conflicts of interest.
References
- Stryjakowska-Sekulska, M.; Piotraszewska-Pająk, A.; Szyszka, A.; Nowicki, M.; Filipiak, M. Microbiological Quality of Indoor Air in University Rooms. Pol. J. Environ. Stud. 2007, 16, 623. [Google Scholar]
- Andualem, Z.; Gizaw, Z.; Bogale, L.; Dagne, H. Indoor Bacterial Load and Its Correlation to Physical Indoor Air Quality Parameters in Public Primary Schools. Multidiscip. Respir. Med. 2019, 14, 2. [Google Scholar] [CrossRef]
- U.S. Environmental Protection Agency (EPA). Indoor Air Facts No. 4 Sick Building Syndrome; U.S. Environmental Protection Agency (EPA): Washington, DC, USA, 1991.
- Liu, G.; Xiao, M.; Zhang, X.; Gal, C.; Chen, X.; Liu, L.; Pan, S.; Wu, J.; Tang, L.; Clements-Croome, D. A Review of Air Filtration Technologies for Sustainable and Healthy Building Ventilation. Sustain. Cities Soc. 2017, 32, 375–396. [Google Scholar] [CrossRef]
- Wang, M.; Li, L.; Hou, C.; Guo, X.; Fu, H. Building and Health: Mapping the Knowledge Development of Sick Building Syndrome. Buildings 2022, 12, 287. [Google Scholar] [CrossRef]
- Piekarska, K.; Trusz, A.; Szczęśniak, S. Bacteria and Fungi in Two Air Handling Units with Air Recirculating Module. Energy Build. 2018, 178, 154–164. [Google Scholar] [CrossRef]
- Sibanda, T.; Selvarajan, R.; Ogola, H.J.; Obieze, C.C.; Tekere, M. Distribution and Comparison of Bacterial Communities in HVAC Systems of Two University Buildings: Implications for Indoor Air Quality and Public Health. Environ. Monit. Assess. 2021, 193, 47. [Google Scholar] [CrossRef]
- Chawla, H.; Anand, P.; Garg, K.; Bhagat, N.; Varmani, S.G.; Bansal, T.; McBain, A.J.; Gulati Marwah, R. A Comprehensive Review of Microbial Contamination in the Indoor Environment: Sources, Sampling, Health Risks, and Mitigation Strategies. Front. Public Health 2023, 11, 1285393. [Google Scholar] [CrossRef]
- Ye, Y.; Aizezi, N.; Feng, J.; Han, B.; Li, X.; Su, Z.; Li, L.; Liu, Y. Advanced Characterization of Industrial Smoke: Particle Composition and Size Analysis with Single Particle Aerosol Mass Spectrometry and Optimized Machine Learning. Anal. Chem. 2025, 97, 5562. [Google Scholar] [CrossRef]
- Sarkhosh, M.; Najafpoor, A.A.; Alidadi, H.; Shamsara, J.; Amiri, H.; Andrea, T.; Kariminejad, F. Indoor Air Quality Associations with Sick Building Syndrome: An Application of Decision Tree Technology. Build. Environ. 2021, 188, 107446. [Google Scholar] [CrossRef]
- Norbäck, D.; Hashim, J.H.; Markowicz, P.; Cai, G.H.; Hashim, Z.; Ali, F.; Larsson, L. Endotoxin, Ergosterol, Muramic Acid and Fungal DNA in Dust from Schools in Johor Bahru, Malaysia—Associations with Rhinitis and Sick Building Syndrome (SBS) in Junior High School Students. Sci. Total Environ. 2016, 545–546, 95–103. [Google Scholar] [CrossRef]
- Basińska, M.; Michałkiewicz, M. Experience from Research on Indoor and Outdoor Air Quality in the Poznań Agglomeration. Atmosphere 2025, 16, 600. [Google Scholar] [CrossRef]
- Limon, J.J.; Skalski, J.H.; Underhill, D.M. Commensal Fungi in Health and Disease. Cell Host Microbe 2017, 22, 156–165. [Google Scholar] [CrossRef]
- Guo, K.; Qian, H.; Ye, J.; Sun, F.; Zhuge, Y.; Wang, S.; Liu, C.; Cao, G.; Zheng, X. Assessment of Airborne Bacteria and Fungi in Different-Type Buildings in Nanjing, a Hot Summer and Cold Winter Moist Chinese City. Build. Environ. 2021, 205, 108258. [Google Scholar] [CrossRef]
- Ribeiro, E.; Mira, A.R.; Ponte, T.; Oliveira, K. Airborne Transmission of Bacteria Bioburden. In Viruses, Bacteria and Fungi in the Built Environment: Designing Healthy Indoor Environments; Woodhead Publishing: London, UK, 2022; pp. 127–145. [Google Scholar] [CrossRef]
- Weschler, C.J.; Shields, H.C. The Influence of Ventilation on Reactions Among Indoor Pollutants: Modeling and Experimental Observations. Indoor Air 2000, 10, 92–100. [Google Scholar] [CrossRef] [PubMed]
- Wu, Z.; Lyu, H.; Ma, X.; Ren, G.; Song, J.; Jing, X.; Liu, Y. Comparative Effects of Environmental Factors on Bacterial Communities in Two Types of Indoor Dust: Potential Risks to University Students. Environ. Res. 2022, 203, 111869. [Google Scholar] [CrossRef]
- Carducci, A.; Federigi, I.; Verani, M. COVID-19 Airborne Transmission and Its Prevention: Waiting for Evidence or Applying the Precautionary Principle? Atmosphere 2020, 11, 710. [Google Scholar] [CrossRef]
- Liu, Z.; Ma, S.; Cao, G.; Meng, C.; He, B.J. Distribution Characteristics, Growth, Reproduction and Transmission Modes and Control Strategies for Microbial Contamination in HVAC Systems: A Literature Review. Energy Build. 2018, 177, 77–95. [Google Scholar] [CrossRef]
- Gorlach, J.; Gazda, D.; Trusz, A.; Walaszczyk, J.; Szczęśniak, S.; Piekarska, K. Ventilation and Air Conditioning Systems Are a Source of Antibiotic-Resistant Bacteria—A Review. Build. Environ 2025, 271, 112583. [Google Scholar] [CrossRef]
- Menteşe, S. Airborne Bacteria and Sick Building Syndrome (SBS). In Viruses, Bacteria and Fungi in the Built Environment: Designing Healthy Indoor Environments; Woodhead Publishing: London, UK, 2022; pp. 147–178. [Google Scholar] [CrossRef]
- Lv, Y.; Hu, G.; Wang, C.; Yuan, W.; Wei, S.; Gao, J.; Wang, B.; Song, F. Actual Measurement, Hygrothermal Response Experiment and Growth Prediction Analysis of Microbial Contamination of Central Air Conditioning System in Dalian, China. Sci. Rep. 2017, 7, 44190. [Google Scholar] [CrossRef] [PubMed]
- Zhang, B.Y.; Liu, F.; Chen, X.D. The Effect of Legionella Pneumophila Contamination in the Surface Dust of the Air Ducts of Central Air Conditioning Systemson Indoor Air Quality. Int. J. Vent. 2015, 14, 231–240. [Google Scholar] [CrossRef]
- Tang, J.W. The Effect of Environmental Parameters on the Survival of Airborne Infectious Agents. J. R. Soc. Interface 2009, 6, S737–S746. [Google Scholar] [CrossRef]
- Lv, Y.; Wang, C.; Yuan, W.; Wei, S.; Gao, J.; Wang, B.; Song, F. Actual Measurement and Analysis on Microbial Contamination in Central Air Conditioning System at a Venue in Dalian, China. Procedia Eng. 2016, 146, 147–154. [Google Scholar] [CrossRef]
- Calderón-Garcidueñas, L.; Kulesza, R.J.; Doty, R.L.; D’Angiulli, A.; Torres-Jardón, R. Megacities Air Pollution Problems: Mexico City Metropolitan Area Critical Issues on the Central Nervous System Pediatric Impact. Environ. Res. 2015, 137, 157–169. [Google Scholar] [CrossRef]
- Kumar, P.; Singh, A.B.; Arora, T.; Singh, S.; Singh, R. Critical Review on Emerging Health Effects Associated with the Indoor Air Quality and Its Sustainable Management. Sci. Total Environ. 2023, 872, 162163. [Google Scholar] [CrossRef] [PubMed]
- Mannan, M.; Al-Ghamdi, S.G. A Comprehensive Review on the Factors Influencing Air Pollution in Residential and Commercial Structure. Int. J. Environ. Res. Public Health 2021, 18, 3276. [Google Scholar] [CrossRef]
- Nakayama, Y.; Nakaoka, H.; Suzuki, N.; Tsumura, K.; Hanazato, M.; Todaka, E.; Mori, C. Prevalence and Risk Factors of Pre-Sick Building Syndrome: Characteristics of Indoor Environmental and Individual Factors. Environ. Health Prev. Med. 2019, 24, 77. [Google Scholar] [CrossRef]
- Ilieș, D.C.; Safarov, B.; Caciora, T.; Ilieș, A.; Grama, V.; Ilies, G.; Huniadi, A.; Zharas, B.; Hodor, N.; Sandor, M.; et al. Museal Indoor Air Quality and Public Health: An Integrated Approach for Exhibits Preservation and Ensuring Human Health. Sustainability 2022, 14, 2462. [Google Scholar] [CrossRef]
- Honan, D.; Garvey, J.; Littlewood, J.; Horrigan, M.; Gallagher, J. The Nexus Between Indoor and Outdoor Environmental Conditions and Teacher Perceptions in Naturally Ventilated Primary School Classrooms, in Ireland. Sustainability 2025, 17, 9873. [Google Scholar] [CrossRef]
- Catrambone, M.; Cristiani, E.; Riminesi, C.; Onofri, E.; Buemi, L.P. Assessing the Combined Influence of Indoor Air Quality and Visitor Flow Toward Preventive Conservation at the Peggy Guggenheim Collection. Atmosphere 2025, 16, 860. [Google Scholar] [CrossRef]
- Tsay, M.D.; Tseng, C.C.; Wu, N.X.; Lai, C.Y. Size Distribution and Antibiotic-Resistant Characteristics of Bacterial Bioaerosol in Intensive Care Unit before and during Visits to Patients. Environ. Int. 2020, 144, 106024. [Google Scholar] [CrossRef] [PubMed]
- Asif, A.; Zeeshan, M. Indoor Temperature, Relative Humidity and CO2 Monitoring and Air Exchange Rates Simulation Utilizing System Dynamics Tools for Naturally Ventilated Classrooms. Build. Environ. 2020, 180, 106980. [Google Scholar] [CrossRef]
- Ilieș, A.; Caciora, T.; Ilieș, G.; Hassan, T.H.; Berdenov, Z.; Ilieș, D.C.; Pereș, A.C.; Safarov, B.; Grama, V.; Sabina, H.; et al. An Integrated Risk Assessment Model for Indoor Air Quality Impacts on Museum Exhibits and Human Health Using Microclimatic Indices and AgNPs Treatment. PLoS ONE 2025, 20, e0336594. [Google Scholar] [CrossRef]
- Drougka, F.; Liakakou, E.; Sakka, A.; Mitsos, D.; Zacharias, N.; Mihalopoulos, N.; Gerasopoulos, E. Indoor Air Quality Assessment at the Library of the National Observatory of Athens, Greece. Aerosol Air Qual. Res. 2020, 20, 889–903. [Google Scholar] [CrossRef]
- Sulaiman, R.; Kamaruzzaman, S.N.; Yau, Y.H. Indoor Air Quality Performance in Air-Conditioned Museum Gallery. IOP Conf. Ser. Mater. Sci. Eng. 2019, 609, 42098. [Google Scholar] [CrossRef]
- Zhang, S.; Ai, Z.; Lin, Z. Novel Demand-Controlled Optimization of Constant-Air-Volume Mechanical Ventilation for Indoor Air Quality, Durability and Energy Saving. Appl. Energy 2021, 293, 116954. [Google Scholar] [CrossRef]
- Fedele, A.; Colantoni, A.; Calabrò, G.; Scungio, M.; Rossi, S.; Taborri, J. Measuring CO2 Concentration and Thermal Comfort in Italian University Classrooms: A Seasonal Analysis. Sensors 2025, 25, 1970. [Google Scholar] [CrossRef] [PubMed]
- Schell, M.; Int-Hout, D. Demand Control Ventilation Using CO2. ASHRAE J. 2001, 43, 18–29. [Google Scholar]
- Erickson, V.L.; Cerpa, A.E. Occupancy Based Demand Response HVAC Control Strategy; Association for Computing Machinery: New York, NY, USA, 2010; pp. 7–12. [Google Scholar]
- EN 16798-1:2019; Energy Performance of Buildings—Ventilation for Buildings—Part 1: Indoor Environmental Input Parameters for Design and Assessment of Energy Performance of Buildings Addressing Indoor Air Quality, Thermal Environment, Lighting and Acoustics. European Committee for Standardization (CEN): Brussels, Belgium, 2019.
- ANSI/ASHRAE Standard 62.1-2022; Ventilation for Acceptable Indoor Air Quality. ASHRAE: Atlanta, GA, USA, 2022.
- Lowther, S.D.; Dimitroulopoulou, S.; Foxall, K.; Shrubsole, C.; Cheek, E.; Gadeberg, B.; Sepai, O. Low Level Carbon Dioxide Indoors-A Pollution Indicator or a Pollutant? A Health-Based Perspective. Environments 2021, 8, 125. [Google Scholar] [CrossRef]
- Kapalo, P.; Domniţa, F.; Bacoţiu, C.; Spodyniuk, N. The Impact of Carbon Dioxide Concentration on the Human Health—Case Study. J. Appl. Eng. Sci. 2018, 8, 61–66. [Google Scholar] [CrossRef]
- Dudkiewicz, E.; Laska, M.; Fidorów-Kaprawy, N. Users’ Sensations in the Context of Energy Efficiency Maintenance in Public Utility Buildings. Energies 2021, 14, 8159. [Google Scholar] [CrossRef]
- Kumar, S.H.; Kanish, T.C. Machine Learning Approach to Predict and Compare the Air Quality Index in a Confined Environment. Environ. Prot. Eng. 2024, 50, 5–27. [Google Scholar] [CrossRef]
- PWargocki, P.; Sundell, J.; Bischof, W.; Brundrett, G.; Fanger, P.O.; Gyntelberg, F.; Hanssen, S.O.; Harrison, P.; Pickering, A.; Seppänen, O.; et al. Ventilation and Health in Non-Industrial Indoor Environments: Report from a European Multidisciplinary Scientific Consensus Meeting (EUROVEN). Indoor Air 2002, 12, 113–128. [Google Scholar] [CrossRef] [PubMed]
- World Health Organization. Guidelines for Indoor Air Quality: Dampness and Mould; World Health Organization: Genewa, Switzerland, 2009. [Google Scholar]
- Michałkiewicz, M. Metody Badań Mikrobiologicznego Zanieczyszczenia Powietrza Na Terenach Oczyszczalni Ścieków—Przegląd Literaturowy. Kosmos 2019, 3, 475–487. [Google Scholar] [CrossRef]


Disclaimer/Publisher’s Note: The statements, opinions and data contained in all publications are solely those of the individual author(s) and contributor(s) and not of MDPI and/or the editor(s). MDPI and/or the editor(s) disclaim responsibility for any injury to people or property resulting from any ideas, methods, instructions or products referred to in the content. |
© 2026 by the authors. Licensee MDPI, Basel, Switzerland. This article is an open access article distributed under the terms and conditions of the Creative Commons Attribution (CC BY) license.