1. Introduction
How underdeveloped regions can address diverse regional challenges and sustain economic growth has long been a central concern of social scientists and policymakers [
1,
2,
3]. Tackling the problem can help remove institutional barriers to growth and achieve balanced regional development [
4].
In the existing literature, scholars often investigate the institutional impact on regional economies through geographical and historical factors. For example, Acemoglu et al. (2001, 2005) argue that geography played a crucial role in shaping early institutions, with long-lasting consequences for national growth [
5,
6]. Dell et al. (2010) examine Peru’s Mita system and find that, despite its abolition, the legacy of Mita continues to influence resource distribution, political power, and trust [
7]. Regional development policies, meanwhile, show heterogeneous effects across contexts: Brazil’s Amazon development plan [
8], Italy’s Southern development scheme [
9], and Indonesia’s transmigration program [
10] all spurred short-term growth but failed to sustain productivity improvements, while also facing limited educational investment and weak policy continuity. In contrast, China’s regional policies emphasize comprehensive systems: the central government formulates strategic plans and sets overarching objectives, while local governments devise concrete action schemes with detailed targets [
11]. Such policies have mitigated locational disadvantages and inadequate endowments, enabling economic takeoff [
12,
13]. Notably, to accelerate border development, China formally launched the Program of Border Areas Revitalization and Poverty Alleviation in 2000, which built on regional endowments and implemented strategic plans in economic growth, income distribution, public goods, characteristic industries, and fiscal-financial support. By promoting tourism, green agriculture and animal husbandry, and cross-border trade, the program has delivered sustained economic growth in border areas.
In underdeveloped regions, public goods provision is often regarded as a priority [
14]. Fiscal expenditure improves governance quality and helps achieve development goals [
15]. Yet fiscal governance systems vary across countries, and decentralization affects the supply of public goods [
16,
17]. It results in inconsistent fiscal powers [
18], inefficient resource allocation, and cost overruns [
19,
20,
21]. By contrast, Inner Mongolia provides a suitable case: local governments hold comparable decision-making authority in economic, administrative, personnel, and fiscal affairs, enabling clearer identification of policy impacts. Moreover, border and non-border regions share similar natural features and demographic structures and exhibited parallel economic trends before policy implementation, offering a favorable quasi-natural experiment consistent with counterfactual requirements. Using a spatial regression discontinuity approach and building on Henderson et al. (2012) on the elasticity of nighttime lights to income, this paper finds that increased light intensity boosted border GDP growth rates by 1.03%, with declining intra-border disparities and more balanced regional activity [
22]. Furthermore, government expenditure and infrastructure construction alleviated financing constraints, improved locational conditions, and enhanced interregional connectivity [
23,
24]. Robustness checks accounting for cross-regional flows confirm these results.
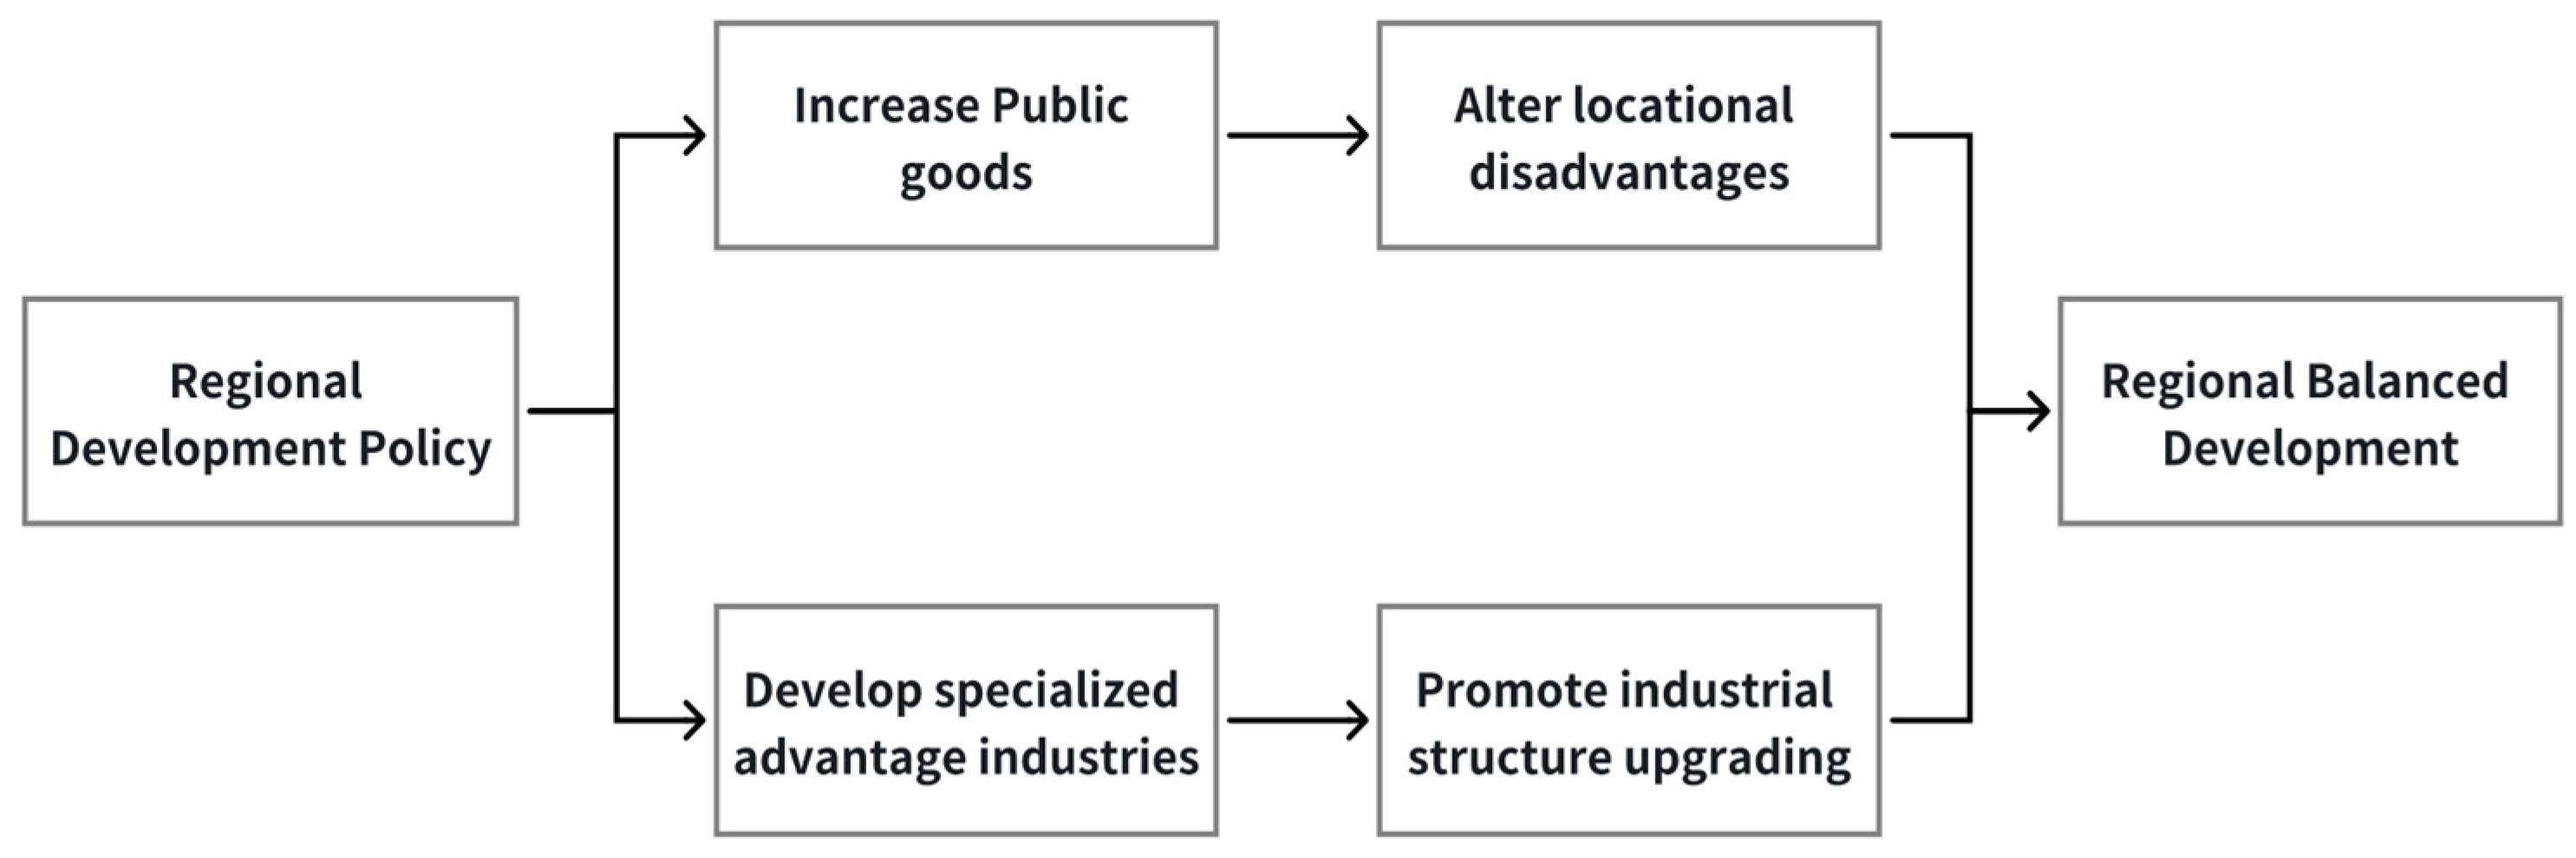
Theoretically, this study argues that regional policies promote border economic development mainly through the pathway of “public goods provision—development of characteristic industries—improvement of locational conditions.” Fiscal spending expands public goods supply, easing capital constraints while enhancing human capital and factor mobility. Regional policies encourage local governments to leverage comparative advantages and endowments, supporting green agriculture, ecotourism, and renewable energy industries, which drive industrial upgrading and endogenous growth. Infrastructure and cross-border cooperation reduce factor mobility costs, shifting border areas from “locational disadvantage” toward an “open frontier.” Importantly, public goods provision supports industry development, characteristic industries stimulate fiscal revenues, and locational improvements magnify spillover effects. Together, these dynamics form the foundation of border development and provide an institutionalized path toward green development and ecological civilization.
Despite previous research examining the impacts of regional policies [
25,
26,
27], a consensus regarding impoverished regions continues to be unattainable. The majority of research has concentrated on developed regions [
28,
29,
30,
31,
32], neglecting border economies. Border regions are frequently seen as unique functional areas [
33], where locational limitations impede factor mobility and restrict growth [
34,
35]. Notably, underdeveloped regions face the dilemma of balancing industrialization and sustainable development while pursuing economic growth [
36]. Meanwhile, to achieve economic development, these regions often accelerate industrialization, which may exacerbate environmental pressures such as carbon footprints. However, enhancing industrial competitiveness and relying on renewable energy are expected to achieve compatibility between emission reduction and development, thereby realizing sustainable development [
37]. Furthermore, the majority of research employs a macro perspective, with less micro-level investigation. This paper makes three contributions: first, it introduces a spatial regression discontinuity design to identify micro-level policy effects, thereby enhancing causal inference; second, by examining Inner Mongolia—a representative case regarding endowments, location, and policy support—the study offers micro-level evidence for border development and insights for underdeveloped regions; and third, it reveals the mechanisms by which regional policies modify initial constraints in the provision of public goods, development of characteristic industries, locational enhancements, and mitigation of disparities.
The remainder of this paper is organized as follows:
Section 2 introduces the policy and regional background,
Section 3 presents data and empirical strategy,
Section 4 provides empirical analysis and robustness checks,
Section 5 examines mechanisms of policy-driven growth,
Section 6 explores intra-regional disparities and sustainability, and
Section 7 concludes.
3. Data and Empirical Strategy
3.1. Data
This study primarily relies on the following datasets.
First, nighttime light remote sensing data are used to measure economic activity in border areas. Since township-level economic growth data in China are not publicly available, we employ DMSP-OLS nighttime light data, with reference to the study of Wu et al. (2021) [
47]. Specifically, the DMSP-OLS data for the 1999–2013 period were calibrated using a quadratic model anchored in the “pseudo-invariant pixel” method before being fitted with the 2022 administrative boundaries of Inner Mongolia using ArcGIS 10.8. For the purpose of ensuring data completeness and consistency across the entire study period, we further applied an exponential smoothing model to predict and fill in missing values for the monthly SNPP-VIIRS data covering 2013–2022 and conducted a rigorous screening process to eliminate outliers and noise from the annual aggregated data. On this basis, a sigmoid model was employed to produce simulated DMSP-OLS (SDMSP-OLS) data for the 2013–2022 period, which was then merged with the calibrated 1999–2013 DMSP-OLS data. After projection adjustment and continuity correction for the integrated dataset, we finally obtained annual light intensity values for the full 1999–2022 timeframe. Following Henderson et al. (2012) [
22], we use the elasticity between nighttime light growth and GDP growth (1% corresponding to 0.3%) to measure the relationship between light intensity and economic performance. Given that this coefficient is based on global samples and may not be directly applicable to Inner Mongolia, we further estimate a localized conversion coefficient by regressing prefecture-level GDP data against light intensity and compare the results with Henderson et al.’s benchmark. The two estimates are highly consistent, indicating that our conclusions do not rely on a specific elasticity assumption. In addition, we calculate the Theil index of nighttime light to capture intra-border regional disparities.
Second, data on public goods and distinctive industries are used to examine locational and endowment conditions in border areas. Fiscal expenditure, serving as the financial source for public goods provision, is measured using the share of fiscal spending, with data obtained from the China County and Township Statistical Yearbook (county-level volume). Transportation infrastructure, a crucial public good for economic development in border areas, is proxied by the mileage of township roads, county roads, and total road length within the region. These data are drawn from the global open-source mapping project OpenStreetMap (OSM) and matched with Inner Mongolia’s administrative boundaries using ArcGIS 10.8. (The cross-sectional data used in this study are from the year 2022, due to the unavailability of data prior to the policy implementation. Although this limitation prevents an examination of the full dynamic effects of the policy, it still allows for an assessment of its prospective impacts). We also incorporate indicators of public services, including the number of schools for basic and adult education, as well as the number of hospitals, clinics, and pharmacies. These data are collected from Baidu Maps and Gaode Maps. To assess the development of distinctive industries, we use the sectoral shares of primary and tertiary industries, also from the China County and Township Statistical Yearbook (county-level volume). Furthermore, we employ 2022 Points of Interest (POI) data to capture industry development, including the number of industrial parks, homestays, and travel agencies as proxies for modern industries and border tourism. Agricultural development is measured using the China Agricultural Cropland Dataset (CACD), a 30-m resolution dataset generated on the Google Earth Engine cloud computing platform.
Third, ecological and environmental indicators are employed to assess environmental protection and green development in border areas, which are also core tasks of the Revitalizing Border Areas and Enriching the People Initiative. Specifically, we use the degree of desertification, vegetation coverage, and PM2.5 concentration to represent land productivity, vegetation cover, and air quality, respectively. Data on desertification and vegetation coverage are mainly derived from MODIS (Moderate Resolution Imaging Spectroradiometer), with desertification indicators constructed through information overlay, classification, and discrimination analysis. PM2.5 concentration data come from global gridded datasets provided by Washington University in St. Louis. These environmental data are integrated with Inner Mongolia’s administrative boundaries using ArcGIS 10.8.
Fourth, geographic variables and population density are included as control variables. Geographic variables include slope, aspect, and elevation data, sourced from high-resolution topographic surveys jointly conducted by the National Geospatial-Intelligence Agency (NGA) and the National Imagery and Mapping Agency (NIMA). These indicators reflect the natural geographic features of the region. Population distribution data are derived from the LandScan program initiated by Oak Ridge National Laboratory (ORNL). We use 30-m resolution gridded population density data from 2000 to 2022 to capture the spatial distribution of population.
After excluding observations with missing values, the total sample consists of 1022 observations. Within a bandwidth of 50 km, the sample size is 323, and within a bandwidth of 30 km, the sample size is 214. Descriptive statistics are reported in
Table 1.
3.2. Empirical Strategy
Given the comparable geographic and socio-economic characteristics of Inner Mongolia’s border and non-border regions, we adopt a regression discontinuity (RD) design to analyze economic activities and development disparities. Following Jia et al. (2021) [
48], the model is specified as follows:
Here,
denotes the outcome variable for the administrative unit
, measured as the growth rate of nighttime light intensity. Since some areas report zero light intensity, we log-transform the light value after adding 1:
Equation (2) measures the cumulative growth rate of nighttime light intensity of the i-th administrative unit over the study period, with its design rationale and variable definitions specified as follows:
Zero-value adjustment: We add 1 to the light intensity values prior to logarithmic transformation to avoid the undefined issue of logarithmic operation on zero light intensity values. This treatment effectively mitigates heteroscedasticity and renders the estimated coefficients interpretable.
Variable definitions: and represent the raw nighttime light intensity values of the i-th administrative unit in 2022 (the terminal year of the study period) and 1999 (the base year of the study period, prior to the full implementation of the Program of Border Areas Revitalization and Poverty Alleviation), respectively. The difference between the two logarithmic terms directly reflects the long-term growth trend of regional economic activities proxied by nighttime light intensity.
Linkage to the identification strategy: The constructed by Equation (2) serves as the outcome variable in Equation (1), acting as a valid measure of regional economic growth. By focusing on the cumulative growth rate between the pre-policy base year and the terminal year, we eliminate the interference of short-term economic fluctuations and thus accurately capture the long-term impact of the policy.
is a binary indicator for townships, where 1 indicates a border region and 0 otherwise. captures the economic effect of the Prosperous Border Program. The function controls for spatial factors via a bivariate polynomial of longitude and latitude. We compute the geographic centroid of each unit and its distance to the border boundary (our running variable). A positive value indicates distance from the border inside border townships, and a negative value indicates distance from non-border townships. includes control variables such as slope, aspect, elevation, and population density, while is the error term. We use robust standard errors to mitigate the influence of random shocks.
Equation (1) can be estimated using two approaches: the local linear method and the global polynomial method. This paper primarily employs local linear regression, applying a narrow bandwidth around the cutoff and controlling for longitude–latitude polynomials and other covariates, while using global polynomial regression as a robustness check.
Given the absence of a universally optimal bandwidth [
49], the bandwidth is set at 30 km for township-level analysis and 50 km for county-level analysis. The rationale is threefold: first, these ranges broadly correspond to the actual spatial extent of regional economic activities. Second, overly narrow bandwidths may lead to insufficient sample size and overly sensitive estimates, while excessively wide bandwidths risk incorporating confounding factors that dilute policy effects. The chosen 30 km and 50 km settings strike a balance between “locality” and “sample adequacy,” thereby capturing border policy effects more accurately. Third, further supported as well as robustness checks under various kernel functions, the results remain consistent across bandwidths ranging from 20 to 80 km, confirming the validity of the bandwidth choice. To further ensure reliability, this study also reports results across different bandwidths, which reflect the spatial trend of policy impacts, i.e., the way policy effects vary with distance from the border.
3.3. Balance Tests
The validity of regression results depends on discontinuity in the outcome variable and continuity in the covariates. If nighttime light intensity shows a discontinuity between border and non-border regions, it indicates spatial differences in economic activity; otherwise, no such differences exist. Hahn et al. (2001) argue that including covariates does not affect the validity of regression discontinuity estimates [
50]. To this end, a bandwidth of 100 km is adopted, applying local linear regression with a triangular kernel to test for continuity and discontinuity in both the dependent and control variables. This approach also helps mitigate potential manipulation of the cutoff.
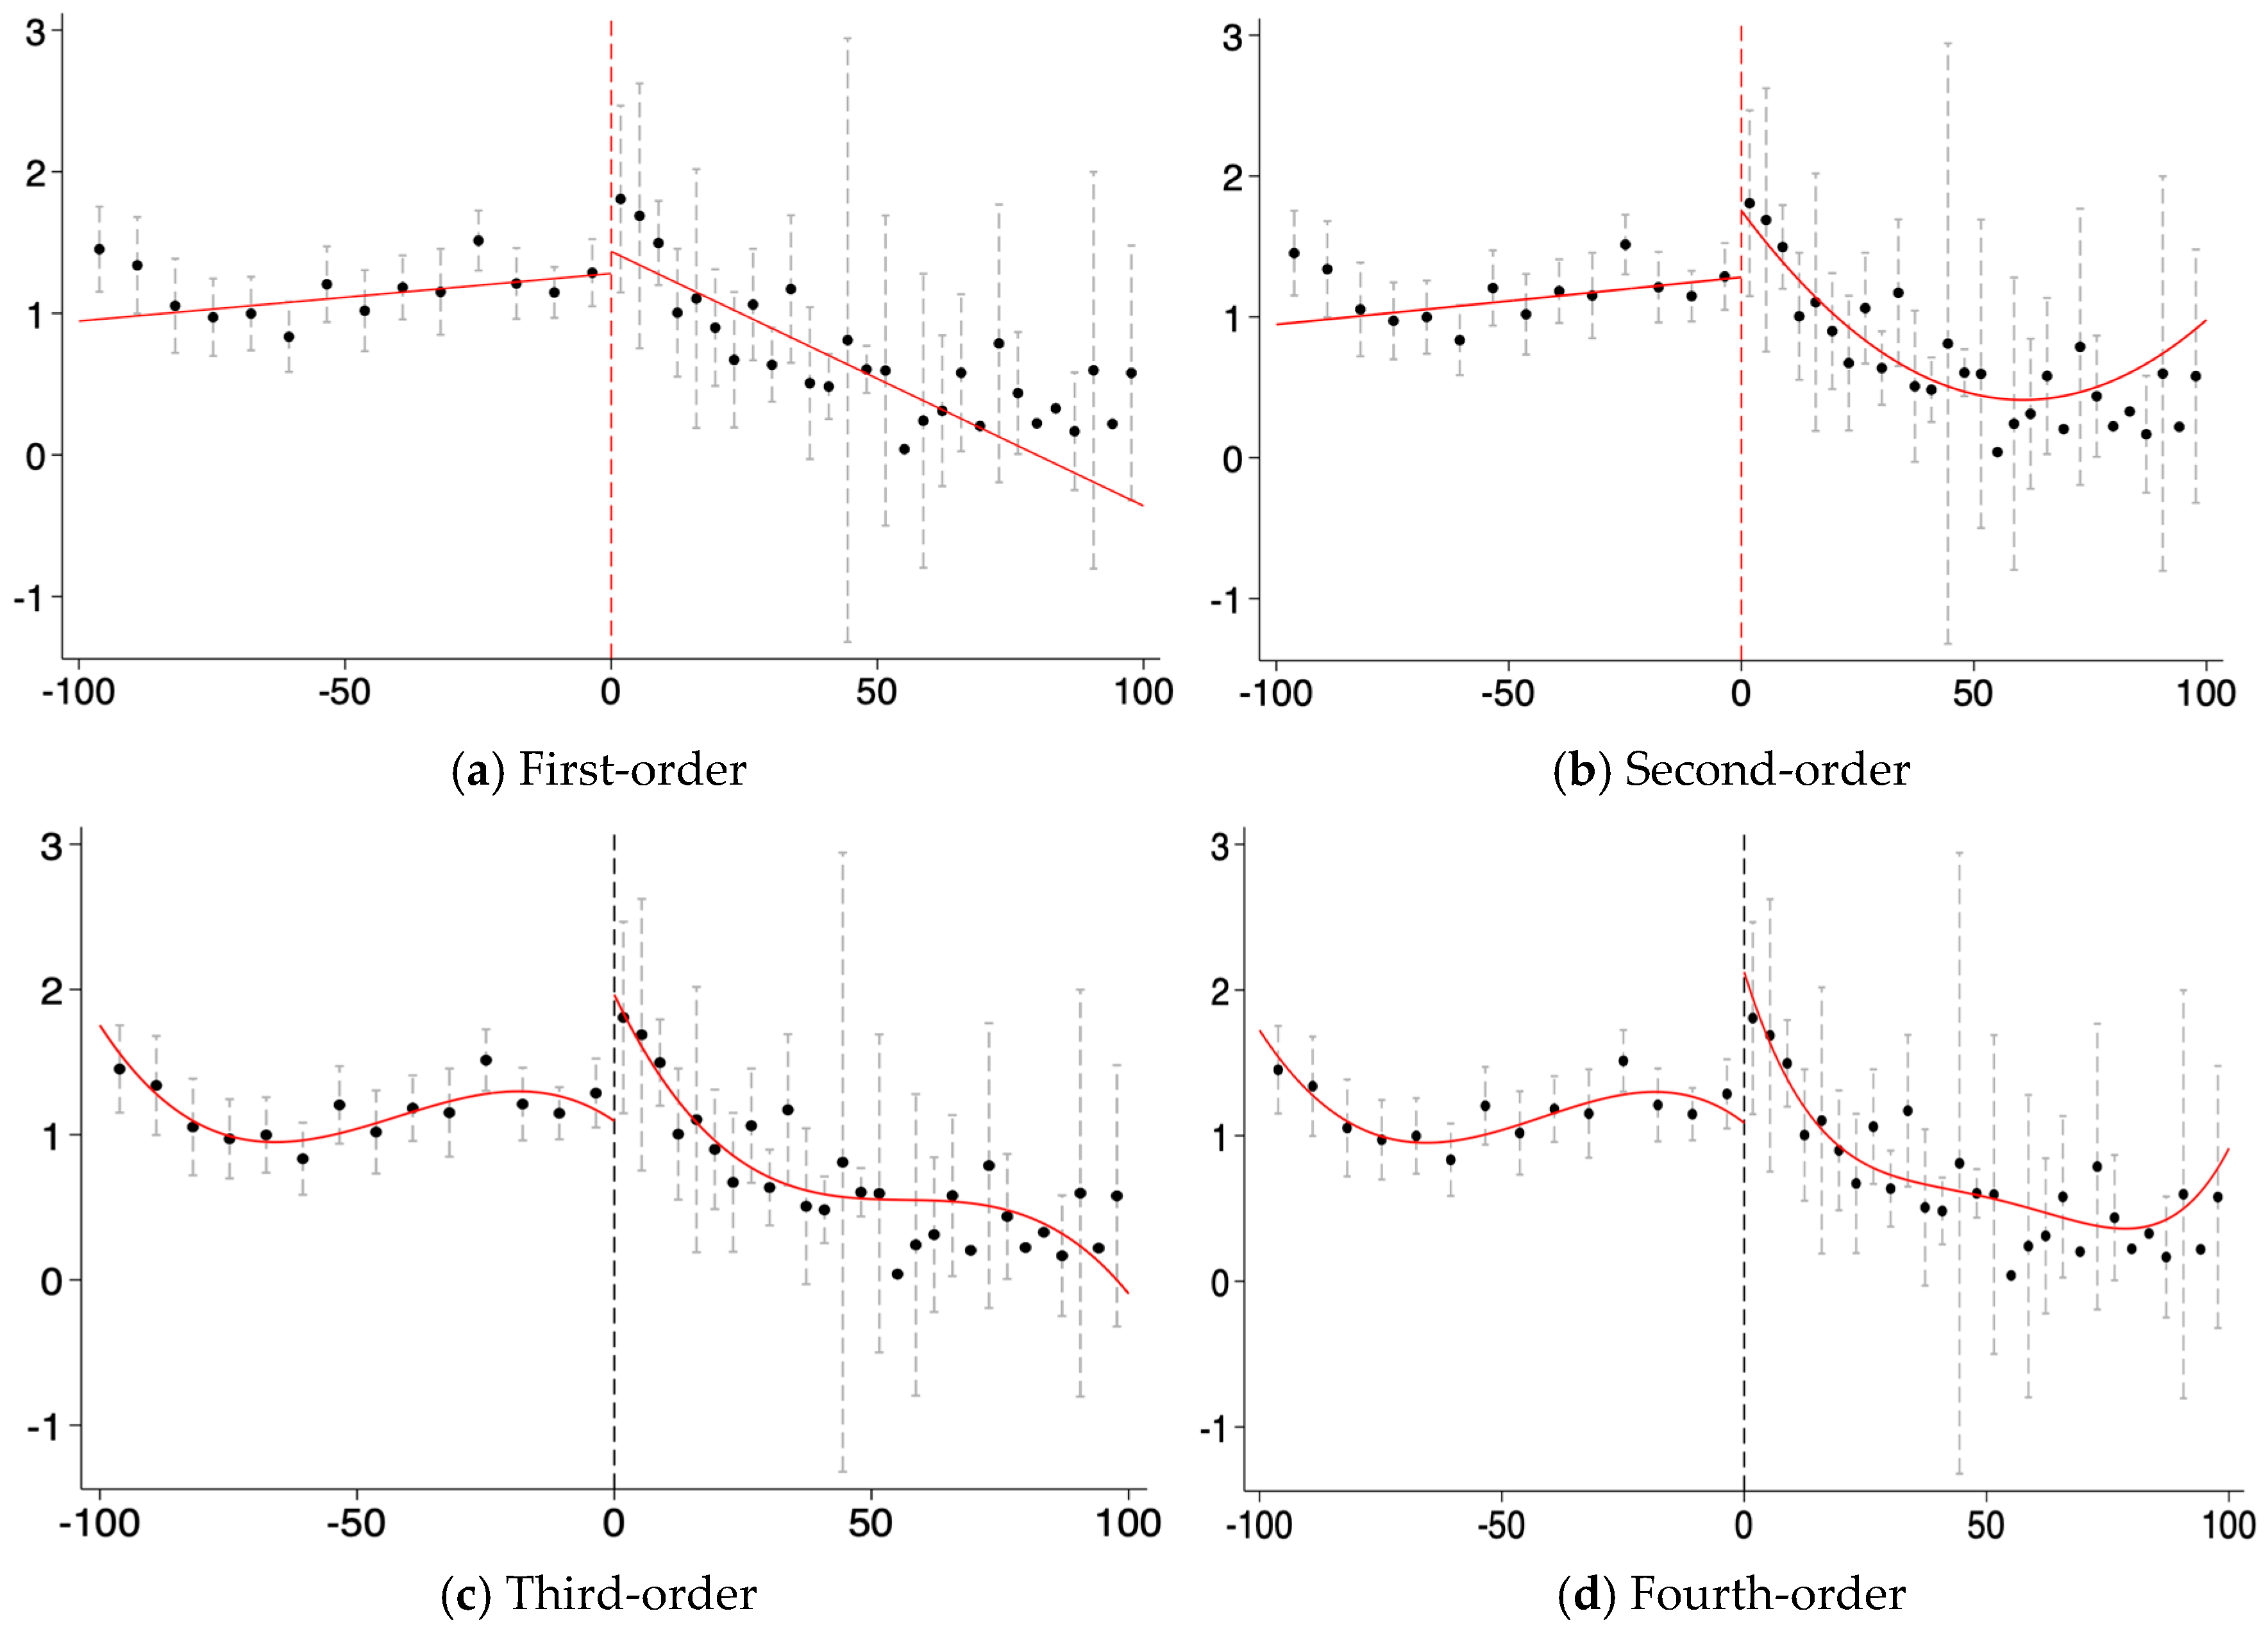
Figure 2 presents the first- to fourth-order nighttime light growth rates, showing a distinct jump at the cutoff. This indicates significant differences in nighttime light intensity between border and non-border regions, thereby satisfying the requirement that the outcome variable exhibits a discontinuity at the threshold.
In
Table 2, elevation, slope, aspect, and population density are regressed as dependent variables. Results reveal no significant discontinuities, suggesting that natural and demographic characteristics remain smooth across the border. These variables are further included in subsequent regressions, and the coefficients remain stable, confirming that geographic and demographic factors are not the main drivers of economic growth in border regions.
4. Main Results
4.1. Baseline Regression
Table 3 reports the regression results for economic growth in the border areas of Inner Mongolia. Column (1) shows that the growth rate of nighttime light intensity in the border areas increased by approximately 76.8%. According to Henderson et al. (2012) [
22], a 1% increase in nighttime light intensity corresponds to roughly a 0.3% increase in GDP. Based on this estimation method, we find that for every 1% increase in the elasticity of nighttime light intensity, the GDP of county-level cities in Inner Mongolia increases by approximately 0.38%, which is slightly higher than the estimate of Henderson et al. (2012) [
22]. Comparatively, the annual GDP growth rate in the border areas rose by 0.84%, indicating a substantial economic growth effect for underdeveloped regions with relatively backward infrastructure and limited factor endowments. Column (2) sets the bandwidth at 50 km, further supporting this conclusion. To address potential endogeneity, Columns (3) and (4) include quadratic polynomials of longitude and latitude. Columns (5) and (6) use first-order polynomials of longitude and latitude, adding population density, elevation, slope, and aspect as control variables. Across all specifications, the regression coefficients are positive and statistically significant at the 1% level, with no substantial changes, indicating that geographic and demographic characteristics are sufficiently smooth at the cutoff and have minimal impact on the results. For additional robustness checks, columns (7) and (8) replace the dependent variable with total nighttime light intensity, and the results remain positive and significant at the 1% level. Overall, these findings consistently demonstrate that the Action for Prosperity and Enrichment along the Border has effectively promoted economic growth in the border areas. The conclusion is consistent with the findings of Zhang et al. (2023) [
51].
4.2. Robustness Checks
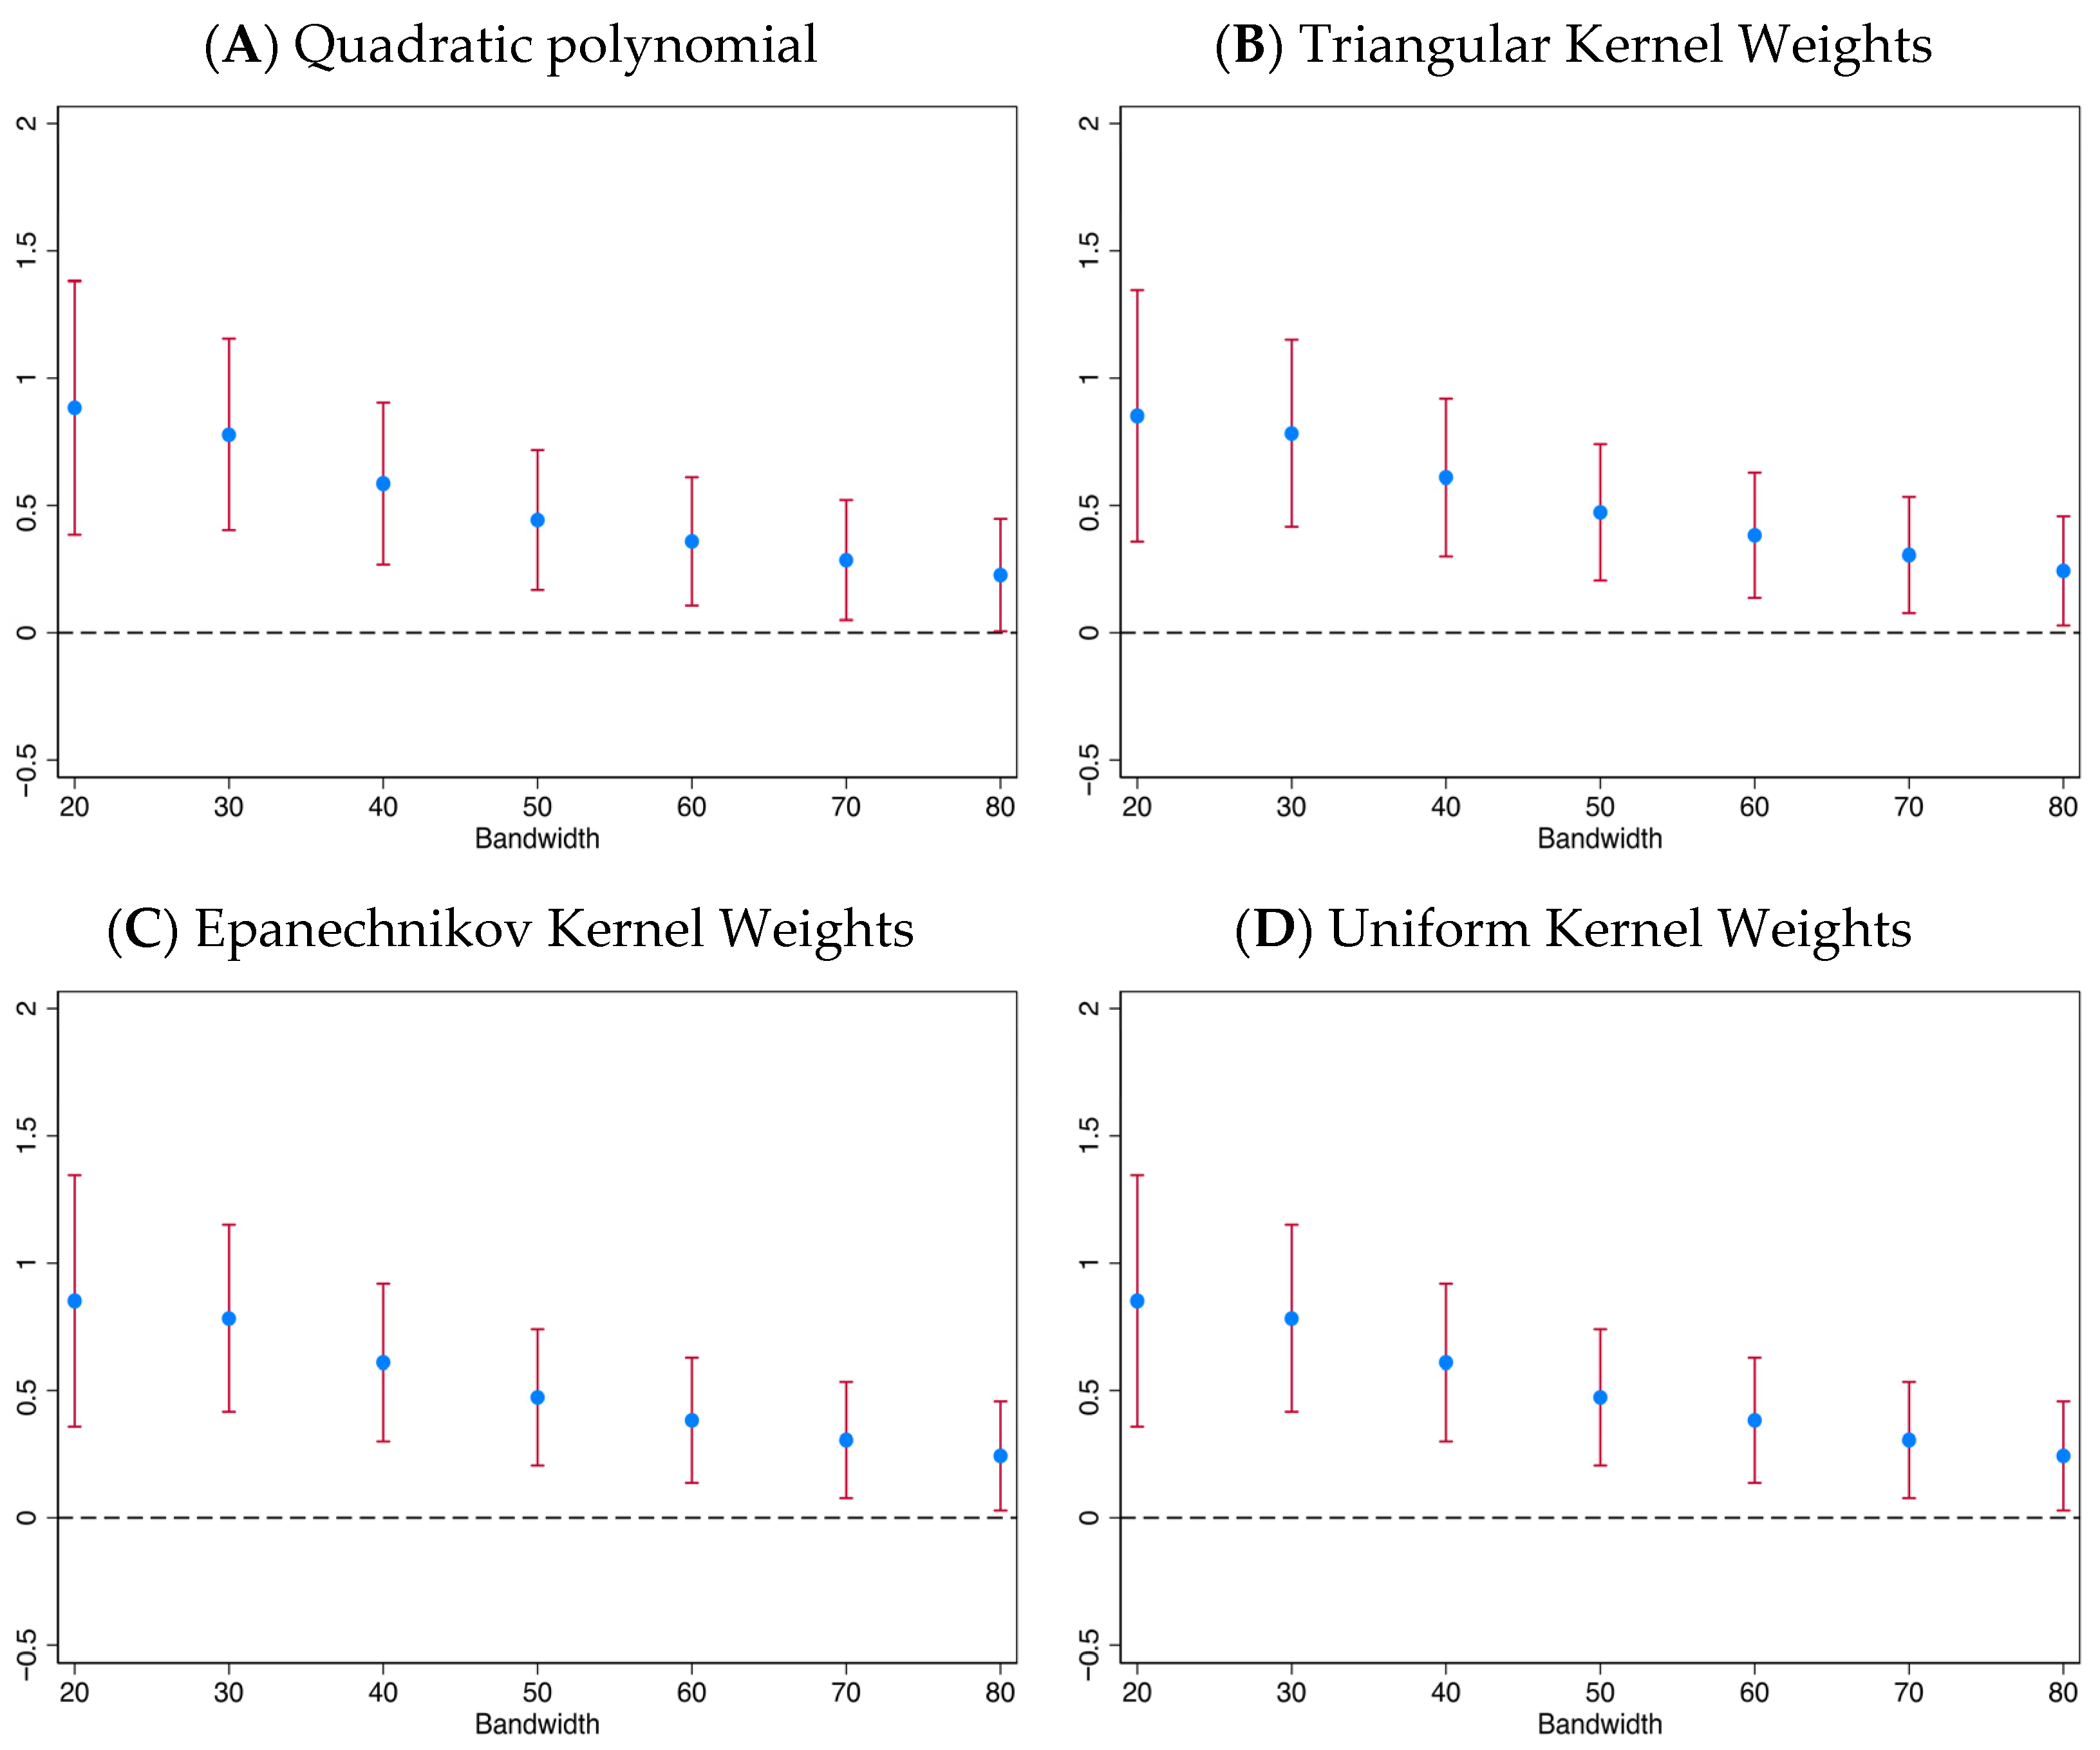
The selection of different bandwidths and estimation methods may affect the estimation results of this study. An overly narrow bandwidth leads to excessively sensitive results, while an overly wide bandwidth dilutes local characteristics. The existing literature generally adopts 30 km and 50 km as standard bandwidths, but such selections are somewhat subjective and non-random, which may compromise the reliability of the conclusions to a certain extent. To address this problem, this paper sets the bandwidth range from 20 km to 80 km in
Figure 3 and constructs a multi-method estimation framework to conduct rigorous sensitivity tests. Specifically, Panel A of
Figure 3 incorporates a second-order polynomial of longitude and latitude into the regression to control for spatial heterogeneity; Panels B to D report the estimation results using three methods, namely the Triangular kernel, Epanechnikov kernel, and Uniform kernel, respectively.
As shown in
Figure 3, across the entire bandwidth range of 20–80 km, regardless of the estimation method adopted, the regression coefficients of the economic effects of the Program of Border Areas Revitalization and Poverty Alleviation remain consistent in sign, significance level, and magnitude, with no obvious fluctuations. This indicates that the significant promoting effect of the Program of Border Areas Revitalization and Poverty Alleviation on the economic growth of border areas does not depend on the selection of a specific bandwidth or estimation strategy. In other words, the policy effect identified in this study is not a spurious result caused by subjective bandwidth selection or methodological bias, but a consistent and reliable causal relationship. Therefore, the analysis in
Figure 3 effectively rules out the interference of bandwidth selection and estimation methods on the research results, further verifying the robustness of the main conclusions.
4.3. Placebo Tests
Although the smoothness of the predetermined variables at the cutoff has been verified above, potential confounding factors may still affect the estimation results. To further examine the robustness of the regression findings, this study artificially shifted the boundary between border and non-border areas. Specifically, the boundary was moved 30 km and 50 km to the south and north, respectively. The regression results in
Table 4 indicate that, regardless of the direction of the boundary shift, the coefficients for the border areas are statistically insignificant. There is no discernible difference in economic growth trends on either side of the artificially set boundaries, suggesting that the economic growth in border areas is not driven by chance. In other words, factors outside the policy are not the primary drivers of economic development in these areas.
4.4. Sample Selection Sensitivity
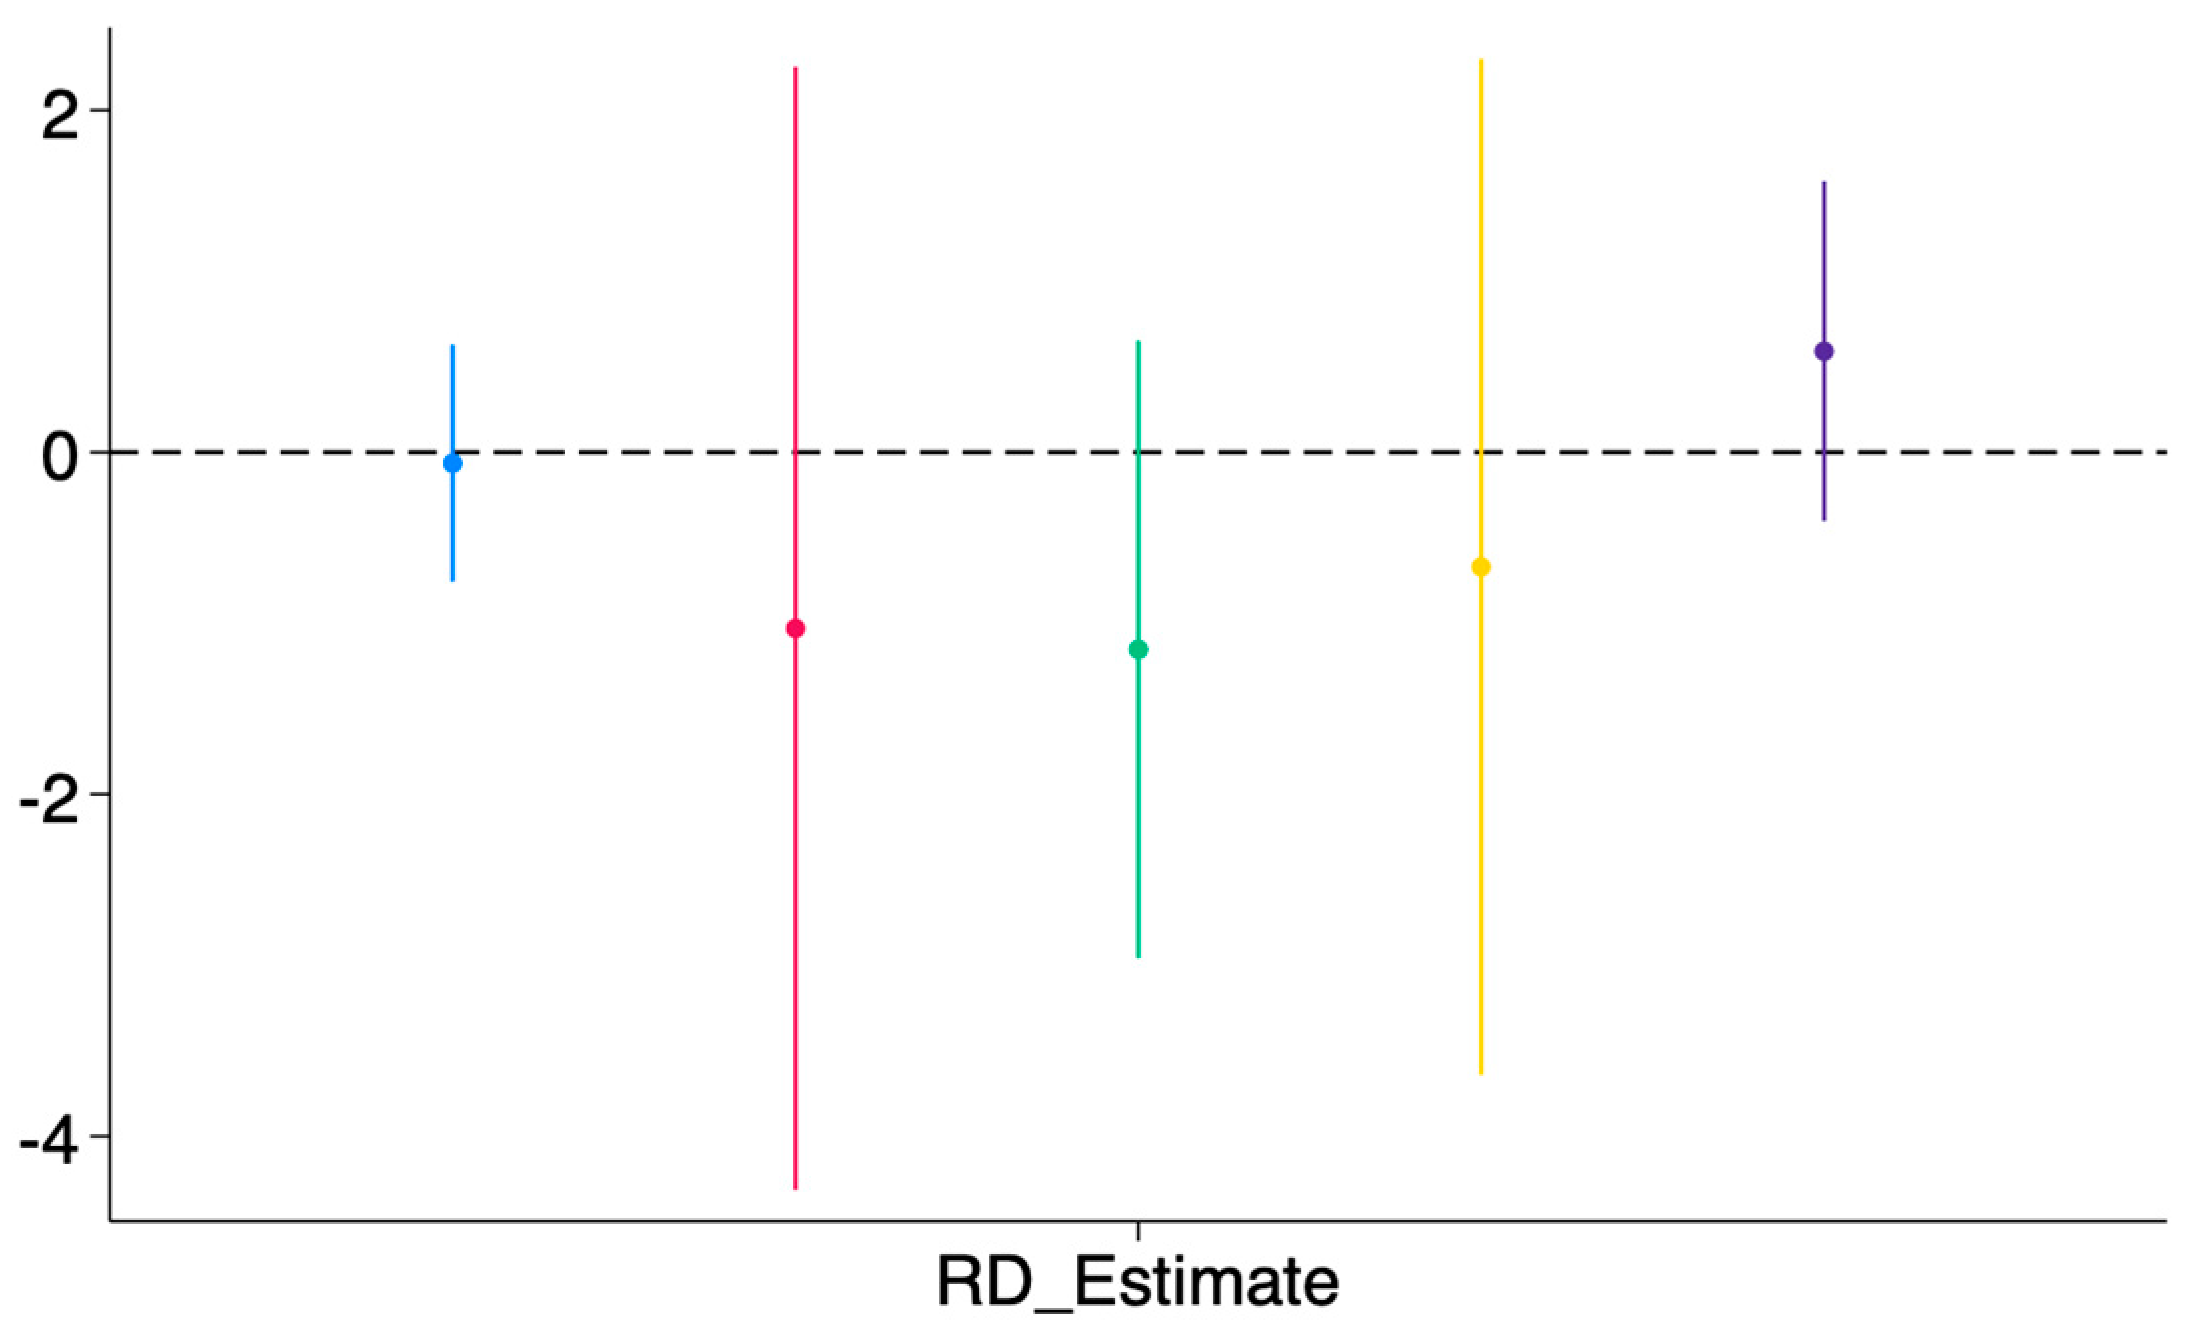
The rationality of sample selection must take into account the impacts of non-random sample missing and administrative division adjustments; otherwise, it will lead to selection bias. On the one hand, data statistics are missing in some regions, which may result in incomplete sample information. On the other hand, some regions underwent administrative division adjustments (such as county mergers and administrative boundary changes) during the research period, leading to inconsistent matching of samples in adjacent areas and thus affecting the accuracy of estimation results. To effectively mitigate the above problems, this paper conducted unified calibration of administrative divisions and excluded regions with frequent administrative division adjustments. In addition, the manipulation of samples near the regression discontinuity is likely to cause selection bias and reduce the reliability of regression results. For this reason, this paper conducted sensitivity tests by gradually excluding samples near the boundary line. Specifically, we sequentially excluded 2%, 4%, 6%, 8%, and 10% of the samples adjacent to the boundary line and visualized the regression coefficients in
Figure 4 to demonstrate the correlation characteristics between the proportion of sample exclusion and estimation results.
As shown in
Figure 4, after excluding the samples with the above proportions, the regression results remained significant at the 5% confidence level, and the coefficient values did not experience drastic fluctuations or abnormal changes. This indicates that there was no manipulation of the samples near the discontinuity, thus ruling out the interference of selection bias on the estimation results. Furthermore, it proves that the promoting effect of the Program of Border Areas Revitalization and Poverty Alleviation on border areas does not depend on changes in sample size, and the policy effect is highly stable. This sensitivity analysis further verifies the reliability of the research conclusions.
4.5. Heterogeneity Analysis
The Program of Border Areas Revitalization and Poverty Alleviation exhibits heterogeneity in its effects across regions, population density, and market vitality. Therefore, this study conducts subgroup regressions for the eastern and western parts. Additionally, to mitigate potential endogeneity issues, we divide population density and market vitality (proxied by the number of newly registered enterprises) into high-value and low-value groups using the median as a cutoff, strictly based on the pre-policy (1999) data of these two indicators, so as to examine the heterogeneity in population mobility and market environment, as reported in
Table 5.
First, the study considers the impact of spatial differences on policy effects. The eastern region of Inner Mongolia has a higher share of the primary and tertiary sectors, with its comparative advantages concentrated in animal husbandry, agricultural processing, and tourism. In contrast, the western region relies on abundant coal and mineral resources, with a higher share of heavy industry. The urban agglomerations centered around Hohhot, Baotou, and Ordos have a significant driving effect on the development of the western region. Columns 1 and 2 show that the regression coefficients are positive and significant in both regions, indicating that the program has a favorable impact. However, a further comparison reveals that the annual growth rate of nighttime lights in the eastern region is approximately 2.56% higher than in the western region. This suggests that the western region, with relatively advanced infrastructure, human capital, and industrial clusters, exhibits diminishing marginal returns to program investment, whereas the eastern region has more “development gaps,” making program inputs more effective in alleviating growth constraints. Furthermore, the eastern region aligns better with the program’s development philosophy of “building ecological civilization and promoting green development,” while the western region, constrained by industrial structure and resource dependence, requires investment in new infrastructure and green industrial transformation. Accordingly, the Program of Border Areas Revitalization and Poverty Alleviation should emphasize place-based approaches: promoting green industrial upgrading in the eastern region and strengthening new infrastructure and industrial optimization in the western region.
Second, the effect of population density on program outcomes is examined. Previous analysis indicated that there is no local discontinuity effect between border and non-border areas, but very low population density can weaken agglomeration of economic activities and firm innovation capacity [
52]. Columns 3 and 4 show that the program is more effective in regions with higher population density. This implies that population size is not only a necessary condition for labor supply but also determines the efficiency of public goods provision and the scale of market demand, amplifying the program’s external effects. In sparsely populated areas, insufficient labor supply hinders the formation of human capital and efficient division of labor, limiting program effectiveness. Therefore, the Program of Border Areas Revitalization and Poverty Alleviation should ensure comprehensive public services and social security in sparsely populated regions to improve the foundational conditions for long-term development.
Finally, the impact of market vitality is assessed. Regions with low market vitality suffer from limited factor mobility and an unfavorable business environment, making industrial upgrading more dependent on program support. Using the number of newly registered enterprises at the county level as a proxy for market vitality, Columns 5 and 6 show that the program promotes economic growth in both low- and high-market-vitality areas, but its effect is stronger in regions with lower market vitality. By improving the business environment and reducing institutional transaction costs, the Program of Border Areas Revitalization and Poverty Alleviation enhances the endogenous momentum of economic development. The program not only fosters overall growth but also emphasizes support for disadvantaged areas, reflecting the inclusive nature of regional coordinated development.
4.6. Controlling for Confounding Policies
Although the series of robustness checks presented above demonstrate the effectiveness of the Program of Border Areas Revitalization and Poverty Alleviation, other regional policies may potentially confound the regression results. To address this, the study examines major policies related to the program, removes the relevant samples, and re-estimates the regressions. The empirical results reported in
Table 6 show that, after excluding the influence of these policy shocks, the regression coefficients remain positive and statistically significant at the 1% level, confirming the robustness of the results.
Impact of the Belt and Road Initiative (BRI): Inner Mongolia’s border regions are adjacent to Russia and Mongolia. The BRI may affect economic outcomes through cross-border trade, tourism, and economic cooperation zones, potentially confounding the effects of the Program of Border Areas Revitalization and Poverty Alleviation. To address this, the study excludes samples from border port cities and re-estimates the regression. Column (1) shows that the regression coefficient remains positive and significant at the 1% level, indicating a clear policy effect of the Program of Border Areas Revitalization and Poverty Alleviation.
Impact of the Rural Revitalization Strategy: The Rural Revitalization Strategy aims to promote agricultural and rural modernization, which partially overlaps with the strategic objectives of the Program of Border Areas Revitalization and Poverty Alleviation. After excluding the key implementation areas of the Rural Revitalization Strategy, Column (2) shows that the regression coefficient remains positive and significant at the 1% level, indicating that the strategy does not confound the estimated effects.
Impact of the Poverty Alleviation Strategy: The Poverty Alleviation Strategy targets the production and living difficulties in impoverished areas, playing a critical role in promoting economic development. To prevent exogenous shocks from this strategy, the study excludes key poverty alleviation areas. Column (3) indicates that the regression coefficient for border regions remains positive and significant at the 1% level, confirming that the strategy does not bias the estimation results.
Impact of Ecological Civilization Demonstration Zones: These zones are subject to environmental regulations on energy conservation and emissions reduction, which may limit resource-based and heavy industries. At the same time, these zones benefit from ecological compensation and fiscal transfers, promoting green and low-carbon industries. After removing samples from these zones, Column (4) shows that the regression coefficient remains positive and significant at the 1% level, suggesting that the policy effect of the Program of Border Areas Revitalization and Poverty Alleviation remains robust.
Impact of National Urban Agglomerations: Urban agglomerations centered around Hohhot, Baotou, and Ordos benefit from national-level strategic support, and the resulting polarization effect can reshape spatial development patterns. To account for this, the study excludes samples from national urban agglomerations. Column (5) indicates that the program’s policy effect is unaffected.
Impact of Coal-Dominated Regions: The industrial structure in coal-dominated areas primarily relies on traditional industries such as coal chemical and power sectors, and economic growth is more resource-driven than policy-driven. After excluding coal-dominated regions, Column (6) shows that the regression coefficient remains positive and significant at the 1% level, indicating that the policy effect of the Program of Border Areas Revitalization and Poverty Alleviation is not influenced by economic activities in coal-producing areas.
7. Conclusions
How underdeveloped regions can overcome initial disadvantages and achieve economic take-off has long been a central issue in development economics and regional policy research. This paper takes the border areas of Inner Mongolia as a case study to examine how the Program of Border Areas Revitalization and Poverty Alleviation promotes economic growth and fosters regional coordinated development through the provision of public goods and the development of specialty industries. The results show that fiscal expenditure alleviates funding constraints in border areas, transportation infrastructure improves locational conditions, and specialty industries make effective use of resource endowments while driving industrial upgrading, thereby mitigating initial disadvantages in economic development. At the same time, the Program of Border Areas Revitalization and Poverty Alleviation narrows internal regional development gaps and improves the ecological environment, achieving a certain degree of balance between equitable development and green development.
The experience of this study indicates that effective regional policies can help underdeveloped areas overcome development bottlenecks and achieve economic takeoff. The policy implications are as follows: First, infrastructure construction should shift from a “scale-oriented” to an “efficiency-oriented” approach, emphasizing inter-county transportation and port connectivity. Second, industrial layout should follow regional comparative advantages, promoting green and ecological industries, advancing low-carbon transformation of resource-based industries in the western regions, and cultivating emerging industries. Third, equalization of public services is crucial for low population-density areas, requiring institutional innovations to improve access to education and healthcare. Fourth, expanding tax incentives and innovation subsidies for small and medium-sized enterprises and reducing entry barriers and transaction costs through institutional innovation can attract more market participants, foster healthy competition and industrial vitality, and stimulate endogenous economic growth. These recommendations are not only supported by empirical findings but also align with China’s strategic goals of high-quality economic development and ecological civilization construction.
This study has several limitations. First, it focuses exclusively on the Inner Mongolia Autonomous Region, and the generalizability of the findings requires validation in other countries and regions. While China’s regional development policies demonstrate high implementation capacity and continuity, Latin American countries such as Brazil face political instability and fiscal constraints, resulting in limited policy effectiveness [
58]. Similarly, Indonesia is constrained by governance challenges, including political institutions [
59] and official corruption [
60,
61]. Differences in local administrative capacity and management, insufficient long-term planning, and the absence of clear evaluation standards further complicate policy outcomes. Second, the Program of Border Areas Revitalization and Poverty Alleviation relies heavily on large-scale fiscal investment, raising concerns about the sustainability of long-term fiscal inputs, especially amid rising local government debt risks [
62]. Finally, this study primarily focuses on the causal identification of policy effects, with less attention given to the role of market mechanisms in resource allocation. Regional development policies face the dual challenge of fiscal sustainability and institutional efficiency. Indeed, sustained economic growth depends on a balanced interaction between the “visible hand” of government and the “invisible hand” of the market, a balance that remains an important area for future research.