Abstract
Cultural ecosystem services (CESs) represent a critical link between ecosystems and human well-being and constitute a core foundation for regional sustainable development. The balance between CES supply and demand directly affects the coordination efficiency between ecological conservation and socio-economic development, making it a key prerequisite for ecosystem management, conservation planning, and policy formulation. This study focuses on the circum-Taihu region and integrates multi-source data to assess public perceived demand and spatial supply capacity of CESs. Supply–demand matching relationships are examined across three dimensions, namely, scenic beauty, cultural heritage, and recreation, through the construction of a region-specific CES quantitative indicator system. The impacts of multiple environmental factors on CES supply–demand dynamics are further explored to provide scientific support for coordinated ecological, cultural, and economic sustainability at the regional scale. The findings demonstrate the following: (1) the proposed methodology effectively quantifies CES perception and supply capacity in the circum-Taihu region. Scenic beauty exhibits the highest perception levels, whereas cultural heritage and recreation show lower perception. Cultural heritage displays the strongest supply capacity, whereas scenic beauty and recreation exhibit weaker supply. (2) Significant spatial imbalances exist between CES perception levels and supply capacity across the circum-Taihu region. Areas exhibiting mismatches constitute the largest proportion for cultural heritage CESs, followed by scenic beauty, with recreation displaying the smallest amounts of imbalance. (3) Environmental drivers exert differentiated effects on CES supply–demand relationships. Slope, road network density, and elevation have significant positive effects, whereas the normalized difference vegetation index (NDVI), distance to water bodies, and distance to roads exhibit significant negative effects. Distance to roads imposes the strongest inhibitory influence on CES perception, whereas elevation emerges as the most influential driver of public perceived CES levels.
1. Introduction
Ecosystem services (ESs) encompass all environmental conditions and benefits that ecosystems provide to sustain human survival and development [1,2]. They are formally classified into four categories: provisioning, regulating, supporting, and cultural services [3]. Within this framework, cultural ecosystem services (CESs) specifically denote the non-material benefits obtained by humans through spiritual fulfillment, cognitive enhancement, recreational engagement, and aesthetic experiences derived from ecosystems [4]. Distinctively, CESs exhibit higher perceptibility than other ES categories, enabling direct public interaction. Their indispensable role manifests in recreation service delivery and cultural diversity conservation [5], functioning as a critical socio-ecological interface. Consequently, CES research provides essential insights into the ecosystem–human well-being nexus [6].
Despite their importance, the quantitative assessment of CES supply and demand remains at an exploratory stage [7,8]. The inherently subjective and intangible nature of CESs poses substantial challenges for both methodological design and data acquisition [9,10]. Traditional approaches, such as questionnaire surveys and structured interviews, can capture individual preferences but are often constrained by subjectivity, limited sample sizes, and spatial bias, making cross-scale comparison difficult [11]. Subsequently, land use-based matrix scoring methods provided a foundational framework for regional-scale CES assessment; however, they remain heavily dependent on expert judgment and are typically limited to a single spatial scale [12]. Building on these methods, indicators such as supply–demand ratios, matching degrees, and coordination indices have been introduced to characterize spatial disparities and alignment in CES provision and perception [13,14,15]. Nevertheless, limitations persist with respect to service type coverage and the precision of demand representation [16].
With the rapid development of GIS, remote sensing, spatial modeling, and social media data, CES research has increasingly shifted toward spatially explicit and fine-grained analyses [17,18,19]. By integrating multi-source datasets, recent studies have partially overcome the temporal and spatial constraints of conventional approaches [8]. For example, some studies have evaluated CES supply–demand relationships in agricultural landscapes [20], whereas others have constructed multi-dimensional indicator systems using geospatial data and POI information to explore CES types and coordination patterns in urban parks [21]. Although these studies have improved the empirical characterization of CESs, most focus on isolated sites or individual service levels, and few systematically examine the drivers and formation mechanisms of CES supply–demand patterns at a regional scale [22]. In addition, studies relying primarily on geotagged social text data often suffer from limited locational accuracy [23], which constrains their applicability for spatial planning and policy implementation [24].
Taihu Lake is one of China’s most important freshwater lakes. The surrounding landscape—characterized by a mosaic of hills, plains, and dense water networks—forms a distinctive cultural landscape with a strong ecological and cultural service foundation. Located in the core area of the Yangtze River Delta, one of China’s most economically developed and densely populated regions, the Taihu Lake Basin is also the cradle of Jiangnan culture. Intense human activities and complex land-use patterns result in highly heterogeneous and tightly coupled relationships between CES supply and public perception across space. Against this background, the Taihu Lake Basin provides an ideal case for examining CES supply–demand dynamics at a regional scale.
Accordingly, this study focuses on the Taihu Lake Basin and addresses the following research questions:
- (1)
- What are the spatial distribution characteristics of CES supply and public perception across different service types?
- (2)
- Where do mismatches between CES supply and perception occur, and how do these patterns vary among service categories?
- (3)
- How do environmental factors and landscape heterogeneity influence CES supply–demand relationships?
By addressing these questions, this study aims to provide a robust empirical basis for the optimization of CES allocation and for evidence-based spatial planning and sustainable regional development.
2. Materials and Methods
2.1. Study Area
Taihu Lake is situated in the core area of the Yangtze River Delta, spanning Jiangsu and Zhejiang provinces with a water surface area of 2338 km2 [25]. Its unique topography, which is characterized by hilly terrain in the western/southwestern sectors and alluvial plains with interconnected waterways in the east, provides a foundational ecosystem service base dominated by cultural ecosystem services (CESs). The natural landscapes and cultural heritage activities along its shoreline collectively form a multifunctional CES matrix integrating recreational opportunities and cultural transmission. Through CES manifestations such as ecotourism, historical site conservation, and traditional practices (e.g., marathon events, spiritual retreats), Taihu Lake underpins the spiritual needs of urban residents and regional cultural sustainability [26].
To examine the influence of buffer distance selection on the robustness of the results, a multi-distance sensitivity analysis was conducted using alternative buffer distances ranging from 3 to 7 km [27]. The analysis evaluated the stability of CES supply–demand spatial patterns under different buffer settings. Results indicate that both the spatial distribution characteristics of CES supply–demand relationships and the overall model performance remain largely consistent across buffer distances, with no substantial changes observed in key spatial patterns. This finding suggests that the selected 5 km buffer does not introduce significant bias into the results and that the conclusions of this study are robust with respect to buffer scale selection (Table 1). Accordingly, the area within 5 km of the Taihu Lake shoreline was defined as the study area (Figure 1).

Table 1.
Sensitivity analysis of CES supply–demand patterns across buffer distances.
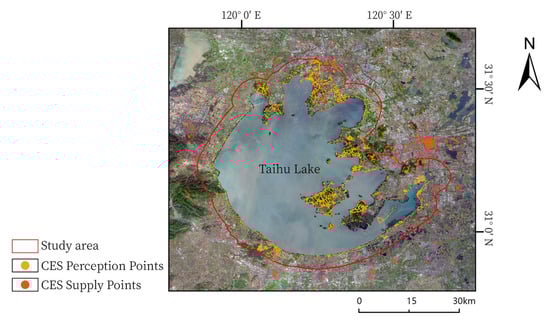
Figure 1.
Study area.
2.2. Research Framework
Guided by the core analytical logic of “quantification–matching–driving mechanisms”, this study develops a multi-source data-integrated framework to examine CES supply–demand relationships in the circum-Taihu region. The framework systematically identifies spatial differentiation patterns and elucidates the underlying driving mechanisms through the following technical steps.
First, a CES supply–demand quantification system and spatial characterization were established. Based on bibliometric analysis and the characteristics of the study area, a CES classification and indicator system was constructed. Kernel density analysis and other spatial techniques were applied in combination with Gaode Map POI data to quantify the objective supply levels of different CES types and to examine their spatial clustering patterns. In parallel, geotagged photo data were mined to quantify public perception-based demand for different CES types, revealing the spatial differentiation of perceived CES levels.
Second, supply–demand matching types were identified and spatially delineated. CES supply density maps and perception density maps were integrated using spatial overlay analysis, and spatial association models were employed to quantify the degree of supply–demand matching and mismatch intensity at the regional scale. Four typical matching types were subsequently classified, enabling the precise identification of spatially imbalanced areas.
Finally, the spatially heterogeneous driving mechanisms of CES supply–demand matching were explored. Focusing on the core characteristics of different matching types, a geographically weighted regression (GWR) model was constructed incorporating relevant environmental and socio-economic factors. Using model diagnostics and analysis of the spatial distribution of local coefficients, the heterogeneous effects of driving factors on CES supply–demand relationships were examined, clarifying the mechanisms and inhibitory pathways underlying CES coupling and coordination. These results provide a scientific basis for the formulation of targeted optimization and planning strategies.
2.3. Data Collection and Processing
The data types used in this study are categorized into three main types: Taihu peripheral ecosystem cultural service supply data, perception data, and environmental impact variables. In classifying the cultural services of the Taihu ecosystem, reference is made to the classification standards of CESs from the Millennium Ecosystem Assessment (2005) and previous studies on value systems [28], while also considering the threefold attributes of Taihu as an “ecological green heart,” “cultural core,” and “leisure center” [29]. Accordingly, CESs are divided into three service types: scenic beauty, recreation, cultural heritage.
2.3.1. Ecosystem Cultural Service Supply Data
The supply of CESs depends on entities with clear geographical coordinates, such as parks, museums, and historical sites. POI (point of interest) data, by marking the locations of cultural facilities, natural landscapes, and heritage sites, directly maps the distribution and density of service resources, providing a high-precision data foundation for quantifying regional CES supply levels [30].
In this study, drawing on the characteristics of three CES types and related industries in the Taihu region [20], as well as previous studies, a total of 7120 POIs around Lake Taihu were obtained using the Amap (Gaode) application programming interface (API) and subsequently cleaned, classified, and screened. The screening procedure combined tag-based and keyword-based filtering, with CES value types determined according to POI tags (Table 2). For POIs with ambiguous tags or names, manual verification of their actual functional attributes was conducted to confirm classification. Duplicate records were removed, and POIs outside the study area were excluded, resulting in three finalized POI datasets corresponding to the different CES types.
Table 2.
Classification criteria for cultural ecosystem service (CES) supply types.
2.3.2. Ecosystem Cultural Service Perception Data
CES perception data refer to datasets formed by quantifying people’s subjective feelings, evaluations, and behavioral feedback on the non-material benefits provided by ecosystems. In this study, perception demand data are primarily derived from geotagged photos. These photos, taken by tourists and residents, capture scenic beauty, cultural heritage, and recreation, reflecting public preferences and value recognition of CESs [31]. Compared to traditional questionnaires or interviews, this method has the advantages of being non-intrusive, spatially explicit, and behaviorally authentic. The CES perception data in this study are derived from photos posted by users on the Two-Step Outdoor website (www.2bulu.com) [32]. Compared with general purpose social media platforms, 2bulu mainly serves outdoor activity participants, and its user-generated content is highly concentrated on natural landscapes and recreational activities. This platform characteristic effectively reduces noise unrelated to CESs and enhances the thematic relevance between the perception data and research objectives.
Data acquisition followed a structured workflow. Using “Taihu Lake” as the keyword and selecting an upload period from December 2023 to December 2024, a total of 55,219 geotagged photographs were collected using Python (version 3.10)-based web scraping. To ensure data validity, photographs unrelated to CES perception, such as selfies, road signs, or infrastructure inspection images (e.g., manhole covers), were manually removed [33]. The filtered images were then classified using EasyDL, a deep learning platform developed by Baidu AI Cloud (Table 3). EasyDL is based on convolutional neural networks and supports automated recognition and classification of large-scale image datasets. This study developed image classification models corresponding to three categories of CESs. During the model training stage, approximately 5000 images were randomly selected from the preprocessed dataset as training samples, with a relatively balanced representation across the different CES categories. The model was trained through three iterative rounds to progressively improve classification performance. After the final training iteration, the trained model was applied to all preprocessed photographs for batch classification. Subsequently, 300 images were randomly sampled from the model’s classification outputs for manual verification to assess the reliability of the classification results. The results showed that an overall classification accuracy of 95.3%, demonstrating that the model can effectively identify different types of CES perceptions and is adequate for subsequent spatial analysis and modeling.
Table 3.
How to select and filter the types of Taihu CESs.
2.3.3. Factors Influencing Ecosystem Cultural Services
Existing research has shown that ecosystem cultural services are influenced by a variety of social, natural, and human activity factors [34]. Based on current literature and expert opinions, this study comprehensively considers elements from nature, society, and human activities to identify the key factors influencing CESs. These factors include the following: (1) normalized difference vegetation index (NDVI), (2) slope (SLOPE), (3) distance to water bodies (DTW), (4) elevation (ELEV), (5) distance to roads (DTR), (6) road network density (RND), and (7) population density (PD) (Table 4). All datasets were obtained from open-access databases (Table 4), and all variables are continuous. Given the substantial differences in units and value ranges among the selected variables, directly incorporating them into the regression model could lead to biased coefficient estimation. Therefore, all continuous variables were standardized using Z-score normalization to eliminate scale effects and enhance comparability among variables, providing a consistent basis for the subsequent geographically weighted regression (GWR) analysis.
Table 4.
Influencing variable metrics and data processing.
Prior to model construction, multicollinearity among the explanatory variables was examined using a global ordinary least squares (OLS) model, with variance inflation factors (VIFs) adopted as the diagnostic criterion. The results indicate that all variables exhibit VIF values below commonly accepted thresholds, suggesting the absence of severe multicollinearity and supporting their simultaneous inclusion in the regression analysis. During GWR model fitting, model performance was evaluated using the coefficient of determination (R2) and the adjusted R2, with values of 0.42 and 0.35, respectively. In addition, Moran’s I was applied to assess spatial autocorrelation in the model residuals. The results show no significant spatial dependence in the residuals (Moran’s I = 0.02, p > 0.05), indicating that the GWR model effectively captures the spatial heterogeneity of CES supply–demand relationships without leaving systematic spatial structure unexplained. Finally, a unified coordinate system and raster resolution were applied in ArcGIS (version 10.8.1) to ensure spatial consistency and comparability across all datasets in the subsequent analyses.
2.4. Research Methods
Kernel density analysis transforms discrete spatial points into continuous raster-based density surfaces and has been widely applied to hotspot detection and spatial clustering analysis. In this study, kernel density estimation is used to characterize both the objective supply and the perceived demand of CESs, enabling a unified spatial representation that intuitively reveals their aggregation patterns and spatial disparities. This approach provides a consistent analytical basis for subsequent supply–demand matching analysis and the identification of hotspot areas.
Geographically weighted regression (GWR) enables local parameter estimation and is particularly effective in capturing the spatial non-stationarity of relationships among variables. Compared with traditional global regression models, GWR can explicitly reveal how the effects of the same driving factors vary across spatial units, which closely aligns with the core objective of this study [35]. Moreover, its strong interpretability allows for a clearer identification of the differentiated effects of environmental and socio-spatial factors on CESs, a key requirement for planning-oriented CES analyses.
Considering the spatial extent of the study area and the required analytical resolution, the study area was divided into 1 km × 1 km grid cells using ArcGIS, resulting in a total of 1090 grid units. These grid cells were adopted as the basic analytical units for calculating CES supply and demand indicators. Spatial linkage between explanatory and dependent variables was achieved using the “Extract Multi Values to Points” and spatial join tools [36], allowing the relationships between variables to vary with geographic location and thereby effectively capturing spatial heterogeneity in the underlying associations [37].
3. Results
3.1. Distribution Characteristics of CES Supply and Perception Levels for Different Types
Using kernel density analysis in ArcGIS, the distribution of CES perception levels and supply capacity can be clearly observed (Figure 2). From the overall CES supply levels around Taihu, high-value areas are concentrated in the northern and eastern regions of the lake. Among them, the high-value areas for scenic beauty supply show a clustered distribution centered around the Binhu District of Wuxi (Figure 2a). Low-value areas are mainly distributed in the western and southern parts of the main urban area, accounting for a relatively large proportion. High-value areas for cultural heritage supply are clustered in the Binhu District of Wuxi, Wu Zhong District of Suzhou, and Huqiu District (Figure 2b), whereas low-value areas are scattered in the southwest. The distribution pattern of recreation is similar to that of cultural heritage; however, the overall supply of recreation is lower (Figure 2c).
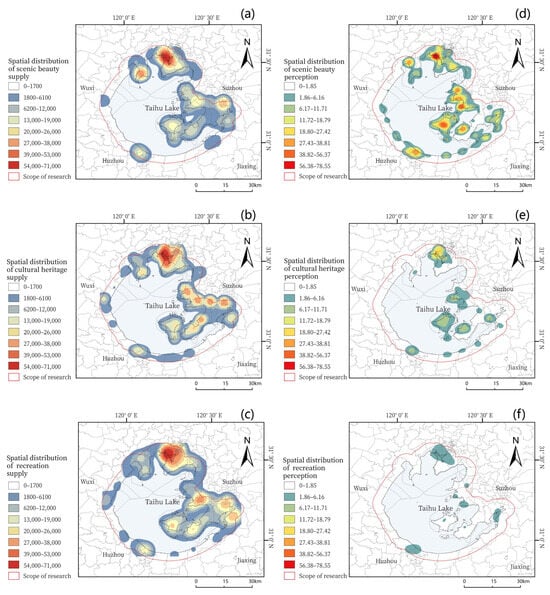
Figure 2.
Spatial distribution of different types of CESs. (a) Scenic beauty supply; (b) Cultural heritage supply; (c) Recreation supply; (d) Perceived scenic beauty; (e) Perceived cultural heritage; (f) Perceived recreation.
In terms of perception level distribution, the differences among the three types of CESs are quite evident. The comprehensive perception level for scenic beauty is the highest (Figure 2d), followed by cultural heritage (Figure 2e), with recreation showing the lowest perception level (Figure 2f). The perception of scenic beauty is characterized by a multi-point aggregation along Taihu Lake. The perception levels of cultural heritage and recreation are higher in the northern part of Taihu, gradually decreasing outward, with low-value areas being more dispersed (Table 5).
Table 5.
Perception level and supply capacity distribution of different types of CESs.
3.2. Matching Relationship Between CES Supply and Perception Levels Across Different Types
This study systematically analyzes the significant spatial heterogeneity between the actual supply of CESs around Taihu and public perception, focusing on the differentiated matching patterns for three types of services: scenic beauty, cultural heritage, and recreation. Based on the distribution characteristics of supply and perception levels, the study area is divided into four types (Figure 3).
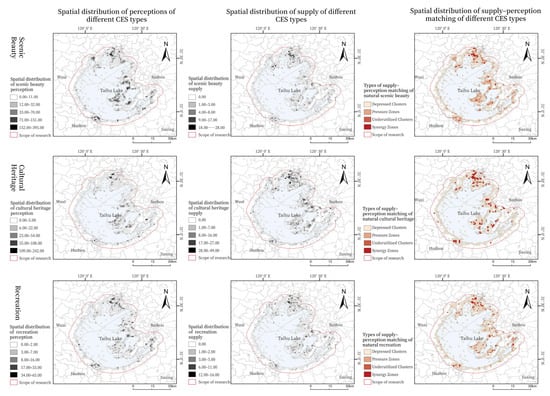
Figure 3.
Matching relationships between different CES perception and supply.
Overall, most areas around Taihu show a balance between CES supply and demand; however, there are still regions where supply exceeds demand or vice versa. The most notable imbalance occurs in the supply of historical and cultural services, while there is a clear shortage of supply in aesthetic and leisure entertainment services. For scenic beauty services, the results reveal a distinct gradient mismatch between supply capacity and perceived demand. The central lake area, as the core zone of natural landscape resources, exhibits the highest perception intensity among the three CES types; however, its actual supply level fails to correspond to this demand. Consequently, the region is characterized by an overall undersupply pattern, with evident east–west spatial gradients. Specifically, Xishan Island and its southwestern surroundings display substantially higher perception intensity than the western and southern shores of Lake Taihu, while supply levels have not increased accordingly, forming typical high-perception–low-supply areas. In contrast, parts of the Huzhou shoreline exhibit low levels of both supply and perception.
For cultural heritage services, the supply level around Lake Taihu is the highest among the three CES categories; however, public perception remains comparatively low, resulting in a pronounced “high supply–low perception” mismatch. This pattern indicates that investments in heritage protection and resource integration have not yet been effectively translated into public cultural experiences, particularly along the western shore of Lake Taihu, where heritage supply displays strong spatial polarization.
Recreational services demonstrate a relatively high degree of supply–demand matching across the circum-Taihu region, suggesting that the current spatial configuration of recreational facilities largely aligns with public activity needs. High-supply–high-perception areas are mainly concentrated in the core zones of the Lake Taihu National Scenic Area and along the Wuxi shoreline. In contrast, mismatched areas are more evenly distributed around the lake, without forming distinct spatial clusters.
3.3. Impact of Different Influencing Factors on CES Supply and Perception Matching
This study employed a geographically weighted regression (GWR) model to examine the spatially heterogeneous effects of multiple driving factors on the supply–demand matching of CESs in the circum-Taihu region. The results indicate that both the magnitude and direction of the effects vary markedly across space, revealing pronounced spatial non-stationarity (Table 6 and Figure 4). Overall, slope (SLOPE), road network density (RND), and elevation (ELEV) exert predominantly positive influences on CES matching, whereas the normalized difference vegetation index (NDVI), distance to water bodies (DTW), and distance to roads (DTR) mainly show negative effects. The influence of population density (PD) is more balanced, exhibiting both positive and negative relationships.
Table 6.
Geographically weighted regression analysis.
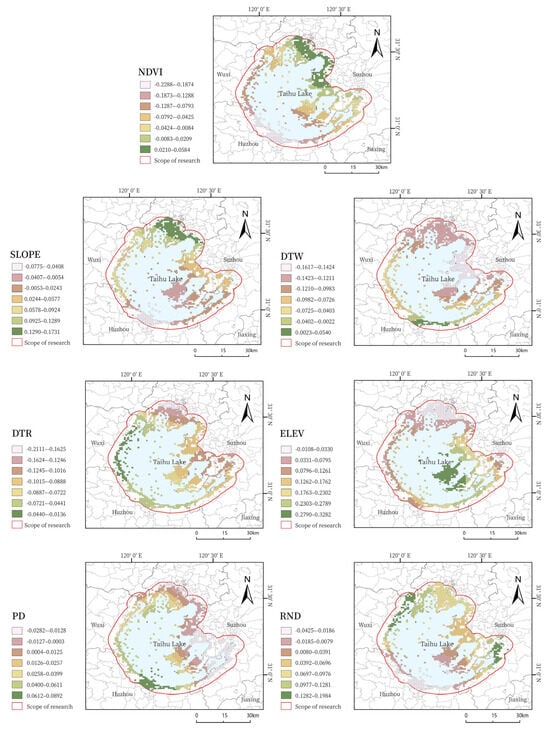
Figure 4.
Spatial distribution characteristics of the geographically weighted regression (GWR) analysis.
Specifically, NDVI displays negative coefficients in 63.94% of the study area, with positive effects occurring only in the northern and eastern lakeshore zones of Lake Taihu. SLOPE generally has a positive influence, particularly in gently sloping lakeside areas, whereas steep-slope zones are associated with negative effects. The negative coefficients of DTW and DTR dominate across most of the region; only limited areas in the northern part of Lake Taihu show weak positive effects of DTW. Elevation (ELEV) exhibits the largest mean absolute coefficient, indicating the strongest overall influence. Positive effects are concentrated in higher-elevation areas, whereas significant negative effects occur in low-hill transition zones. The effect of population density (PD) reflects a clear urban–rural differentiation, with negative impacts in urbanized areas (e.g., nearshore zones of Suzhou and Wuxi) and positive impacts in rural areas, particularly along the southeastern shore of Lake Taihu. Positive coefficients of road network density (RND) are mainly clustered in areas with dense secondary road networks, whereas negative coefficients are distributed along major ring-lake arterial roads.
Overall, the inherently uneven spatial distributions of these influencing factors jointly shape the spatial differentiation of CES supply–demand matching. Their effects are not globally uniform but exhibit strong spatial dependence and context-specific characteristics.
4. Discussion
4.1. Discussion on the Distribution Characteristics of CES Perception and Supply Around Taihu
Previous studies have consistently indicated that the supply and perception of CESs exhibit pronounced spatial inequalities. High-supply areas are typically concentrated in regions with strong ecological foundations and dense cultural resources or public service facilities [38], whereas public perception and actual use display stronger spatial clustering, primarily influenced by vegetation cover, water-related landscapes, and the accessibility of recreational facilities [31]. The CES supply and perception patterns identified in the circum-Taihu region are broadly consistent with these findings. Supply hotspots are mainly distributed along the lakeshore and in areas with concentrated ecological and cultural infrastructure, whereas perception hotspots show a more explicit human activity orientation and a higher degree of spatial agglomeration.
Further analysis reveals distinct supply–demand mismatch patterns among different CES types. For natural landscape services, a pronounced gradient mismatch of “high demand–low supply” is observed in core scenic areas, indicating that reliance on natural endowments alone is insufficient to sustain high-quality experiences under conditions of intense demand. Meanwhile, the coexistence of low supply and low demand in some peripheral areas further exacerbates spatial imbalance [39]. From a planning perspective, it is therefore necessary, under strict ecological protection constraints, to moderately enhance service capacity and quality in core areas by improving slow-traffic systems, scenic viewpoints, and basic service facilities, thereby alleviating peak-period supply–demand pressure. In addition, ecological restoration and improved accessibility can guide peripheral areas toward the development of low-intensity, multi-tier natural landscape services, helping to redistribute pressure away from core zones.
In the case of cultural heritage services, the pronounced “high supply–low perception” mismatch suggests that the spatial concentration of physical heritage assets has not been effectively translated into public cultural experience and emotional engagement. This may be attributed to static modes of presentation, insufficient spatial integration, and a disconnect from contemporary life contexts [5,40]. Accordingly, planning strategies should emphasize the systematic integration and thematic organization of heritage resources. The creation of heritage corridors, lakeside cultural trails, and composite cultural nodes can enhance overall perceptibility, while immersive exhibitions, digital interpretation, and scenario-based activities can facilitate a transition from static conservation toward experience-oriented heritage utilization.
By contrast, recreational services demonstrate a relatively high degree of supply–demand matching, as their participatory and social attributes are conducive to the conversion of service provision into actual use and perception. Building on the advantages of the existing spatial configuration, future efforts could further strengthen their demonstrative role by promoting the integrated configuration of recreational facilities with natural landscapes and cultural resources, thereby fostering an “recreation–experience–social interaction” development model. This approach may also provide valuable reference for improving perception conversion efficiency in other CES types.
It should be noted that the identification of CES supply–demand mismatches is, to some extent, influenced by uncertainties related to spatial classification thresholds and data sources. However, the multi-distance sensitivity analysis shows that the core spatial patterns and overall model performance remain consistent across different buffer scales, indicating that the conclusions of this study are robust to parameter settings.
4.2. Spatial Heterogeneity of Key Influencing Mechanisms for CES Perception and Supply
Building on the spatial distribution of CES perception and supply discussed in Section 4.1, this section further examines the driving mechanisms underlying the spatial heterogeneity revealed by the GWR results within the specific geographical and socio-economic context of the Taihu Lake Basin. The regression coefficients of all explanatory variables exhibit pronounced spatial non-stationarity, with both the direction and magnitude of their effects varying across space, indicating that CES supply–demand relationships are jointly shaped by multiple context-dependent factors.
The local regression coefficients of NDVI are negative in 63.94% of spatial units, with positive effects observed only in parts of the northern and eastern lakeshore areas, contrasting with previous findings [41]. This suggests that vegetation cover does not universally enhance CES perception in the Taihu Basin; rather, its effects are constrained by vegetation structure and landscape visibility. In some lakeshore areas, such as the southwestern part of Lake Taihu, dense tree–shrub vegetation or artificial shelterbelts may obstruct visual corridors toward the lake, weakening water-centered aesthetic experiences. Conversely, in lakeshore sections with more open vegetation structures, higher NDVI is more likely to enhance nature-based CES perception.
SLOPE shows a predominantly positive spatial pattern, particularly in gently sloping lakeshore areas, while negative effects emerge in steeper terrain. This indicates that moderate topographic variation supports accessible viewing spaces with favorable visual conditions, whereas steep slopes may limit accessibility and recreational use. DTW exhibits a significant negative effect across most areas, reflecting a clear distance-decay pattern in CES perception as opportunities for direct water contact and continuous lake views decrease with increasing distance from the shoreline.
ELEV has the largest mean absolute regression coefficient, highlighting its strong influence on CESs matching. Positive effects are mainly concentrated in low-to-moderate elevation transition zones that offer advantageous panoramic views of Lake Taihu [42], consistent with previous research on topographic enhancement of landscape aesthetics [43]. In contrast, higher-elevation or rugged areas show negative effects, likely due to higher access costs and limited recreational infrastructure, corresponding to observed “high supply–low perception” mismatches.
PD exhibits clear urban–rural differentiation. In urban lakeside areas such as Suzhou and Wuxi, higher population density negatively affects CES matching, reflecting crowding and environmental pressure [3]. In contrast, in the southeastern lakeshore regions dominated by traditional villages and agricultural landscapes, population density is positively associated with CES perception, suggesting that moderate human activity supports cultural practices and landscape management [6].
Finally, the combined effects of RND and DTR reveal trade-offs between accessibility and landscape quality. Moderate road density enhances access to lakeshore and recreational sites [44], whereas negative effects along major transportation corridors are likely related to landscape fragmentation, noise disturbance, and environmental degradation [34].
Overall, the differentiated spatial effects of environmental and socio-economic factors jointly shape the heterogeneous CES supply–demand matching pattern in the Taihu Lake Basin. These results underscore the spatially dependent and context-specific nature of CES formation and perception, providing a scientific basis for targeted planning and management interventions.
4.3. Study Limitations and Directions for Future Research
This study advances the framework of CES supply–demand matching by integrating geographically weighted regression with regional contextual analysis, explicitly distinguishing between CES supply and perception and examining their spatial matching relationships. This approach provides a new analytical perspective for quantifying the spatial heterogeneity of factors influencing CES. In addition, by integrating multi-source data and applying Baidu EasyDL for large-scale image classification, this study complements existing CES assessment methods, expands the application scenarios of AI tools in CES research, and enriches the theoretical understanding of cultural ecosystem services.
Nevertheless, this study still has certain limitations. First, the perception data are subject to representativeness bias. The analysis primarily relies on user-generated data such as social media photographs, with contributors predominantly from younger and more urbanized populations. As a result, the cultural service demands of older adults, lower-income groups, and populations with low levels of online participation are insufficiently represented, which may to some extent affect the comprehensiveness of demand characterization [45]. Second, scale inconsistencies exist in the integration of multi-source data. Remote sensing, POI, and social media data differ in spatial accuracy and temporal resolution, and the overlay of static and dynamic datasets may weaken the representation of CES mobility characteristics, thereby limiting the precision of supply–demand matching analyses [46]. Third, the current study focuses mainly on the quantitative assessment of CES supply–demand matching and lacks the integration of qualitative dimensions of human well-being.
Accordingly, future research can be improved in three main aspects. First, with respect to data sources and sample structure, the representativeness bias of perception data can be mitigated by combining multi-platform data integration with targeted surveys. More universal behavioral datasets—such as mobile phone signaling data, public transport smart card records, and community activity logs—can be introduced to more comprehensively capture activity patterns across different age groups. Second, in terms of multi-source data integration techniques, it is necessary to enhance the precision of supply–demand matching using scale harmonization and algorithmic optimization. This includes standardizing the spatial and temporal scales of remote sensing, POI, and social media data as well as incorporating spatiotemporal fusion models to couple static supply data with dynamic demand data, thereby systematically capturing seasonal variations, holiday effects, and long-term evolutionary trends in CES supply and demand. Third, future studies should incorporate qualitative well-being indicators—such as residents’ cultural identity and recreational satisfaction—and integrate them with quantitative analyses using a “quantitative + qualitative” framework. This approach would deepen the understanding of the mechanisms through which CESs influence human well-being and further expand the depth and breadth of related research.
5. Conclusions
This study focuses on CESs within a 5 km buffer zone around Taihu Lake. By integrating geotagged photo data with GIS techniques, it examines public perceptions of CESs in relation to actual service supply. Using kernel density analysis and GWR, this study reveals the temporal and spatial distribution patterns of different CES types and their driving factors and analyzes the matching relationship between CES supply levels and perceived demand.
The results indicate that, in terms of supply–perception matching, natural scenic services exhibit a pronounced gradient mismatch between supply capacity and perceived intensity. This mismatch is particularly evident on Xishan Island and its southwestern areas, where strong public perception is not accompanied by corresponding improvements in actual resource supply, resulting in an undersupply situation and a clear shortage of viewing facilities. Given the prevalence of high-perception–low-supply conditions in central Taihu Lake, especially on Xishan Island and its southwestern areas, priority should be given to strengthening the construction of viewing and recreational facilities in these locations. For cultural heritage services, although regional supply levels are the highest among the three CES types, public perception is far lower than supply values. This suggests that investments in heritage conservation and resource integration have not been effectively translated into public awareness and cultural experience, particularly along the western shore of Taihu Lake, reflecting insufficient integration of cultural resources. In contrast, recreational services demonstrate relatively high supply–perception matching efficiency and high facility utilization rates, indicating strong adaptability and operational efficiency in terms of resource allocation and public acceptance.
Regarding environmental influences, different factors exert heterogeneous positive and negative effects on CES perception. SLOPE, RND, and ELEV have significant positive effects, whereas the NDVI, DTW, and DTR show significant negative effects. Among these factors, distance to roads has the strongest inhibitory effect on CES perception, whereas elevation exerts the strongest positive influence on public perception levels.
Author Contributions
X.S.: Conceptualization, Data curation, Formal analysis, Investigation, Methodology, Writing—original draft; F.G.: Conceptualization, Supervision, Visualization, Writing—review and editing, Validation; X.Z.: Project administration, Resources, Supervision, Validation; D.S.: Conceptualization, Validation, Software, Visualization; J.T.: Project administration, Software, Visualization. All authors have read and agreed to the published version of the manuscript.
Funding
This research was funded by National Natural Science Foundation of China Youth Project grant number 52008280 and 52308029; Heilongjiang Academy of Sciences Talent Team Construction Project grant number RC2024ZR01; “14th Five-Year Plan” Jiangsu Province Key Discipline Construction Project grant number Landscape Architecture: 082240006/002/002; Heilongjiang Academy of Sciences Double Goose Array Project grant number STYZ2022ZR01; Heilongjiang Postdoctoral Fund grant number LBN-Z23263.
Institutional Review Board Statement
Not applicable.
Informed Consent Statement
Not applicable.
Data Availability Statement
The data presented in this study are available on request from the corresponding author due to platform terms of use and privacy considerations.
Conflicts of Interest
The authors declare no conflict of interest.
References
- Daily, G.C. Nature’s Services: Societal Dependence on Natural Ecosystems; Island Press: Washington, DC, USA, 1997. [Google Scholar]
- Villamagna, A.M.; Mogollón, B.; Angermeier, P.L. A multi-indicator framework for mapping cultural ecosystem services: The case of freshwater recreational fishing. Ecol. Indic. 2014, 45, 255–265. [Google Scholar] [CrossRef]
- Plieninger, T.; Dijks, S.; Oteros-Rozas, E.; Bieling, C. Assessing, mapping, and quantifying cultural ecosystem services at community level. Land Use Policy 2013, 33, 118–129. [Google Scholar] [CrossRef]
- Costanza, R.; de Groot, R.; Braat, L.; Kubiszewski, I.; Fioramonti, L.; Sutton, P.; Farber, S.; Grasso, M. Twenty Years of Ecosystem Services: How Far Have We Come and How Far Do We Still Need to Go? Ecosyst. Serv. 2017, 28, 1–16. [Google Scholar] [CrossRef]
- Wen, C.; Xu, H.Y.; Plieninger, T. Intangible bonds: Cultural ecosystem services and landscape practices. Landsc. Archit. Front. 2022, 10, 4–7. [Google Scholar] [CrossRef]
- Huynh, L.T.M.; Gasparatos, A.; Su, J.; Lam, R.D.; Grant, E.I.; Fukushi, K. Linking the nonmaterial dimensions of human–nature relations and human well-being through cultural ecosystem services. Sci. Adv. 2022, 8, eabn8042. [Google Scholar] [CrossRef]
- Xiao, H.B.; An, Q.; Kuang, Y.L.; Wu, J.Y. Measuring and Mapping the Supply–Demand of Cultural Ecosystem Services in Urban Green Spaces from a Health and Well-Being Perspective: A Parcel-Scale Case Study of the Old City of Jinan. J. Xi’an Univ. Archit. Technol. 2022, 54, 376–385. [Google Scholar] [CrossRef]
- Yang, L.; Cao, K. Cultural Ecosystem Services: Research Progress and Future Prospects: A Review. Sustainability 2022, 14, 11845. [Google Scholar] [CrossRef]
- Ryfield, F.; Cabana, D.; Brannigan, J.; Crowe, T. Conceptualizing “sense of place” in cultural ecosystem services: An interdisciplinary research framework. Ecosyst. Serv. 2019, 36, 100907. [Google Scholar] [CrossRef]
- Chen, M.Y.; Li, C.Y.; Lin, G.S.; Zhou, Z.S. Cultural benefits of ecosystems: Conceptual clarification and evaluation indicators. Chin. Landsc. Archit. 2025, 41, 129–136. [Google Scholar] [CrossRef]
- Brown, G.; Fagerholm, N. Empirical PPGIS/PGIS mapping of ecosystem services: A review and evaluation. Ecosyst. Serv. 2015, 13, 119–133. [Google Scholar] [CrossRef]
- Burkhard, B.; Kroll, F.; Nedkov, S.; Müller, F. Mapping ecosystem service supply, demand and budgets. Ecol. Indic. 2012, 21, 17–29. [Google Scholar] [CrossRef]
- Li, J.H.; Jiang, H.W.; Bai, Y.; Alatalo, J.M.; Li, X.; Liu, G.; Xu, J. Indicators for spatial–temporal comparisons of ecosystem service status between regions: A case study of the Taihu River Basin, China. Ecol. Indic. 2016, 60, 1008–1016. [Google Scholar] [CrossRef]
- Guan, Q.C.; Hao, J.M.; Ren, G.P.; Li, M.; Chen, A.Q.; Duan, W.K.; Chen, H. Ecological indices for analyzing the spatiotemporal characteristics of ecosystem service supply and demand: A case study of major grain-producing regions in Quzhou, China. Ecol. Indic. 2020, 108, 105748. [Google Scholar] [CrossRef]
- Bing, Z.H.; Qiu, Y.S.; Huang, H.P.; Chen, T.Z.; Zhong, W.; Jiang, H. Spatial distribution of cultural ecosystem services supply and demand in urban and suburban areas: A case study of Shanghai, China. Ecol. Indic. 2021, 127, 107720. [Google Scholar] [CrossRef]
- Li, C.; Huang, X.; Zhao, J.; Zhao, Z.Y.; Mei, Z.J.; Chen, S. Research progress on cultural ecosystem services. Acta Ecol. Sin. 2025, 45, 6103–6115. [Google Scholar] [CrossRef]
- Shen, S.; Ma, Y.; Hu, T.H. Evaluation of urban human settlement quality based on multi-source data. J. Hum. Settl. West China 2022, 37, 48–54. [Google Scholar] [CrossRef]
- Dai, P.; Zhang, S.; Chen, Z.; Gong, Y.; Hou, H. Perceptions of Cultural Ecosystem Services in Urban Parks Based on Social Network Data. Sustainability 2019, 11, 5386. [Google Scholar] [CrossRef]
- Li, H.R.; Liu, Z.; Li, X.X.; Zheng, X. Evaluation of cultural ecosystem services of urban riverside green spaces based on social media text. Landsc. Archit. 2023, 30, 80–88. [Google Scholar] [CrossRef]
- He, S.; Su, Y.; Shahtahmassebi, A.R.; Huang, L.Y.; Zhou, M.M.; Gan, M.Y.; Deng, J.S.; Zhao, G.; Wang, K. Assessing and mapping cultural ecosystem services supply, demand and flow of farmlands in the Hangzhou metropolitan area, China. Sci. Total Environ. 2019, 692, 756–768. [Google Scholar] [CrossRef]
- Yang, Y.; Xian, Y.; Li, X.; Qian, L.; Zhou, S. Supply–demand matching evaluation and coupling coordination of cultural ecosystem services in urban park green spaces. Landsc. Archit. 2025, 32, 90–99. [Google Scholar] [CrossRef]
- Sun, X.; Li, X.; Yang, D.; He, Y. Supply–demand relationships of cultural ecosystem services in green spaces based on multi-source data: A case study of Chongqing central urban area. J. Hum. Settl. West China 2024, 39, 162–168. [Google Scholar] [CrossRef]
- Yang, Y.; Li, R.; Yang, H.; Zhong, L.; Huang, M.; Xie, M. Spatial patterns and influencing factors of supply–demand matching of cultural ecosystem services in mountainous tourism areas: A case study of Guizhou Province, China. Acta Ecol. Sin. 2024, 44, 7445–7460. [Google Scholar] [CrossRef]
- Córdoba Hernández, R.; Camerin, F. The Application of Ecosystem Assessments in Land Use Planning: A Case Study for Supporting Decisions toward Ecosystem Protection. Futures 2024, 161, 103399. [Google Scholar] [CrossRef]
- Li, J.C. Total pollution control and treatment of the Taihu Lake Basin: Review of the “Master Plan for Comprehensive Improvement of Taihu Basin Water Environment”. Environ. Pollut. Control 2010, 32, 96–100. [Google Scholar] [CrossRef]
- Chen, D.C.; Shi, Z.K.; Wang, Z.J.; Yu, C. Ecological network construction and spatial conflict identification in the Taihu Lakeside area of Suzhou. J. Ecol. Rural Environ. 2020, 36, 778–787. [Google Scholar] [CrossRef]
- Wang, J.H.; Yan, W.; Duan, X.J.; Duan, Y.Y.; Zou, H.; Jin, M.K. Identification of lake ecological buffer zones and ecosystem services valuation: A case study of Dianchi Lake. Acta Ecol. Sin. 2023, 43, 1005–1015. [Google Scholar] [CrossRef]
- Millennium Ecosystem Assessment (MEA). Ecosystems and Human Well-Being: Synthesis; Island Press: Washington, DC, USA, 2005. [Google Scholar]
- Wang, X.R.; Wan, R.R.; Pan, P.P. Construction and regulation of ecological security patterns in the Taihu Lake Basin based on MSPA–MCR models. Acta Ecol. Sin. 2022, 42, 1923–1935. [Google Scholar] [CrossRef]
- Zuo, Y.; Zhang, L. Research on local ecosystem cultural services in Jiangnan water-network rural areas: A case study of the Yangtze River Delta Eco-Green Integrated Development Demonstration Zone, China. Land 2023, 12, 1373. [Google Scholar] [CrossRef]
- Guo, R.Z.; Lin, L.; Xu, J.F.; Dai, W.H.; Song, Y.B.; Dong, M. Spatiotemporal characteristics of cultural ecosystem services in Hangzhou Xixi National Wetland Park and their relationships with landscape factors. Ecol. Indic. 2023, 154, 110910. [Google Scholar] [CrossRef]
- Zhong, X.L. Spatiotemporal Distribution and Landscape Preferences of Tourists in the Wulingyuan Scenic Area Based on the Two-Step Trail Platform. Master’s Thesis, Central South University of Forestry and Technology, Changsha, China, 2019. [Google Scholar]
- Tenerelli, P.; Demšar, U.; Luque, S. Crowdsourcing indicators for cultural ecosystem services in mountain landscapes: A geographically weighted approach. Ecol. Indic. 2016, 64, 237–248. [Google Scholar] [CrossRef]
- Arbuthnott, K.D. Nature exposure and social health: Prosocial behavior, social cohesion, and effect pathways. J. Environ. Psychol. 2023, 90, 102109. [Google Scholar] [CrossRef]
- Li, Z.; Zhou, S.L.; Zhang, H.F.; Yao, X.; Wu, W. Influencing factors and marginal price effects of residential land prices in Nanjing based on the geographically weighted regression model. China Land Sci. 2009, 23, 20–25. [Google Scholar] [CrossRef]
- Wang, Y.; Wang, Y.; Liu, Z.; Liu, C. Research on Spatial Characteristics and Influencing Factors of Urban Vitality at Multiple Scales Based on Multi-Source Data: A Case Study of Qingdao. Appl. Sci. 2025, 15, 8767. [Google Scholar] [CrossRef]
- Brunsdon, C.; Fotheringham, A.S.; Charlton, M.E. Geographically weighted regression: A method for exploring spatial nonstationarity. Geogr. Anal. 1996, 28, 281–298. [Google Scholar] [CrossRef]
- Zhong, J.Q.; Gao, M.F.; Zhao, Y.Q.; Peng, S.; Wang, M.T. Spatial variation of cultural ecosystem services patterns and influencing factors in coastal areas: Evidence from Ramsar sites in China. Acta Geogr. Sin. 2024, 79, 76–96. [Google Scholar] [CrossRef]
- Zhao, Q.Q.; Li, J.; Liu, J.Y.; Qin, K.Y.; Tian, T. Assessment of cultural ecosystem services in the Guanzhong–Tianshui Economic Zone based on the SolVES model. Acta Ecol. Sin. 2018, 38, 3673–3681. [Google Scholar] [CrossRef]
- Fu, B.J.; Zhou, G.Y.; Bai, Y.F.; Song, C.C.; Liu, J.Y.; Zhang, H.Y.; Lü, Y.H. The Main Terrestrial Ecosystem Services and Ecological Security in China. Adv. Earth Sci. 2009, 24, 571–576. [Google Scholar] [CrossRef]
- Chen, Q.M.; Guo, Q.H.; Mao, Q.Z. Spatial pattern characteristics and influencing factors of cultural ecosystem services in urban parks. Acta Ecol. Sin. 2024, 44, 9567–9581. [Google Scholar] [CrossRef]
- Wang, F.Y.; Wang, K.Y.; Yu, H.; Chen, T. Differentiation Characteristics and Influencing Factors of Ecological Recreational Space in the Pearl River Delta Urban Agglomeration. Geogr. Res. 2020, 39, 2148–2164. [Google Scholar] [CrossRef]
- Yoshimura, N.; Hiura, T. Demand and supply of cultural ecosystem services: Use of geotagged photos to map the aesthetic value of landscapes in Hokkaido. Ecosyst. Serv. 2017, 24, 68–78. [Google Scholar] [CrossRef]
- Zhang, J.Q.; Chen, X.D.; Xiu, C.L. Measuring urban sprawl based on POI data: A case study of Shenyang, China. China Land Sci. 2019, 33, 93–102. [Google Scholar] [CrossRef]
- Li, C.; Liang, Q.; Lin, B.; Zhai, J. Landscape management and planning as a spatial organization method connecting cultural ecosystem service supply–demand assessment and sustainable tourism development. J. Outdoor Recreat. Tour. 2023, 44, 100705. [Google Scholar] [CrossRef]
- Chen, W.; Jing, C.; Xu, L.; Xu, H. Spatial Potential of Recreational Services in Western Hubei Region in Light of the “All-for-One Tourism” Development: A Machine Learning Approach Based on an Ensemble Model. Landsc. Archit. Front. 2022, 10, 8–31. [Google Scholar] [CrossRef]
Disclaimer/Publisher’s Note: The statements, opinions and data contained in all publications are solely those of the individual author(s) and contributor(s) and not of MDPI and/or the editor(s). MDPI and/or the editor(s) disclaim responsibility for any injury to people or property resulting from any ideas, methods, instructions or products referred to in the content. |
© 2026 by the authors. Licensee MDPI, Basel, Switzerland. This article is an open access article distributed under the terms and conditions of the Creative Commons Attribution (CC BY) license.