Abstract
The increasing adoption of electric vehicles (EVs) for last-mile delivery requires adapting existing routes designed for internal combustion engine (ICE) vehicles. This study introduces an enhanced Ant Colony System (ACS) that optimizes EV routing by dynamically incorporating state of charge (SOC), charging station proximity, and time constraints. Unlike traditional methods, our approach adjusts pheromone deposition in real time, prioritizing charging stops only when necessary, significantly improving adherence to delivery times. Using real-world delivery data from Paris, our results show that routes under 90 km tend to remain energetically feasible, although intermediate time-window violations may occur due to cumulative charging delays. For longer routes, the need for additional charging stops introduces a risk of delays, but the system effectively manages these constraints to minimize disruption. These results provide fleet operators with a practical decision-support tool to identify which pre-optimized routes can be efficiently adapted to EVs, thus offering a pathway for the integration of electric vehicles into existing logistics without significant operational disruption. Future work will focus on enhancing the system by incorporating real-time traffic updates and charging station availability to further optimize the routing process.
1. Introduction
The rise of electric vehicles (EVs) in urban freight transport is part of a broader shift toward energy transition and sustainable logistics. Last-mile delivery, the final step of the supply chain delivery process, is a critical phase that has seen a steady increase in volume—urban parcel delivery has grown by 5% per year since 2010, and a 25% increase in last-mile deliveries by 2020, with projections for continued post-pandemic growth, which is interesting to compare with the percentage of parcels successfully delivered on a route. So, while the quantity of goods in transit in urban centers is increasing, the number of parcels successfully delivered is decreasing. This growth intensifies congestion and exacerbates the environmental footprint of urban logistics, including CO2 emissions and noise pollution.
Paradoxically, while city dwellers express growing environmental concerns, the demand for home delivery services continues to grow, further increasing logistical pressure in dense urban areas. In this context, integrating low-emission vehicles, particularly EVs, becomes essential. However, doing so requires rethinking routing strategies to account for their limited driving range and the need for efficient access to charging infrastructure.
Bio-inspired approaches, especially Ant Colony Optimization (ACO), are particularly well-suited to address such complex and dynamic routing problems. Their distributed and adaptive nature makes them effective in handling variable battery levels (state of charge, SOC) and time window (TW) constraints.
Despite growing interest in fleet electrification, most logistics operators still maintain mixed fleets that combine internal combustion engine (ICE) vehicles and EVs. Since delivery tours that are optimized for ICE vehicles do not incorporate EV-specific constraints such as range limitations and charging needs, this raises several operational questions:
- Can a pre-optimized route (with a fixed client sequence) be feasibly operated by an EV, given its energy capacity?
- How can charging stops be inserted without violating customer or depot time windows?
- Where is the boundary between EV-compatible routes and those that should remain assigned to ICE vehicles?
Beyond pure feasibility, logistics operators aim to identify which portions of their existing operations can be transferred to EVs with minimal disruption and without the need to redesign their routing systems.
In this paper, we propose a method for adapting pre-optimized ICE delivery routes to EV constraints. Our approach is based on an enhanced Ant Colony System (ACS) that incorporates a dynamic pheromone mechanism driven by three key criteria:
- The remaining SOC;
- The distance to the nearest charging station;
- The remaining time to reach the next customer’s time window.
We modify the arc selection probability function to prioritize the following:
- Charging stations when the SOC of the EV is low;
- The next customer when sufficient charge remains.
Our energy consumption model, grounded in the principles of vehicle dynamics, provides a robust framework for estimating energy use across individual segments, taking into account elevation profiles and vehicle-specific parameters.
We validate our method using real-world delivery tours and open-source charging infrastructure data, combined with reference routes generated using exact optimization methods for ICE vehicles.
This approach is generalizable to various urban contexts and vehicle types. It offers a pragmatic transition strategy that allows logistics providers to reuse existing routes while progressively integrating EVs into their operations.
- Contributions
This study offers three novel contributions to the optimization of electric vehicle routing.
- A charging-aware Ant Colony System. We extend the classical ACS by introducing an energy-feasibility-driven pheromone update mechanism and a state-dependent transition rule that jointly encode routing and charging constraints. To our knowledge, such a coupling has not been investigated in the prior EVRP literature.
- A realistic modeling framework. The approach integrates heterogeneous public charging stations, real-world road-network distances, and vehicle-specific charging curves. This goes beyond conventional EVRP assumptions based on synthetic charging data or idealized station availability.
- A full-scale application to a dense urban region. The method is evaluated on actual delivery tours in Paris and a complete public charging dataset, demonstrating practical feasibility and operational insights not previously reported.
Together, these contributions provide a concrete methodological advance over classical ACS-based routing and existing EVRP formulations.
The remainder of this paper is organized as follows: Section 2 reviews the state of the art in EV routing using ACO-based methods. Section 3 presents the problem formulation, energy consumption model, the construction of the charging network, and the integration of our ACS algorithm. Section 4 details our experimental results and performance evaluation. Finally, Section 5 summarizes the findings and outlines future research directions.
2. State of the Art
The Electric Vehicle Routing Problem (E-VRP) has garnered significant attention in recent years, especially in the context of low-carbon urban logistics. We structure the literature review into three key areas: (i) electric vehicle tour planning, (ii) integration of charging operations and time windows, and (iii) optimization based on Ant Colony Optimization.
E-VRP extends the classical Vehicle Routing Problem (VRP) by incorporating range limitations that require scheduling charging stops. Early approaches to electric vehicle routing include those by Conrad et al. [1]. Erdogan et al. [2] and Goeke et al. [3] were among the first to propose models incorporating charging stations for EV routing. Their results highlight the importance of station location and charging capacity in ensuring route feasibility. Other variants support partial charging strategies to reduce total delivery time. Sumaiya et al. [4] proposed a multi-objective approach to minimize both travel time and CO2 emissions, showing that optimized charging management can partially offset the limited range of EVs.
Introducing time windows further increases the complexity of the problem. Vehicles must arrive within each customer’s designated time slot while still accounting for charging needs. Schiffer et al. [5] introduced a Location Routing Problem with Time Windows tailored to EVs, emphasizing the influence of road topology and charging power. In industrial settings, the rise of mixed fleets creates additional challenges. Hiermann et al. [6] demonstrated that ICE-optimized routes are not always transferable to EVs, and stressed the importance of strategic task allocation to control costs and preserve schedule reliability. Recent charging strategies for electric vehicles have been investigated by Abid et al. [7].
The Electric Vehicle Routing Problem has been extended to a wide range of variants, addressing a variety of operational constraints and objectives. Recent reviews by Kucukoglu et al. [8] and Kalayci et al. [9] highlight the growing complexity of the problem and the variety of solution approaches proposed in the literature.
Metaheuristics, particularly ACO, by Dorigo et al. [10], have become standard tools for solving large-scale or constrained routing problems. ACO is inspired by the collective foraging behavior of ants, using artificial pheromones trails to guide solution construction. Dorigo and colleagues first introduced the Ant System, later refining it into the Ant Colony System, which integrates both local and global pheromone updates. Ant Colony Optimization has been adapted to electric vehicle routing, for instance in the ACO-based EVRP of Mavrovouniotis et al. [11]. More recently, a multiple Ant Colony System has been proposed to tackle larger and more constrained EVRP instances by Mavrovouniotis et al. [12]. Several E-VRP-specific adaptations adjust transition probabilities based on SOC levels. For instance, Mavrovouniotis et al. [11] proposed an adaptive charging module that adjusts based on battery state. However, most of these contributions do not address the conversion of existing routes or the use of detailed energy models based on vehicle dynamics.
Although the literature covers a broad spectrum of EV-related challenges—range constraints, time windows, fleet heterogeneity—three main gaps remain:
- Reuse of existing thermal routes: Most works build E-VRP instances from scratch. Few explore the practical need to convert already optimized ICE tours without redesigning the entire transport plan. Subramanyam et al. [13] analyzes a heterogeneous routing problem involving internal combustion engine vehicles and extended-range electric vehicles. Two solution methods are proposed: an exact branch-price-and-cut algorithm and an iterated tabu search metaheuristic. The study includes a large-scale application to parcel deliveries in the Chicago metropolitan area, highlighting the potential energy savings and operational implications of partial conversion from internal combustion to electric fleets.
- Advanced energy modeling: Linear models based on distance and average consumption remain predominant; however, dynamic models that account for mass, slope, and speed yield more accurate energy estimates.
- Fine-grained charging management: Charging decisions are often oversimplified. SOC, charger type (fast/slow), and remaining delivery time are rarely considered together.
Our study aims to fill these gaps by introducing an ACS-based method that (1) adapts existing thermal tours, (2) incorporates a physics-based energy model, and (3) leverages dynamic pheromone rules to jointly optimize charging behavior and time window adherence.
3. Model
- Notation
All quantities used in the equations are reported with their units: E (Wh), d (km), v (km/h), (kW), and SoC (%). Acronyms are defined once at first occurrence.
3.1. General Problem Framework
In this study, we consider a fleet of electric vehicles operating last-mile deliveries. Each vehicle has the same cargo capacity and is equipped with an identical battery pack rated at 282 kWh. To fulfill delivery needs, multiple tours are pre-planned, each assigned to a specific vehicle.
The delivery routes involve urban parcel distribution, where each customer imposes a time window that must be respected. The vehicle must reach each location within the designated interval, as delays can incur penalties. In addition to customer constraints, the depot also imposes a time window: vehicles must return by a specified time after completing their tours. The total route duration—including both delivery and charging stops—must remain within the specified time constraints. Each vehicle is also limited by its maximum payload capacity (volume or weight).
The goal of this work is to adapt delivery routes originally optimized for ICE vehicles so that they become feasible for EVs. We aim to preserve the customer sequence from the ICE tours while accounting for range constraints. This involves redirecting the vehicle to charging stations when its SOC is too low to continue the route without violating delivery constraints or failing to return to the depot.
The reference tours, used as baseline solutions, were generated using exact optimization methods for a Capacitated Time Window Vehicle Routing Problem (CTWVRP), assuming ICE vehicles. In that context, refueling constraints were ignored, and the solutions are considered optimal or near-optimal with respect to the number of vehicles, time windows, and capacity constraints.
Each ICE vehicle was assigned a fixed list of customers to visit in a specific order. In our EV adaptation, this customer sequence is preserved. The major difference lies in the need to insert charging stops along the route, without altering the delivery order and while maintaining adherence to all time windows.
3.2. Electric Consumption Model
Each EV is equipped with a 282 kWh battery, and its energy use must be carefully managed throughout the tour. To estimate energy consumption on each road segment, we use a physics-based model grounded in the fundamental principle of dynamics (see Figure 1). Physics-based models that account for vehicle mass, aerodynamic drag, slope, and speed have been shown to provide accurate estimates of EV energy consumption, by Koch et al. [14], which motivates the use of the detailed model adopted in this work. Based on the vehicle’s physical characteristics (mass, aerodynamics, etc., Table 1) and speed profile over each segment, the required mechanical power at the wheels is computed as follows:
where the variables are defined as follows:

Figure 1.
Balance of forces acting on the vehicle.

Table 1.
Energy model parameters.
- : vehicle speed [m/s];
- : road slope [rad];
- g: gravitational acceleration [m/s2];
- : air density [kg/m3];
- : vehicle mass [kg];
- : drag coefficient;
- S: frontal area [m2];
- : rolling resistance coefficient.
Vehicle speeds on each road segment are estimated using GraphHooper data. Due to low GPS sampling frequency, segments are treated with averaged constant speeds (no acceleration, no regenerative braking). Slope values are computed from elevation data by dividing the route into segments between GPS points. The slope of segment i is defined as follows:
This segmentation allows precise modeling of energy demands caused by elevation changes. For each segment, average power is multiplied by travel time to compute energy. After accounting for powertrain efficiency , the battery energy consumption is as follows:
Parameter values used are provided in Table 1.
To preserve battery health, we impose a soft constraint that SOC should not fall below 20%, ensuring operational safety and avoiding delivery interruptions.
3.3. Charging Station Network Construction
To account for range limitations, we built a charging station database using public datasets (e.g., French government [15]) and open-source sources (OpenStreetMap [16]). We merged and cleaned these sources to remove duplicates and standardize locations. Charging points within 1500 m were grouped into a single station entity, each containing one or more chargers of various types and power levels.
Based on the structured data, we constructed a navigation graph centered around customer locations and extended to cover nearby charging stations. Each node in the graph represents either a customer or a station, as illustrated in Figure 2, and edges represent accessible paths annotated with distance, speed, and travel time. Customers are connected to their nearest stations and the next customer in sequence, forming a hybrid graph of real and energy-supportive routes.
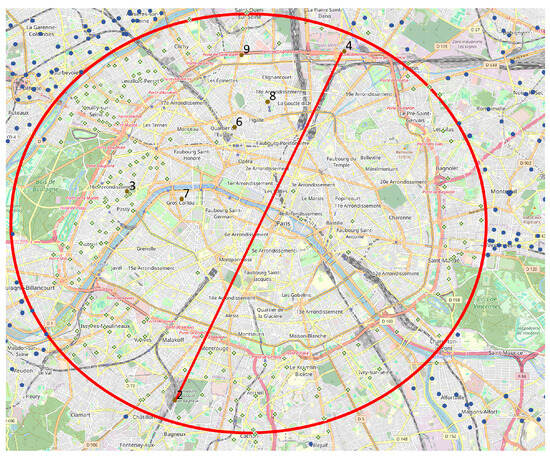
Figure 2.
Charging stations selected for the study and client locations (Paris).
To simulate realistic EV behavior and reduce battery aging, we allow partial charging up to a maximum SOC of 80%. We assume each station can serve one vehicle at a time, with no queuing delays. Each vehicle dynamically selects the best station based on its SOC, the distance to the station, and timing constraints associated with the next delivery.
3.4. Ant Colony Algorithm
The Ant Colony System is a robust and flexible metaheuristic designed to solve complex combinatorial problems such as the Vehicle Routing Problem. In our work, it is used to adapt pre-optimized ICE tours into feasible electric vehicle routes, accounting for range limitations and available charging stations. The problem is modeled as a graph, where the route construction is guided by pheromone trails and probabilistic decision rules.
Algorithm 1 summarizes the ACS approach, from initialization through pheromone updates to solution construction.
| Algorithm 1 Ant Colony System algorithm |
|
3.4.1. Standard ACS Mechanics
The original Ant System was introduced by Dorigo et al. in [10], where pheromone levels on edge are updated by all ants in each iteration:
where is the evaporation rate, m is the number of ants, is the pheromone deposited by ant k:
where Q is a constant and is the length of the tour constructed by ant k.
In ACS, a local update rule is also applied as ants build their tours:
where is the local decay coefficient and is the initial pheromone level.
This local update promotes solution diversity by lowering pheromone concentrations on recently traversed edges. The global update (offline) is applied only to the best-performing ant:
With , where is either the iteration-best or best-so-far tour length.
The decision rule to move from node i to node j uses the pseudo-random proportional rule:
where is the heuristic visibility (inverse of distance), is the set of unvisited nodes from current partial solution , and and control the influence of pheromones vs. heuristic.
3.4.2. ACS for Electric Vehicles and Charging Stations
Dynamic Pheromone Adjustment
To efficiently route EVs, we introduce a dynamic pheromone update mechanism that adapts edge desirability according to the following:
- the current state of charge;
- the distance to nearby charging stations;
- the time left before the next delivery window.
Upon visiting a client, edges connecting to charging stations and the next client are updated. Three weighting functions are defined:
1. SOC-awareness:
where x is SOC in percentage. This discourages charging when the battery is sufficiently charged, and promotes it otherwise.
2. Distance to charging station:
where y is the shortest path distance to a charging station. Closer stations are more attractive.
3. Time margin to next delivery:
where x is the normalized remaining time, L is the list of charger types, and n the number of options. This function prioritizes slow chargers when time is ample, and fast ones under tight constraints.
The final dynamic pheromone value is given by the following:
Modified Edge Selection Probability
To integrate energy constraints into edge selection, we introduce an energy-weighted probability rule:
where is the pheromone trail, is the visibility (inverse distance), is the energy-based factor, and , , and are weighting coefficients.
The term is defined as follows:
If is a charging station:
If is a client:
where is remaining energy, is critical energy level, and k is sigmoid steepness.
This setup ensures that ants favor recharging when energy is low, and continue deliveries when energy is sufficient. The parameter adjusts the weight of the energy constraint relative to pheromone intensity and heuristic visibility.
By combining pheromone dynamics, SOC-aware edge desirability, and probabilistic decision rules, our model achieves energy-efficient, constraint-compliant routing for electric delivery fleets. Recent ACO variants specifically designed for electric vehicles integrate energy-aware transition rules or path-planning mechanisms, as shown in Li et al. [17], which is consistent with the dynamic pheromone design proposed in this paper.
Sensitivity Factors
The main sensitivity factors of the proposed method are the battery capacity, the assumed efficiency , the charging power , and the initial state of charge. Variations in these parameters influence the feasibility of candidate tours and the frequency of recharging operations. We report these sensitivities in the experimental section and acknowledge that they may impact the robustness of the method.
Applicability to Mixed Traffic Flows
The proposed routing framework is compatible with mixed traffic environments involving both human-driven and automated vehicles. Recent studies have shown that accurately modeling interactions between heterogeneous vehicles can significantly improve the prediction of short-term travel times and local traffic dynamics. In particular, stability analyses of mixed traffic reveal that flow characteristics and congestion patterns can vary substantially when automated vehicles are introduced into human-driven streams, as shown in Luo et al. [18]. Complementary research on interaction-aware and driving-style-aware trajectory prediction indicates that incorporating behavioral heterogeneity into traffic models enhances both speed forecasting and micro-dynamic accuracy, as shown in Zhang et al. [19].
Integrating such predictive models into our travel-time and energy estimators would likely improve the fidelity of route feasibility assessments, especially in dense urban contexts where micro-interactions influence effective speeds, stop–go behaviour, and consequently SOC evolution. Although our current model uses aggregated travel-time profiles, the framework is fully compatible with these more detailed predictive components, which represent a promising direction for improving EV conversion analyses in real mixed-traffic conditions.
4. Experimental Results
4.1. Experimental Setup
4.1.1. Data and Instances
The delivery tours used in this study were provided by an industrial partner specializing in last-mile electric logistics, operating primarily in central Paris and its surrounding suburbs. Each tour includes the following:
- A vehicle (one per tour), with a defined departure/arrival depot and fixed transport capacity;
- A customer list involving either pickups or deliveries, where each customer is associated with a specific time window and a fixed visit order;
- Detailed customer data, including address, scheduled delivery time, travel distance, service duration, vehicle load factor, GPS coordinates, etc.
We use seven distinct instances, each representing a different delivery tour with around ten customers. Since all routes are located within the same urban area, the charging station network remains identical across all instances. The EV battery capacity is fixed at 282 kWh, as introduced in Section 3.
4.1.2. ACS Algorithm Parameters
To convert ICE-based tours into feasible electric vehicle routes, we implemented an Ant Colony System. The following parameters were adopted:
- Number of ants: equal to the number of graph nodes (customers + charging stations + depot);
- Evaporation rate : set to ;
- Coefficients: ;
- Sigmoid function: applied during node selection (client vs. charging station), with steepness parameter .
The stopping criterion was empirically defined to avoid local minima, based on preliminary tests. For each instance, a single run was performed in this exploratory phase (no repetition was conducted to compute variance metrics).
4.1.3. Constraint Management
- Time Windows: Any violation of a client’s time window leads to the immediate rejection of the ant’s solution—it is excluded from the pheromone update process. This encourages convergence toward strictly feasible solutions.
- State of charge: Solutions falling below 20% SOC are not strictly invalidated, but are penalized by lower ranking and reduced pheromone deposition. In practice, the sigmoid function significantly reduces the likelihood of visiting a client without sufficient charge, nudging the algorithm toward safer solutions.
- Simultaneous Handling: Time and energy constraints are jointly considered, without explicit weighting. The ACS balances temporal feasibility and energy usage through pheromone signals and sigmoid-based decisions.
4.1.4. Evaluation Criteria
We assess solution quality based on the following criteria:
- Time Window Compliance: For each iteration, we verify that all clients are visited within their assigned delivery slots.
- Energy Feasibility: SOC evolution is monitored throughout the tour to avoid energy depletion, aiming to maintain the SOC above 20% whenever possible.
- Conversion Success Rate: At the end of each execution, we measure for each instance the proportion of solutions that satisfy both energy and time constraints (i.e., , no violated time window).
To illustrate the results, we present two summary tables:
- A first table showing the evolution of the best solution across iterations for a representative instance, highlighting the improvements achieved by ACS (e.g., reduced number of charging stops, improved schedule adherence);
- A second table summarizing the conversion rate across the seven instances, demonstrating ACS’s ability to maintain feasibility under diverse urban delivery scenarios.
This experimental protocol is designed to demonstrate the practical relevance of our approach in realistic last-mile delivery contexts, supporting the transition from thermal fleets to electric operations in dense urban environments.
Table 2 presents an overview of the routing performance metrics collected across the five experimental instances described in the previous section. Each instance corresponds to a complete routing solution, initially optimized for thermal vehicles, and subsequently adapted for electric vehicle operation using the proposed algorithm.
Table 2.
Comparative summary of EV vs thermal performance by instance.
For each instance, the table reports the number of delivery points, the number of tours, and the total number of charging events triggered during execution. The average number of charges per tour is also indicated. In addition, the table details the number of tours that could not be completed due to time window constraints, as well as the number of deliveries for which the latest allowed delivery time (i.e., the end of the time window) was exceeded.
The table also includes a comparison of total routing time and total distance between the EV and thermal versions, expressed as percentage differences. Lastly, it presents a summary of time window compliance, including the number of time windows per tour, the number of violations observed, and the overall compliance rate.
4.2. Routing Performance Overview
This section provides an extended analysis of the routing performance obtained when converting pre-optimized ICE tours into EV-feasible routes using the proposed Ant Colony System. Beyond reporting the raw performance indicators shown in Table 2, we interpret these results through operational, computational, structural, and comparative lenses. The analysis highlights the interaction between the physical energy consumption model, the non-monotonic time-window structure, and the dynamic pheromone mechanism. The section concludes with key insights for last-mile EV deployment.
4.2.1. Operational Implications of Converting ICE Tours to EV Routing
The conversion of pre-optimized ICE tours into EV-feasible routes, while maintaining the original customer sequence, results in substantial operational deviations that are directly reflected in the performance indicators shown in Table 2. Across all instances, EV routing leads to consistent increases in both travel time and distance. Travel times rise by +39% to +65%, while distance increases range from +84% to +112%, primarily due to detours required to access charging infrastructure. These deviations are significantly higher than those typically reported in classical EVRP studies—such as Erdogan et al. [2], Schneider et al. [20], and Sumaiya et al. [4], where customer reordering is permitted and detours can be optimized to absorb charging overheads.
A detailed inspection of Table 2 reveals several consistent patterns: first, longer ICE tours (Instances 1, 2 and 5) experience the most severe EV inflation, with distance increases exceeding +108%. These instances require on average three to four charging events per tour, and each event introduces an average of 7 to 12 min of accumulated delay, which propagates along the fixed service sequence. This explains why Instances 2 and 5, despite following feasible energy trajectories, reach global time increases of +58.83% and +64.86%, respectively.
Second, the high number of intermediate time-window violations—ranging from 41 (Instance 3) to 109 (Instance 2)—highlights that EV infeasibility is driven primarily by temporal drift rather than energy insufficiency. These violations emerge as a structural consequence of the original ICE schedule, which lacks the temporal slack needed to absorb repeated charging operations. In instances with highly alternating time-window patterns (e.g., Instance 4), even moderate route lengths (55 customers) lead to 62 violations, confirming the compounding effect of non-monotonic temporal constraints.
Third, the physical energy model contributes directly to several of these deviations. Unlike linear distance-based models used in much of the EVRP literature, the model employed here incorporates aerodynamic drag, rolling resistance, vehicle mass, slope, and speed variability. This increases the sensitivity of EV feasibility to micro-topographic features of the Parisian road network. In practice, this means that EV consumption spikes on uphill or high-speed segments can trigger earlier-than-expected charging events, causing additional detours. This behavior helps explain the higher-than-anticipated distance inflation in instances 1, 2, and 5 (+108% to +112%), and aligns with recent studies advocating physics-informed models for EV routing by Bruglieri et al. [21] and Fazeli et al. [22].
Overall, the operational effects observed in Table 2 show that EV conversion feasibility is dominated by the interaction between route length, number of required charging operations, and time-window structure. While the ACS consistently identifies feasible charging strategies, temporal feasibility ultimately depends on the structural properties of the original ICE-designed schedules rather than on the optimisation process itself.
4.2.2. Computational Behaviour of the ACS Under Energy and Time Constraints
The proposed ACS demonstrates a consistent ability to identify EV-feasible routes under fixed customer sequences, primarily due to its dynamic pheromone formulation. Classical ACO-EVRP approaches by Mavrovouniotis et al. [11], Schneider et al. [20], and Keskin et al. [23] integrate battery information into transition rules but treat pheromone deposition uniformly. In contrast, our method modulates pheromone intensity as a function of state of charge, distance to the nearest charging station, and time-window pressure. This multi-criteria integration steers the search away from paths that are energy- or time-critical, especially in the early iterations.
From a computational standpoint, convergence is generally reached within 40–60 iterations, with an average runtime between 35 and 55 s per instance on a standard laptop (Intel i7). This computational budget makes the approach compatible with offline planning workflows typically used by parcel delivery operators. Notably, instances requiring more than three charging events display larger iteration-to-iteration variance before stabilizing, reflecting the increased combinatorial complexity created when energy and time constraints interact.
The dynamic pheromone mechanism is particularly effective in avoiding deep infeasibility trajectories: ants that enter low-SOC–high-delay states rapidly reduce pheromone reinforcement, preventing the algorithm from revisiting structurally unsuitable prefixes. This contrasts with the behavior of SOC-only heuristics in Mavrovouniotis et al. [11], which may remain agnostic to time-window propagation effects.
These computation times confirm that the ACS is suitable for daily operational planning.
4.2.3. Influence of Time-Window Structure
A central insight from the results is that time-window structure dominates EV feasibility, even when sufficient battery autonomy exists. Tours with alternating early and late time windows experience the highest violation rates, as small detours for charging accumulate and eliminate residual slack. Instances with more monotonic time-window distributions exhibit fewer violations despite similar distances and charging requirements.
This observation aligns partially with findings from the EVRPTW literature, i.e., Schiffer et al. [5], Desaulniers et al. [24], and Froger et al. [25], which emphasize the need for coordinated scheduling and routing. However, these studies assume full freedom to reorder customers or adjust service times, whereas our fixed-ordering constraint prevents such mitigation. As a result, even energetically feasible tours may become temporally infeasible, a phenomenon also reported in real-world feasibility analyses by Hiermann et al. [6] and Wang et al. [26].
Quantitatively, the presence of two or more sharp alternations in time-window ordering in a tour correlates with a >50% probability of intermediate violations, regardless of distance. For instance, Instance 4, despite involving only 55 customers, records 62 violations due to repeated alternations between early and late windows. Conversely, tours with predominantly increasing or decreasing window sequences maintain feasibility until energy becomes truly limiting. This establishes time-window monotonicity as a predictive factor for EV convertibility in industrial contexts.
4.2.4. Root Cause Analysis of Time-Window Violations
A closer inspection of the time-window violations reported in Table 2 reveals that infeasibility does not stem from the ACS itself but from structural properties of the original ICE-designed schedules. Three root causes can be identified.
- Propagation of charging-induced delays. Each charging event introduces a fixed service interruption (travel-to-station, waiting, and charging time), which accumulates along the fixed customer sequence. The resulting temporal drift is multiplicative rather than additive: a delay incurred early in the tour compresses all subsequent slack, making later service windows increasingly difficult to satisfy. This mechanism is particularly visible in Instances 2 and 5, where four charging events generate systemic lateness despite feasible energy profiles.
- Non-monotonic ordering of time windows. Tours that alternate repeatedly between early and late time windows amplify the effect of small delays. For example, Instance 4 records 62 violations despite having only 55 customers, due to alternating patterns that leave minimal buffer before critical early-window visits. This structural fragility means that even modest charging detours systematically trigger cascading violations, an effect also noted in operational studies such as Hiermann et al. [6].
- Interaction between route length and spatial distribution. Longer tours (e.g., Instances 1, 2, and 5) force the ACS to select charging stations that are spatially suboptimal relative to the ICE route geometry. Even though the algorithm finds energy-feasible solutions, the additional detours increase travel time by +50% or more, reducing the window for on-time arrivals. This confirms that EV feasibility is not governed solely by energy autonomy but also by the spatial-temporal coupling between station placement and route topology.
Overall, these root causes show that time-window violations are structural outcomes inherent to the original ICE schedules, rather than artefacts of the optimization algorithm. They highlight the difficulty of ensuring EV feasibility when legacy tours were not designed with charging constraints in mind, and they explain why even energy-feasible EV routes may become temporally infeasible under realistic urban conditions.
4.2.5. Comparison with Existing Literature
This subsection has been entirely rewritten to provide a comprehensive comparison across four main research families:
- Foundational works by Erdogan et al. [2], Schneider et al. [20], Hiermann et al. [6], Sumaiya et al. [4], Keskin et al. [23], and Schiffer et al. [5] assume reordering flexibility and often rely on simplified energy consumption models. Our setting differs fundamentally: customer order is fixed, representing a real operational constraint, and feasibility—not optimality—is the primary goal. As a result, our findings expose limitations that classical EVRP formulations cannot capture.
- Existing ACO-based approaches, by Mavrovouniotis et al. [11], Schneider et al. [20], and Keskin et al. [23] integrate SOC information but do not use dynamic pheromone modulation based on distance-to-charger or time-window pressure. Our multi-criteria pheromone mechanism therefore constitutes a methodological extension that improves structural feasibility under tight time constraints.
- Recent works introduce physics-informed models, such as Bruglieri et al. [21] and Fazeli2024 et al. [22], but integrate them into exact or hybrid solvers rather than adaptive metaheuristics. Our use of a slope- and speed-dependent physical model directly influences the emergent charging behavior and helps explain why some ICE-feasible tours become EV-critical due to micro-topography or average speed variations.
- Operational studies by Hiermann et al. [6], Pelletier et al. [27], and Subramanyam et al. [13] underline that EV adoption depends jointly on temporal flexibility, charging accessibility, and route structure. Operational studies on EV deployment in distribution logistics also emphasize the joint impact of charging strategies, time windows, and service quality, for example in the context of fresh food distribution in Yang et al. [28]. Our results are consistent with these findings but extend them by analyzing EV conversion through a dynamic heuristic rather than a purely analytical or simulation-based approach.
Together, these distinctions position our contribution at the intersection of realistic energy modeling, industrial scheduling constraints, and state-aware metaheuristics, a combination not addressed in previous EVRP research.
4.2.6. Practical Implications and Limitations
From an operational perspective, the results suggest that EV conversion of existing ICE routes is feasible for medium-range urban tours (<90 km), provided that the underlying time-window structure exhibits sufficient monotonicity. The ACS can be deployed as a lightweight planning tool to assess feasibility and propose charging-aware adaptations without fully redesigning routes.
The model assumes a fixed charging efficiency and SOC thresholds. Long-term battery aging and the impact of repeated fast-charging cycles are not explicitly modeled. These aspects may affect vehicle performance over extended operations and should be considered in future extensions.
Moreover, the results are based on deterministic travel times and charger availability; incorporating stochastic congestion or real-time occupancy, as suggested in Goeke et al. [3] and Spliet et al. [29], would provide a more realistic assessment. Additionally, the study evaluates single ACS runs; future work will explore variance across multiple executions and perform sensitivity analysis on pheromone parameters to better characterize robustness.
5. Conclusions
This paper presented a charging-aware Ant Colony System for adapting internal combustion engine delivery routes to electric vehicle operations. The algorithm integrates an energy-feasibility-driven pheromone update rule and a sigmoid-based decision function that jointly account for the state of charge, charging-station proximity, and delivery-schedule tightness. These mechanisms ensure that charging stops are inserted only when operationally necessary.
Experiments on seven real delivery tours in Paris demonstrate the practical feasibility of the approach. Routes shorter than 90 km were consistently converted to EV-compatible tours without time-window violations, while longer routes required additional charging stops that occasionally led to delays. Compared with a standard Ant Colony Optimization baseline, the dynamic pheromone mechanism improved both energy feasibility and schedule adherence by prioritizing charging opportunities according to real-time operational constraints.
Beyond methodological contributions, the results provide actionable insights for fleet operators. They demonstrate that the feasibility of electric vehicle routes depends not only on battery range but also on the temporal structure of delivery schedules: cumulative misalignments in time windows can render routes infeasible, even when energy constraints are satisfied. This highlights the relevance of preprocessing strategies—such as spatio-temporal clustering or time-window reordering, by Wang et al. [26]—for increasing the proportion of ICE tours that can be converted to EV operations.
The electrification of urban logistics is widely recognized as a key lever for reducing local emissions and improving the environmental footprint of last-mile delivery. However, beyond technical and infrastructural limitations, this transition is strongly constrained by economic and structural factors inherent to industrial logistics systems. In particular, the significantly higher acquisition cost of electric vehicles compared to conventional internal combustion vehicles, combined with long fleet renewal cycles, makes an immediate and homogeneous conversion of vehicle fleets unrealistic for most operators. As a result, logistics systems are likely to rely on heterogeneous fleets for extended periods of time, where electric and conventional vehicles coexist. In this context, sustainability cannot be addressed solely through idealized greenfield optimization but must account for the inertia of existing assets, investment constraints, and the need to preserve operational continuity. By focusing on the feasibility of converting already optimized delivery tours to electric vehicles, rather than redesigning logistics chains from scratch, the proposed approach supports a realistic and economically viable pathway toward progressive electrification, compatible with the constraints faced by industrial actors of various sizes.
Beyond economic feasibility, the results of this study also emphasize the importance of a system-level perspective when assessing the sustainability of electric vehicle deployment. The experiments show that electrification can induce non-negligible side effects, such as additional travel distance, charging-related delays, and time-window violations, which may degrade overall operational efficiency if not properly anticipated. These effects illustrate that an electrification strategy focused solely on vehicle replacement, without considering routing structure, energy constraints, and infrastructure interactions, may lead to counterproductive outcomes and unintended environmental trade-offs. By explicitly identifying the operational conditions under which electric vehicle integration remains feasible—or conversely leads to performance breakdowns—the proposed framework contributes to a more robust assessment of sustainable urban freight systems. In this sense, the work highlights that long-term sustainability in logistics emerges not only from the adoption of cleaner vehicles, but from the careful alignment of technological choices with economic constraints and system-level operational robustness.
Limitations and Future Research
The current model does not account for congestion dynamics, charging-station occupancy, or the long-term effects of battery degradation and frequent fast-charging cycles. Incorporating predictive travel-time models, station-availability forecasts, and degradation-aware state of charge dynamics represents an important next step. Extending the approach to mixed-traffic environments, involving both human-driven and automated vehicles, is another promising research direction.
Broader Impact
As cities implement increasingly stringent low-emission policies [30], the proposed framework offers a scalable, data-driven tool to support the transition to electric last-mile logistics. By quantifying which existing routes can be converted to electric vehicles under realistic constraints, the method enables more sustainable, efficient, and resilient fleet planning.
Author Contributions
Conceptualization: P.R.; methodology: P.R.; software: V.D. and T.M.; validation: P.R. and J.-F.B.; formal analysis: P.R.; investigation: P.R. and V.D.; resources: T.M.; data curation: V.D. and T.M.; writing—original draft preparation: P.R.; writing—review and editing, P.R. and J.-F.B.; visualization: V.D.; supervision: P.R.; project administration: P.R. All authors have read and agreed to the published version of the manuscript.
Funding
This research received no external funding.
Institutional Review Board Statement
Not applicable.
Informed Consent Statement
Not applicable.
Data Availability Statement
The data supporting the findings of this study are not publicly available due to commercial and operational confidentiality constraints.
Acknowledgments
The authors thank the operational teams who supported the collection and understanding of the delivery processes used in this study.
Conflicts of Interest
Authors Jean-François Béraud, Vincent Donval and Pierre ROMET were employed by Advans Lab, part of the Advans Group, and Thomas Montenegro was employed by Deki, a company operating in last-mile delivery services. The remaining author declares that the research was conducted in the absence of any commercial or financial relationships that could be construed as a potential conflict of interest.
References
- Conrad, R.G.; Figliozzi, M.A. The recharging vehicle routing problem. In Proceedings of the 2011 Industrial Engineering Research Conference, Singapore, 6–9 December 2011; IISE Norcross: Norcross, GA, USA, 2011; Volume 8. [Google Scholar]
- Erdoğan, S.; Miller-Hooks, E. A green vehicle routing problem. Transp. Res. Part E Logist. Transp. Rev. 2012, 48, 100–114. [Google Scholar] [CrossRef]
- Goeke, D.; Schneider, M. Routing a mixed fleet of electric and conventional vehicles. Eur. J. Oper. Res. 2015, 245, 81–99. [Google Scholar] [CrossRef]
- Iqbal, S.; Kaykobad, M.; Rahman, M.S. Solving the multi-objective Vehicle Routing Problem with Soft Time Windows with the help of bees. Swarm Evol. Comput. 2015, 24, 50–64. [Google Scholar] [CrossRef]
- Schiffer, M.; Walther, G. The electric location routing problem with time windows and partial recharging. Eur. J. Oper. Res. 2017, 260, 995–1013. [Google Scholar] [CrossRef]
- Hiermann, G.; Puchinger, J.; Ropke, S.; Hartl, R.F. The electric fleet size and mix vehicle routing problem with time windows and recharging stations. Eur. J. Oper. Res. 2016, 252, 995–1018. [Google Scholar] [CrossRef]
- Abid, M.; Tabaa, M.; Chakir, A.; Hachimi, H. Routing and charging of electric vehicles: Literature review. Energy Rep. 2022, 8, 556–578. [Google Scholar] [CrossRef]
- Kucukoglu, I.; Dewil, R.; Cattrysse, D. The electric vehicle routing problem and its variations: A literature review. Comput. Ind. Eng. 2021, 161, 107650. [Google Scholar] [CrossRef]
- Kalayci, C.B.; Yilmaz, Y. A review on the electric vehicle routing problems. Pamukkale Univ. J. Eng. Sci. 2023, 29, 855–869. [Google Scholar] [CrossRef]
- Dorigo, M.; Birattari, M.; Stutzle, T. Ant colony optimization. IEEE Comput. Intell. Mag. 2007, 1, 28–39. [Google Scholar] [CrossRef]
- Mavrovouniotis, M.; Ellinas, G.; Polycarpou, M. Ant colony optimization for the electric vehicle routing problem. In Proceedings of the 2018 IEEE Symposium Series on Computational Intelligence (SSCI), Bangalore, India, 18–21 November 2018; IEEE: Piscataway, NJ, USA, 2018; pp. 1234–1241. [Google Scholar]
- Mavrovouniotis, M.; Ellinas, G.; Li, C.; Polycarpou, M. A multiple ant colony system for the electric vehicle routing problem with time windows. In Proceedings of the 2022 IEEE Symposium Series on Computational Intelligence (SSCI), Singapore, 4–7 December 2022; IEEE: Piscataway, NJ, USA, 2022; pp. 796–803. [Google Scholar]
- Subramanyam, A.; Cokyasar, T.; Larson, J.; Stinson, M. Joint routing of conventional and range-extended electric vehicles in a large metropolitan network. Transp. Res. Part C Emerg. Technol. 2022, 144, 103830. [Google Scholar] [CrossRef]
- Koch, L.; Buse, D.S.; Wegener, M.; Schoenberg, S.; Badalian, K.; Andert, J. Accurate physics-based modeling of electric vehicle energy consumption in the SUMO traffic microsimulator. In Proceedings of the 2021 IEEE International Intelligent Transportation Systems Conference (ITSC), Indianapolis, IN, USA, 19–22 September 2021; IEEE: Piscataway, NJ, USA, 2021; pp. 1650–1657. [Google Scholar]
- data.gouv.fr. Fichier Consolidé des Bornes de Recharge (IRVE). 2025. Available online: https://transport.data.gouv.fr/datasets/base-nationale-des-irve-infrastructures-de-recharge-pour-vehicules-electriques (accessed on 10 October 2025).
- OpenStreetMap Contributors. Planet Dump. 2024. Available online: https://planet.osm.org (accessed on 10 October 2025).
- Li, J.; Li, J.; Fang, H.; Jiang, J. Dynamic energy-efficient path planning for electric vehicles using an enhanced ant colony algorithm. Teh. Vjesn. 2024, 31, 434–441. [Google Scholar]
- Luo, L.; Liu, Y.; Feng, Y.; Liu, H.X.; Ge, Y.E. Stabilizing traffic flow by autonomous vehicles: Stability analysis and implementation considerations. Transp. Res. Part C Emerg. Technol. 2024, 158, 104449. [Google Scholar] [CrossRef]
- Zhang, Q.; Xing, Y.; Wang, J.; Fang, Z.; Liu, Y.; Yin, G. Interaction-Aware and Driving Style-Aware Trajectory Prediction for Heterogeneous Vehicles in Mixed Traffic Environment. In IEEE Transactions on Intelligent Transportation Systems; IEEE: Piscataway, NJ, USA, 2025. [Google Scholar]
- Schneider, M.; Stenger, A.; Goeke, D. The electric vehicle-routing problem with time windows and recharging stations. Transp. Sci. 2014, 48, 500–520. [Google Scholar] [CrossRef]
- Bruglieri, M.; Paolucci, M.; Pisacane, O. A matheuristic for the electric vehicle routing problem with time windows and a realistic energy consumption model. Comput. Oper. Res. 2023, 157, 106261. [Google Scholar] [CrossRef]
- Fazeli, S.S.; Venkatachalam, S.; Smereka, J.M. Efficient algorithms for electric vehicles’ min-max routing problem. Sustain. Oper. Comput. 2024, 5, 15–28. [Google Scholar] [CrossRef]
- Keskin, M.; Çatay, B. Partial recharge strategies for the electric vehicle routing problem with time windows. Transp. Res. Part C Emerg. Technol. 2016, 65, 111–127. [Google Scholar] [CrossRef]
- Desaulniers, G.; Errico, F.; Irnich, S.; Schneider, M. Exact algorithms for electric vehicle-routing problems with time windows. Oper. Res. 2016, 64, 1388–1405. [Google Scholar] [CrossRef]
- Froger, A.; Jabali, O.; Mendoza, J.E.; Laporte, G. The electric vehicle routing problem with capacitated charging stations. Transp. Sci. 2022, 56, 460–482. [Google Scholar] [CrossRef]
- Wang, L.; Gao, S.; Wang, K.; Li, T.; Li, L.; Chen, Z. Time-Dependent Electric Vehicle Routing Problem with Time Windows and Path Flexibility. J. Adv. Transp. 2020, 2020, 3030197. [Google Scholar] [CrossRef]
- Pelletier, S.; Jabali, O.; Laporte, G. 50th anniversary invited article—goods distribution with electric vehicles: Review and research perspectives. Transp. Sci. 2016, 50, 3–22. [Google Scholar] [CrossRef]
- Xu, Y.; Yang, J.; Lai, K.K.; Xu, Y.; Zhang, M. Joint distribution route optimization of fresh supplies by electric vehicles under charging and battery-swapping modes. Adv. Mech. Eng. 2025, 17, 16878132251348353. [Google Scholar] [CrossRef]
- Spliet, R.; Dabia, S.; Van Woensel, T. The time window assignment vehicle routing problem with time-dependent travel times. Transp. Sci. 2018, 52, 261–276. [Google Scholar] [CrossRef]
- European Commission. The New EU Urban Mobility Framework, COM(2021) 811 Final, Brussels. 14 December 2021. Available online: https://transport.ec.europa.eu/system/files/2021-12/com_2021_811_the-new-eu-urban-mobility.pdf (accessed on 10 October 2025).
Disclaimer/Publisher’s Note: The statements, opinions and data contained in all publications are solely those of the individual author(s) and contributor(s) and not of MDPI and/or the editor(s). MDPI and/or the editor(s) disclaim responsibility for any injury to people or property resulting from any ideas, methods, instructions or products referred to in the content. |
© 2026 by the authors. Licensee MDPI, Basel, Switzerland. This article is an open access article distributed under the terms and conditions of the Creative Commons Attribution (CC BY) license.