Abstract
Temperate grasslands rank among the most diverse ecosystems in the world at small spatial scales. Maintaining species-rich grasslands is therefore essential for biodiversity conservation in Europe. Several EU countries have implemented Agri-Environmental Schemes (AES) designed to preserve grassland biodiversity and support farmers in developing their operations in a sustainable manner. While the prohibition of fertilization helps maintain oligotrophic, species-rich grasslands, it remains a stringent requirement that may discourage farmers from enrolling in these schemes. Because hay meadows are mesotrophic habitats, low levels of fertilization could potentially allow the maintenance of satisfactory biodiversity. We compared two AES measures implemented in Luxembourg: P4B (mowing after 15 June, no fertilization) and P3B (mowing after 15 June, fertilization permitted up to 50 kg N ha−1 year−1), the latter aiming to increase forage yield while maintaining acceptable biodiversity levels. Nineteen grassland sites were selected across Luxembourg. Within each site, adjacent delimited experimental plots were managed under P3B (350 kg ha−1 of mineral fertilizer, N14–P9–K24) and P4B (no fertilization). Floristic composition and biomass yield were recorded annually over four years. Fertilization had a negative effect on hay meadow biodiversity and conservation status, resulting in fewer typical species, a reduced dicot-to-grass ratio, and greater cover of nitrophilous species. Nevertheless, most fertilized plots still met the criteria for hay meadows of good to medium conservation status according to Luxembourg’s evaluation framework. Fertilization increased biomass yield by approximately 40% compared with unfertilized plots. We conclude that P4B remains the optimal management option for hay meadows and should be prioritized in areas hosting sensitive species and in the most biodiverse sites. However, P3B represents a pragmatic compromise, maintaining an acceptable level of biodiversity while being more attractive to farmers.
1. Introduction
Temperate grasslands are among the most diverse ecosystems worldwide at small spatial scales [1]. Maintaining species-rich grasslands is therefore essential for biodiversity conservation in Europe, as well as for sustaining associated ecosystem services such as soil carbon sequestration [2], pest regulation [3], and the mitigation of soil erosion and flooding [4]. The maintenance and management of grasslands are therefore key to the sustainability of livestock production systems at both farm and landscape scales [5]. Since World War II, biodiversity in European grasslands has undergone a marked decline due to the combined effects of conversion to arable land and intensification of the remaining grasslands [6]. These land-use changes were initially encouraged in early phases of the EU Common Agricultural Policy (CAP) until the 1980s [7]. However, following the 1992 CAP reform, several mechanisms were introduced to counteract the adverse environmental effects of intensive agriculture, including biodiversity loss, and to promote the sustainable development of agriculture across the EU [8]. Among these, Agri-Environmental Schemes (AES) promote environmentally friendly farming practices by providing voluntary payments to farmers, and all EU Member States are required to offer such schemes. Consequently, many Member States have used AES to promote extensive grassland management, though their ecological effectiveness has been variable (e.g., [9,10,11,12]).
Grassland biodiversity management, including AES targeting conservation, often involves restrictions or prohibitions on fertilization [5]. Fertilization has indeed been identified as a key driver of biodiversity loss in species-rich grasslands [13,14]. The most diverse grassland habitats, such as calcareous grasslands, depend on strictly oligotrophic conditions. However, other species-rich grasslands occur under mesotrophic conditions, including lowland hay meadows (habitat 6510 under the EU Habitats Directive 92/43/EEC) [15,16]. For such habitats, it is not self-evident that fertilization must be completely prohibited for successful conservation [17]. Several typical species of this habitat can tolerate relatively high nutrient levels, such as the dominant grass Arrhenatherum elatius [18] and the widespread forb Heracleum sphondylium [19]. Conversely, restricting fertilization may reduce forage yield and thus decrease farmers’ willingness to adopt these management practices [20,21]. The success of an AES depends not only on its ecological outcomes but also on its uptake by farmers, i.e., scheme acceptance [22,23]. This raises the question of whether low levels of fertilization could offer a viable compromise between maintaining forage production and preserving grassland biodiversity.
In Luxembourg, this rationale led to the development of two AES promoting extensive grassland management: “extensive grasslands—P4B” and “extensive grasslands—P3B”. Both schemes apply to permanent grasslands for a five-year period on a voluntary basis. Each includes a late-mowing requirement prohibiting mowing before 15 June. They differ only in fertilization; P4B prohibits all fertilization, whereas P3B allows up to 50 kg N ha−1 year−1 of either organic or mineral fertilizer, with no limits on other nutrients. Farmers adhering to P3B or P4B receive payments of EUR 275 ha−1 year−1 and EUR 325 ha−1 year−1, respectively, funded jointly by the EU and the Luxembourg state. Given this public expenditure, it is important to assess whether the management prescriptions are compatible with the conservation of species-rich hay meadows. Previous studies have examined the effects of fertilization on grassland biodiversity, see [24] for a review. These studies generally concluded the adverse effect of fertilization on grassland diversity. However, they covered a great variability in terms of study habitats, level of fertilization, and duration of the experiment. Therefore, there remains a need for a multi-site, multi-year study focusing specifically on lowland hay meadows (habitat 6510) to evaluate the impact of these AES prescriptions.
In this study, we compared the ecological outcomes of P3B and P4B with respect to biodiversity and conservation status of habitat 6510—lowland hay meadows. We hypothesized that (i) P4B would perform best in achieving conservation objectives, notably through the preservation of a higher species richness; (ii) P4B would result in substantially lower forage yield than P3B; and (iii) the low fertilization level permitted under P3B would not cause unacceptable biodiversity degradation, as lowland hay meadows are mesotrophic habitats that are likely to persist under a low level fertilization treatment. These hypotheses were tested over four years across 19 sites, also accounting for the forage yield achievable under each AES.
2. Materials and Methods
2.1. Study Site and Protocol
We selected 19 grassland sites across Luxembourg for the experiment (Figure 1). In 2019, a first preselection was performed based on administrative data for grasslands enrolled in the AES “extensive grasslands” and recorded as “N2000 biotopes” by the Luxembourg administration. Sixty sites were visited in early summer 2019 to identify those meeting the following criteria: (i) being a hay meadow with a good or medium conservation status according to the number of indicative species (i.e., at least eight characteristic species present, see Table A1); (ii) being free of threatened species or species highly sensitive to fertilization—especially orchids—that could be put at risk by the experiment; and (iii) being managed by a farmer willing to allow experimental work on his/her field.
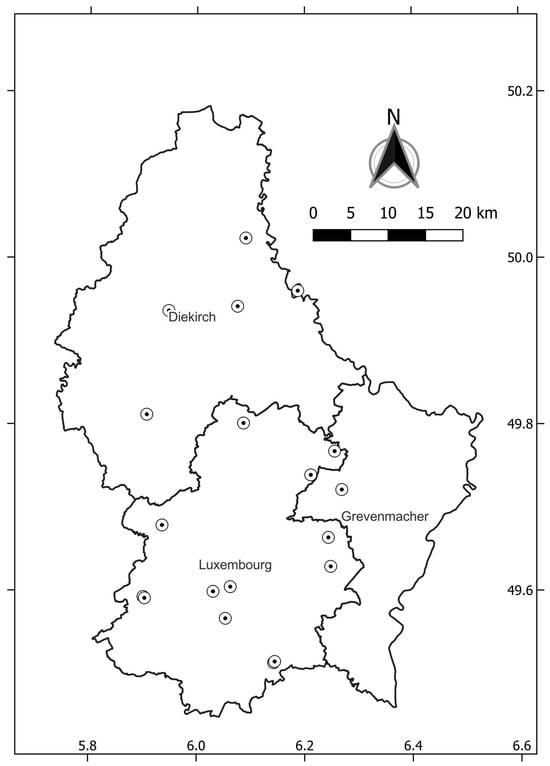
Figure 1.
Location of the 19 study sites (marked with a  ) across the three administrative cantons of Luxembourg. Coordinate grid referential: WGS84.
) across the three administrative cantons of Luxembourg. Coordinate grid referential: WGS84.
In each of the 19 experimental sites, two contiguous zones were delimited such that no visual or topographic features differentiated them (e.g., absence of rocky outcrops, wet patches; in sloping sites, zones were placed perpendicular to the slope). Each zone covered approximately 0.5–1 ha, depending on local homogeneity. Within each site, one zone was randomly assigned as the fertilized zone (ZF) and the other as the unfertilized control (Z0).
Each year from 2020 to 2023, fertilizer was applied in ZF between late March and mid-April, depending on weather conditions. We applied 350 kg ha−1 of a mineral fertilizer (N14–P9–K24, commercialized by De Verband, Colmar-Berg, Luxembourg), corresponding to 49 kg N ha−1—just below the 50 kg N ha−1 limit authorized under AES P3B. Phosphorus and potassium inputs were adjusted to ensure they were not limiting factors for forage growth; in other words, fertilization was maximized within the legal AES P3B prescription. In doing so, we intentionally simulated the “worst-case scenario” under the AES.
2.2. Floristic Survey
In early June each year from 2020 to 2023, floristic surveys were conducted in each of the 38 delimited zones. Three circular plots (1 m radius) were sampled per zone. In sloping grasslands, the plots were paired at equivalent slope levels in ZF and Z0. The coordinates of all plots were recorded using GPS to ensure consistent annual resampling.
At each plot, all vascular plant species were recorded, and their abundance was estimated using the Van der Maarel [25] cover–abundance scale. Nomenclature follows [26]. Van der Maarel classes were converted to percentage cover (class medians) prior to analysis. For each zone and year, the three plots were aggregated to obtain mean species cover values, producing a single vegetation dataset per zone per year.
From the vegetation data, we calculated several indicators of biodiversity and conservation status relevant to lowland hay meadows:
- Species richness.
- Mean Ellenberg N-index (N-Ellenberg), weighted by species cover (ranging from 1 = most oligotrophic preference to 9 = most eutrophic [27]).
- Indicators used by the Luxembourg administration for the six-yearly EU reporting on habitat 6510 (Table 1):
 Table 1. Criteria and thresholds used by the Luxembourg administration to determine the conservation status of the “6510—Lowland hay meadows” habitat. Species lists for criteria 1 and 3 are provided in Table A1.
- Number of species indicative of habitat 6510 (NB.Ind);
- Proportion of dicots (%dicots);
- Proportion of nitrophilous species (%Nitrophilous; species list in Appendix A).
2.3. Forage Production Survey
Between 10 and 15 June each year, forage yield was measured in each zone at the same locations as the floristic plots (3 plots per zone). Forage was harvested using a motor mower. For each mown area, we recorded the surface (Surfmown; 6–10 m2) and the fresh weight of the entire mown biomass (FWmown). A sub-sample (FWsample) was weighed, oven-dried at 55 °C until constant weight (DWsample), and used to compute dry matter content (DMC):
DMC = DWsample/FWsample.
Dry matter yield (DMY, t ha−1) for each plot was then calculated as
DMY = (FWmown × DMC/Surfmown) × 10.
DMY values from the three plots in the same zone were averaged to obtain a single annual DMY estimate for each zone.
2.4. Statistical Analyses
To analyze floristic variation among sites and zones, we performed a Principal Coordinate Analysis (PCoA) based on the Bray–Curtis dissimilarity index using the R package vegan [28]. All years and zones were included in the ordination. Indicative species of habitat 6510 and nitrophilous species were projected onto the PCoA diagram using their mean zone scores weighted by abundance.
We tested the impact of fertilization on six indicators (five floristic indicators and DMY) by comparing ZF and Z0. Count-based variables (species richness and NB.Ind) were analyzed using Poisson mixed-effects models with glmer from the lme4 package, version 1.1-33 [29]. Other indicators were analyzed using linear mixed-effects models (lme in the nlme package) [30]. Proportion variables were arcsine-transformed; DMY and N-Ellenberg were log-transformed to improve normality. Site and year were included as random effects, with year treated as a numeric variable representing time since experiment initiation (2020 = year 1). Model effects were assessed using ANOVA. Boxplots and the PCoA diagram were generated with ggplot2 [31]. All analyses were performed in R version 4.2.0 [32].
To identify species significantly favored or disfavored by fertilization, we conducted an INDVAL analysis [33]. The analysis was performed on the entire dataset, using Z0 versus ZF as the clustering factor.
3. Results
The PCoA indicated that a substantial proportion of floristic variation was driven by site effects, reflecting the intrinsic variability within lowland hay meadows (Figure 2). The upper-left quadrant corresponded to calcicolous variants, characterized by Bromopsis erecta, Salvia pratensis, and Carum calvi. The upper-right quadrant represented acidic dry variants, with species such as Pimpinella saxifraga and Luzula campestris. The lower-right quadrant included species typical of alluvial conditions, including Alchemilla xanthochlora and Silene flos-cuculi. Finally, the lower-left quadrant corresponded to nitrophilous communities, with higher proportions of nitrophilous species such as Phleum pratense, Alopecurus pratensis, and Bromus hordeaceus. Fertilized zones (ZF) tended to shift towards the nitrophilous variant relative to unfertilized zones (Z0). However, they did not form a distinct cluster in the ordination, indicating that they remained within the natural range of variation for the habitat.
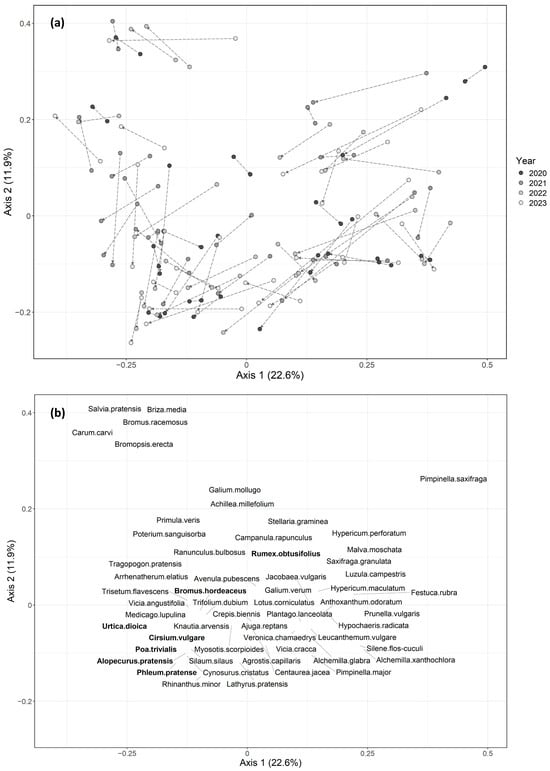
Figure 2.
PCoA diagram for axes 1 and 2. (a) Each point represents a surveyed zone within a site for a given year. Zones from the same site and year are connected by an arrow pointing from the unfertilized zone (P4B, Z0) to the fertilized zone (P3B, ZF). (b) Indicative and nitrophilous species (in bold) are labeled at their respective positions.
ANOVA results confirmed these patterns (Figure 3 and Figure 4). Fertilization significantly affected all indicators; it reduced species richness, the number of habitat-indicative species (NB.Ind), and the proportion of dicots (%Dicots), while increasing the Ellenberg N index (N-Ellenberg) and the cover of nitrophilous species (%Nitrophilous). The INDVAL analysis revealed that seven species were significantly associated with the absence of fertilization. Among these, Plantago lanceolata, Avenula pubescens, and Prunella vulgaris were most strongly affected by fertilization (Table 2). Only P. vulgaris was never observed in ZF, although it was also relatively rare in Z0 (occurring in 7 plots across 5 sites). Species significantly associated with ZF were four grass species, which were also present, albeit at lower abundance, in Z0. Three of them, i.e., Alopecurus pratensis, Poa trivialis, and Phleum prantense, are included in the species list for the computation of the nitrophilous species cover (Table A1). Several indicators also exhibited significant interannual variation, particularly species richness (p = 0.009) and %Dicots (p < 0.001). The magnitude of the year effect was comparable to, or even greater than, that of fertilization. Both species richness and %Dicots tended to decrease over the four-year period, even in the absence of fertilization. NB.Ind showed a similar but less pronounced decline (p = 0.044). No significant interaction between fertilization and year was detected for any indicator, indicating that the effect of fertilization was consistent across years.
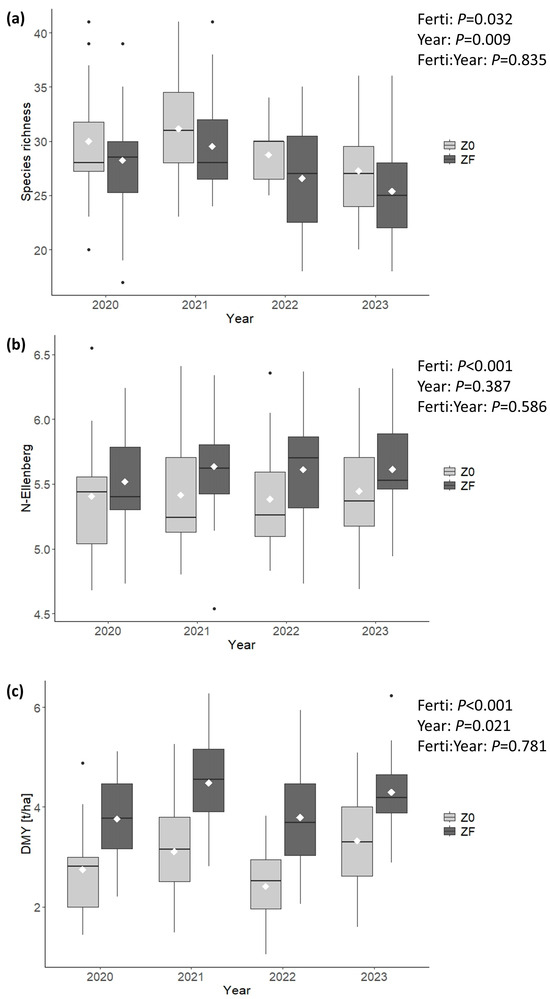
Figure 3.
Boxplots and ANOVA results for (a) species richness, (b) N-Ellenberg index, and (c) dry matter yield (DMY). The line and diamond within each box represent the median and mean, respectively. Lower and upper hinges correspond to the first and third quartiles. Whiskers extend to the largest/smallest value within 1.5 × IQR from the hinge; values beyond this range are plotted individually using dots. Z0 and ZF are Unfertilized and Fertilized zones, respectively.
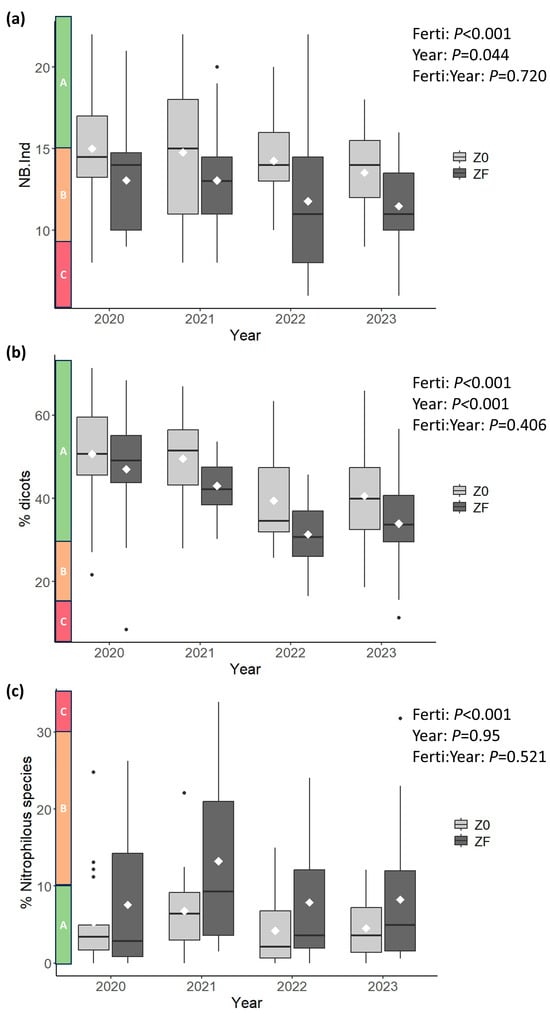
Figure 4.
Boxplots and ANOVA results for (a) number of habitat-indicative species (NB.Ind), (b) %Dicots, and (c) %Nitrophilous species. The line and diamond within each box represent the median and mean, respectively. Lower and upper hinges correspond to the first and third quartiles. Whiskers extend to the largest/smallest value within 1.5 × IQR from the hinge; values beyond this range are plotted individually using dots. Along the y-axis, shaded boxes indicate the range and thresholds used for conservation status evaluation (see Table 1). Z0 and ZF are Unfertilized and Fertilized zones, respectively.
Table 2.
Results of the INDVAL computation and analysis of the significance (p-value) of species association with unfertilized zones (Z0) of fertilized zones (ZF). Only species that are significantly associated with one type of zone or the other are displayed.
Regarding conservation status, most unfertilized plots (P4B) fell into the “A–Good” category, except for NB.Ind, which was evenly split between “A–Good” and “B–Medium.” In fertilized zones (ZF), “B–Medium” was dominant for NB.Ind. A similar pattern was observed for %Nitrophilous, although “A–Good” remained the most frequent category. For %Dicots, most fertilized plots retained an “A–Good” conservation status. Dry matter yield (DMY) increased significantly under fertilization (p < 0.001), with an approximate 40% increase relative to unfertilized plots. DMY also exhibited marked interannual variation.
4. Discussion
Our study confirms that fertilization had a significant effect on plant communities in lowland hay meadows. It generally favored nitrophilous grass species such as Poa trivialis and Alopecurus pratensis, which contributed most to the observed increase in %Nitrophilous cover. Fertilization also partially contributed to the increase in %Dicots; however, a large part of this effect was due to the increased cover of grasses that typically dominate habitat 6510 hay meadows, notably A. elatius and Trisetum flavescens. A. elatius, a typical dominator of 6510 hay meadows, is known to tolerate relatively high fertilization levels, remaining dominant even under 200 kg N ha−1 [34]. Both A. elatius and T. flavescens [35] were shown to increase under fertilization in an oligotrophic Nardus stricta grassland. These oligotrophic control conditions further accentuated the contrast, with an almost complete species turnover, which was not the case in our study. Conversely, some individual species were particularly unfavored by fertilization. Among them, P. lanceolata, F. rubra, and P. vulgaris were known to be oligotrophic species that perform better in the absence of fertilization [35,36,37,38]. This is, however, unclear for A. pubescens, which was found to be favored by fertilization in a previous study [37], while it was associated with unfertilized zones in our case.
Despite the persistence of some typical species, fertilization reduced overall species richness, including the number of habitat-indicative species (NB.Ind), consistent with previous studies [24]. This decline in diversity is attributable to increased competition for light, which primarily affects less competitive species [39], among which P. vulgaris [40]. Beyond alpha-diversity, we also observed a loss of beta-diversity. Fertilized zones (ZF) tended to cluster in the same region of the PCoA, indicating a homogenization of species composition relative to unfertilized zones (Z0). Such homogenization has been reported at multiple trophic levels under grassland intensification [41]. Our study confirms that fertilization-induced homogenization can occur even in initially homogenous lowland hay meadows, highlighting that vegetation homogenization may act at very fine composition scales. However, this trend was not universal; some sites appeared more resistant to fertilization effects. Site-specific responses have been observed previously [42]. In our study, sites dominated by Bromopsis erecta on alkaline marl soils were particularly resistant, whereas sites on shallow acidic soils dominated by Festuca rubra were most strongly impacted.
One worthy result in our study was the importance of the interannual variation in the biodiversity indicators, which affected the conservation degree in both fertilized and unfertilized zones. Climatic conditions during the experiment likely contributed to this variation. Normal rainfall for the growing period (March–May) is 204 mm, whereas in 2020 and 2022 it was 122 mm and 89 mm, respectively, and in 2021 and 2023 it was closer to normal (157 mm and 191 mm) [43]. Interannual variation in dry matter yield (DMY) mirrored these patterns. Alternating dry and wet conditions are known to favor nutrient-acquisitive grasses at the expense of species diversity [44], which may explain the observed decline in species richness and %Dicots even in unfertilized plots. This underscores the interaction between interannual weather fluctuations and biodiversity, as vegetation changes may affect the resilience of grassland productivity under shifting climatic conditions [45].
After four years, our results demonstrate a combined effect of fertilization and climatic variability on biodiversity and conservation status. On average, fertilization reduced the number of indicator species by approximately 2, %Dicots by 7%, and increased %Nitrophilous by about 4%. This magnitude was comparable to the interannual variation observed for these parameters, which therefore cumulates with the fertilization impact. However, the overall level of degradation remained limited. Most fertilized plots retained a conservation status of “A–Good” or “B–Medium.” It is important to note that NB.Ind was systematically underestimated in our study, as thresholds for conservation degrees were calibrated at the plot level, whereas our measurements were conducted at a 15-m2 scale. It is likely that additional indicator species occurred outside our plots, so that NB.ind would be higher at the whole-grassland scale than at the 15-m2 plot scale. This result is consistent with previous studies suggesting that low-level fertilization (~50 kg N ha−1) can provide a compromise between maintaining biodiversity and forage production [46,47]. It is worth noting that our experiment represents a “worst-case scenario” under AES P3B, including the maximum authorized or agronomically relevant NPK fertilization. In practice, discussions with farmers revealed that such levels were rarely applied. Fertilization practices prior to the experiment likely varied between sites. Among the 19 sites, 14 were under P4B at the start of the experiment, meaning no fertilization had occurred for at least the preceding years. Even among the remaining five P3B sites, several farmers reported that fertilization was not applied annually. These farmers did not enroll in P4B in order to retain flexibility under adverse forage production conditions. Some used organic fertilizers, which are known to induce less pronounced changes in grassland vegetation and diversity due to slower nutrient release [48]. The use of organic fertilizer may also be economically advantageous, given the high price of mineral fertilizers. During the experiment, fertilizer costs under our experimental conditions ranged from approximately EUR 180/ha in 2020 and 2021 to around EUR 350/ha in 2022 and 2023. Meanwhile, the expected additional gain from higher forage yield was estimated at EUR 150–250/ha on average, depending on the year, from which the EUR 50/ha difference in AES subsidies should be deducted. It is therefore evident that applying the maximum allowed fertilization under P3B is rarely economically viable, which may explain why few farmers implement this practice in reality, as opposed to our experimental application.
5. Conclusions
Our study demonstrated that the complete absence of fertilization maximizes biodiversity and should be promoted in the most sensitive and species-rich sites. We specifically highlight sites harboring sensitive species such as A. pubescens, Ranunculus bulbosus, or P. vulgaris. Caution should also be exercised for sites containing species indicative of oligotrophic conditions, as species typically found in calcareous or Nardus stricta grasslands. These oligotrophic habitats are known to be much more sensitive to fertilization, even at a low level [35,49]. Among them, orchids are known to be sensitive to the nutrient status of the site where they grow [50]. This is the case for Anacamptis morio and Dactylorhiza majalis, which are likely to be found in the most oligotrophic hay meadows [51,52]. We deliberately excluded sites sheltering such species from our experiment, and our conclusions should not be extrapolated to these conditions. Because total exclusion of fertilization reduces yield, offering both management options within the same AES is relevant, providing farmers with a less radical choice within voluntary schemes. This permits farmers to enter at their own speed into more sustainable grassland management. The level of financial incentives is crucial in guiding farmers’ choices, although decision-making is complex [21]. By quantifying these trade-offs, our study can inform policy design and support optimal management decisions. We recommend that incentives to eliminate fertilization be sufficiently strong, particularly in sensitive areas such as Natura 2000 sites.
Author Contributions
Conceptualization, J.P. and A.F.; field data collection, A.F.; software, J.P.; formal analysis, J.P.; writing—original draft preparation, J.P.; writing—review and editing, A.F. All authors have read and agreed to the published version of the manuscript.
Funding
This research was funded by the Ministry of Agriculture, Food and Viticulture of the Grand Duchy of Luxembourg, research agreement of 6 August 2019. Natagriwal and Fourrages Mieux are non-profit associations funded by the Walloon government.
Institutional Review Board Statement
Not applicable.
Informed Consent Statement
Not applicable.
Data Availability Statement
The raw data supporting the conclusions of this article will be made available by the authors on request.
Acknowledgments
We are grateful to Pacal Pelt, Anne Zangerle, and Martine Huberty for their administrative and technical support in the project. We also thank Audrey Feyder for the help in contacting farmers. We thank all three anonymous reviewers for their constructive comments, which greatly helped to improve the manuscript.
Conflicts of Interest
Julien Piqueray is employed by the non-profit association Natagriwal. Arnaud Farinelle is employed by the non-profit association Fourrages Mieux. The authors declare no conflict of interest.
Appendix A
Table A1.
List of species used by the Luxembourg administration to determine the conservation status of the “6510—Lowland hay meadows” habitat. See Table 1 for criteria and thresholds.
Table A1.
List of species used by the Luxembourg administration to determine the conservation status of the “6510—Lowland hay meadows” habitat. See Table 1 for criteria and thresholds.
| Species Indicative of Habitat 6510 | |||
|---|---|---|---|
| Achillea millefolium | Crepis biennis | Leontodon hispidus | Rhinanthus alectorolophus |
| Agrostis capillaris | Cynosurus cristatus | Leucanthemum vulgare | Rhinanthus minor |
| Ajuga reptans | Dichoropetalum carvifolia | Lotus corniculatus | Salvia pratensis |
| Alchemilla glabra | Euphrasia sp. | Luzula campestris | Sanguisorba officinalis |
| Alchemilla xanthochlora | Festuca ovina agg. | Lysimachia nummularia | Saxifraga granulata |
| Anthoxanthum odoratum | Festuca rubra | Malva moschata | Silaum silaus |
| Arrhenatherum elatius | Galium mollugo agg. | Medicago lupulina | Silene flos-cuculi |
| Avenula pubescens | Galium verum | Myosotis scorpioides | Stellaria graminea |
| Briza media | Geranium pratense | Pimpinella major | Symphytum officinale |
| Bromopsis erecta | Hypericum maculatum | Pimpinella saxifraga | Thymus pulegioides |
| Bromus racemosus | Hypericum perforatum | Plantago lanceolata | Tragopogon pratensis |
| Campanula glomerata | Hypochoeris radicata | Polygala vulgaris agg. | Trifolium dubium |
| Campanula rapunculus | Jacobaea vulgaris | Poterium sanguisorba | Trisetum flavescens |
| Campanula rotundifolia | Knautia arvensis | Primula veris | Veronica chamaedrys |
| Carum carvi | Lathyrus linifolius | Prunella vulgaris | Vicia angustifolia |
| Centaurea jacea coll. | Lathyrus pratensis | Ranunculus bulbosus | Vicia cracca |
| Colchicum autumnale | |||
| Nitrophilous Species | |||
| Alopecurus pratensis | Cirsium vulgare | Poa trivialis | Urtica dioica |
| Bromus hordeaceus | Phleum pratense | Rumex obtusifolius | |
References
- Wilson, J.B.; Peet, R.K.; Dengler, J.; Pärtel, M. Plant Species Richness: The World Records. J. Veg. Sci. 2012, 23, 796–802. [Google Scholar] [CrossRef]
- Bai, Y.; Cotrufo, M.F. Grassland Soil Carbon Sequestration: Current Understanding, Challenges, and Solutions. Science 2022, 377, 603–608. [Google Scholar] [CrossRef]
- Perrot, T.; Rusch, A.; Gaba, S.; Bretagnolle, V. Both Long-Term Grasslands and Crop Diversity Are Needed to Limit Pest and Weed Infestations in Agricultural Landscapes. Proc. Natl. Acad. Sci. USA 2023, 120, e2300861120. [Google Scholar] [CrossRef]
- Milazzo, F.; Francksen, R.M.; Zavattaro, L.; Abdalla, M.; Hejduk, S.; Enri, S.R.; Pittarello, M.; Price, P.N.; Schils, R.L.M.; Smith, P.; et al. The Role of Grassland for Erosion and Flood Mitigation in Europe: A Meta-Analysis. Agric. Ecosyst. Environ. 2023, 348, 108443. [Google Scholar] [CrossRef]
- Gibon, A. Managing Grassland for Production, the Environment and the Landscape. Challenges at the Farm and the Landscape Level. Livest. Prod. Sci. 2005, 96, 11–31. [Google Scholar] [CrossRef]
- Schils, R.L.M.; Bufe, C.; Rhymer, C.M.; Francksen, R.M.; Klaus, V.H.; Abdalla, M.; Milazzo, F.; Lellei-Kovács, E.; ten Berge, H.; Bertora, C.; et al. Permanent Grasslands in Europe: Land Use Change and Intensification Decrease Their Multifunctionality. Agric. Ecosyst. Environ. 2022, 330, 107891. [Google Scholar] [CrossRef]
- Souchère, V.; King, C.; Dubreuil, N.; Lecomte-Morel, V.; Le Bissonnais, Y.; Chalat, M. Grassland and Crop Trends: Role of the European Union Common Agricultural Policy and Consequences for Runoff and Soil Erosion. Environ. Sci. Policy 2003, 6, 7–16. [Google Scholar] [CrossRef]
- Pe’er, G.; Bonn, A.; Bruelheide, H.; Dieker, P.; Eisenhauer, N.; Feindt, P.H.; Hagedorn, G.; Hansjürgens, B.; Herzon, I.; Lomba, Â.; et al. Action Needed for the EU Common Agricultural Policy to Address Sustainability Challenges. People Nat. 2020, 2, 305–316. [Google Scholar] [CrossRef]
- Cordier, E.; Rouxhet, S.; Mahy, G.; Piqueray, J. The Impact of Activities within an Agri-Environment Scheme on the Habitat Condition of Hay Meadows and Its Alignment with Natura 2000 Objectives. J. Nat. Conserv. 2025, 84, 126834. [Google Scholar] [CrossRef]
- Kaligarič, M.; Čuš, J.; Škornik, S.; Ivajnšič, D. The Failure of Agri-Environment Measures to Promote and Conserve Grassland Biodiversity in Slovenia. Land Use Policy 2019, 80, 127–134. [Google Scholar] [CrossRef]
- Panassiti, B.; Wolfrum, S.; Birnbeck, S.; Burmeister, J.; Freibauer, A.; Morinière, J.; Walter, R. Insects Benefit from Agri-Environmental Schemes Aiming at Grassland Extensification. Agric. Ecosyst. Environ. 2023, 356, 108613. [Google Scholar] [CrossRef]
- Piqueray, J.; Rouxhet, S.; Hendrickx, S.; Mahy, G. Changes in the Vegetation of Hay Meadows under an Agri-Environment Scheme in South Belgium. Conserv. Evid. 2016, 13, 47–50. [Google Scholar]
- Gaujour, E.; Amiaud, B.; Mignolet, C.; Plantureux, S. Factors and Processes Affecting Plant Biodiversity in Permanent Grasslands. A Review. Agron. Sustain. Dev. 2012, 32, 133–160. [Google Scholar] [CrossRef]
- Li, W.; Gan, X.; Jiang, Y.; Cao, F.; Lü, X.-T.; Ceulemans, T.; Zhao, C. Nitrogen Effects on Grassland Biomass Production and Biodiversity Are Stronger than Those of Phosphorus. Environ. Pollut. 2022, 309, 119720. [Google Scholar] [CrossRef]
- Critchley, C.N.R.; Chambers, B.J.; Fowbert, J.A.; Bhogal, A.; Rose, S.C.; Sanderson, R.A. Plant Species Richness, Functional Type and Soil Properties of Grasslands and Allied Vegetation in English Environmentally Sensitive Areas. Grass Forage Sci. 2002, 57, 82–92. [Google Scholar] [CrossRef]
- Dellicour, M.; Goret, T.; Piqueray, J.; Fayolle, A.; Bindelle, J.; Mahy, G. Success of Passive and Active Restoration of Lowland Hay Meadows with Regard to Current and Historical References. Front. Ecol. Evol. 2023, 11, 1136206. [Google Scholar] [CrossRef]
- Kirkham, F.W.; Tallowin, J.R.B.; Dunn, R.M.; Bhogal, A.; Chambers, B.J.; Bardgett, R.D. Ecologically Sustainable Fertility Management for the Maintenance of Species-rich Hay Meadows: A 12-year Fertilizer and Lime Experiment. J. Appl. Ecol. 2014, 51, 152–161. [Google Scholar] [CrossRef]
- Fiala, K.; Tůma, I.; Holub, P. Effect of Nitrogen Addition and Drought on Above-Ground Biomass of Expanding Tall Grasses Calamagrostis Epigejos and Arrhenatherum Elatius. Biologia 2011, 66, 275–281. [Google Scholar] [CrossRef]
- Sheppard, A.W. Heracleum Sphondylium L. J. Ecol. 1991, 79, 235. [Google Scholar] [CrossRef]
- Van Vooren, L.; Reubens, B.; Broekx, S.; Reheul, D.; Verheyen, K. Assessing the Impact of Grassland Management Extensification in Temperate Areas on Multiple Ecosystem Services and Biodiversity. Agric. Ecosyst. Environ. 2018, 267, 201–212. [Google Scholar] [CrossRef]
- Wittstock, F.; Paulus, A.; Beckmann, M.; Hagemann, N.; Baaken, M.C. Understanding Farmers’ Decision-Making on Agri-Environmental Schemes: A Case Study from Saxony, Germany. Land Use Policy 2022, 122, 106371. [Google Scholar] [CrossRef]
- Brown, C.; Kovács, E.; Herzon, I.; Villamayor-Tomas, S.; Albizua, A.; Galanaki, A.; Grammatikopoulou, I.; McCracken, D.; Olsson, J.A.; Zinngrebe, Y. Simplistic Understandings of Farmer Motivations Could Undermine the Environmental Potential of the Common Agricultural Policy. Land Use Policy 2021, 101, 105136. [Google Scholar] [CrossRef]
- Paulus, A.; Hagemann, N.; Baaken, M.C.; Roilo, S.; Alarcón-Segura, V.; Cord, A.F.; Beckmann, M. Landscape Context and Farm Characteristics Are Key to Farmers’ Adoption of Agri-Environmental Schemes. Land Use Policy 2022, 121, 106320. [Google Scholar] [CrossRef]
- Francksen, R.M.; Turnbull, S.; Rhymer, C.M.; Hiron, M.; Bufe, C.; Klaus, V.H.; Newell-Price, P.; Stewart, G.; Whittingham, M.J. The Effects of Nitrogen Fertilisation on Plant Species Richness in European Permanent Grasslands: A Systematic Review and Meta-Analysis. Agronomy 2022, 12, 2928. [Google Scholar] [CrossRef]
- van der Maarel, E. Transformation of Cover-Abundance Values in Phytosociology and Its Effects on Community Similarity. Vegetatio 1979, 39, 97–114. [Google Scholar] [CrossRef]
- Verloove, F.; Van Rossum, F. Nouvelle Flore de La Belgique, Du G.-D. de Luxembourg, Du Nord de La France et Des Régions Voisines; Edition du Jardin Botanique de Meise: Meise, Belgium, 2024. [Google Scholar]
- Ellenberg, H.; Weber, H.E.; Düll, R.; Wirth, V.; Werner, W.; Paulißen, D. Zeigerwerte von Pflanzen in Mitteleuropa. Scr. Geobot. 1992, 18, 3–258. [Google Scholar]
- Oksanen, A.J.; Blanchet, F.G.; Friendly, M.; Kindt, R.; Legendre, P.; Mcglinn, D.; Minchin, P.R.; Hara, R.B.O.; Simpson, G.L.; Solymos, P.; et al. The R Package ‘Vegan ’(Version 2.4-0). 2016. Available online: https://CRAN.R-project.org/package=vegan (accessed on 17 November 2025).
- Bates, D.; Mächler, M.; Bolker, B.; Walker, S. Fitting Linear Mixed-Effects Models Using Lme4. J. Stat. Soft. 2015, 67, 1–48. [Google Scholar] [CrossRef]
- Pinheiro, J.; Bates, D.; DebRoy, S.; Sarkar, D. NLME: Linear and Nonlinear Mixed Effects Models. R Package Version 3.1-122. 2013. Available online: http://CRAN.R-project.org/package=nlme (accessed on 17 November 2025).
- Wickham, H. Ggplot2: Elegant Graphics for Data Analysis; Use R! Springer International Publishing: Cham, Switzerland, 2016; ISBN 978-3-319-24275-0. [Google Scholar]
- R Core Team. R: A Language and Environment for Statistical Computing; R Foundation for Statistical Computing: Vienna, Austria, 2022. [Google Scholar]
- Dufrêne, M.; Legendre, P. Species Assemblages and Indicator Species: The Need for a Flexible Asymetrical Approach. Ecol. Monogr. 1997, 67, 345–366. [Google Scholar] [CrossRef]
- Dindová, A.; Hakl, J.; Hrevušová, Z.; Nerušil, P. Relationships between Long-Term Fertilization Management and Forage Nutritive Value in Grasslands. Agric. Ecosyst. Environ. 2019, 279, 139–148. [Google Scholar] [CrossRef]
- Hejcman, M.; Klaudisová, M.; Schellberg, J.; Honsová, D. The Rengen Grassland Experiment: Plant Species Composition after 64 Years of Fertilizer Application. Agric. Ecosyst. Environ. 2007, 122, 259–266. [Google Scholar] [CrossRef]
- Titěra, J.; Pavlů, V.V.; Pavlů, L.; Hejcman, M.; Gaisler, J.; Schellberg, J. Response of Grassland Vegetation Composition to Different Fertilizer Treatments Recorded over Ten Years Following 64 Years of Fertilizer Applications in the Rengen Grassland Experiment. Appl. Veg. Sci. 2020, 23, 417–427. [Google Scholar] [CrossRef]
- Speidel, B. The Changes in Botanical Composition of Permanent Meadows under Long-Term Fertilizing. Bayer. Landwirtsch. Jahrb. 1967, 43, 214–222. [Google Scholar]
- Lillak, R. (Ed.) Integrating Efficient Grassland Farming and Biodiversity: Proceedings of the 13th International Occasional Symposium of the European Grassland Federation, Tartu, Estonia, 29–31 August 2005; Grassland science in Europe; European Grassland Federation: Tartu, Estonia, 2005; ISBN 978-9985-9611-3-1. [Google Scholar]
- Hautier, Y.; Niklaus, P.A.; Hector, A. Competition for Light Causes Plant Biodiversity Loss After Eutrophication. Science 2009, 324, 636–638. [Google Scholar] [CrossRef] [PubMed]
- Lepš, J. Nutrient Status, Disturbance and Competition: An Experimental Test of Relationships in a Wet Meadow. J. Veg. Sci. 1999, 10, 219–230. [Google Scholar] [CrossRef]
- Gossner, M.M.; Lewinsohn, T.M.; Kahl, T.; Grassein, F.; Boch, S.; Prati, D.; Birkhofer, K.; Renner, S.C.; Sikorski, J.; Wubet, T.; et al. Land-Use Intensification Causes Multitrophic Homogenization of Grassland Communities. Nature 2016, 540, 266–269. [Google Scholar] [CrossRef] [PubMed]
- Liancourt, P.; Viard-Crétat, F.; Michalet, R. Contrasting Community Responses to Fertilization and the Role of the Competitive Ability of Dominant Species. J. Veg. Sci. 2009, 20, 138–147. [Google Scholar] [CrossRef]
- MeteoLux. MeteoLux « Bilans Climatologiques »; MeteoLux: Luxembourg, 2025. [Google Scholar]
- Stampfli, A.; Bloor, J.M.G.; Fischer, M.; Zeiter, M. High Land-Use Intensity Exacerbates Shifts in Grassland Vegetation Composition after Severe Experimental Drought. Glob. Change Biol. 2018, 24, 2021–2034. [Google Scholar] [CrossRef]
- Van Oijen, M.; Bellocchi, G.; Höglind, M. Effects of Climate Change on Grassland Biodiversity and Productivity: The Need for a Diversity of Models. Agronomy 2018, 8, 14. [Google Scholar] [CrossRef]
- Boch, S.; Kurtogullari, Y.; Allan, E.; Lessard-Therrien, M.; Rieder, N.S.; Fischer, M.; Martínez De León, G.; Arlettaz, R.; Humbert, J.-Y. Effects of Fertilization and Irrigation on Vascular Plant Species Richness, Functional Composition and Yield in Mountain Grasslands. J. Environ. Manag. 2021, 279, 111629. [Google Scholar] [CrossRef] [PubMed]
- Ranta, M.; Rotar, I.; Vidican, R.; Mălinaș, A.; Ranta, O.; Lefter, N. Influence of the UAN Fertilizer Application on Quantitative and Qualitative Changes in Semi-Natural Grassland in Western Carpathians. Agronomy 2021, 11, 267. [Google Scholar] [CrossRef]
- Gaga, I.; Pacurar, F.; Vaida, I.; Plesa, A.; Rotar, I. Responses of Diversity and Productivity to Organo-Mineral Fertilizer Inputs in a High-Natural-Value Grassland, Transylvanian Plain, Romania. Plants 2022, 11, 1975. [Google Scholar] [CrossRef]
- Jacquemyn, H.; Brys, R.; Hermy, M. Short-Term Effects of Different Management Regimes on the Response of Calcareous Grassland Vegetation to Increased Nitrogen. Biol. Conserv. 2003, 111, 137–147. [Google Scholar] [CrossRef]
- Dijk, E.; Willems, J.H.; Van Andel, J. Nutrient Responses as a Key Factor to the Ecology of Orchid Species. Acta Bot. Neerl. 1997, 46, 339–363. [Google Scholar] [CrossRef]
- Silvertown, J.; Wells, D.A.; Gillman, M.; Dodd, M.E.; Robertson, H.; Lakhani, K.H. Short-Term Effects and Long-Term after-Effects of Fertilizer Application on the Flowering Population of Green-Winged Orchid Orchis Morio. Biol. Conserv. 1994, 69, 191–197. [Google Scholar] [CrossRef]
- Dijk, E.; Olff, H. Effects of Nitrogen, Phosphorus and Potassium Fertilization on Field Performance of Dactylorhiza Majalis. Acta Bot. Neerl. 1994, 43, 383–392. [Google Scholar] [CrossRef]
Disclaimer/Publisher’s Note: The statements, opinions and data contained in all publications are solely those of the individual author(s) and contributor(s) and not of MDPI and/or the editor(s). MDPI and/or the editor(s) disclaim responsibility for any injury to people or property resulting from any ideas, methods, instructions or products referred to in the content. |
© 2025 by the authors. Licensee MDPI, Basel, Switzerland. This article is an open access article distributed under the terms and conditions of the Creative Commons Attribution (CC BY) license.