


Abstract
To achieve a scientific evaluation of land ecological resilience in mining areas and promote the green transformation and sustainable development of the mining industry, this study is based on the core concept of Nature-based Solutions (NbS), coupling the “Driving force–Pressure–State–Impact–Response” (DPSIR) framework, and constructs an evaluation system for mine land ecological resilience (MLER) focusing on sustainability. This system covers multiple aspects, including natural ecology, socio-economics, and policy management, comprising 21 secondary indicators that comprehensively respond to NbS’ fundamental principles of “nature-guided, multi-party collaboration, and long-term adaptation.” In terms of evaluation methodology, this study proposes a combined weighting model that integrates AHP-CRITIC game theory with Vague sets. First, subjective expert experience and objective data variance are balanced through combined weighting. Based on game theory, the optimal combination coefficients were determined (α1 = 0.624, α2 = 0.376) to reconcile subjective and objective preferences. Subsequently, the three-dimensional interval structure of Vague sets is utilized to effectively accommodate fuzzy information and data gaps. By characterizing the restoration process through interval membership, the model enhances the representational capacity of the evaluation results regarding complex ecological information. Empirical research conducted in the mining areas of Gan Xian, Xing Guo, Yu Du, and Xun Wu in Jiangxi Province effectively identified differences in resilience levels: the resilience of the Xing Guo mining area was classified as I, Gan Xian and Yu Du as II, and Xun Wu as IV. These results are fundamentally consistent with the AHP-Fuzzy Comprehensive Evaluation method, verifying the robustness and reliability of the model. The NbS-guided evaluation system and model constructed in this study provide scientific tools for identifying differences in the sustainability of MLER and key constraints, promoting the transformation of restoration models from “engineering-driven” to “nature-driven, long-term adaptation” in the context of NbS in China.
1. Introduction
Mineral resources serve as a critical material foundation for national economic development, and large-scale exploitation has strongly supported China’s process of industrialization and modernization [1,2,3,4]. However, with the ongoing high-intensity extraction of mineral resources, the resulting geological disasters, land degradation, groundwater system imbalance, and environmental pollution in soil, water, and air have become increasingly severe, posing significant threats to regional ecological stability and sustainable development [5,6,7,8]. In this context, advancing MLER has become an urgent task in promoting the green transformation of the mining industry [9,10]. The MLER refers to the comprehensive ability to restore ecological functions and service values on lands damaged by mining activities. Scientifically evaluating this capacity not only helps identify weak links in the restoration process and optimize the design and implementation of restoration projects but also serves as a key support for enhancing land spatial ecological resilience and establishing a “safe, harmonious, and high-quality” land spatial pattern. Therefore, constructing a scientifically sound evaluation model for MLER holds significant theoretical and practical importance for advancing ecological civilization construction and achieving high-quality regional development.
Currently, numerous scholars have explored diverse approaches to the evaluation of MLER, establishing various distinct assessment methods. Based on their theoretical foundations and technical pathways, the main research methods can be primarily categorized into three classes: fuzzy uncertainty quantification, spatial technology integration, and multi-attribute decision-making and system analysis. Methods such as intuitionistic fuzzy sets theory and the VIKOR decision-making method [11], triangular fuzzy number-based hierarchical analysis [12], and the Z-MARCOS-based compromise solution combined with Z-number theory and alternative and sequential measurement-based reliable evaluation models [13] fall under the fuzzy uncertainty quantification category, whose essence lies in transforming qualitative judgments into quantitative analysis through fuzzy mathematical theory. However, these methods generally exhibit a strong reliance on expert subjective experience, and some models feature complex structures, posing operability challenges in practical application. Methods like GIS and AHP methods [14] and the mobile window-based remote sensing ecological index (MW-RSEI) performance evaluation model [15] belong to the spatial technology integration category; leveraging Geographic Information Systems (GIS) and Remote Sensing (RS) technology [16], they excel at integrating and analyzing multi-source spatiotemporal data to achieve the spatial visualization of assessment results. Yet, this class of methods is highly dependent on data quality and integrity, and in mining areas with a weak data foundation, the reliability of their evaluation results may be compromised. This third category includes Multi-Attribute Decision-Making and System Analysis methods, such as the combined evaluation approach integrating social network analysis and gray relational analysis, landscape ecological network models constructed with the MCR model [17], methods utilizing gray DEMATEL and ANP technical calculations [18] and principal component analysis [19], which focus on dissecting the complex relationships and systemic structure among evaluation indicators. Nevertheless, some methods are insufficient in characterizing the dynamic evolutionary process of the ecosystem, or their core principles focus on specific dimensions, resulting in incomplete coverage of the multidimensional connotation of resilience.
Compared to alternative evaluation methods, Vague sets theory offers distinct advantages in expressing fuzziness and uncertainty through its “support-opposition-unknown” three-dimensional interval structure [20]. This framework comprehensively incorporates ambiguous and missing information during the evaluation process, effectively mitigating subjective bias and ensuring the robustness of results even under conditions of data incompleteness [21]. Given that MLER is not a single fixed value, Vague sets utilize interval-based membership degrees to characterize the transitional states between different restoration levels. This approach transcends the limitations of traditional discrete classification methods, making the evaluation results more consistent with the continuous developmental processes of ecosystems. Furthermore, the theory features a clear framework and relatively concise computation, balancing theoretical depth with practical operability, and has been successfully applied in numerous engineering contexts [22]. In light of this, this study introduces Vague sets into MLER and constructs a corresponding model. The model first employs the AHP and CRITIC methods to determine subjective weighting and objective weighting, respectively, subsequently utilizing game theory to establish combined weighting. Following this, Vague sets are used to calculate the membership degrees of each indicator across various levels, leading to a scientific determination of the final grade. This model not only provides a precise quantification of the complex states of mine land ecological restoration but also identifies key bottlenecks, offering a scientific basis for developing differentiated improvement strategies and promoting the stability of ecological functions and sustainable resource utilization in mining regions.
2. Basic Theories
2.1. Vague Sets Theory
The Vague sets was proposed by Gau and Buehrer in 1993 as a mathematical tool for dealing with fuzzy and uncertain information [23]. It is an extension of fuzzy sets theory. Vague sets is defined on a domain X, where each element x ∈ X has both a positive membership function t(x) and a negative membership function f(x), representing the minimum degree to which t(x) belongs to the set and the maximum degree to which x does not belong to the set, respectively. These two functions satisfy the following condition:
where t(x) represents the minimum membership degree of x in the set, f(x) represents the maximum degree to which x does not belong to the set, and 1 − t(x) − f(x) represents the uncertainty of x in relation to the set.
Vague sets are an effective mathematical tool for processing uncertain information. By introducing the concepts of true membership and false membership, they can more precisely characterize fuzzy information, offering both practicality and flexibility. In the context of MLER evaluation, there are often numerous fuzzy and uncertain qualitative indicators. The dual membership structure of Vague sets allows for a detailed description of such fuzzy characteristics and effectively avoids the absolutist tendencies in expert judgment, thereby providing a more scientific data foundation for the evaluation process. Based on the mature theoretical support of this method and its empirical effectiveness in multiple fields [24,25,26], the use of Vague sets for MLER evaluation is both reasonably applicable and reliable.
2.2. Theoretical Framework for MLER
2.2.1. NbS Theory
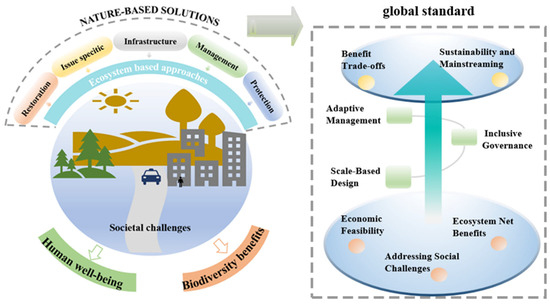
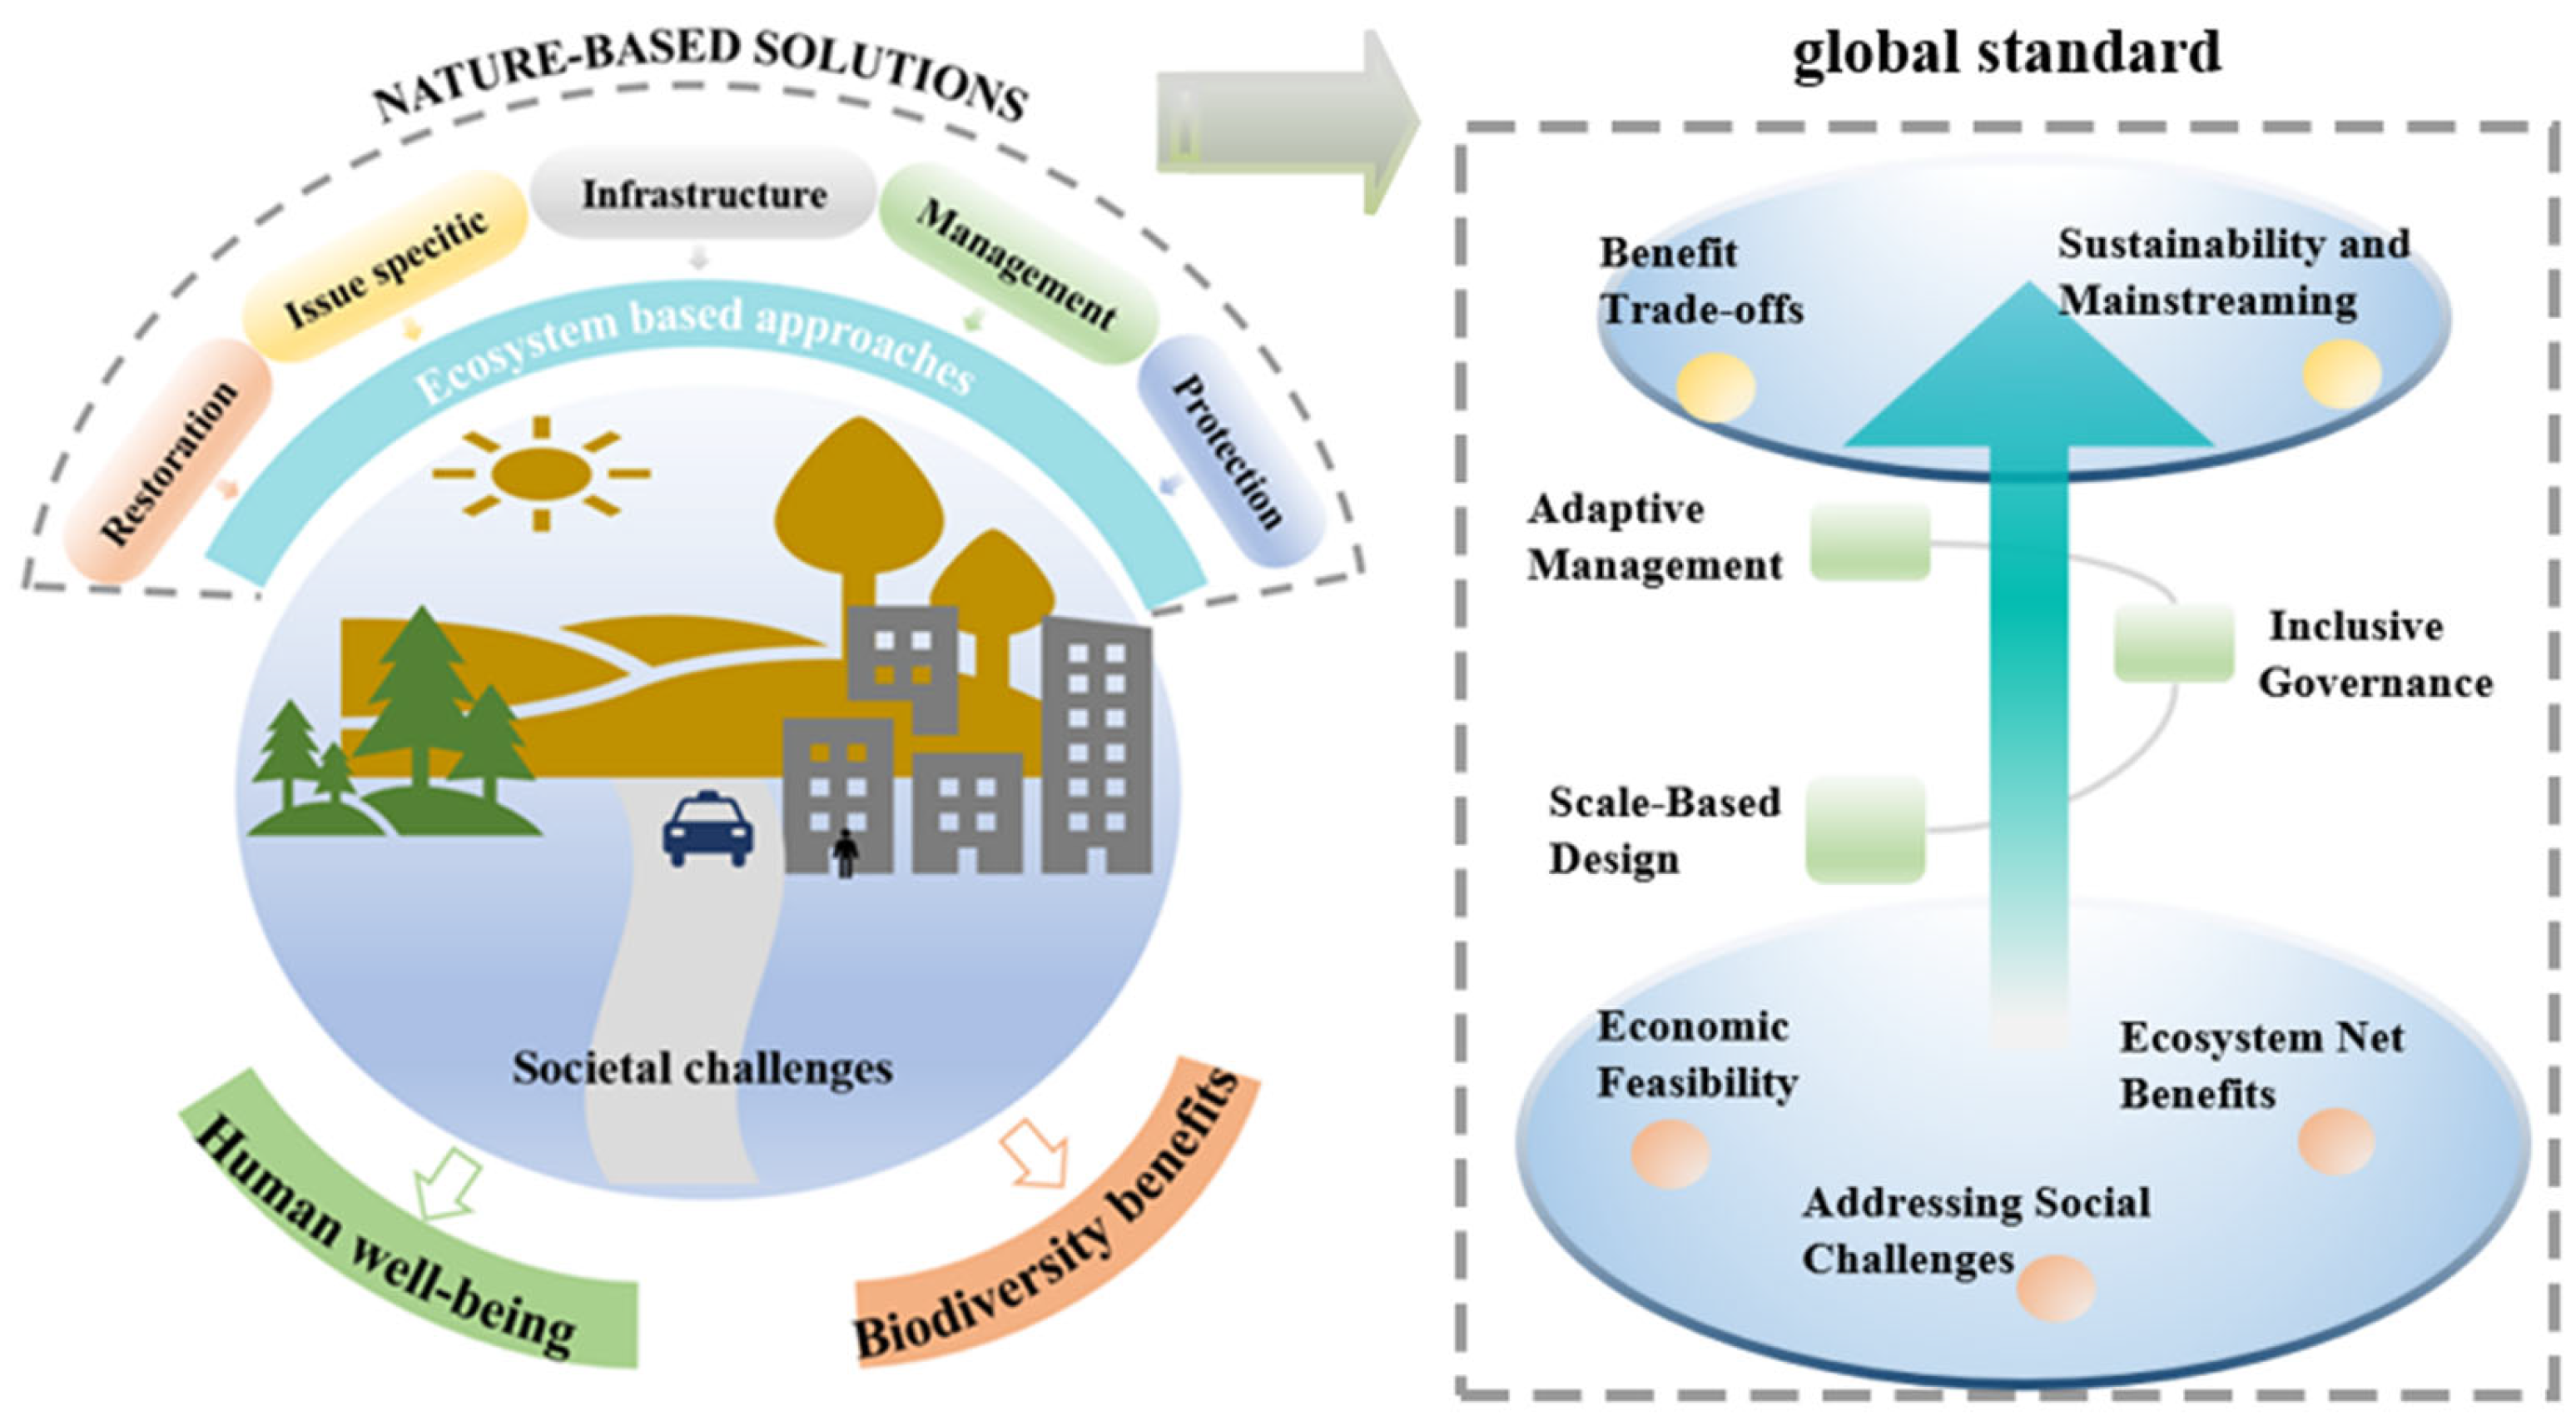
NbS refer to actions that protect, sustainably use, and restore natural or modified ecosystems in order to effectively and adaptively address the challenges faced by society today, while also providing benefits for human well-being and biodiversity, as shown in Figure 1. With the release of the global standards for NbS, its eight key principles provide a standardized framework for related practices [27,28,29]. Among these, the indicator system serves as a core component, integrating multidisciplinary knowledge and the professional experiences of stakeholders, offering a systematic evaluation tool for mining land ecological restoration capacity.
Figure 1.
NbS.
2.2.2. MLER
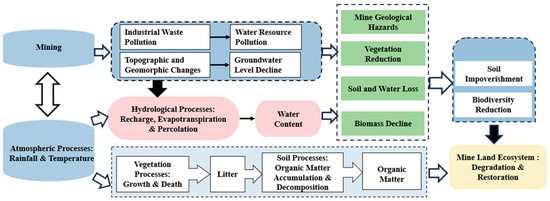
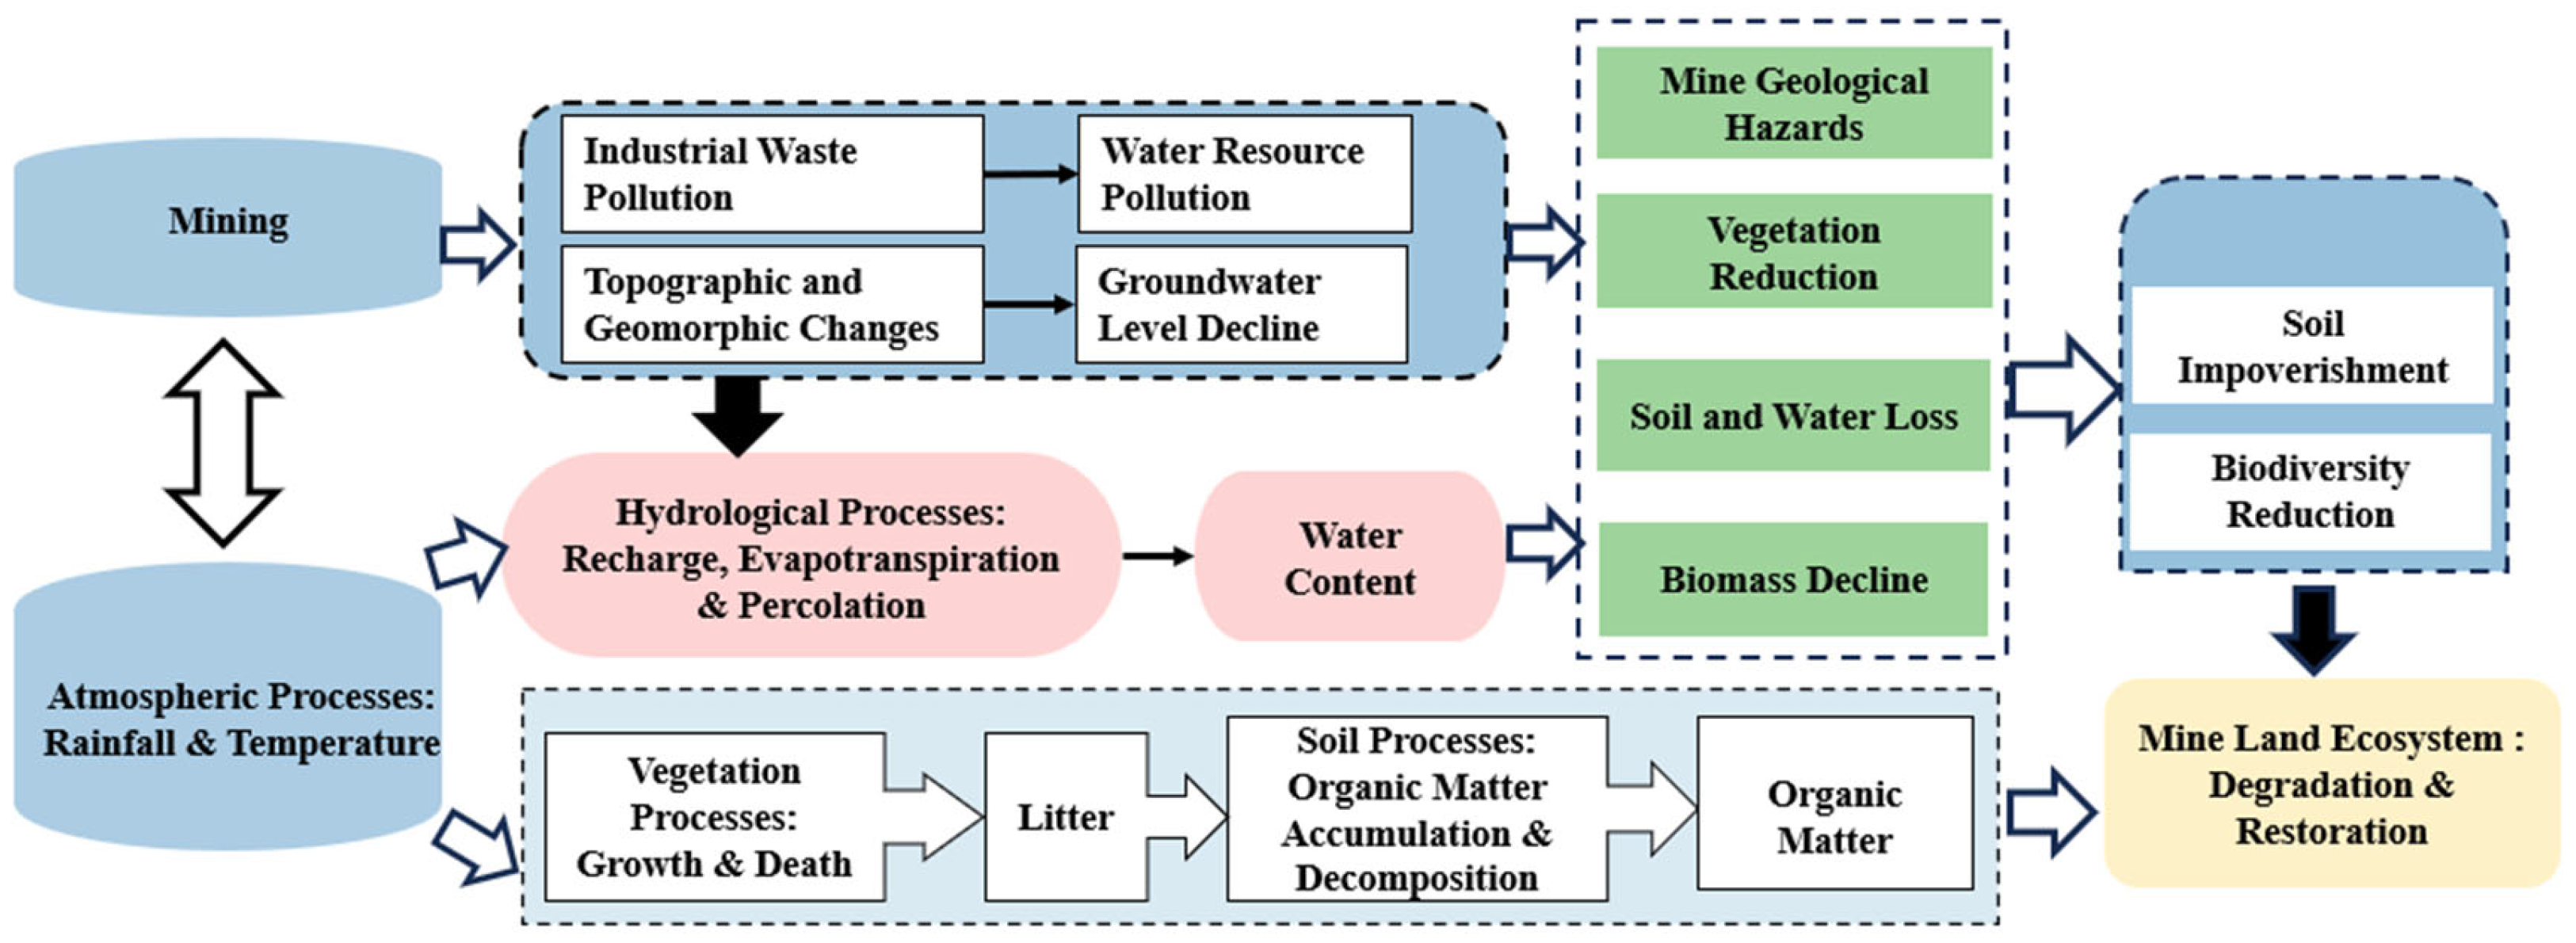
Currently, the definition and usage of the resilience concept in research literature related to NbS align with Holling’s view of resilience [30]. Therefore, referencing the resilience theory proposed by ecologist C. S. Holling, and integrating the evolutionary stages of ecological resilience in mining ecosystems, this study defines MLER as follows: It refers to the inherent capacity and dynamic process of a mining land ecosystem to absorb disturbances and maintain its core ecological service functions after undergoing severe disruptions caused by mineral resource extraction [31]. At the same time, when the system state may change, it demonstrates the ability to adapt and reorganize, ultimately evolving from a simpler state to a more complex and stable ecological state, either through natural recovery or human-assisted restoration, as shown in Figure 2.
Figure 2.
MLER Mechanism.
2.2.3. Coupling Mechanism Analysis
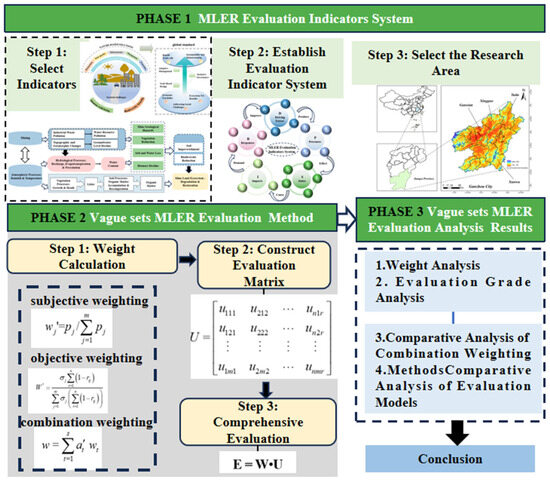
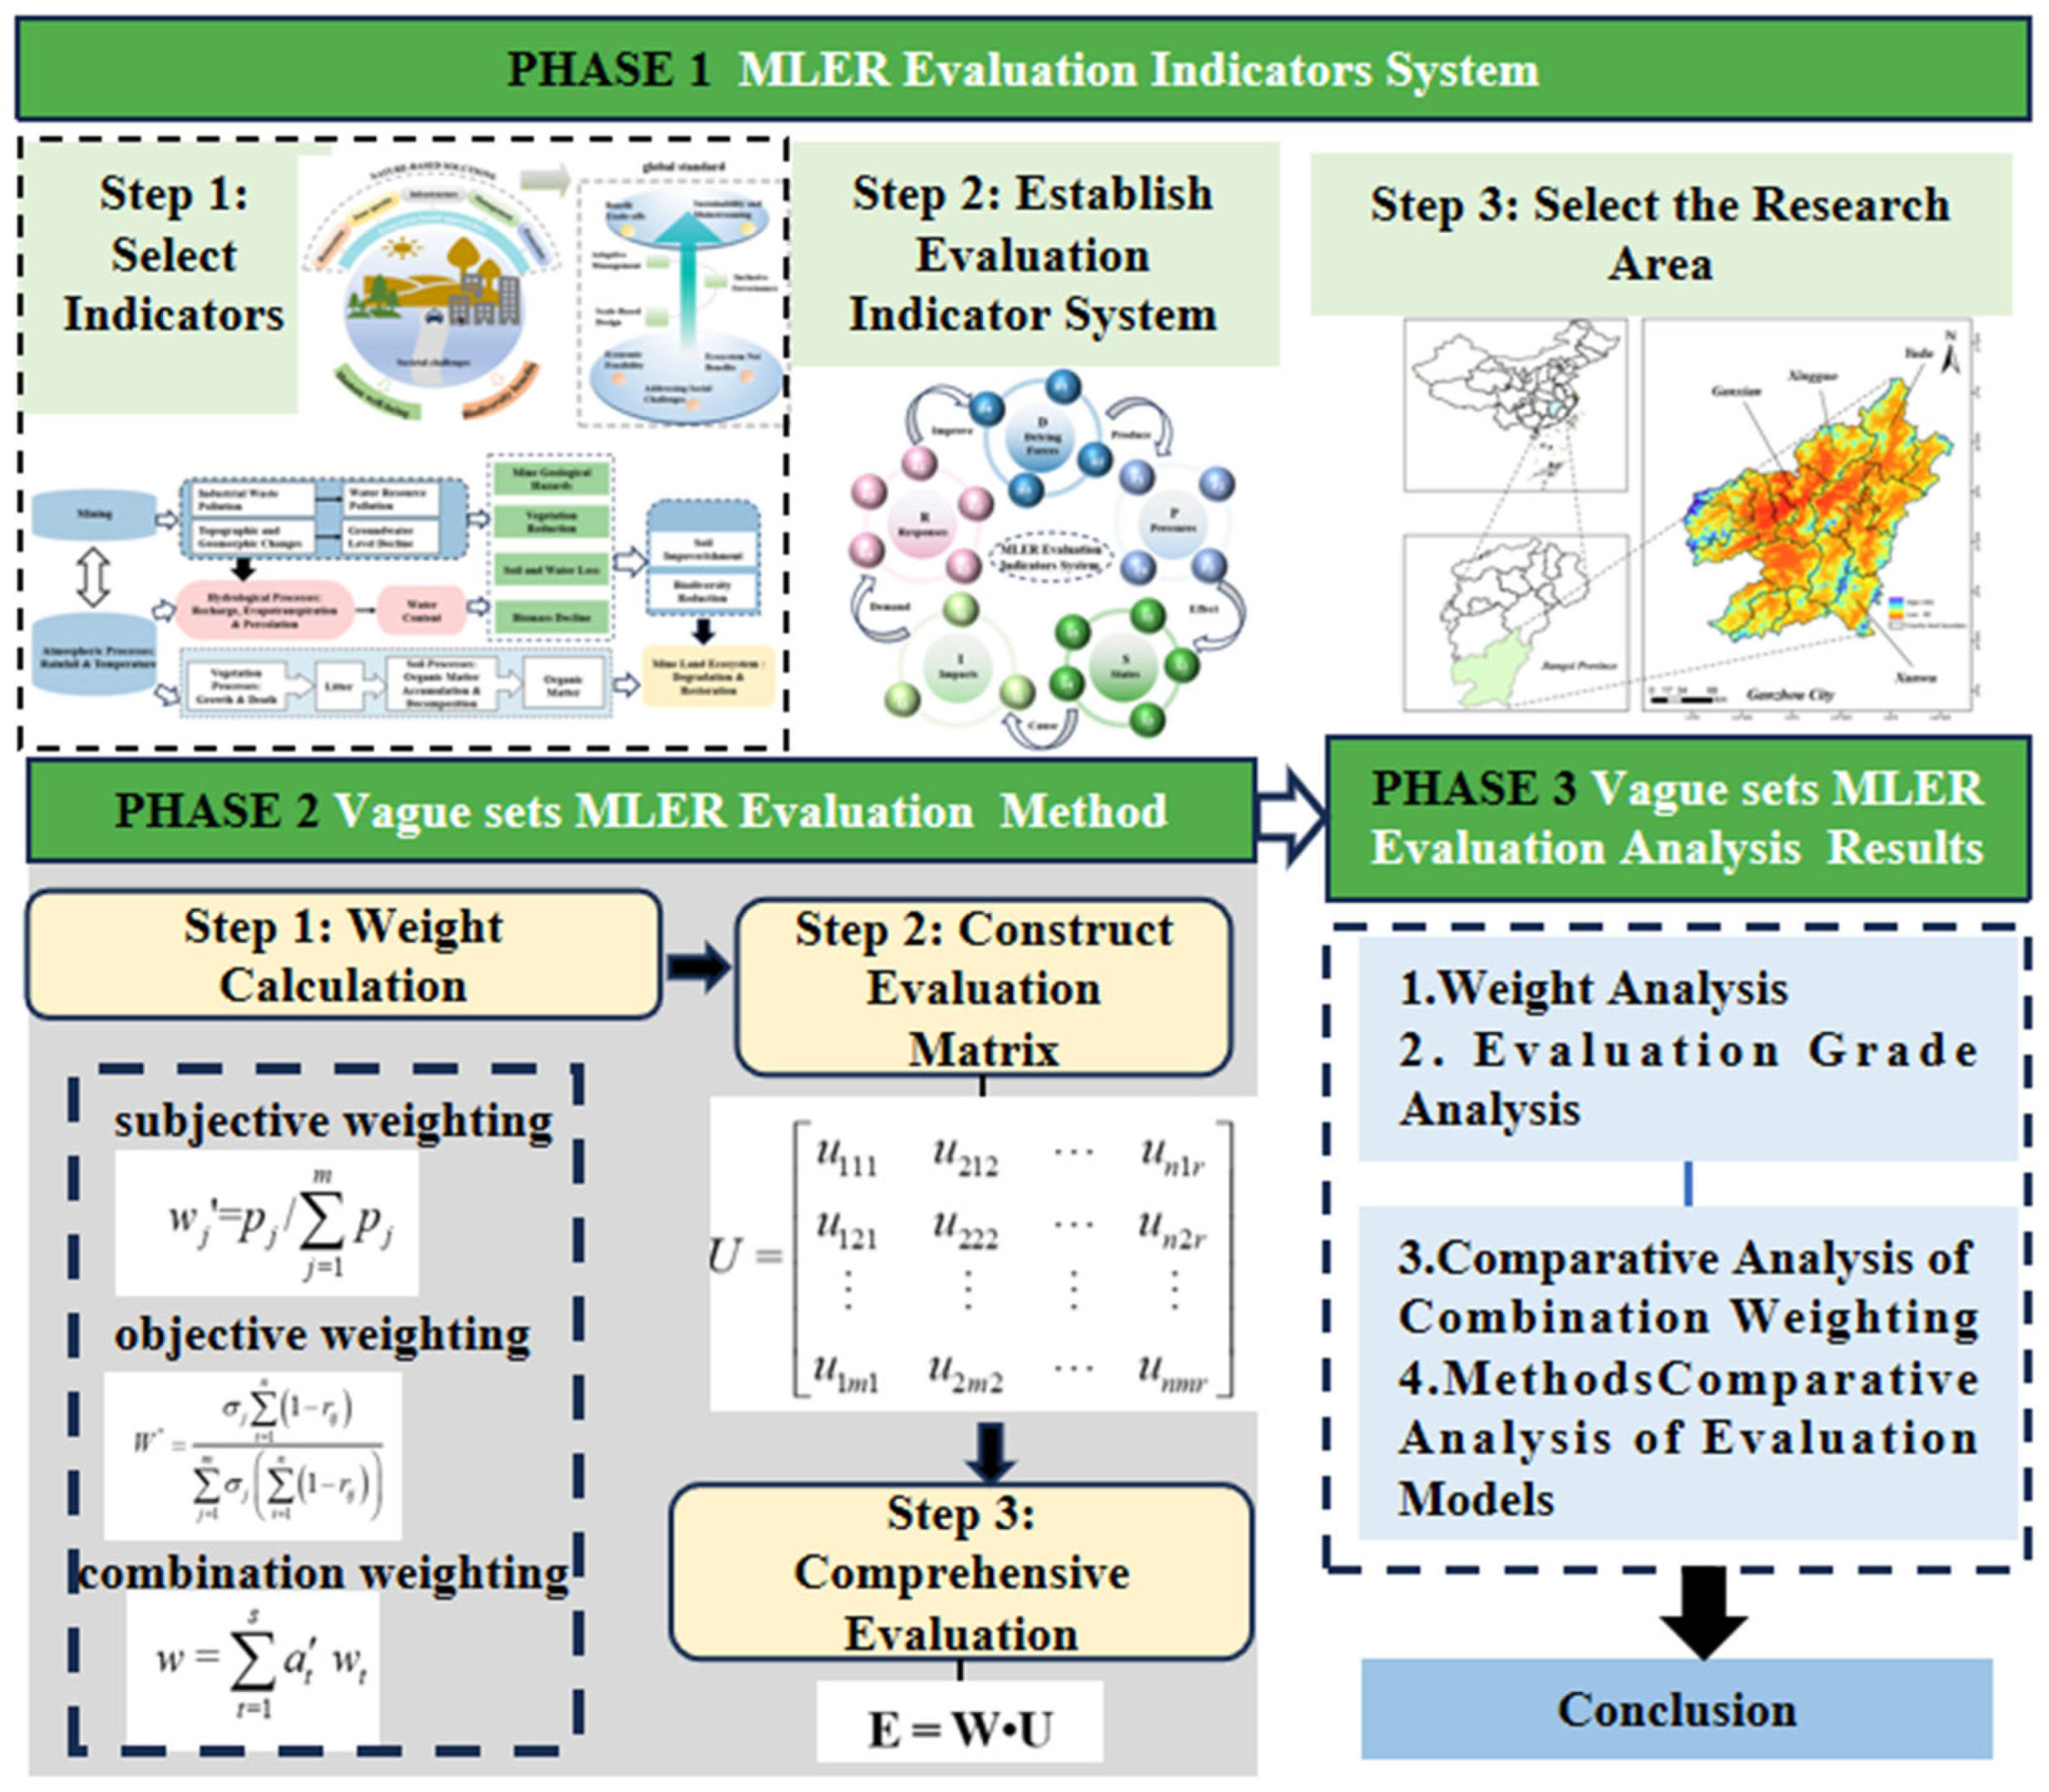
There is a profound logical coupling between MLER and NbS. The core of this coupling lies in the NbS framework, which promotes a shift in restoration models from single-engineering interventions to a system governance paradigm driven by natural processes and multi-element collaboration [32]. The NbS framework is oriented towards addressing social challenges, prompting a shift in restoration objectives from traditional reclamation to the overall enhancement of land system resilience [33]. Through “scale-based design,” it achieves spatial coordination, and by leveraging “benefit trade-offs,” it optimizes resource allocation, ensuring that restoration strategies align with regional ecological patterns while responding to development needs. It also relies on “inclusive governance” to build consensus among various stakeholders, and with “adaptive management,” it enables dynamic optimization, establishing an implementation mechanism with continuous learning and self-adjusting capabilities. Ultimately, supported by “economic viability,” it reduces costs and increases economic benefits through resource recycling [34], achieving a dual improvement in “ecosystem net gain” and “resource utilization net benefit.” This pushes restoration outcomes toward “mainstreaming and sustainability” at both institutional and market levels. This coupling relationship transforms the NbS principles system into a practical path for enhancing MLER, focusing not only on short-term restoration outcomes but also on cultivating long-term system resilience and adaptability, thereby achieving the synergistic advancement of ecological restoration, social benefits, and sustainable development. Based on this coupling mechanism, to integrate the NbS concept into the evaluation of ecological restoration outcomes, this paper proposes the corresponding evaluation process, as shown in Figure 3. The process aims to overcome the limitations of traditional evaluation models, which often emphasize engineering over nature, short-term effects over long-term sustainability, and indicators over systems. It also seeks to facilitate the localization and institutionalization of the NbS concept in China’s ecological restoration practices.
Figure 3.
Technical Roadmap.
3. Evaluation Model Based on Vague Sets
3.1. Weight Calculation
3.1.1. AHP
AHP is a structured decision-making method that decomposes a decision problem into more manageable parts and establishes a hierarchical structure between these parts for qualitative and quantitative analysis [35,36]. The core principle of AHP is to break down the decision problem into different levels, such as goals, criteria, and alternatives, and then determine the relative importance or priority of the elements at each level through pairwise comparisons.
First, for factors at the same level, pairwise comparisons are made to assess their relative importance. Using Saaty’s 1–9 fundamental scale [37], qualitative comparison language is transformed into quantitative values, with the specific meanings shown in Table 1.
Table 1.
Comparison Judgment Values.
(1) Constructing the judgment matrix. Let there be m indicators. Based on the hierarchical model, the judgment matrix Q is constructed according to the comparison scale in Table 1.
where qjk represents the relative importance of indicator j with respect to indicator k.
(2) Square root method for weight calculation. The characteristic root of the judgment matrix Q is calculated by QW’ = λmaxW’, where W’ is the eigenvalue vector. According to mathematical theory, (Q) has a unique maximum eigenvalue, and W’ can be composed of positive components. Since it is difficult to precisely calculate λmax and W’, the square root method is commonly used to calculate their approximate values.
The product of the elements in each row of Q gives the vector D.
Take the n root of D to obtain the vector P.
Normalize P to obtain W’.
Calculate the maximum eigenvalue of Q.
Consistency test. The judgment matrix Q, based on personal experience and knowledge, inevitably contains logical errors. To ensure that the judgment results align better with the actual situation, the consistency ratio can be determined using Formula (8).
where RI represents the Random Consistency Index, which is the average consistency index derived from a large number of randomly generated reciprocal matrices. The value of RI depends on the matrix order, with specific values shown in Table 2. CI represents the Consistency Index, which is used to quantify the deviation of the matrix from perfect consistency. If (CR < 0.1), the consistency of Q is considered acceptable, and the calculated W’ represents the subjective weights of the factors. Otherwise, Q must be adjusted to meet the consistency test requirements.
Table 2.
Ratio index scale.
3.1.2. CRITIC Method
CRITIC method is a multi-criteria weighting method based on the objective characteristics of data. The core advantage of this method is that it does not rely on expert subjective judgment, but instead analyzes the data patterns of the indicators themselves, namely the contrast strength and conflict degree, to objectively determine the weights of each indicator, thus retaining the original information of the data to the greatest extent. The weighting principle emphasizes that the indicator weights should reflect both information content and independence, specifically quantified through two dimensions: contrast strength is measured by the standard deviation of the indicator data, representing the indicator’s ability to distinguish evaluation objects. The larger the standard deviation, the higher the weight; conflict degree is measured by the correlation coefficient between the indicator and other indicators, reflecting its information uniqueness. The lower the correlation, the higher the conflict degree, and thus the weight is increased accordingly.
(1) Indicator preprocessing. Xij represents the real value of the i (i = 1, 2, 3 …, n) evaluation object for the j (j = 1, 2, 3 …, k, …, m) indicator. According to Equations (9) and (10), data with different units or scales are mapped to the interval [0, 1] to avoid the influence of dimensionality.
For positive indicators:
For negative indicators:
(2) Weight Calculation. The variance of each indicator can be calculated using Equation (11).
The correlation coefficient between indicators xij and xik can be calculated using Equation (12).
Finally, the objective weightings can be calculated using Equation (13).
3.1.3. Game-Theoretic Combination Weighting Method
Game theory, as a theory and method for studying phenomena with competitive or conflictual nature, is widely applied in multi-criteria evaluation problems. In terms of weight determination, the game-theoretic combination weighting method introduces a competitive mechanism to seek an equilibrium state between the attributes, thereby achieving a more rational weight distribution. The steps for calculating combination weights based on game theory are as follows:
Assume there are s evaluation methods for the evaluation object. The set of basic weight vectors (t = 1, 2, 3, …, s), then the linear combination weight of the s weighting methods is
where the coefficient αt can be obtained using Equation (15).
Then the combined weight of the indicator is
3.2. Construction of Evaluation Matrix
Let the evaluation system have n evaluation objects, m evaluation indicators, and u evaluation levels. The set of indicators for the system is Qj (j = 1, 2, …, m), and the set of risk levels is Vh (h = 1, 2, …, r). The membership degree of indicator Cij for level r is Cijr. The evaluation matrix for the set of indicators and the set of risk levels is
Calculate the corresponding indicator weights for all indicators in the evaluation system.
Specific calculation rules:
Scalar multiplication operation
Multiplication operation
Addition operation
In accordance with the above calculation principles, the evaluation results corresponding to each indicator are presented as follows.
3.3. Comprehensive Evaluation
Let W be the weight vector, and U be the Vague sets evaluation vector. Then the Vague sets fuzzy evaluation matrix is presented as follows.
With E = (e1, e2, …, er), the final evaluation of the indicator system can be obtained based on the maximum membership principle.
4. Case Study Application
4.1. Overview of the Study Area for MLER
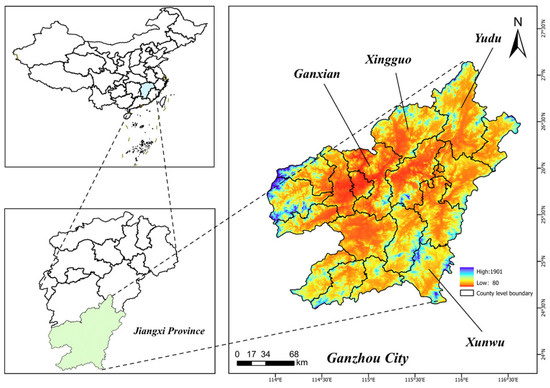
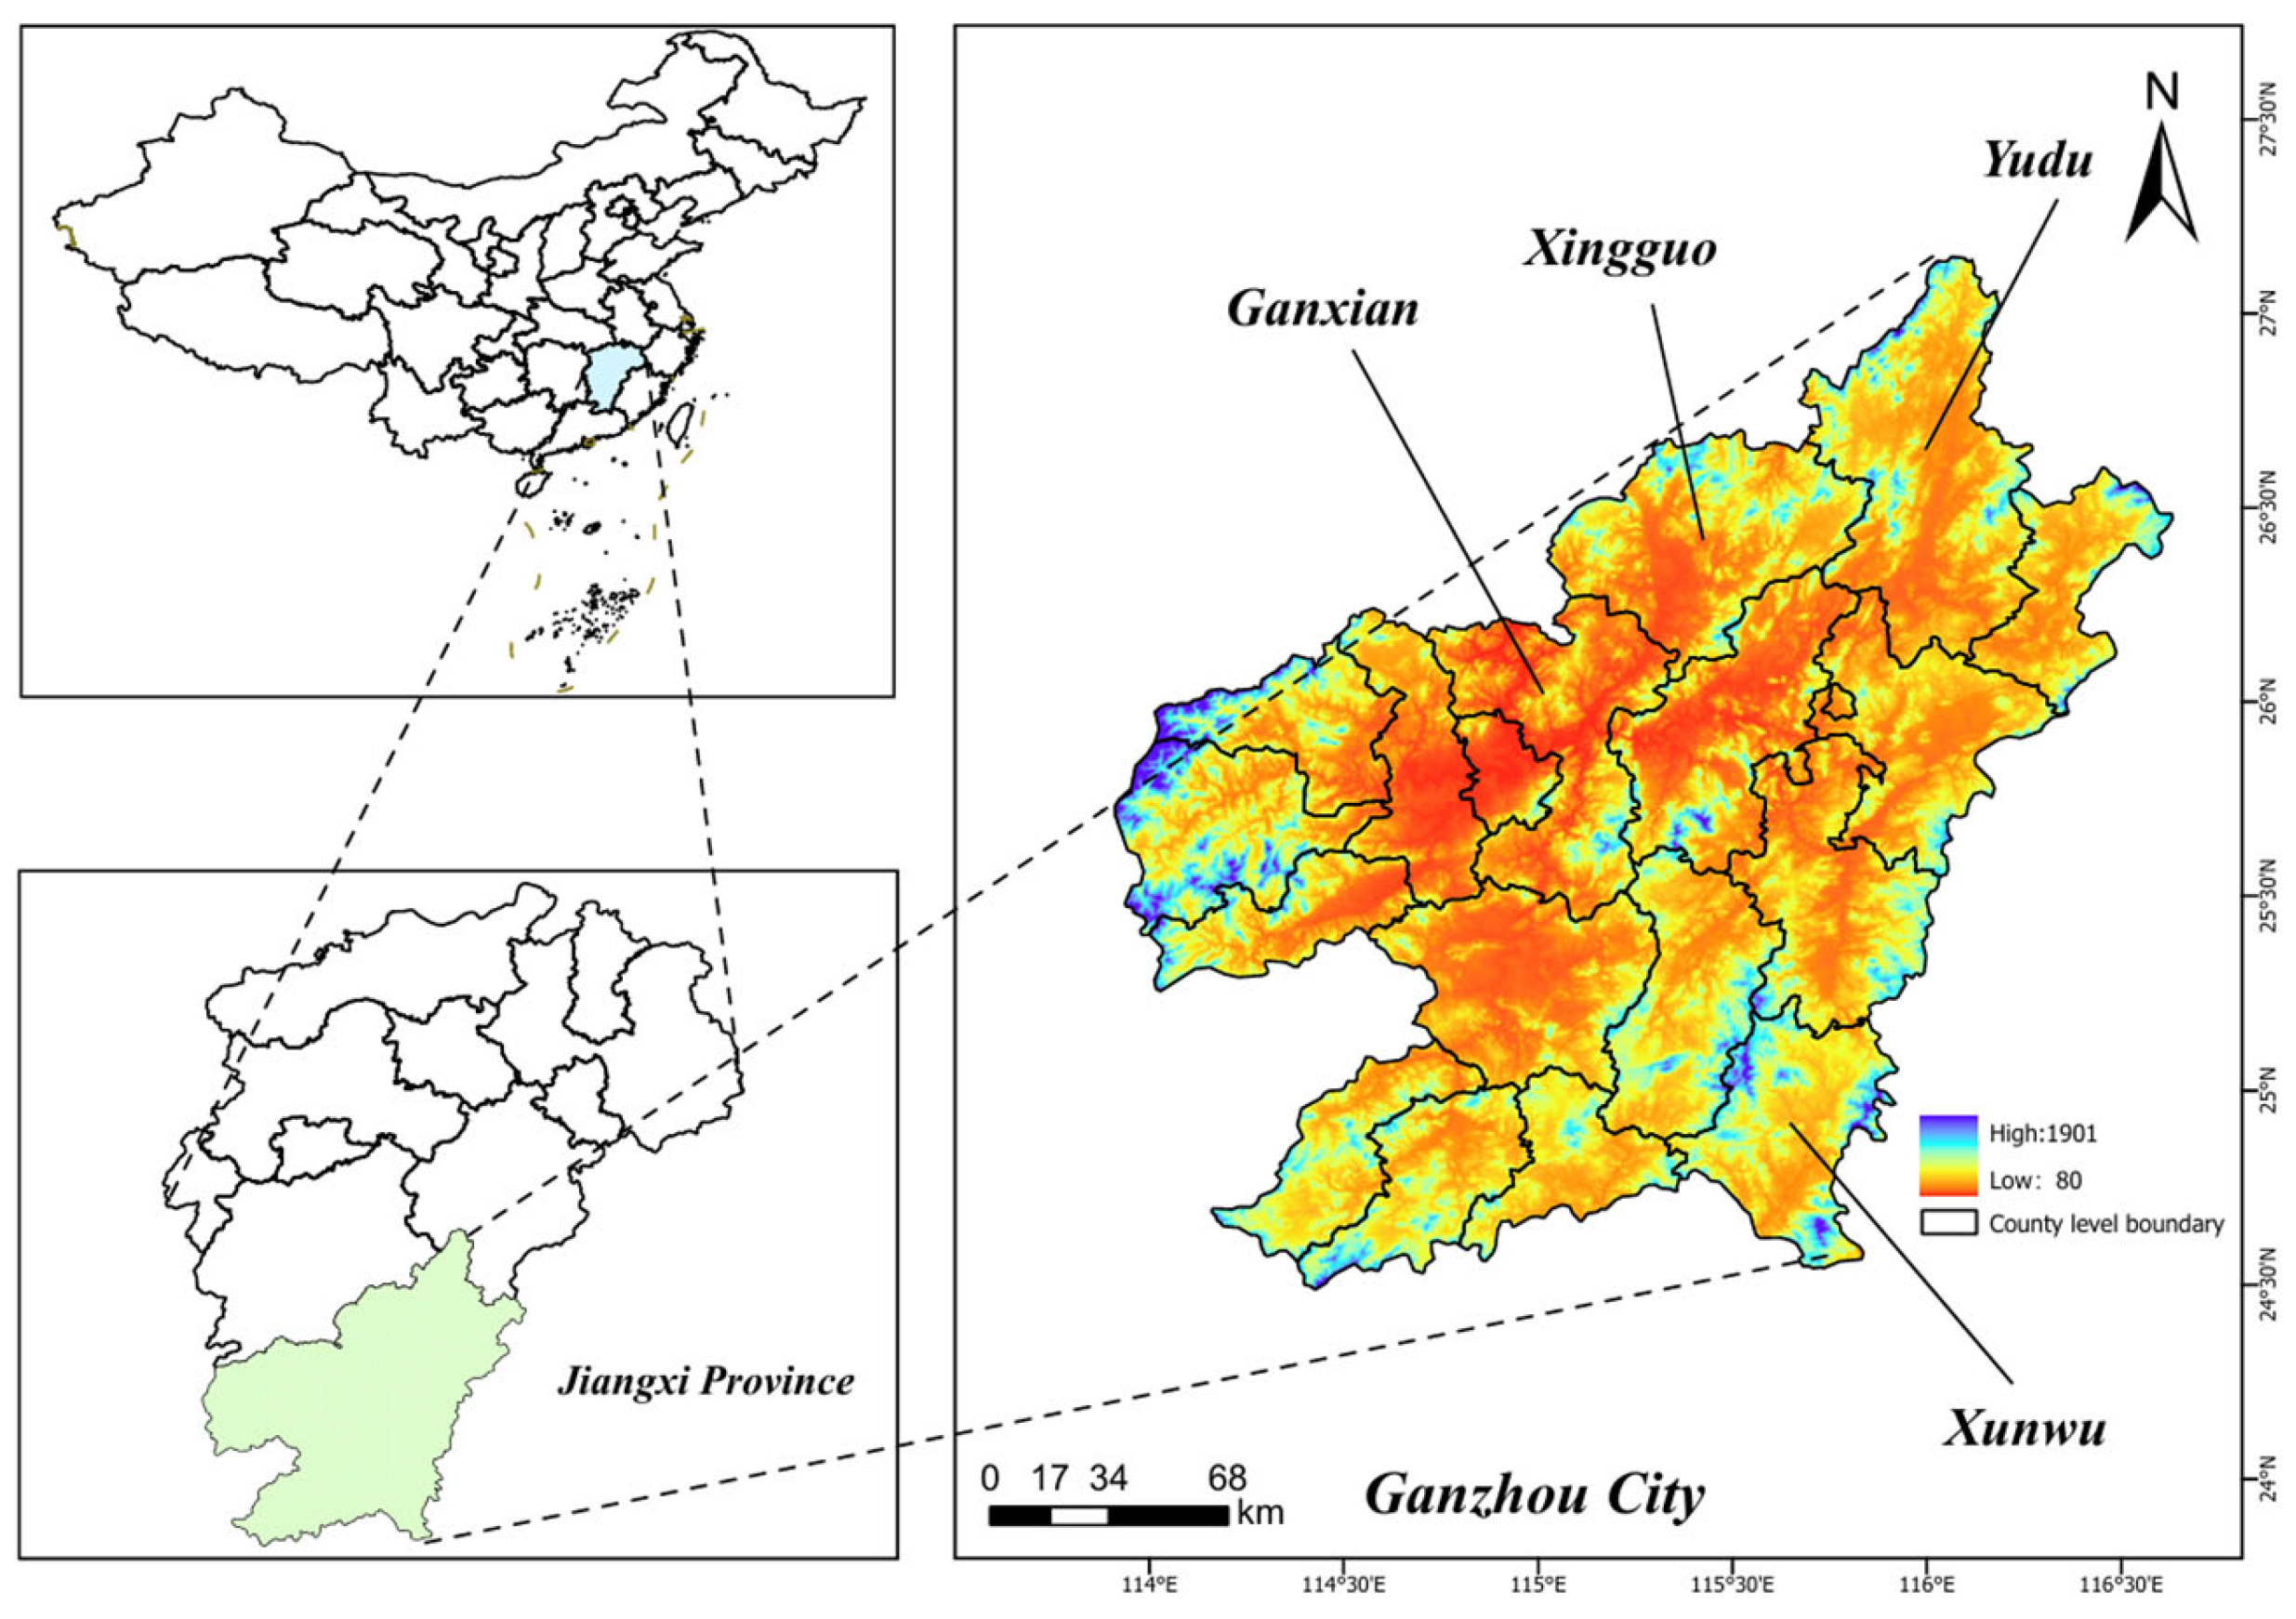
Jiangxi Province, as a major base for non-ferrous metals and rare earth resources in southern China, has a long history of mining and high-intensity resource exploitation. Its mine land ecological restoration practices face common industry-wide challenges while also accumulating differentiated governance experience, making it highly representative in the field of national mining ecological restoration. To systematically verify the scientific validity, rationality, and applicability of the mine land resilience evaluation framework constructed in this study, the research team, considering the spatial layout of green mine construction in Jiangxi Province, the distribution characteristics of mineral types, and key ecological restoration areas, purposefully selected typical mining areas in Gan Xian, Xing Guo, Yu Du, and Xun Wu as empirical case study sites, as shown in Figure 4.
Figure 4.
Geographical Location of the Study Area.
4.2. Establishment of MLER Evaluation Indicator System
4.2.1. DPSIR Full-Dimensional Evaluation Indicator System
DPSIR model, proposed by the Organisation for Economic Co-operation and Development (OECD) in 1993, is a system analysis tool based on causal relationships [38]. It aims to integrate socio-economic activities and ecological environmental factors, providing a structured logical framework for revealing the interactions between human activities and the natural environment. In the evaluation of MLER, the DPSIR framework forms a systematic assessment path through its complete causal chain. It comprehensively covers the entire process from developmental disturbances and ecological restoration to the sustainable maintenance of the system, effectively avoiding the shortcomings of traditional evaluation indicators in terms of logical coherence. This framework also possesses good dynamic adaptability, allowing for flexible adjustments to the evaluation content according to the different stages of mining restoration, thus overcoming the issue of insufficient adaptability of static indicators during long-term evolution.
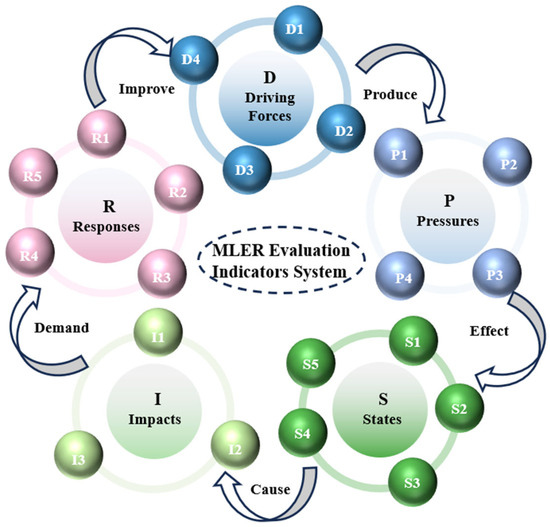
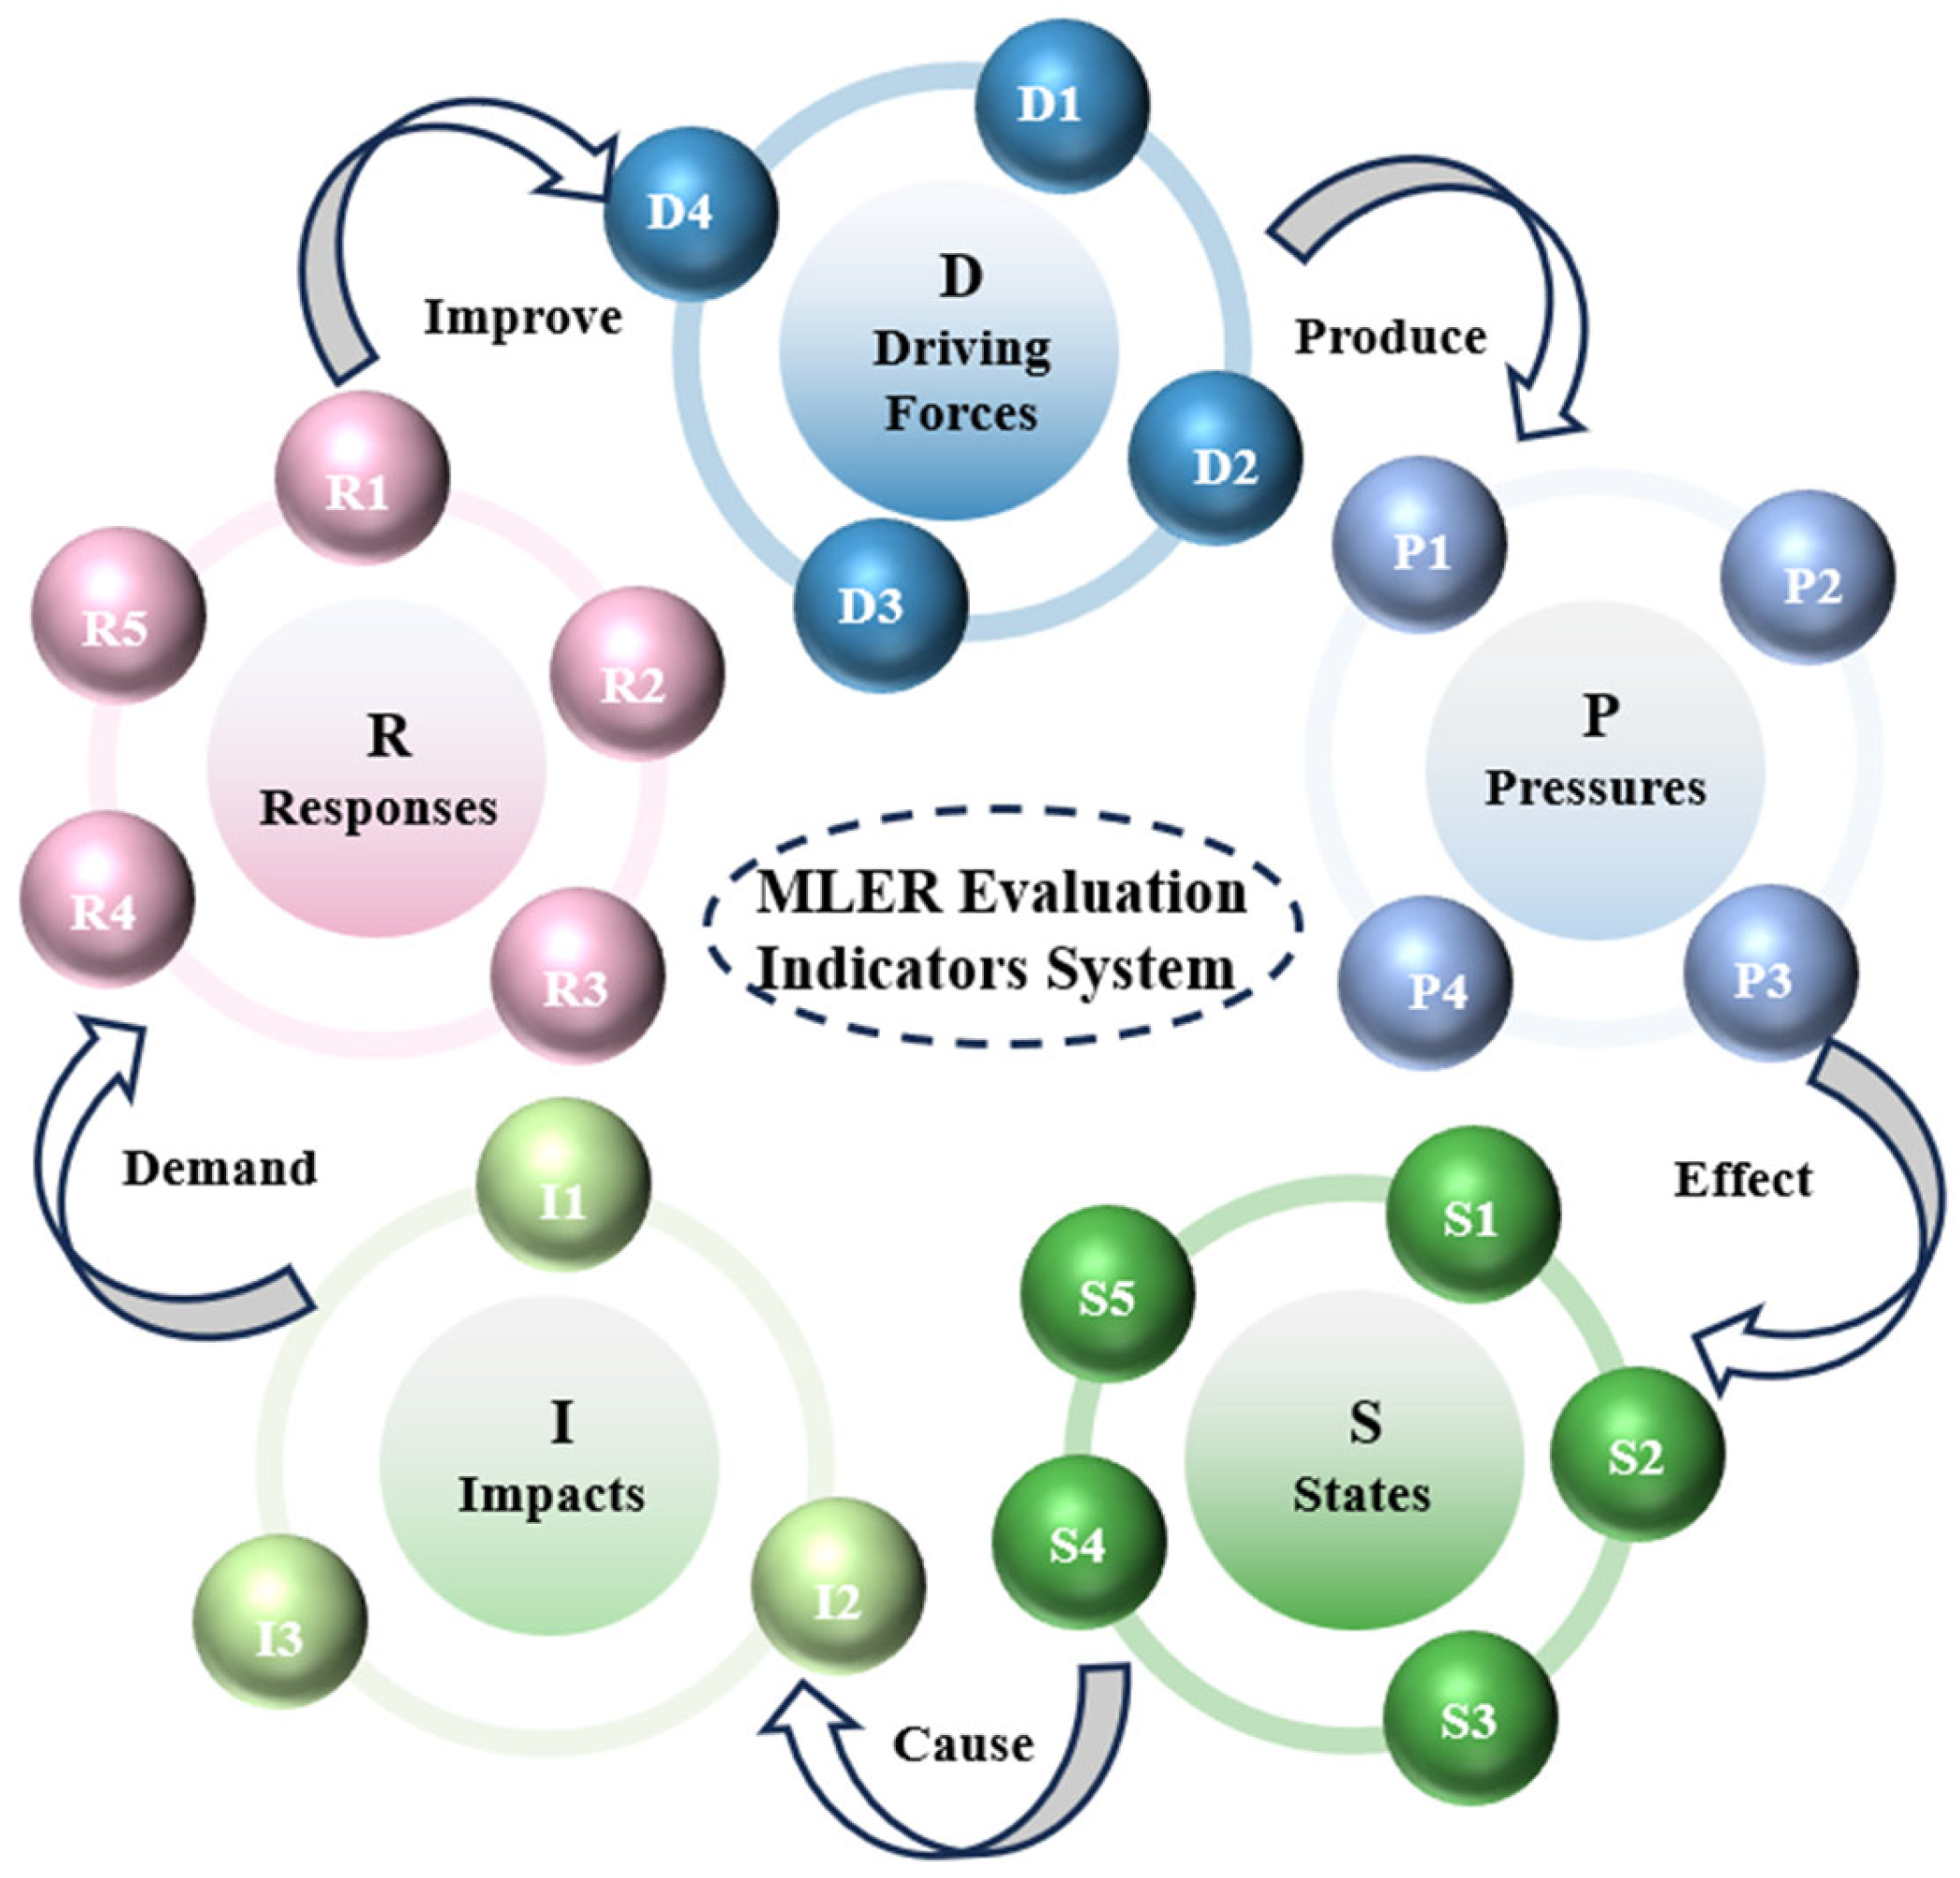
Based on these advantages, this study integrates the core concepts of NbS—such as “nature-driven, multi-benefit synergy, and adaptive management”—and references relevant research [39,40,41,42,43] and practical experiences in the field of mining ecological restoration. Under the DPSIR framework, a comprehensive, reliable, and operable evaluation indicator system for MLER has been constructed [44]. This system includes five dimensions: driving forces, pressures, state, impacts, and responses, with 21 s-level indicators, as shown in Figure 5.
Figure 5.
MLER Evaluation Indicator System.
4.2.2. MLER Indicator Connotation
The detailed content of each indicator is as follows:
D: Driving forces refer to the core factors that promote or hinder ecological restoration.
D1 Policy Mechanism for Long-Term Promotion of NbS Restoration: Evaluates the capacity of the policy system to continuously support ecological restoration, covering system design, execution supervision, and feedback optimization.
D2 Rationality of Green Investment Structure: Evaluates the matching degree of ecological restoration funding allocation with ecological needs and investment sustainability.
D3 Depth of Community Decision-Making Participation: Evaluates the breadth and depth of community residents’ involvement in the decision-making, implementation, and supervision of ecological restoration.
D4 Natural Adaptability of Restoration Technology: Evaluates the degree of matching between restoration technologies and the natural conditions of the target area, such as terrain, climate, hydrology, and soil.
P: Pressures refer to the impact of human activities or natural factors on the ecosystem.
P1 Population Density (unit: 100 people/km2): Evaluates the population density per unit area, reflecting the pressure of human activities on the ecosystem.
P2 Annual Average Temperature Level (unit: 10 °C): Categorizes the annual average temperature, reflecting the impact of climatic conditions on the ecosystem.
P3 Effectiveness of Pollution Control: Evaluates the impact of pollution on ecosystem structure and function, including pollution scope, intensity, and duration.
P4 Reduction in Mining Activity Interference: Evaluates the reduction in mining activity interference on the ecosystem, including interference methods, intensity, scope, and duration.
S: States refer to the current structural and functional conditions of the ecosystem.
S1 Integrity of Vegetation Community Structure: Evaluates the hierarchical structure, species composition, and spatial arrangement of the vegetation community in relation to native or climax communities.
S2 Annual Precipitation (unit: 1000 mm): Reflects regional precipitation conditions, providing a basis for hydrological conditions and ecological water needs evaluation.
S3 Soil Fertility Level: Evaluates the physical, chemical, and biological conditions of the soil, reflecting its ecological support capacity.
S4 Adaptability of Hydrological Conditions: Evaluates the degree of matching between regional water volume, quality, and spatial distribution with ecosystem types.
S5 Community Succession Stage Description: Evaluates the current succession stage and development trend of the ecosystem, reflecting its maturity and stability.
I: Impacts refer to the effect of ecological changes on human well-being and sustainable development.
I1 Landscape Connectivity Evaluation: Evaluates the degree of functional connectivity between different ecological patches in the landscape, reflecting ecosystem integrity and resistance to disturbances.
I2 Reduction in Land Degradation Impact Area: Evaluates the extent and degree of land function loss or degradation.
I3 Ecological Benefit Conversion Potential: Evaluates the potential for the ecosystem’s service functions to be converted into economic and social value.
R: Responses refer to the restoration measures and their implementation effects on ecological problems.
R1 Intensity of Restoration Funding Investment: Evaluates the scale and density of ecological restoration funding investment, reflecting the intensity and sustainability of restoration efforts.
R2 Effectiveness of Smart Monitoring Coverage: Evaluates the coverage and accuracy of smart monitoring technology in the restoration area, reflecting the reliability of the monitoring system.
R3 Dynamic Adjustability of Restoration Measures: Evaluates the ability of restoration plans to adaptively adjust based on monitoring results and environmental changes.
R4 GDP (unit: 100 billion yuan): Using regional annual GDP as a reference for economic scale, comparing with ecological indicators, reflecting the level of coordinated economic and ecological development.
R5 Stakeholder Collaboration Degree: Evaluates the degree and efficiency of collaboration among government, enterprises, communities, and other stakeholders in ecological restoration.
4.2.3. MLER Grading Standards
Based on the references [45], MLER is classified into 5 levels, with the specific grading standards as follows:
I: Deeply implement the NbS concept, with the ecosystem structure and function close to the natural state and outstanding sustainability; the driving-response mechanism is perfect, with optimal synergy of ecological, economic, and social benefits.
II: Effectively implement the NbS concept, with stable core ecological functions and no major ecological weaknesses; the driving-response mechanism is sound, balancing short-term restoration effects and long-term system resilience.
III: Essentially implement the basic requirements of NbS, with preliminary restoration of ecological functions and no severe ecological risks; the driving-response mechanism is basically formed, with room for local optimization.
IV: Insufficient implementation of the NbS concept, with damaged core ecological functions and clear ecological weaknesses; the driving-response mechanism is incomplete, with limited restoration effects and weak sustainability.
V: The NbS concept is not implemented, with severe ecosystem degradation, loss of core functions, and significant ecological risks; the driving-response mechanism fails, and restoration has no substantial effect.
Due to space limitations, only the grading standards for specific qualitative indicators under Category D are presented, as shown in Table 3.
Table 3.
Grading Standards for Category D Indicators.
4.3. Data Sources for the MLER
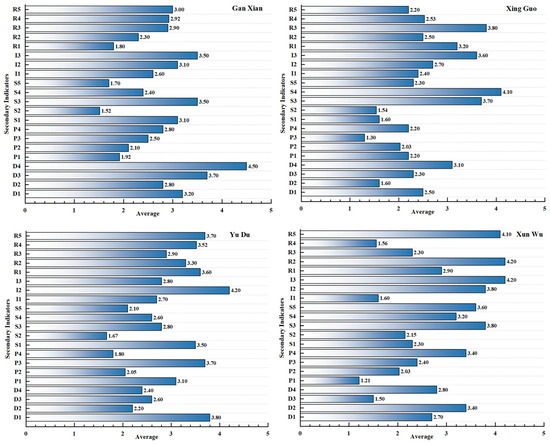
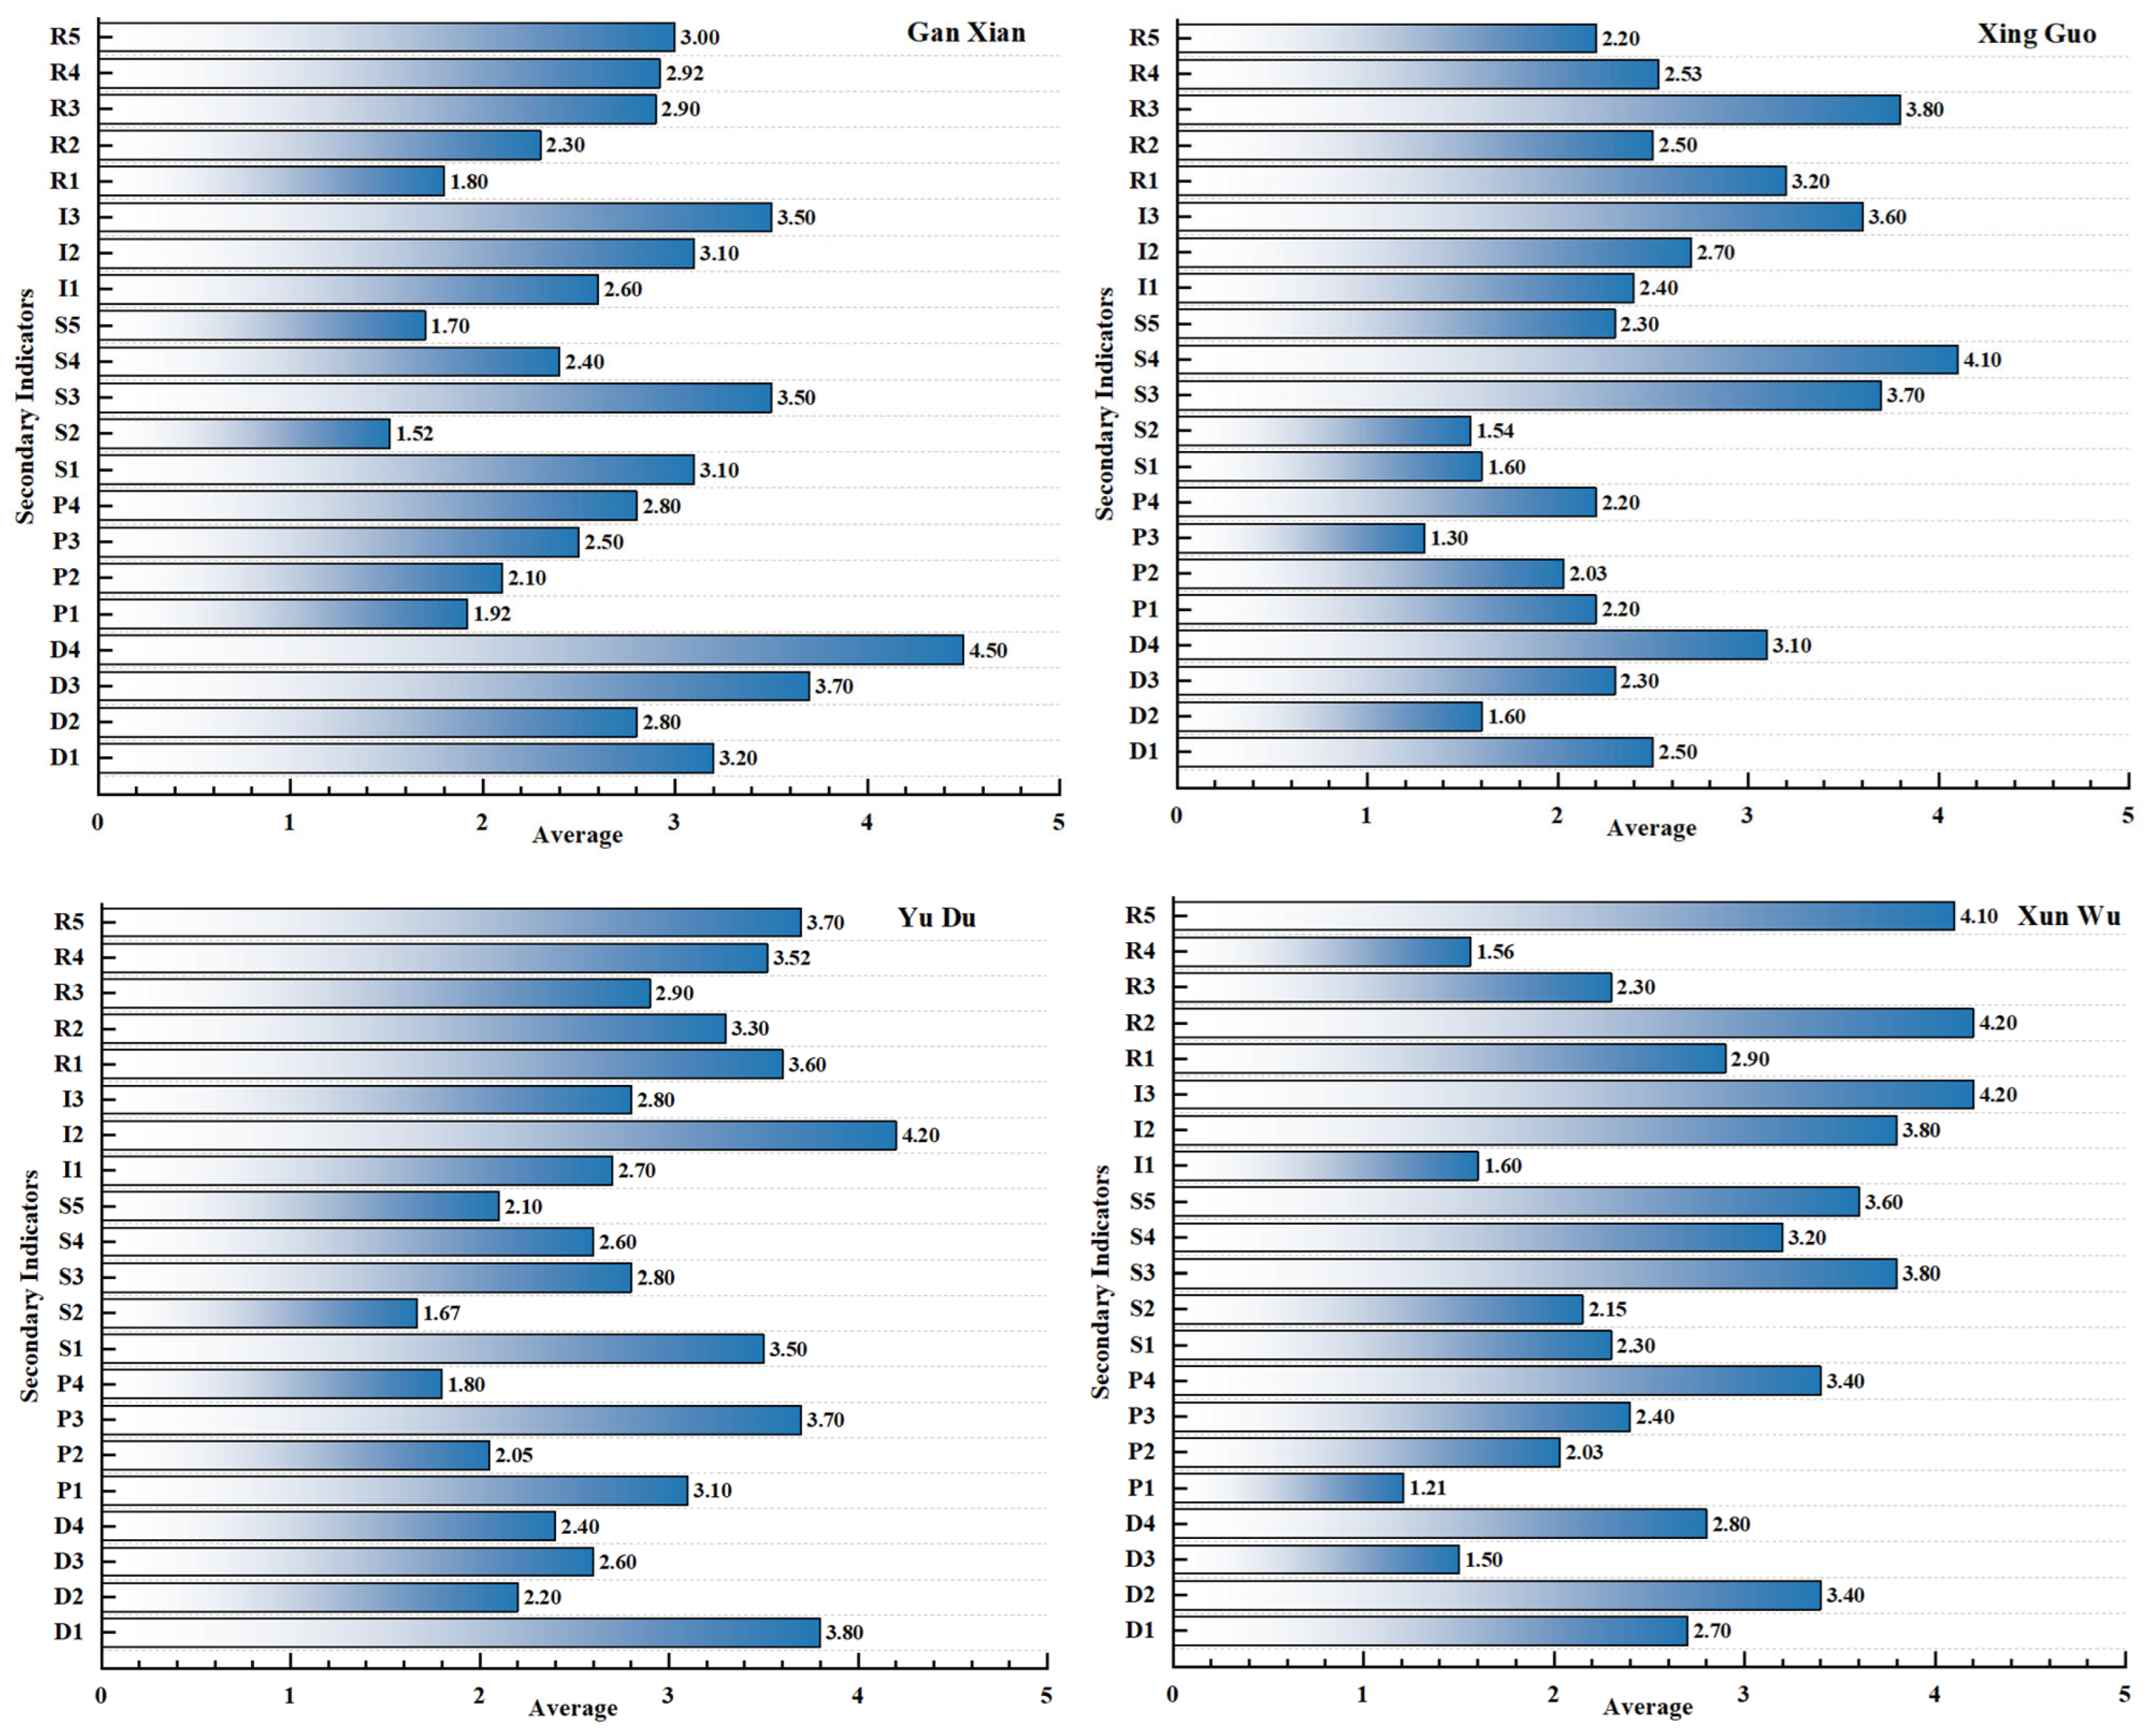
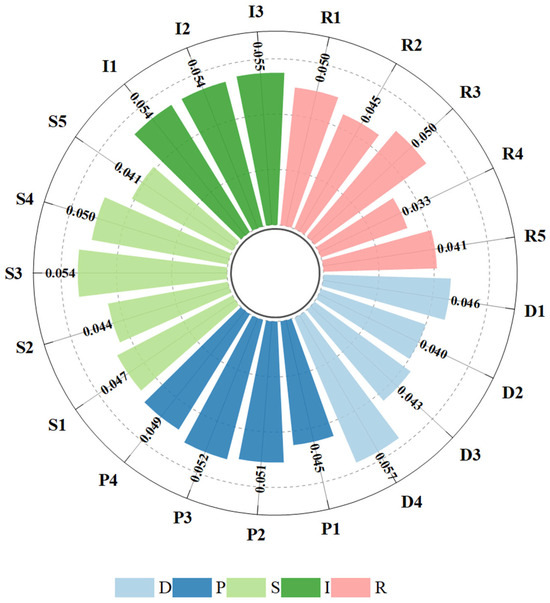
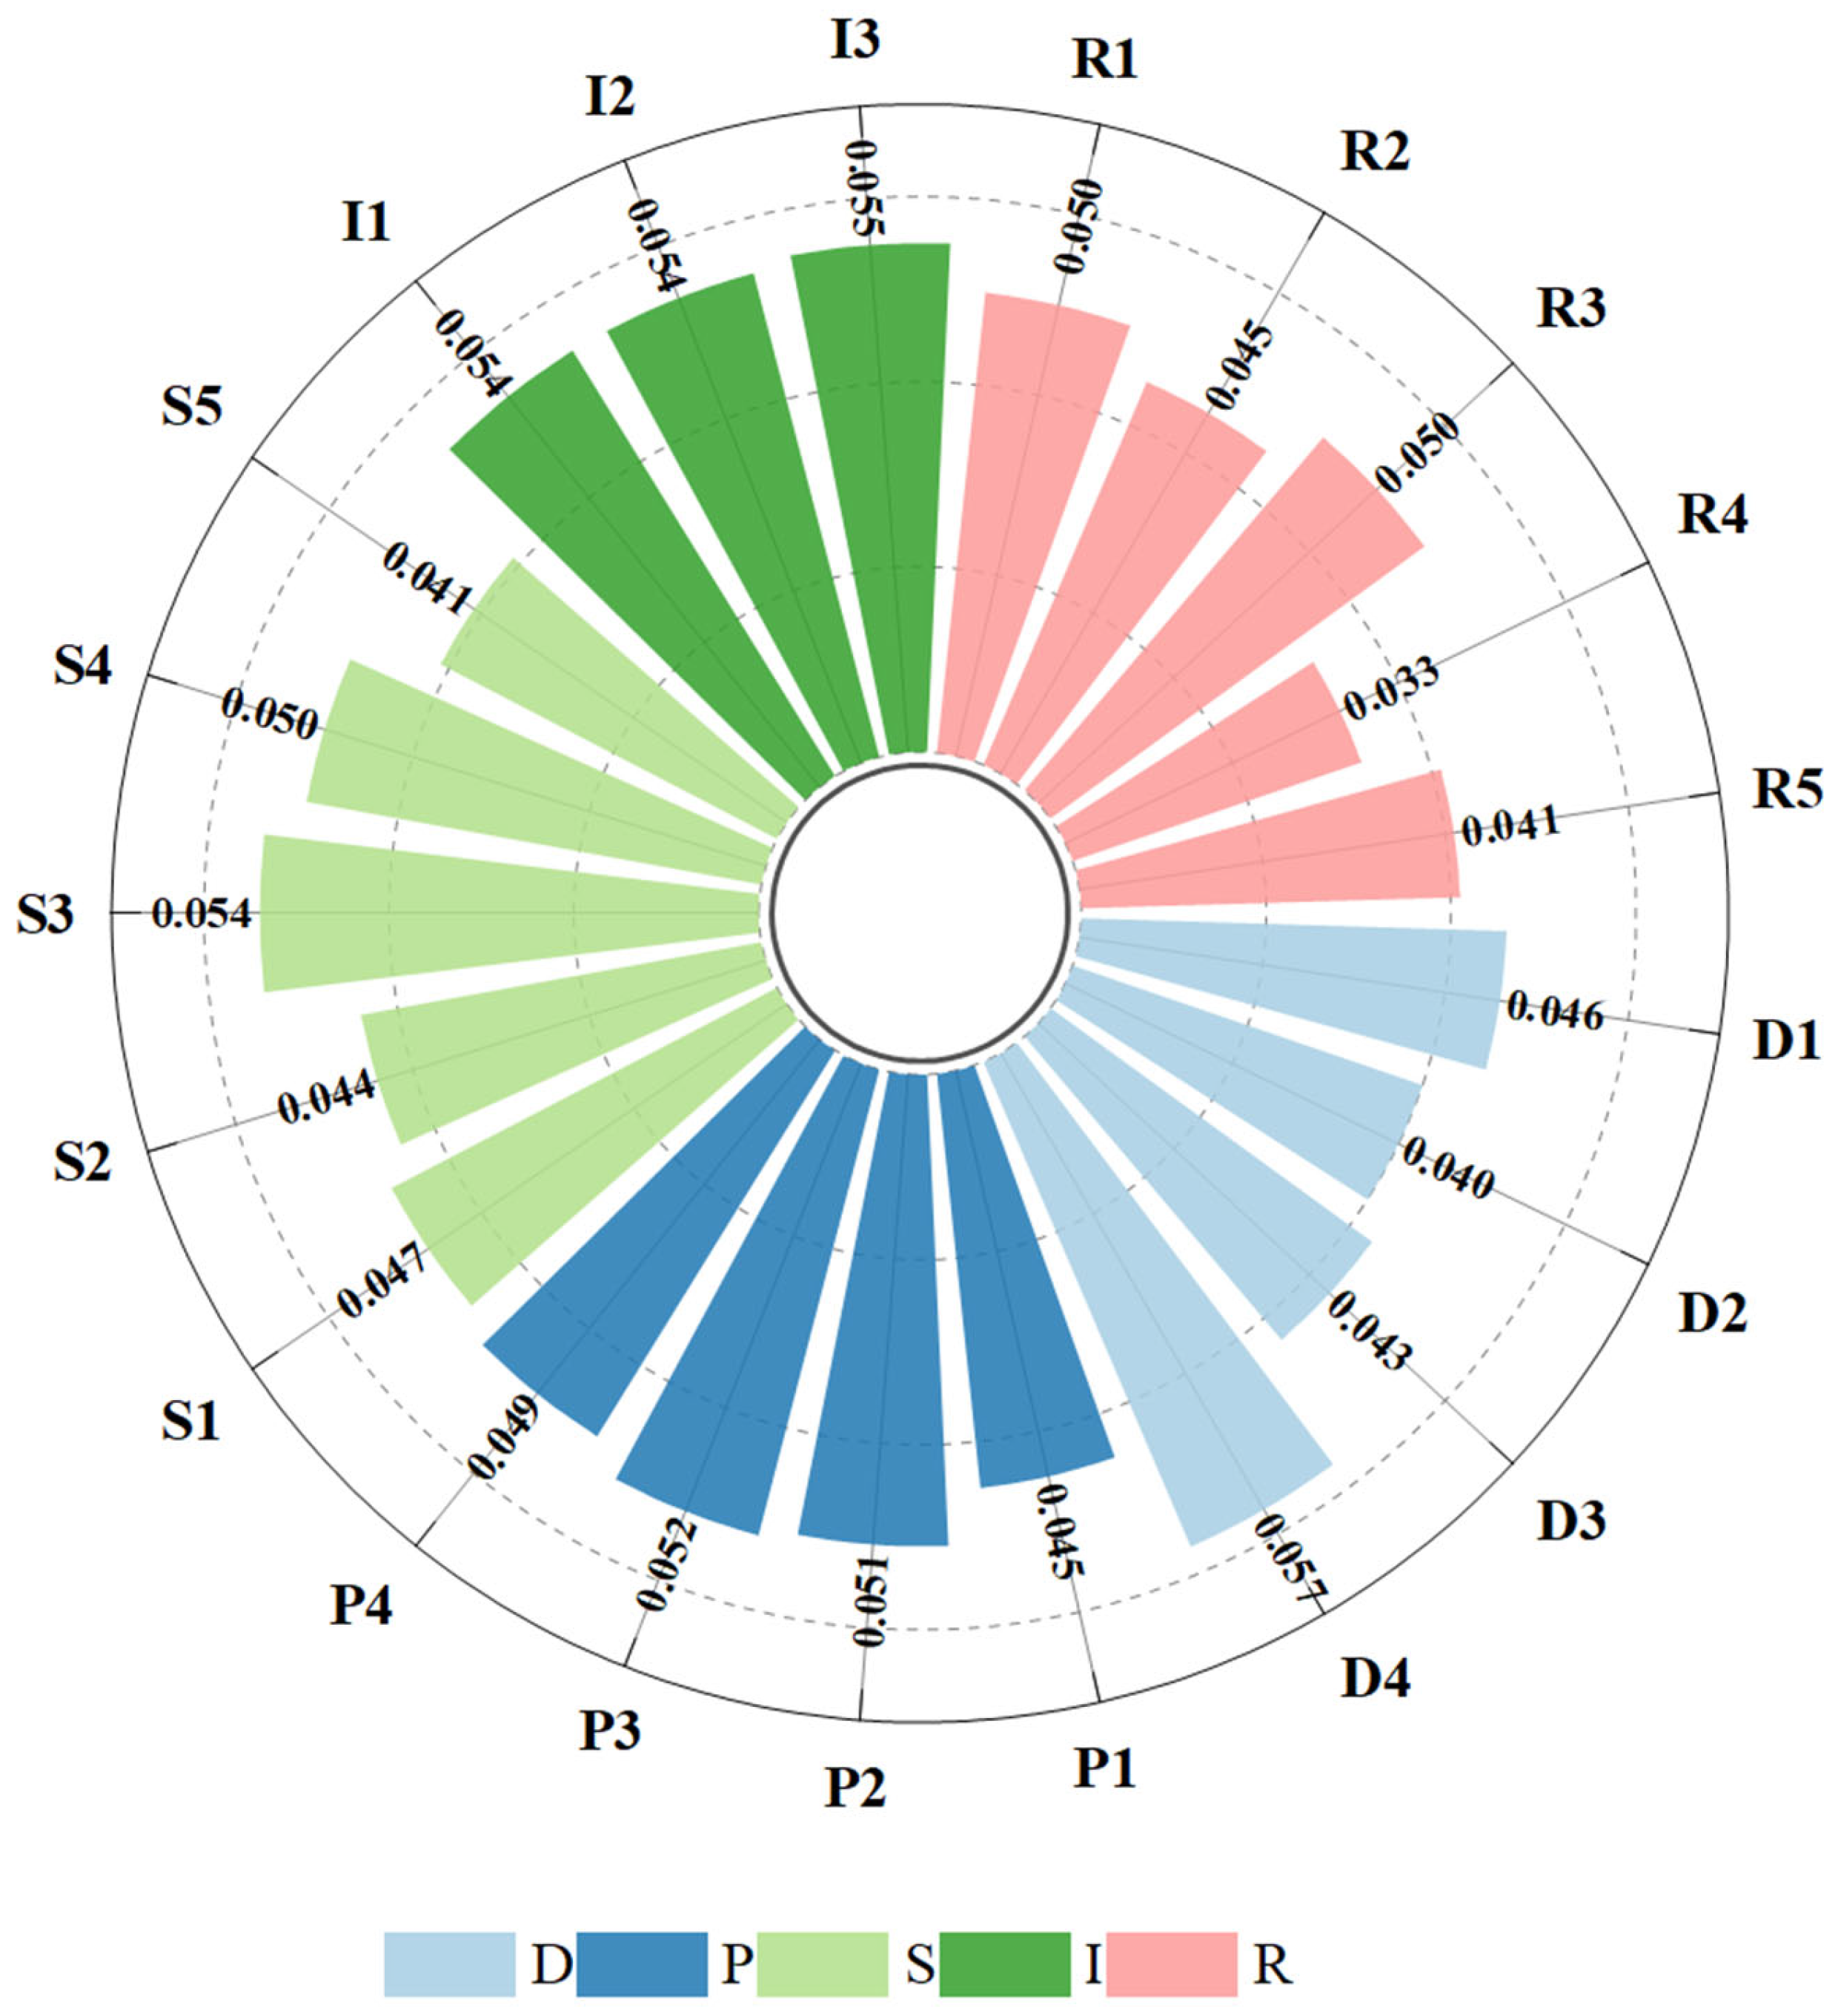
Data for the mine land resilience evaluation model are divided into two categories—objective quantitative data and semi-quantitative indicator scores—to ensure both authority and applicability. Meteorological data such as annual precipitation and annual average temperature are derived from the latest annual meteorological bulletins released by the national meteorological authority and monitoring data from regional meteorological stations. Socio-economic data, including population density and GDP, are obtained from the most recent statistical yearbooks published by the statistical departments of the municipalities where the study areas are located [46]. Indicators that are difficult to quantify directly, such as soil health status and vegetation community structural integrity, are scored by senior experts in ecological restoration, mine governance, and soil science. Scoring is conducted through multiple rounds of the Delphi method, based on core NbS criteria, industry technical standards, and on-site survey results, ultimately forming a comprehensive dataset that combines objectivity with practical applicability. The final mean scores for each indicator are presented in Figure 6.
Figure 6.
MLER Evaluation Indicators Average.
4.4. Weight Calculation for the MLER Model
Combining the expert experience from Section 4.3 with Equations (3)–(8), the subjective weights of the evaluation system are obtained. The CR value is presented in Table 4. Based on the original data in Figure 6 and Equations (9)–(13), the objective weightings are calculated. Finally, according to Equation (15), the combined weighting coefficients are determined as α1 = 0.624, α2 = 0.376. The combined weights for the entire evaluation indicator system are then derived using Equation (16), with the specific results presented in Table 5.
Table 4.
Indicator System CR.
Table 5.
MLER Indicator Weight.
4.5. Construction of the Evaluation Matrix for MLER
After all indicator weights were determined, the Vague sets values for each indicator were derived from the expert-assigned resilience levels provided in Section 4.3. Due to space limitations, this paper takes the Gan Xian mining area as an example to illustrate the detailed evaluation process.
For indicator D1, the opinions of 10 experts were as follows: five experts rated it as I, two experts rated it as II, one expert rated it as III, one expert rated it as IV, and one expert abstained.
According to the principles of Vague sets, the minimum membership degree and opposition degree for Indicator D1 at each grade are calculated as follows. For I, the minimum membership degree is tI(D1) = 0.5, the opposition degree is fI(D1) = 0.4, resulting in a maximum hesitancy degree is 1 − tI(D1) − fI(D1) = 0.1 and vague value was [tI(D1),1 − fI(D1)] = [0.5, 0.6]. For II, the minimum membership degree was tII(D1) = 0.2, the opposition degree was fII(D1) = 0.7, resulting in a maximum hesitancy degree was 1 − tII(D1) − fII(D1) = 0.1 and vague value was [tII(D1), 1 − fII(D1)] = [0.2, 0.3]. For III, the minimum membership degree was tIII(D1) = 0.1, the opposition degree was fIII(D1) = 0.8, resulting in a maximum hesitancy degree was 1 − tIII(D1) − fIII(D1) = 0.1 and vague value was [tIII(D1)1 − fIII(D1)] = [0.1, 0.2]. For IV, the minimum membership degree was tIV(D1) = 0.1, the opposition degree was fIV(D1) = 0.8, resulting in a maximum hesitancy degree was 1 − tIV(D1) − fIV(D1) = 0.1 and vague value was [tIV(D1)1 − fIV(D1)] = [0.1, 0.2]. For V, the minimum membership degree was tV(D1) = 0.0, the opposition degree was fV(D1) = 0.9, resulting in a maximum hesitancy degree was 1 − tV(D1) − fV(D1) = 0.1 and vague value was [tV(D1)1 − fV(D1) = 0.1] = [0.0, 0.1] The corresponding vague value for indicator D1 is {[0.50, 0.60], [0.20, 0.30], [0.10, 0.20], [0.10, 0.20], [0.00, 0.10]}. The vague value assigned by the experts to all secondary indicators under the full evaluation model are presented in Table 6.
Table 6.
Vague Value Evaluation Comments Assigned by Experts to Each Indicator.
4.6. Comprehensive Evaluation Results of the Mine Land Resilience Grading Model
According to Equation (19), the final Vague sets evaluation values for the assessed objects are shown in Table 7. According to Equation (23) and the combined weights of the five dimensions, the final Vague sets evaluation values for the assessed objects are shown in Table 6 and Table 8.
Table 7.
Vague Sets Evaluation Values for Each Dimension.
Table 8.
MLER Evaluation Levels.
5. Results and Discussion
5.1. Weight Analysis
Based on the analysis of the subjective weights for MLER indicators calculated using the AHP method in Figure 7, the weights for the five dimensions of the DPSIR model (Driver, Pressure, State, Impact, and Response) are 0.178, 0.199, 0.236, 0.183, and 0.204, respectively. The weight distribution across these dimensions exhibits significant imbalance, with the State (S) and Impact (I) dimensions carrying notably higher weights than the other three. This weight structure reflects a prioritization of the current ecosystem status and its associated effects, which aligns with the common tendency in practical assessments to emphasize existing ecological conditions. However, this allocation deviates somewhat from the inherent logic of the DPSIR model, which underscores the foundational role of Drivers (D) in triggering ecological processes and the feedback-regulation function of Response (R) measures. In the current weighting system, the relatively lower weight of the Driver dimension may lead to insufficient attention to critical drivers such as policy guidance and resource investment. Similarly, the weaker weight of the Response dimension could diminish the evaluative significance of key response elements, such as the implementation effectiveness of restoration measures and long-term maintenance mechanisms. Consequently, this may, to some extent, weaken the evaluation system’s effectiveness in guiding systematic improvements.
Figure 7.
Subjective Weighting.
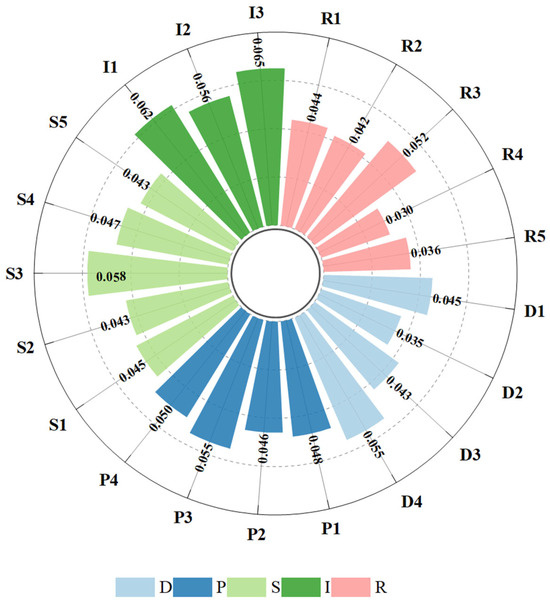
By applying the CRITIC objective weighting method to calculate the evaluation indicators for MLER, the resulting weights exhibit partial discrepancies compared to the AHP subjective weights, fully demonstrating the driving role of the data’s inherent patterns. As shown in Figure 8, the objective weights for the five DPSIR dimensions are 0.198, 0.193, 0.233, 0.130, and 0.246, respectively. Compared to the AHP subjective weights, the CRITIC method assigns a higher weight to the Driver (D) dimension while significantly reducing the weight of the Impact (I) dimension. This shift reflects the internal statistical laws derived from data variability and conflict, thereby strengthening the objective role of driving factors within the evaluation system. Specifically, indicators such as R1 (Intensity of restoration investment), P2 (Annual average temperature grade), and D4 (Natural adaptability of restoration technology) exhibit higher weights. This reflects the sensitivity of mine land ecological resilience to objective drivers and constraints, such as long-term financial support, natural environmental limitations, and technological suitability. The introduction of CRITIC weights effectively compensates for the AHP method’s limitations in focusing on objectively sensitive factors. It provides a quantitative basis grounded in data variance for the subsequent subjective-objective combined weighting, ultimately enhancing the scientific rigor and balance of the evaluation system.
Figure 8.
Objective weighting.
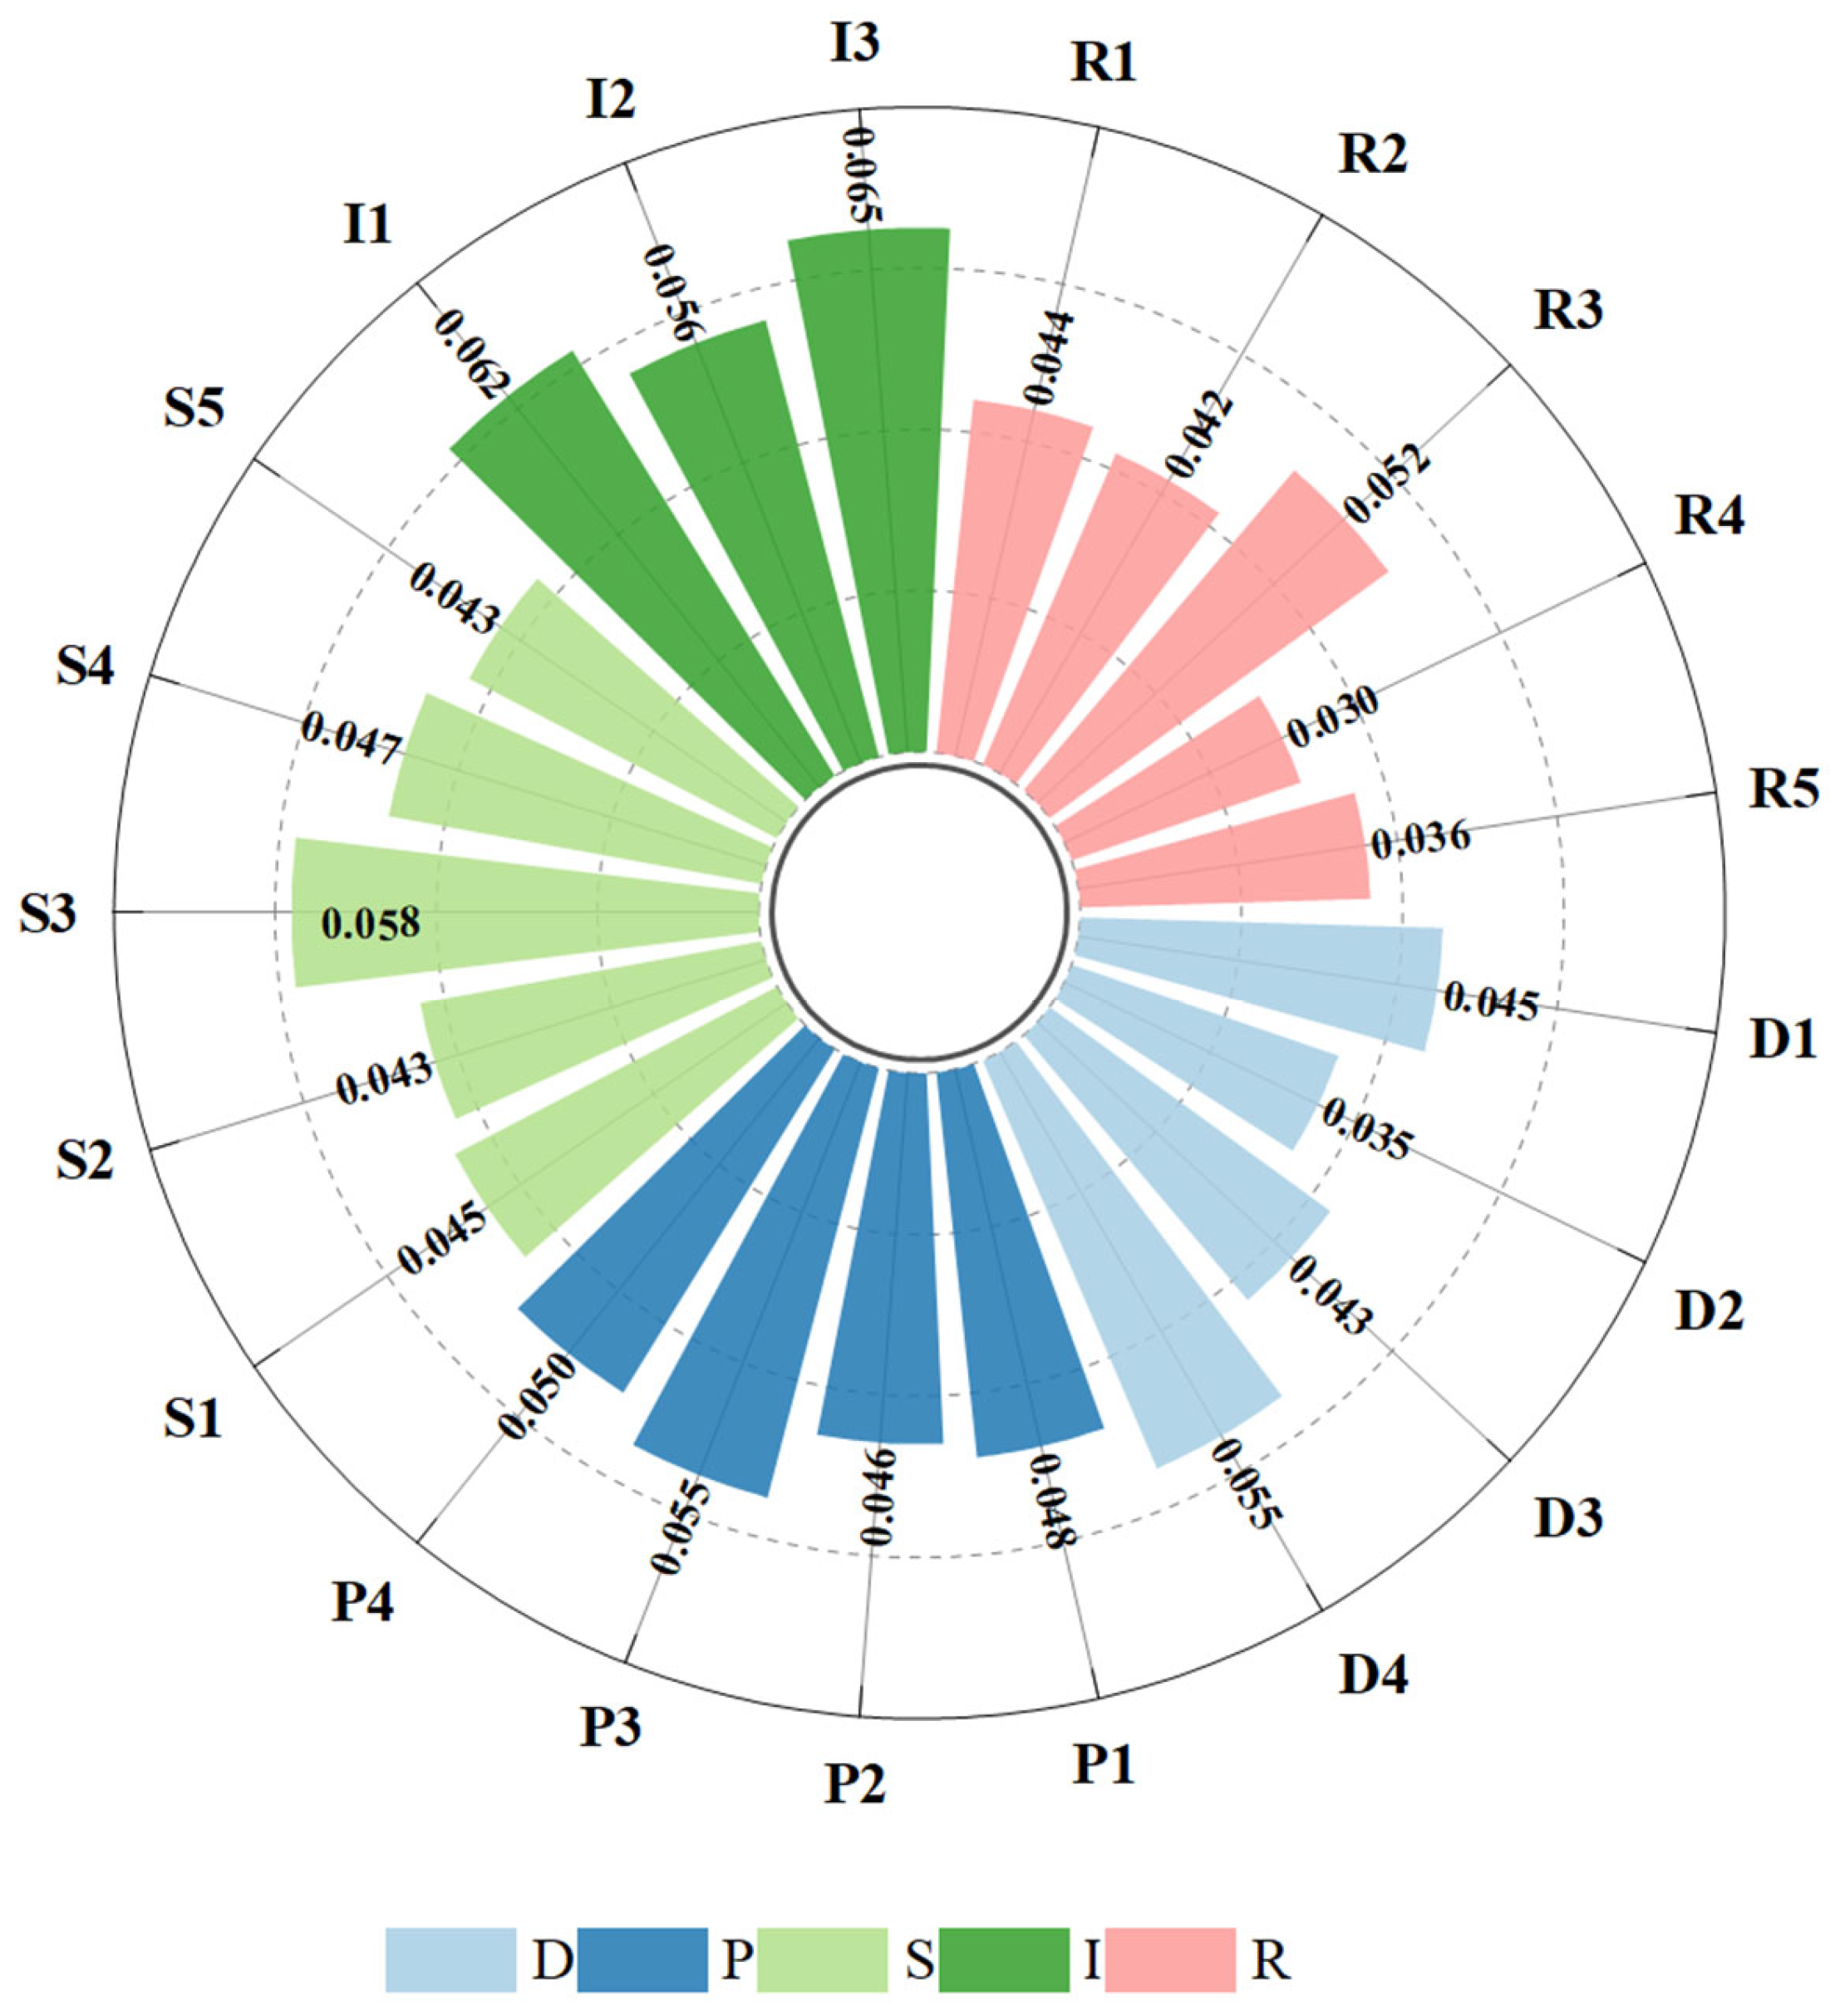
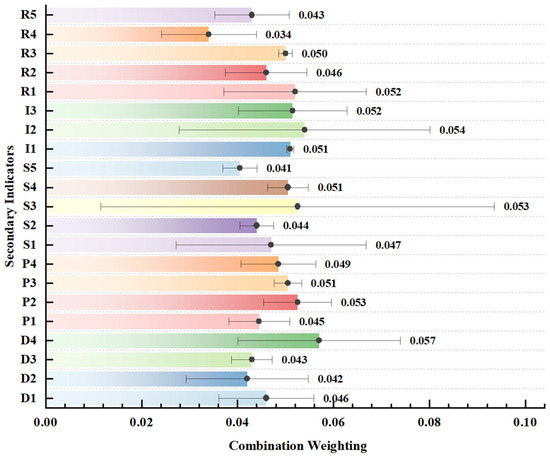
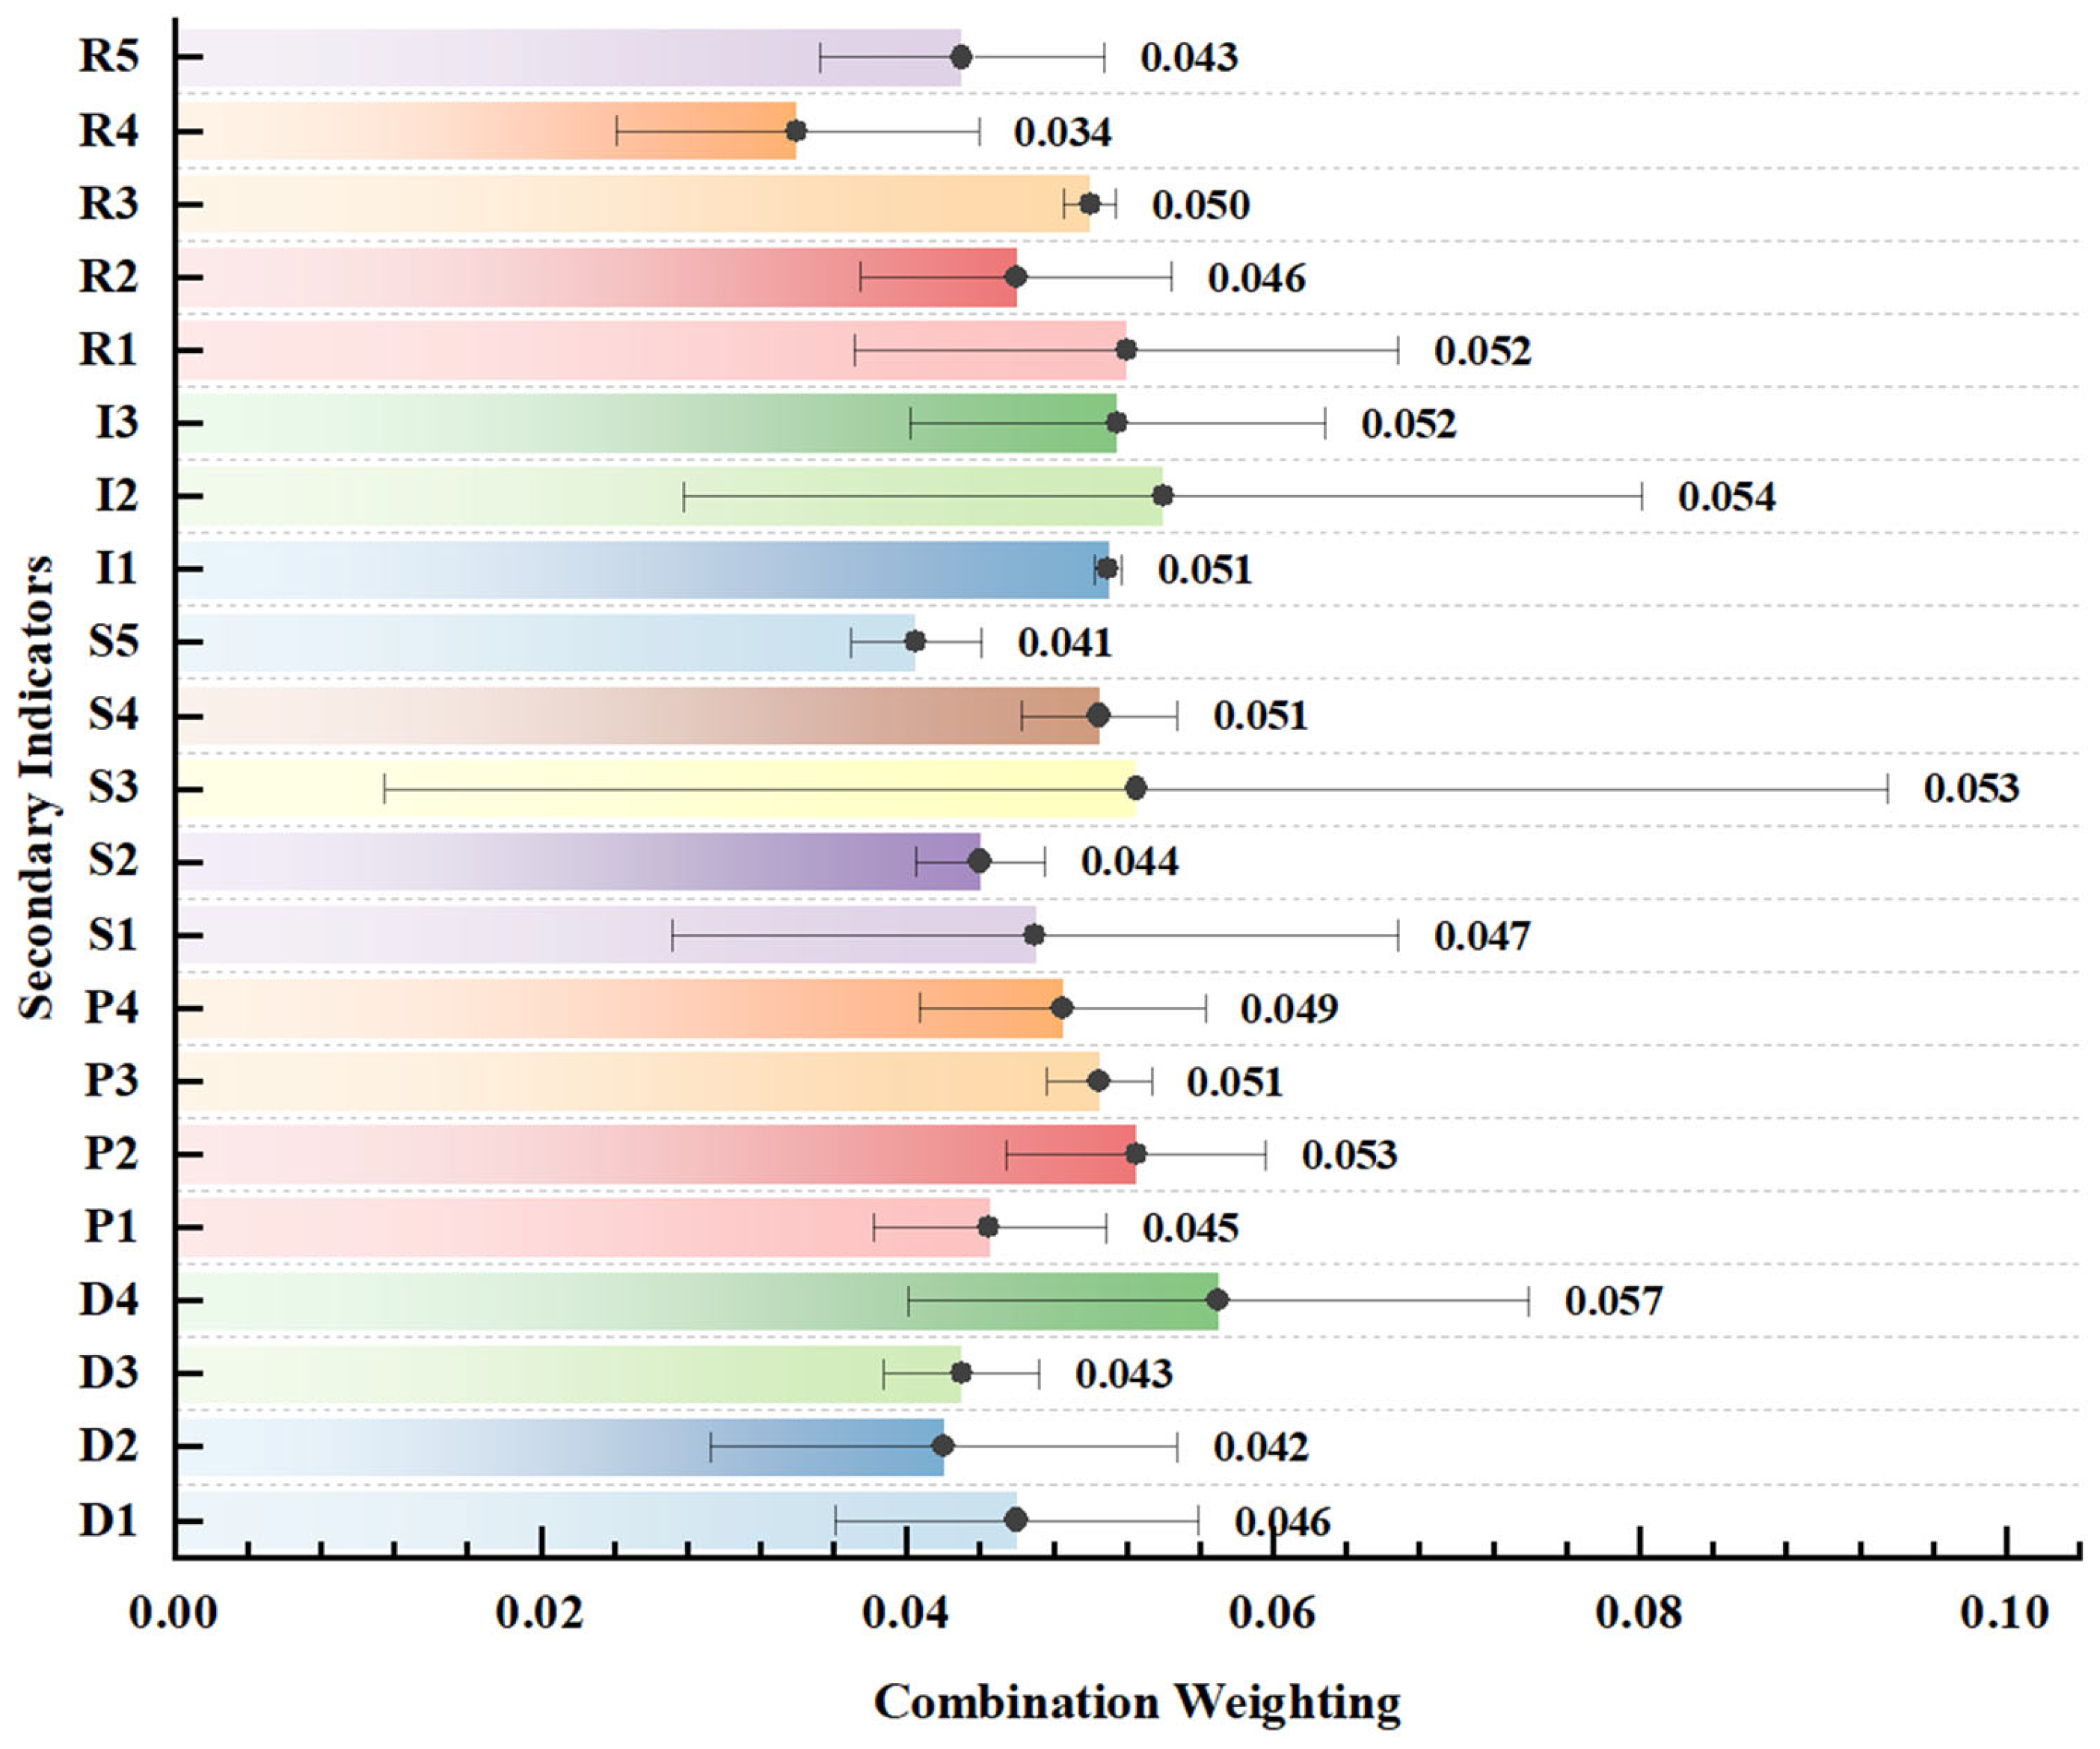
The evaluation weight system for MLER, developed through the game theory-based combined weighting method, successfully integrates the subjective value judgments of AHP with the objective information measurements of CRITIC. As shown in Figure 9, this approach effectively overcomes the limitations inherent in using a single weighting method. The system not only reconciles the discrepancies between subjective and objective weights in dimensions such as Driver (D) and Response (R) and corrects the evaluation bias in the Impact (I) dimension, but also accurately preserves the subjective-objective consensus regarding the State (S) dimension as the core of the evaluation. Crucially, this integrated method significantly enhances the weights of key indicators that are easily weakened by single methods—such as Green investment structure (D2), Stakeholder synergy (R5), and Community succession stage (S5)—thereby more comprehensively capturing the complexity and multi-dimensional correlations within mine ecological restoration systems. The final weight distribution is more balanced and robust, avoiding the partiality of subjective experience while overcoming the dependency on fluctuations in objective data. This provides a more reliable quantitative foundation for scientific assessment and decision-making.
Figure 9.
Combination Weighting.
5.2. MLER Evaluation Level Analysis
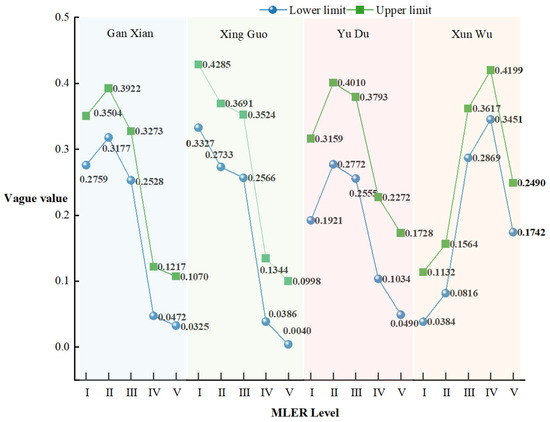
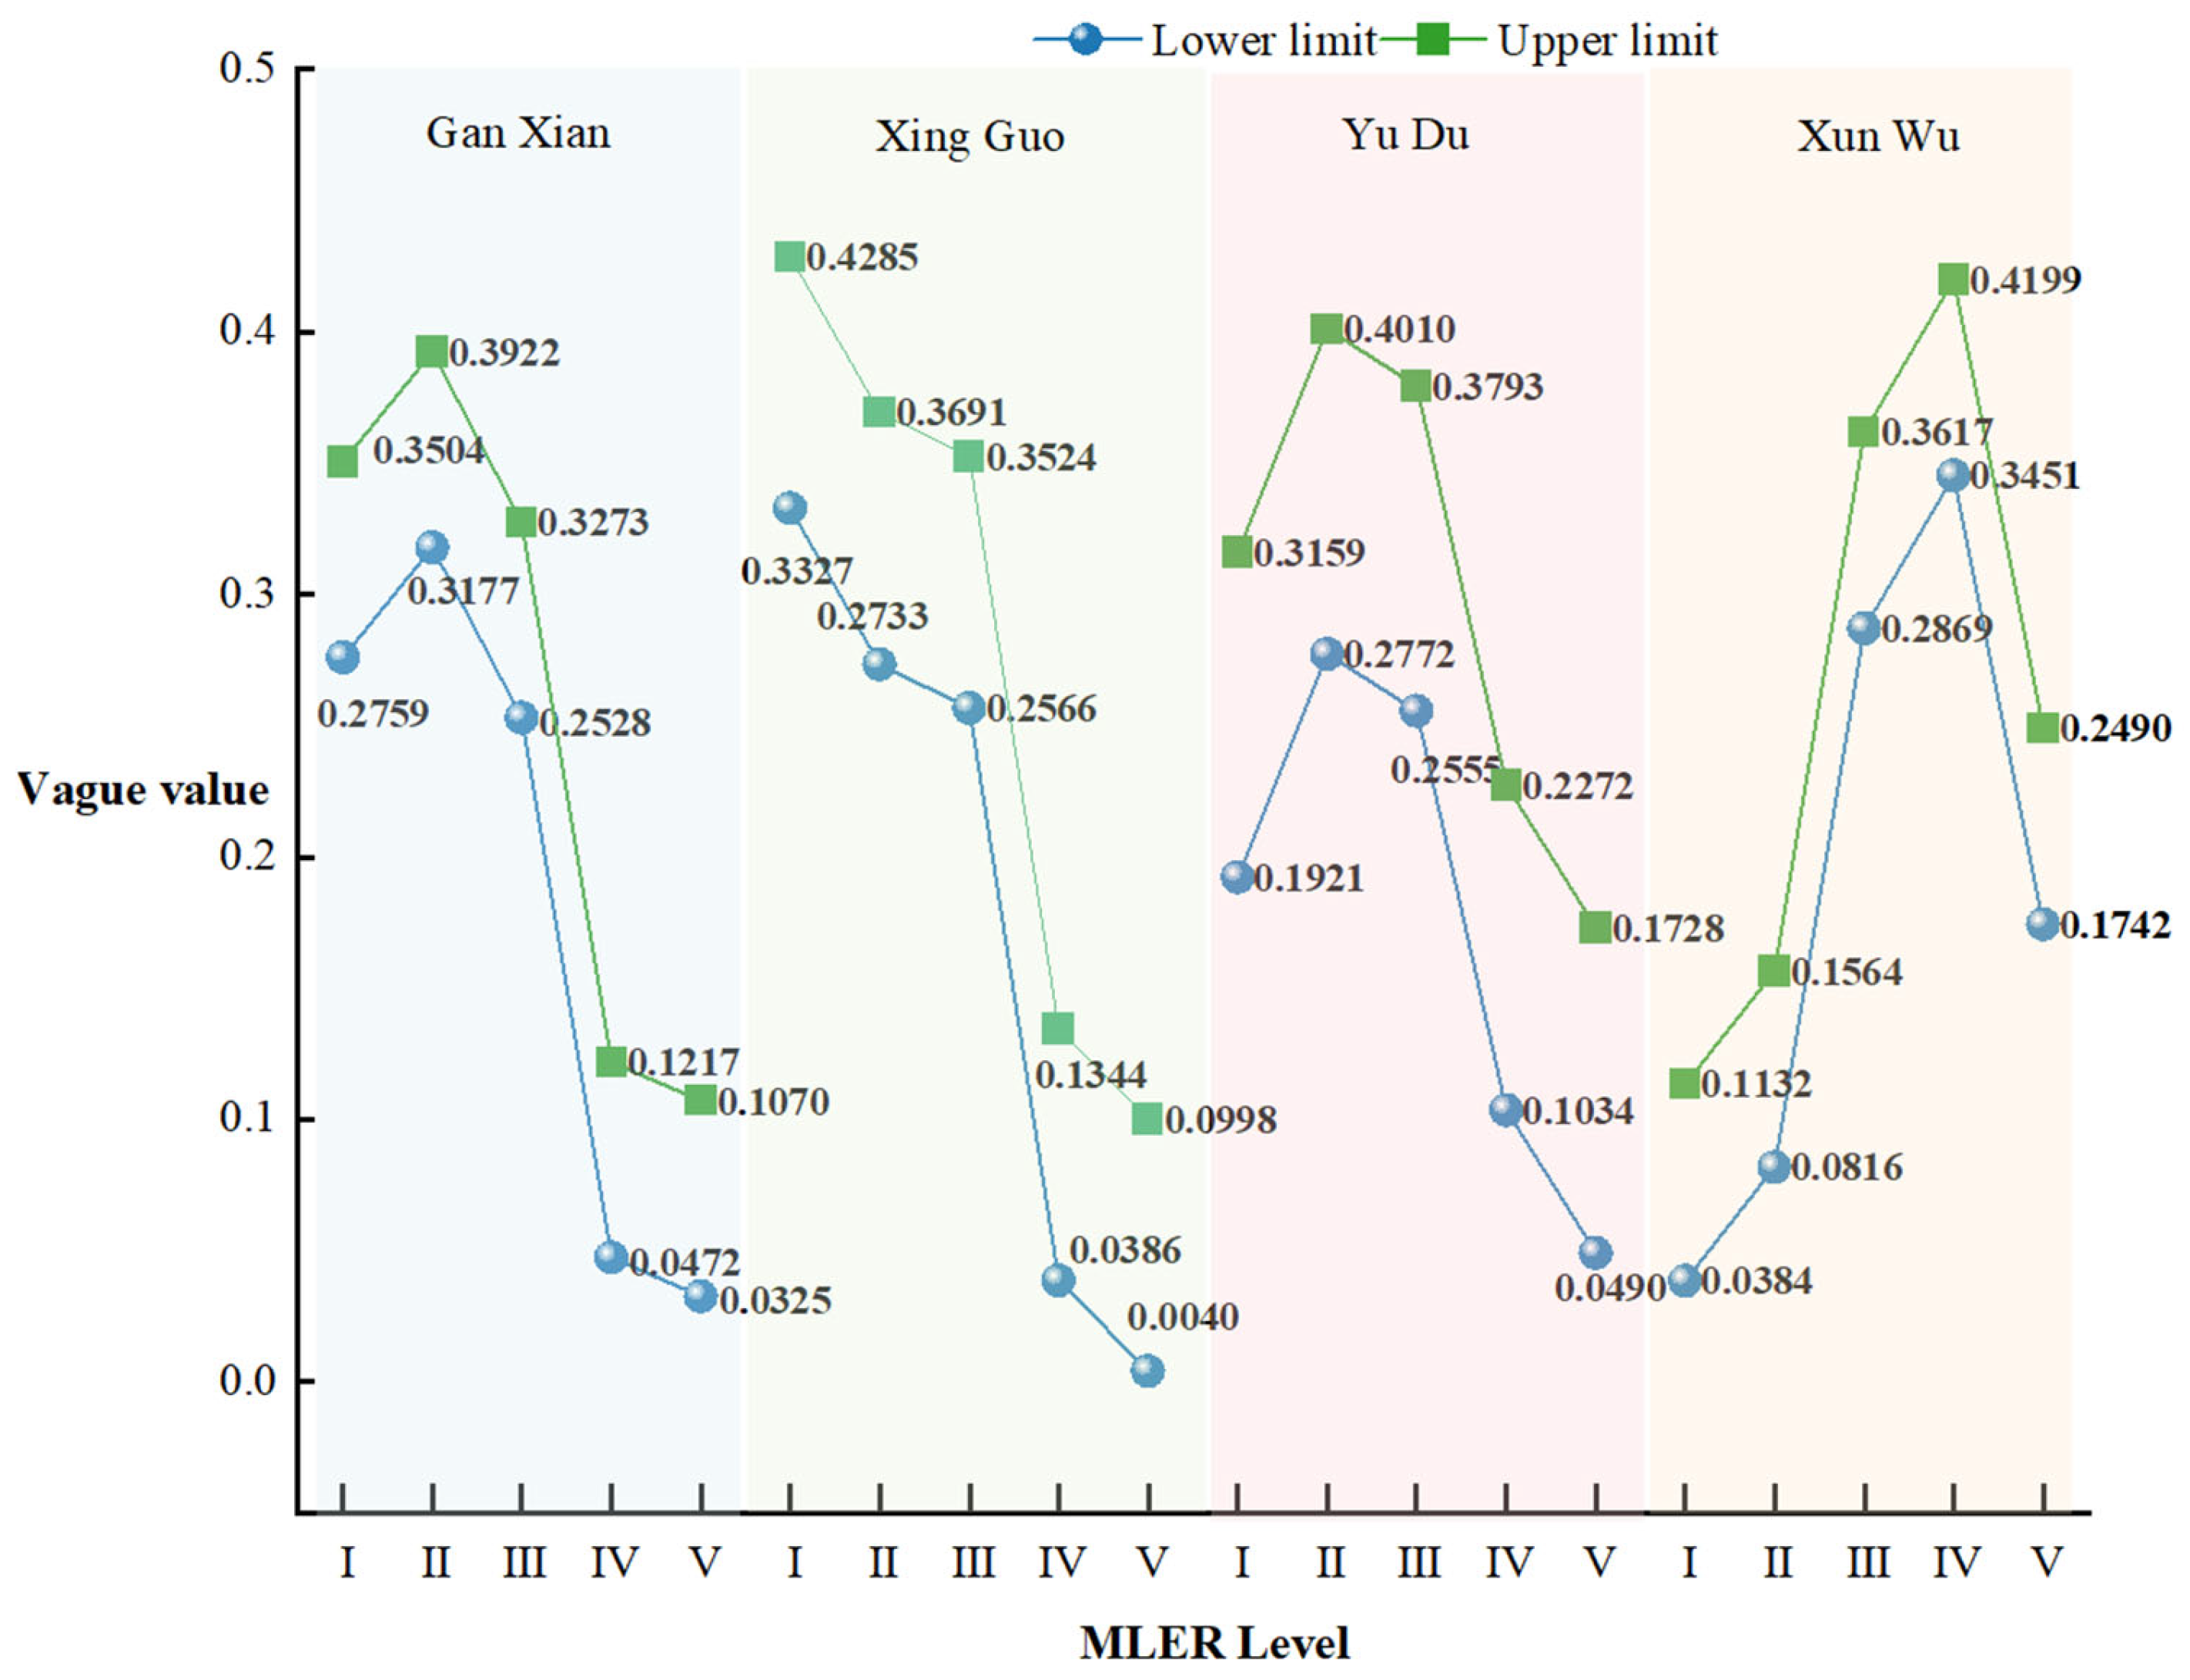
The evaluation grades of MLER in the four selected study areas exhibit distinct differentiation, as shown in Figure 10. The Xing Guo mining area is classified as I, with the highest interval membership degree of [0.3327, 0.4285]. Its ecosystem structure and functions are close to their original states, characterized by deep implementation of NbS concepts and well-established driver-response mechanisms. Both Gan Xian and Yu Du mining areas are classified as II. Specifically, Gan Xian’s “II” interval of [0.3177, 0.3922] is dominant and overlaps with the “I” interval, reflecting transitional characteristics toward higher resilience. While Yu Du’s “II” interval has the widest coverage, its stability is slightly compromised by constraints from local indicators. In contrast, the Xun Wu mining area ranks highest in the “IV” category with an interval membership of [0.3451, 0.4199], while its “I” and “II” intervals are extremely low, indicating impaired core ecological functions and insufficient integration of NbS principles. The core root of this differentiation likely lies in the varying implementation quality and systemic completeness of ecological restoration efforts across the four regions. In Gan Xian, Xing Guo, and Yu Du, mine ecological restoration has not only received sufficient investment in fundamental ecological elements like soil and vegetation but has also prioritized long-term maintenance post-restoration. Conversely, Xun Wu exhibits shortcomings in the scientific rigor and sustainability of its restoration efforts, with inadequate focus on critical links such as soil remediation depth and stable vegetation community reconstruction. This leads to a lack of numerical support for high-grade intervals and a relatively high proportion of membership in lower-grade intervals.
Figure 10.
Evaluation Level Results in the Study Area.
5.3. Recommendations for Enhancing MLER
Drawing upon domestic and international research [47,48,49,50], to systematically enhance MLER, it is essential to construct a comprehensive governance system characterized by multi-stakeholder synergy and full-process integration. From the perspective of governance responsibility, the government should adopt NbS as the core orientation to establish a closed-loop management mechanism encompassing policy formulation, technical standards, assessment supervision, and long-term incentives, specifically by issuing localized technical guidelines that incorporate core indicators like green investment structure and technology adaptability into mandatory requirements, refining cross-departmental supervision platforms to strengthen source control and pollution governance, and innovating green financial tools alongside community incentive policies to provide comprehensive institutional guarantees. As the primary entities responsible for restoration, Chinese enterprises must focus on implementing core tasks such as scientifically allocating funds toward soil and vegetation reconstruction, adopting low-cost and high-efficiency technologies suited to local conditions, promoting eco-friendly mining and full-process pollution prevention, and establishing dynamic optimization mechanisms through deepened collaboration with government, communities, and research institutions. Simultaneously, differentiated strategies should be implemented based on restoration grades: Xing Guo should focus on systematic maintenance to consolidate achievements; Gan Xian and Yu Du should prioritize optimizing vegetation structures and exploring diverse ecosystem service values like eco-tourism to promote upgrading; and Xun Wu require strict control and centralized governance, including suspending high-intensity mining and introducing rapid restoration technologies to halt degradation and swiftly improve ecological quality. Through these concerted efforts, the overall enhancement of MLER can be achieved, driving the synergistic development of green mining transitions and regional ecological civilization, while providing a practice paradigm with Chinese characteristics for global mine ecological restoration.
6. Analysis of Models
6.1. Comparative Analysis of Combined Weight Methods
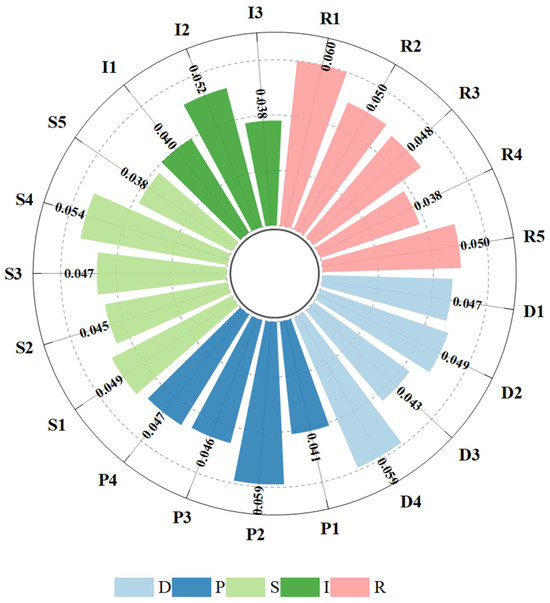
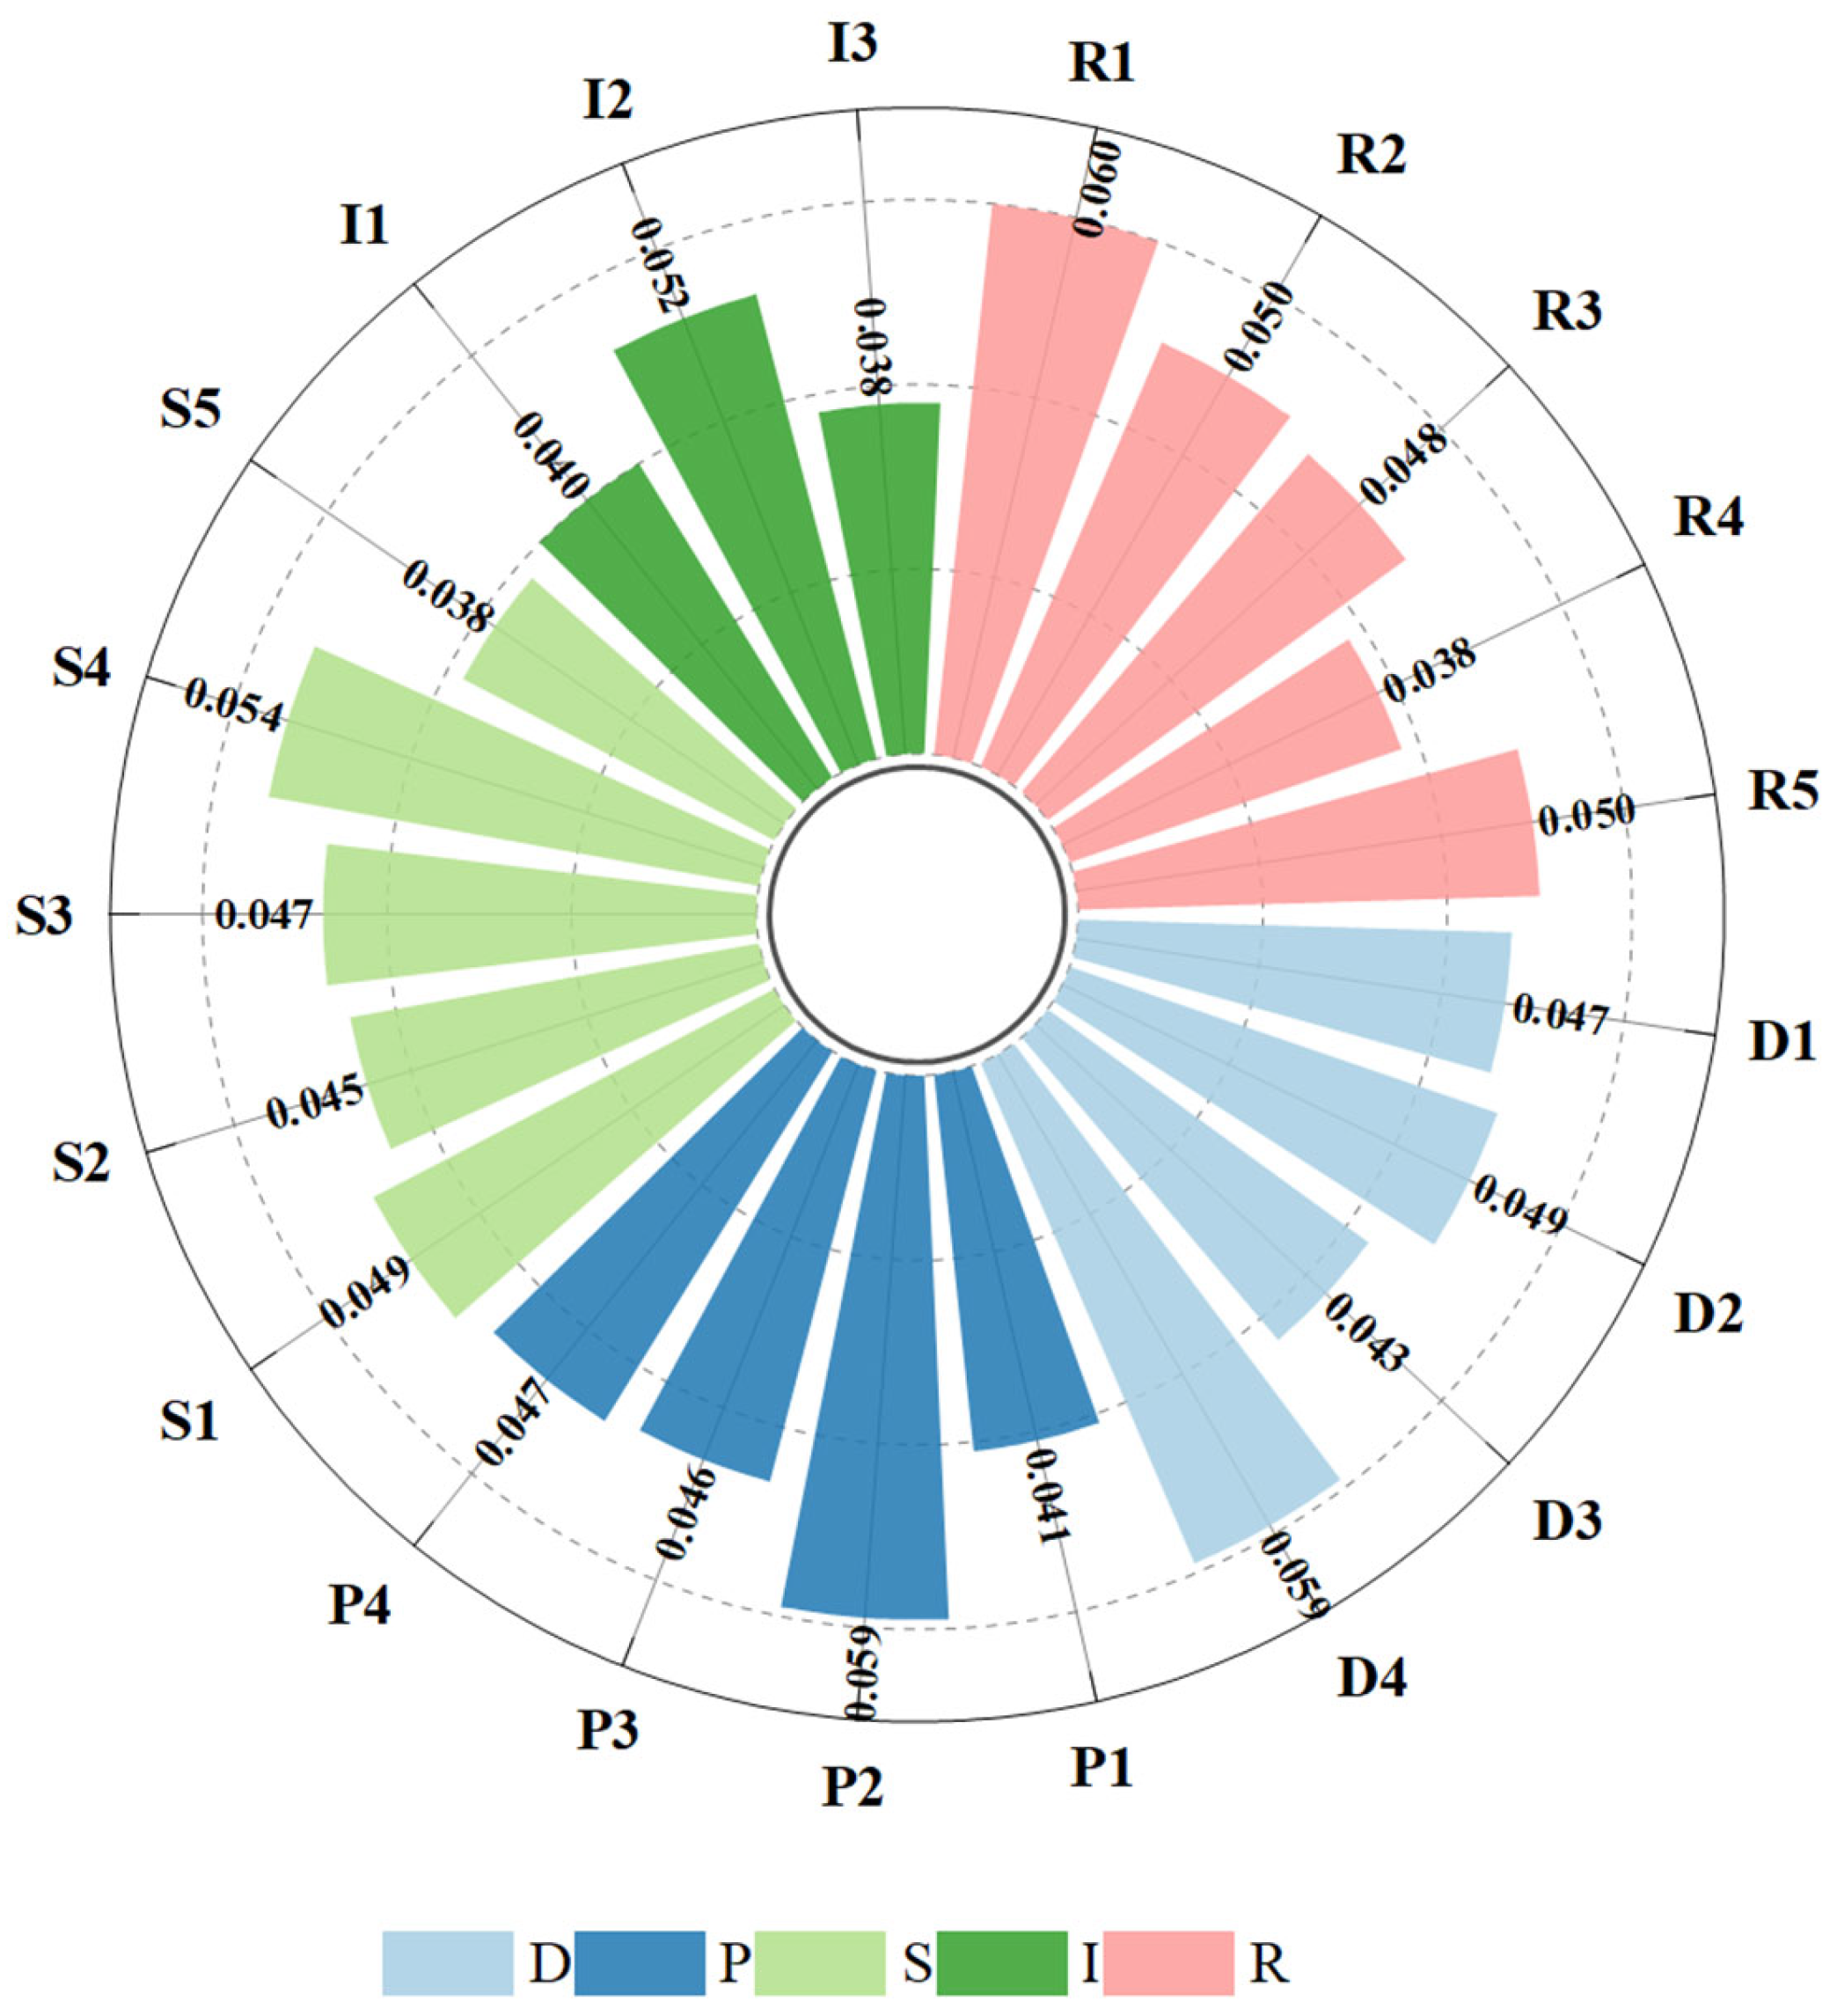
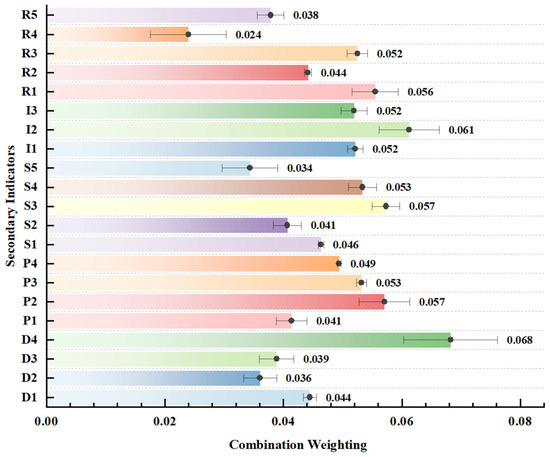
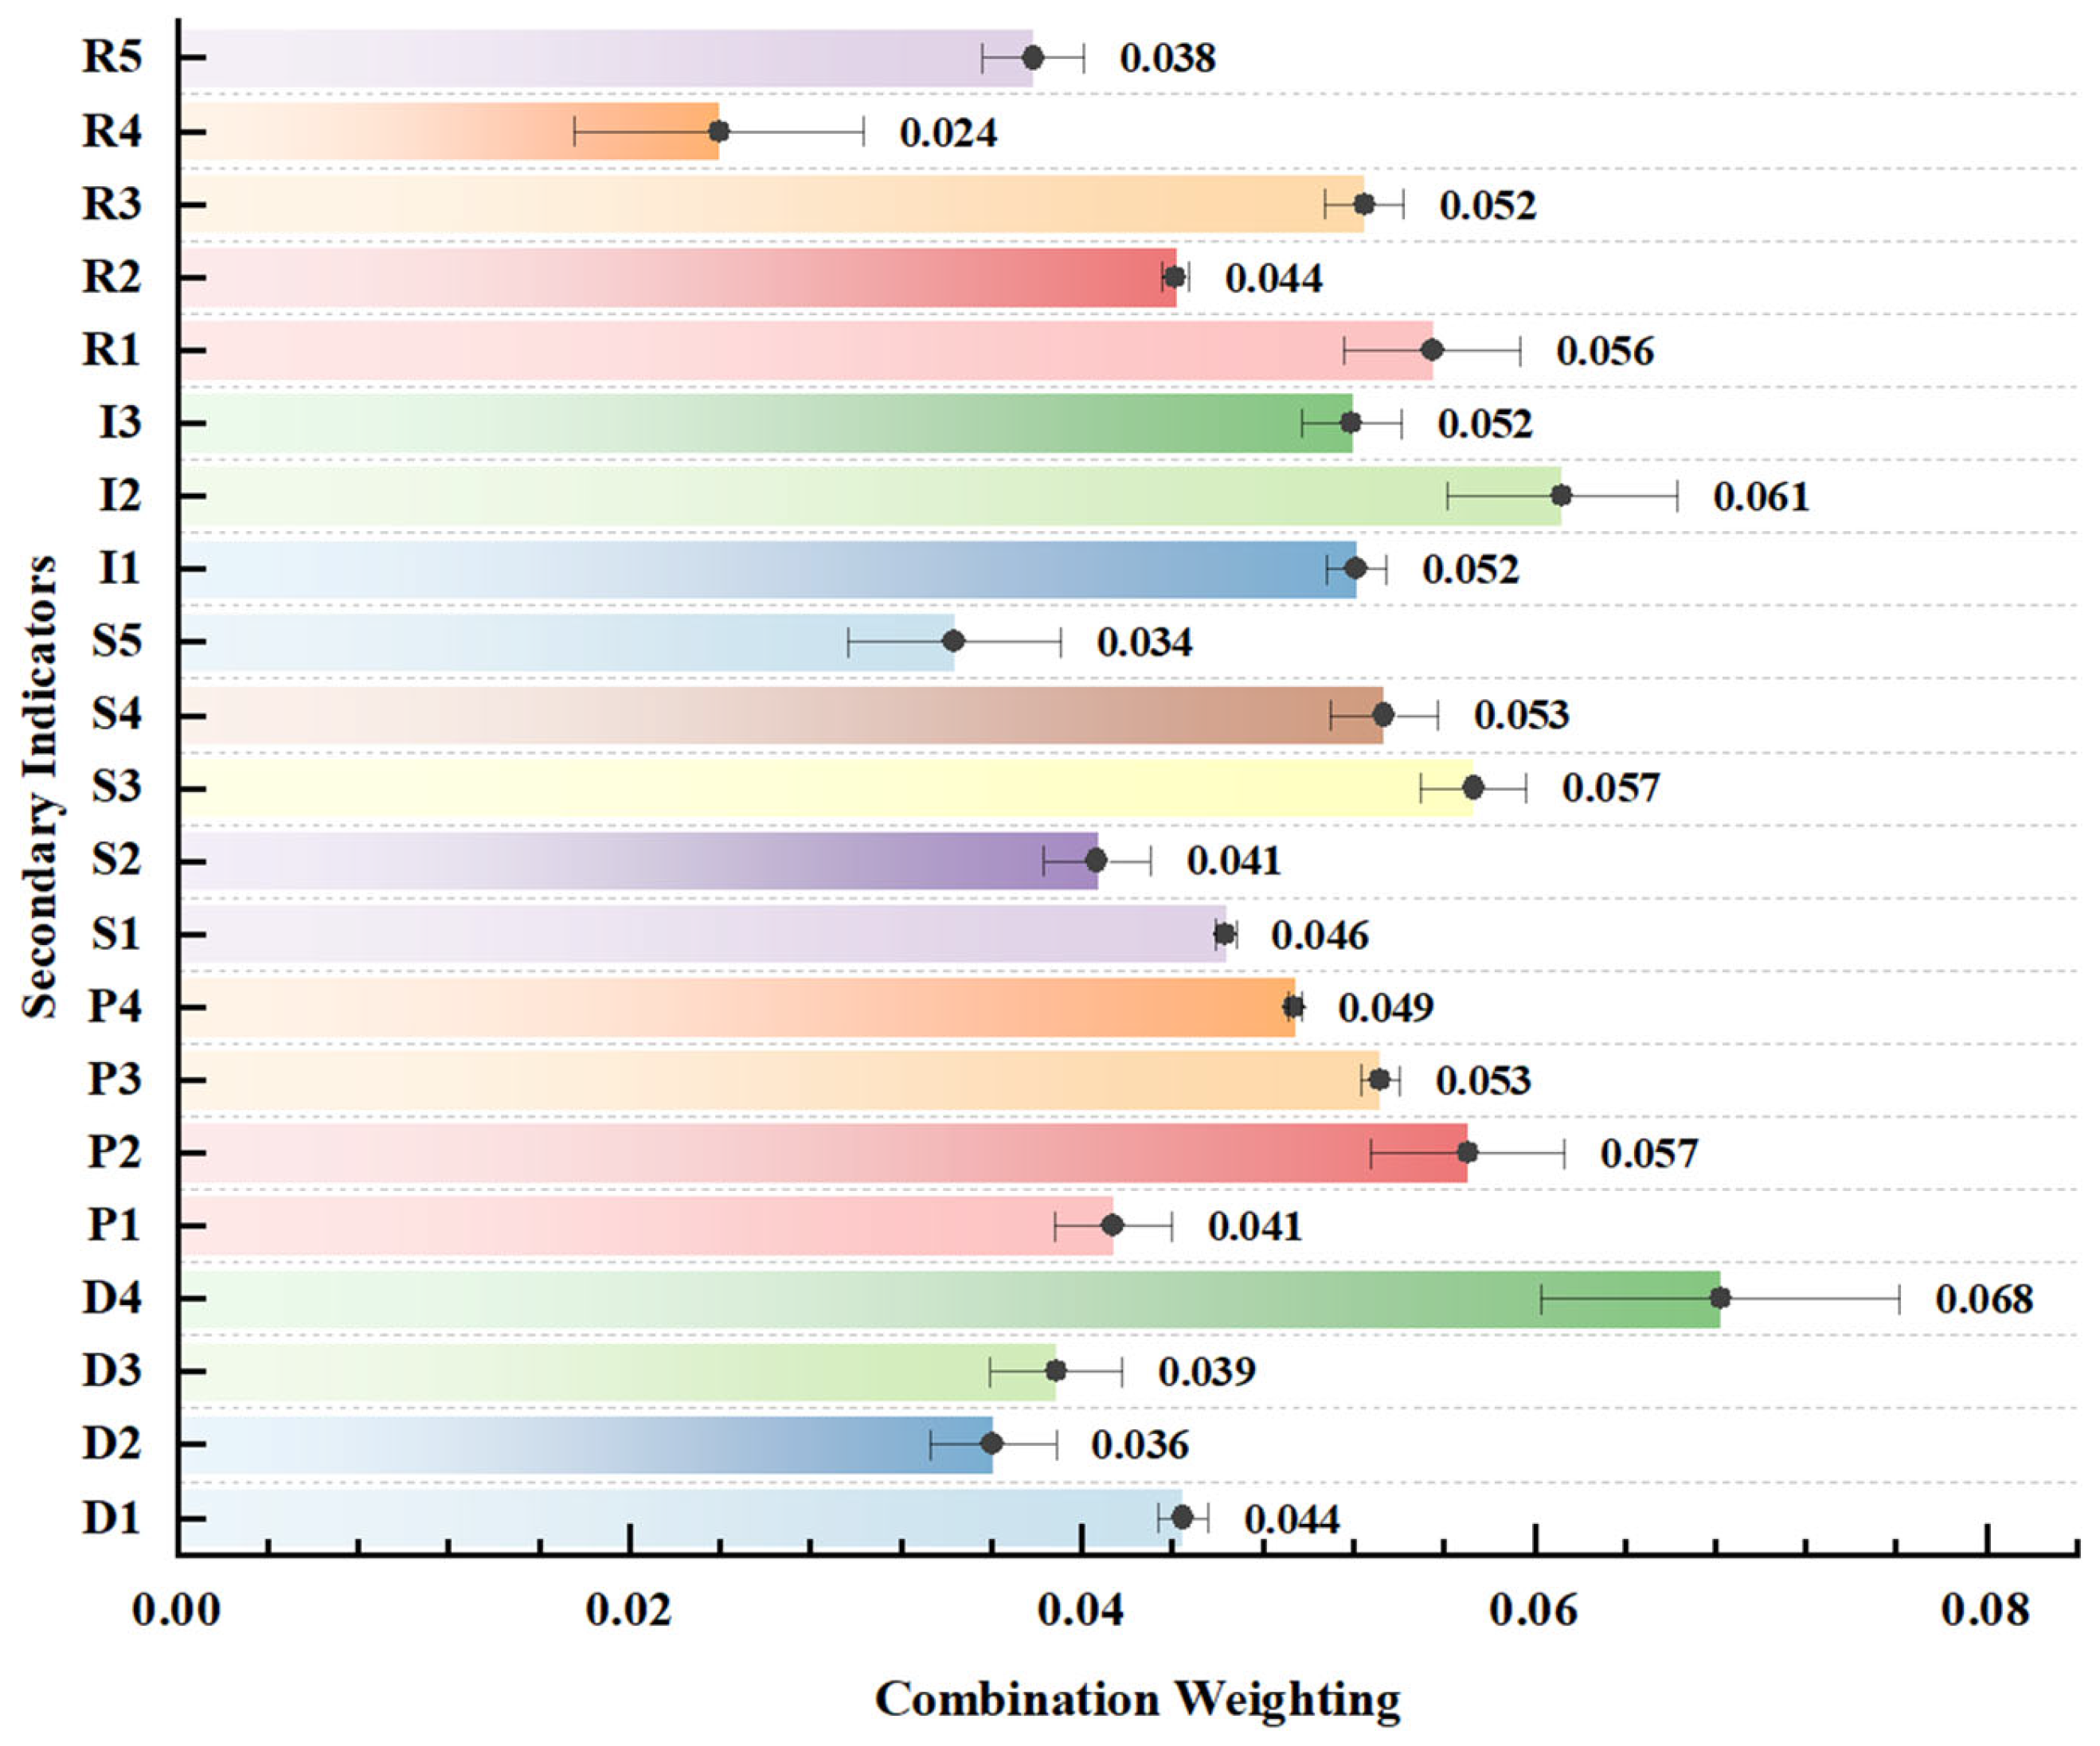
To ensure the scientific rigor and applicability of the game theory-based combined weighting method in MLER, this study conducts a comparative analysis between its weighting results and those obtained through the least squares method and the multiplicative synthesis method. The results indicate that the game theory-based approach offers distinct advantages, with specific comparisons illustrated in Figure 11 and Figure 12. The weights derived from the multiplicative synthesis method exhibit significant extreme differences; for instance, D4 (Natural adaptability of restoration technology) reaches 0.068 while R4 (GDP) is only 0.024. Such excessively high or low weights for certain indicators can easily lead to an imbalance in the evaluation focus. Although the Least Squares Method shows smaller fluctuations, it fails to sufficiently distinguish core indicators from secondary ones, as evidenced by the nearly identical weights assigned to S3 (Soil fertility level) and D3 (In-depth community participation in decision-making). In contrast, the weights generated by the game theory-based combination are concentrated within the range of 0.033–0.057, with an extreme difference of only 0.024. This distribution avoids the “over-prominence” of indicators like D4 (0.068) and I3 (0.061) seen in the multiplicative method, while also preventing the “excessive weakening” of indicators like R4 (0.024) and D2 (0.036). Consequently, the resulting weight distribution aligns more closely with the intrinsic characteristic of “multi-element synergy” within mine ecological restoration systems. Therefore, the game theory-based combined weighting method outperforms the least squares and multiplicative synthesis methods in terms of core indicator identification, secondary factor regulation, and systemic logical coordination. It demonstrates superior scientific validity and applicability, providing a more reliable weight allocation methodology for the evaluation of mine land ecological resilience.
Figure 11.
Least Squares Method.
Figure 12.
Multiplicative Synthesis Method.
6.2. Comparative Analysis of MLER Model
To verify the reliability of the Vague sets evaluation method, this study focuses on the Gan Xian mining area, comparing the Vague sets model with the traditional AHP-fuzzy comprehensive evaluation method. The results are shown in Table 9. The evaluation conclusions of the two methods are generally consistent, indicating that the Vague sets model possesses good credibility. Further comparative analysis reveals that, in MLER evaluation, the Vague sets method outperforms the AHP-fuzzy comprehensive evaluation method [51] in terms of fuzzy information expression, boundary treatment, and multi-level classification compatibility. The AHP-Fuzzy comprehensive represents the degree of support using a single membership degree II (0.348), making it difficult to capture the uncertainty and ambiguity inherent in the evaluation process. It has limitations in representing the fuzzy nature of complex systems like ecosystem restoration, as it lacks the dimensionality needed to address such strong fuzzy objects. In terms of boundary treatment, the Vague sets method has a significant advantage, as it can more accurately reflect the continuous transition characteristics of ecosystem restoration capacity. In particular, in the grade classification of the sample, there was an overlapping range (0.3177–0.3504) between the “I” interval [0.2759, 0.3504] and the “II” interval [0.3177, 0.3922], which truly reflected the membership attribution characteristics of the sample between adjacent grades. In contrast, the AHP-Fuzzy comprehensive expressed the membership degree of each grade with discrete values, ignored the continuity of grade boundaries, and was prone to causing misjudgment of boundary samples. In conclusion, the Vague sets method, as an extension of fuzzy sets theory, is well-suited to the evaluation needs of mining ecosystems as a “natural-socio-economic” complex system. When handling indicators that include both quantitative monitoring and qualitative judgment, it can balance the objectivity of the data with the fuzziness of the judgments, overcoming the subjective bias introduced by linear weighting and manually set membership functions in the AHP-Fuzzy comprehensive. The Vague sets method excels over the traditional AHP-Fuzzy comprehensive evaluation method in terms of information completeness, boundary continuity, and multi-level classification capability, making it more suitable for fuzzy comprehensive evaluation of complex systems like MLER. It provides a more scientifically reliable model foundation for such research.
Table 9.
Comparative Analysis of Model.
6.3. Limitations of Comprehensive Evaluation Model Based on Vague Sets
The comprehensive evaluation model based on Vague sets constructed in this study effectively achieves the scientific quantification and practical assessment of MLER. However, several directions for deepening and refining the model remain regarding functional expansion and multi-scenario applicability. In terms of characterizing dynamic processes and non-linear relationships, since the model is built on static data, it can complete fundamental evaluations but struggles to accurately depict temporal ecological processes and non-linear response mechanisms. Future research could explore the introduction of time-series Vague sets models to characterize state evolution by dynamically adjusting membership functions, or couple the model with machine learning methods such as neural networks to better fit the complex non-linear relationships between indicators, thereby enhancing the model’s ability to represent dynamic system behavior and abrupt response changes. Furthermore, regarding cross-regional and cross-mineral applicability, the current model’s construction and validation are primarily based on samples from non-ferrous metal mining areas in the humid regions of Southern China. It has not yet systematically covered mining areas with different climatic backgrounds and deposit types, such as coal mines in arid regions or salt lake mines on high-altitude plateaus; thus, its universality and robustness require broader validation. In practical applications, the evaluation indicator system must undergo localized calibration and optimization based on regional physical geographical conditions and baseline ecological characteristics. For instance, in arid and semi-arid mining regions of Northern China, indicators such as “soil moisture retention capacity” and “vegetation windbreak and sand-fixation efficiency” should be prioritized. Conversely, in ecologically fragile areas like plateau salt lakes, emphasis must be placed on key factors such as “soil salinization degree,” “groundwater depth and mineralization,” and “restoration effectiveness of salt-tolerant plants.” These adjustments will ensure the evaluation system possesses greater regional specificity and ecological relevance
7. Conclusions
This study, based on the Vague sets and the principles of NbS, constructs a MLER evaluation model, and conducts an empirical study using four counties in Ganzhou City, Jiangxi Province as case studies. The following conclusions are drawn:
- (1)
- Guided by the NbS concept, a MLER evaluation indicator system is developed, which integrates NbS criteria with the DPSIR framework. This system includes 21 secondary indicators across five dimensions—drivers, pressure, state, impact, and response—breaking through the traditional limitation of focusing on short-term restoration while neglecting long-term sustainability. It achieves a “restoration—social adaptation—economic feasibility” sustainable goal, providing a targeted evaluation tool for ecological restoration in mining areas.
- (2)
- This research proposes a coupled evaluation model utilizing AHP-CRITIC game theory-based combined weighting and Vague sets, with the sustainable philosophy of NbS at its core. The combined weighting approach achieves a balance between subjective and objective weights through game theory, while the Vague sets effectively accommodate fuzzy information and data gaps within the evaluation process. By characterizing the continuous transitional features between different restoration levels through interval-based membership degrees, the Vague sets transcend the limitations of traditional discrete classification. This provides a scientific tool for the quantitative evaluation of the complex system that is mine ecological resilience.
- (3)
- The empirical research in four mining areas of Jiangxi Province validates the effectiveness of the NbS-guided evaluation model and reveals significant differences in ecological restoration capacity across the areas. The results show that Xing Guo mining areas have a “I” level of MLER, the Gan Xian and Yu Du mining areas have a “II” level of MLER, while the Xun Wu mining area is rated as “IV,” providing a scientific basis for the localization of the NbS concept and the formulation of differentiated restoration strategies.
- (4)
- This study verifies the applicability of the Vague sets in evaluating MLER, yet certain limitations remain. First, as the model is constructed based on static data, it is challenging to accurately depict long-term dynamic processes, such as the accumulation of soil fertility and vegetation succession. Second, the validation samples are concentrated in non-ferrous metal mining areas in the humid regions of Southern China, meaning the model’s universality for coal mines in northern arid regions and salt lake mines on high-altitude plateaus requires further improvement. Future research should introduce time-series Vague sets to optimize dynamic characterization and update the indicator system in alignment with regional ecological conditions, thereby further expanding the application scenarios of the model.
Author Contributions
L.F.: data curation, writing—original draft, and formal analysis. J.X.: writing—review and editing. Y.K.: conceptualization, resources, formal analysis, validation, writing—review and editing, supervision. All authors have read and agreed to the published version of the manuscript.
Funding
The research was funded by the Key Basic RESEARCH Project of Yichun Science and Technology Special Fund (No. 2023ZDJCYJ05).
Institutional Review Board Statement
Not applicable.
Informed Consent Statement
Not applicable.
Data Availability Statement
The data used to support the findings of this study are available from the corresponding author upon request.
Acknowledgments
The authors would also like to thank the reviewers for commenting on this paper.
Conflicts of Interest
The authors declare that they have no known competing financial interests or personal relationships that could have appeared to influence the work reported in this paper.
References
- Xiao, W.; Chen, W.; Deng, X. Coupling and Coordination of Coal Mining Intensity and Social-Ecological Resilience in China. Ecol. Indic. 2021, 131, 108167. [Google Scholar] [CrossRef] [Scilit]
- Yang, Y.; Erskine, P.D.; Zhang, S.; Wang, Y.; Bian, Z.; Lei, S. Effects of Underground Mining on Vegetation and Environmental Patterns in a Semi-Arid Watershed with Implications for Resilience Management. Environ. Earth Sci. 2018, 77, 605. [Google Scholar] [CrossRef] [Scilit]
- Wu, Z.; Lei, S.; Yan, Q.; Bian, Z.; Lu, Q. Landscape Ecological Network Construction Controlling Surface Coal Mining Effect on Landscape Ecology: A Case Study of a Mining City in Semi-Arid Steppe. Ecol. Indic. 2021, 133, 108403. [Google Scholar] [CrossRef] [Scilit]
- Moghimi Dehkordi, M.; Pournuroz Nodeh, Z.; Soleimani Dehkordi, K.; Salmanvandi, H.; Rasouli Khorjestan, R.; Ghaffarzadeh, M. Soil, Air, and Water Pollution from Mining and Industrial Activities: Sources of Pollution, Environmental Impacts, and Prevention and Control Methods. Results Eng. 2024, 23, 102729. [Google Scholar] [CrossRef] [Scilit]
- Deng, X.; Xiao, W.; Guo, J. Ecological Resilience Study in Mining Area: Current Status and Future Trends. Int. J. Coal Sci. Technol. 2025, 12, 67. [Google Scholar] [CrossRef] [Scilit]
- Yuan, Y.; Bai, Z.; Zhang, J.; Xu, C. Increasing Urban Ecological Resilience Based on Ecological Security Pattern: A Case Study in a Resource-Based City. Ecol. Eng. 2022, 175, 106486. [Google Scholar] [CrossRef] [Scilit]
- McKenna, P.B.; Lechner, A.M.; Phinn, S.; Erskine, P.D. Remote Sensing of Mine Site Rehabilitation for Ecological Outcomes: A Global Systematic Review. Remote Sens. 2020, 12, 3535. [Google Scholar] [CrossRef] [Scilit]
- Junxia, T.; Meng, S.; Xuanyun, Z.; Shichao, Z.; Juan, H.E. Ecological benefit evaluation of limestone gravel mine ecologic virescence project based on concept of Nature-based Solutions. Agric. Eng. 2025, 15, 123–131. [Google Scholar] [CrossRef]
- Xia, S.; Yang, W.; Tan, S. Evaluation of Ecological Rehabilitation Models for Abandoned Mines Using Analytic Hierarchy Process–Entropy Method and Sustainable Development Strategies. Sustainability 2024, 16, 10668. [Google Scholar] [CrossRef] [Scilit]
- Pan, Y.; Jiao, S.; Hu, J.; Guo, Q.; Yang, Y. An Ecological Resilience Assessment of a Resource-Based City Based on Morphological Spatial Pattern Analysis. Sustainability 2024, 16, 6476. [Google Scholar] [CrossRef] [Scilit]
- Xie, L.; Li, P.; Mu, D. Spatial Distribution, Source Apportionment and Potential Ecological Risk Assessment of Trace Metals in Surface Soils in the Upstream Region of the Guanzhong Basin, China. Environ. Res. 2023, 234, 116527. [Google Scholar] [CrossRef] [Scilit] [PubMed]
- Duan, Y.; Xiong, J.; Cheng, W.; Wang, N.; Li, Y.; He, Y.; Liu, J.; He, W.; Yang, G. Flood Vulnerability Assessment Using the Triangular Fuzzy Number-Based Analytic Hierarchy Process and Support Vector Machine Model for the Belt and Road Region. Nat. Hazards 2022, 110, 269–294. [Google Scholar] [CrossRef] [Scilit]
- Jiskani, I.M.; Zhou, W.; Hosseini, S.; Wang, Z. Mining 4.0 and Climate Neutrality: A Unified and Reliable Decision System for Safe, Intelligent, and Green & Climate-Smart Mining 4.0. J. Clean. Prod. 2023, 410, 137313. [Google Scholar] [CrossRef] [Scilit]
- Tayyab, M.; Hussain, M.; Zhang, J.; Ullah, S.; Tong, Z.; Rahman, Z.U.; Al-Aizari, A.R.; Al-Shaibah, B. Leveraging GIS-Based AHP, Remote Sensing, and Machine Learning for Susceptibility Assessment of Different Flood Types in Peshawar, Pakistan. J. Environ. Manag. 2024, 371, 123094. [Google Scholar] [CrossRef] [Scilit] [PubMed]
- Li, S.; Xiao, W.; Zhao, Y.; Lv, X. Incorporating Ecological Risk Index in the Multi-Process MCRE Model to Optimize the Ecological Security Pattern in a Semi-Arid Area with Intensive Coal Mining: A Case Study in Northern China. J. Clean. Prod. 2020, 247, 119143. [Google Scholar] [CrossRef] [Scilit]
- Nabukonde, A.; Barakagira, A.; Akwango, D. The Use of Geographical Information System (GIS) and Remote Sensing (RS) Technologies in Generation of Information Used to Mitigate Risks from Landslide Disasters: An Application Review. Arch. Curr. Res. Int. 2023, 23, 43–49. [Google Scholar] [CrossRef] [Scilit]
- Xu, W.; Wang, J.; Zhang, M.; Li, S. Construction of Landscape Ecological Network Based on Landscape Ecological Risk Assessment in a Large-Scale Opencast Coal Mine Area. J. Clean. Prod. 2021, 286, 125523. [Google Scholar] [CrossRef] [Scilit]
- Li, Y.; Zhao, G.; Wu, P.; Qiu, J. An Integrated Gray DEMATEL and ANP Method for Evaluating the Green Mining Performance of Underground Gold Mines. Sustainability 2022, 14, 6812. [Google Scholar] [CrossRef] [Scilit]
- Härdle, W.K.; Simar, L.; Fengler, M.R. Principal Component Analysis. In Applied Multivariate Statistical Analysis; Springer International Publishing: Cham, The Netherlands, 2024; pp. 309–345. ISBN 978-3-031-63832-9. [Google Scholar]
- Zhao, L.; Xie, H.; Cheng, L.; Sun, Z.; Li, X.; Yuan, Q. A New Method for Small Current Grounding Fault Line Selection Based on Fuzzy Entropy Weight Vague Set. Electr. Technol. Econ. 2024, 165–170. [Google Scholar]
- Yang, D.; Tsai, W.-T. Linear Consensus Protocol Based on Vague Sets and Multi-Attribute Decision-Making Methods. Electronics 2024, 13, 2461. [Google Scholar] [CrossRef] [Scilit]
- Hu, N.; Wang, M. An Effective Distance Measurement Formula Based on FuzzySet Theory. J. Hefei Univ. (Compr. Ed.) 2024, 41, 22–27. [Google Scholar]
- Kahraman, C.; Alkan, N.; Istanbul Technical University, Industrial Engineering Department. Circular Intuitionistic Fuzzy TOPSIS Method with Vague Membership Functions: Supplier Selection Application Context. Notes Intuitionistic Fuzzy Sets 2021, 27, 24–52. [Google Scholar] [CrossRef] [Scilit]
- Zhang, B.; Gai, Y.; Lu, Y. Comprehensive evaluation of high-speed railway station operation safetybased on IEM-Vague sets theory. China Saf. Sci. J. 2017, 27, 164–169. [Google Scholar] [CrossRef]
- Shan, R.; Wang, C.; Chen, X. Research on Emergency Rescue Capability of Coal Mine Based on Vague Set Theory. Coal Technol. 2016, 35, 320–321. [Google Scholar] [CrossRef]
- Yi, X. Method Improvement of Construction Project Risk EvaluationBased on ANP and Vague Sets Theory. J. East China Jiaotong Univ. 2013, 30, 9–15. [Google Scholar]
- Seddon, N.; Chausson, A.; Berry, P.; Girardin, C.A.J.; Smith, A.; Turner, B. Understanding the Value and Limits of Nature-Based Solutions to Climate Change and Other Global Challenges. Philos. Trans. R. Soc. B 2020, 375, 20190120. [Google Scholar] [CrossRef] [Scilit]
- Seddon, N.; Smith, A.; Smith, P.; Key, I.; Chausson, A.; Girardin, C.; House, J.; Srivastava, S.; Turner, B. Getting the Message Right on Nature-based Solutions to Climate Change. Glob. Change Biol. 2021, 27, 1518–1546. [Google Scholar] [CrossRef] [Scilit]
- Fischer, S.; Mörth, C.; Rosqvist, G.; Chalov, S.R.; Efimov, V.; Jarsjö, J. Microbial Sulfate Reduction (MSR) as a Nature-Based Solution (NBS) to Mine Drainage: Contrasting Spatiotemporal Conditions in Northern Europe. Water Resour. Res. 2022, 58, e2021WR031777. [Google Scholar] [CrossRef] [Scilit]
- Yongjun, Y.; Shaoliang, Z.; Huping, H.O.U.; Fu, C. Resilience mechanism of land ecosystem in mining area based on nonlinear dynamic model. Mtxb 2019, 44, 3174–3184. [Google Scholar] [CrossRef]
- Xu, H.; Waheed, A.; Kuerban, A.; Muhammad, M.; Aili, A. Dynamic Approaches to Ecological Restoration in China’s Mining Regions: A Scientific Review. Ecol. Eng. 2025, 214, 107577. [Google Scholar] [CrossRef] [Scilit]
- Jia, M.X.; Wang, J.M.; Li, Y.N.; Zhang, Y.F.; Gao, Y.T.; Wu, D.W. Ecological restoration of mines based on Nature-based Solution: A review. Coal Sci. Technol. 2024, 52, 209–221. [Google Scholar]
- Hong, L.; Feng, S.; Li, P.; Wang, A. Ecological Restoration and Regeneration Strategies for the Gumi Mountain Mining Area in Wuhan Guided by Nature-Based Solution (NbS) Concepts. Sustainability 2025, 17, 1913. [Google Scholar] [CrossRef] [Scilit]
- Koval, V.; Kryshtal, H.; Udovychenko, V.; Soloviova, O.; Froter, O.; Kokorina, V.; Veretin, L. Review of Mineral Resource Management in a Circular Economy Infrastructure. Min. Miner. Depos. 2023, 17, 61–70. [Google Scholar] [CrossRef] [Scilit]
- Wang, X.; Ke, Y.; Zhang, Q.; Luo, Y. Mining method optimization of transition from open pitto underground mining based on AHP-TOPSIS. J. Guangxi Univ. Nat. Sci. Ed. 2012, 37, 1273–1279. [Google Scholar] [CrossRef]
- Ke, Y.; Wang, C.; Fang, L.; Liao, B. Mine Safety Production Status Evaluation Based on Combination Weight and Matter Element Analysis. Gold Sci. Technol. 2020, 28, 910–919. [Google Scholar]
- Saaty, R.W. The Analytic Hierarchy Process—What It Is and How It Is Used. Math. Model. 1987, 9, 161–176. [Google Scholar] [CrossRef] [Scilit]
- Zhao, R.; Fang, C.; Liu, H.; Liu, X. Evaluating Urban Ecosystem Resilience Using the DPSIR Framework and the ENA Model: A Case Study of 35 Cities in China. Sustain. Cities Soc. 2021, 72, 102997. [Google Scholar] [CrossRef] [Scilit]
- Young, R.E.; Gann, G.D.; Walder, B.; Liu, J.; Cui, W.; Newton, V.; Nelson, C.R.; Tashe, N.; Jasper, D.; Silveira, F.A.O.; et al. International Principles and Standards for the Ecological Restoration and Recovery of Mine Sites. Restor. Ecol. 2022, 30, e13771. [Google Scholar] [CrossRef] [Scilit]
- Jiang, Y.; Li, H.; Zhang, Z.; Ren, G.; Zhang, J. Enhancing Ecological Sustainability in Ion-Adsorption Rare Earth Mining Areas: A Multi-Scale Model for Assessing Spatiotemporal Dynamics and Ecological Resilience. Ecol. Model. 2025, 502, 111038. [Google Scholar] [CrossRef] [Scilit]
- Xie, J.; Liu, Y.; Xie, M.; Xia, L.; Yang, R.; Li, J. Exploring the Restoration Stability of Abandoned Open-Pit Mines by Vegetation Resilience Indicator Based on the LandTrendr Algorithm. Ecol. Indic. 2024, 166, 112392. [Google Scholar] [CrossRef] [Scilit]
- Huang, L.; Erskine, P.; Parry, D.; Roddy, B.; Tibbett, M.; Fourie, A.B.; Boggs, G. Transforming Engineering into Ecological Engineering for Developing Resilient Ecosystems on Mined Landscapes; Australian Centre for Geomechanics: Crawley, Australia, 2022; pp. 29–48. [Google Scholar]
- Chen, Z.; Yang, Y.; Zhou, L.; Hou, H.; Zhang, Y.; Liang, J.; Zhang, S. Ecological Restoration in Mining Areas in the Context of the Belt and Road Initiative: Capability and Challenges. Environ. Impact Assess. Rev. 2022, 95, 106767. [Google Scholar] [CrossRef] [Scilit]
- Wen, C.; Qian, Y.; Wu, C.; Qiu, Y.; Cheng, W.U. Application of Spatial Analytical Methods to Nature-based Solutions: Review of Research Progress. South Archit. 2023, 6, 86–95. [Google Scholar]
- Hu, H.; Yang, L.; Li, J.; Su, L.; Feng, C. Evaluating the Performance of Nature-Based Solutions in Urban regeneration: A Case Study of the Shibalidian Area, Chaoyang District, Beijing. City Plan. Rev. 2025, 49, 97–107. [Google Scholar]
- Ganzhou Government. Ganzhou Statistical Yearbook 2024; China Statistics Press: Beijing, China, 2024. [Google Scholar]
- Zine, H.; Hakkou, R.; Papazoglou, E.G.; Elmansour, A.; Abrar, F.; Benzaazoua, M. Revegetation and Ecosystem Reclamation of Post-Mined Land: Toward Sustainable Mining. Int. J. Environ. Sci. Technol. 2024, 21, 9775–9798. [Google Scholar] [CrossRef] [Scilit]
- Du, L.; Hou, Y.; Zhong, S.; Qu, K. Identification of Priority Areas for Ecological Restoration in Coal Mining Areas with a High Groundwater Table Based on Ecological Security Pattern and Ecological Vulnerability. Sustainability 2024, 16, 159. [Google Scholar] [CrossRef] [Scilit]
- Ma, X.; Zhang, J.; Guo, L.; Yang, L.; Wang, J. Traps and improvements of PSR model: An eco-environmental perspective. Acta Ecol. Sin. 2024, 44, 4923–4932. [Google Scholar] [CrossRef]
- Begentayev, M.M.; Kuldeev, Y.I.; Nurpeissova, M.B.; Nurpeisova, T.B.; Kirgizbaeva, D.M. The Role of Environmental and Industrial Safety during Subsoil Development. Eng. J. Satbayev Univ. 2025, 147, 42–48. [Google Scholar] [CrossRef] [Scilit]
- Zhu, L. Research and Application of AHP-Fuzzy Comprehensive Evaluation Model. Evol. Intell. 2022, 15, 2403–2409. [Google Scholar] [CrossRef] [Scilit]

Disclaimer/Publisher’s Note: The statements, opinions and data contained in all publications are solely those of the individual author(s) and contributor(s) and not of MDPI and/or the editor(s). MDPI and/or the editor(s) disclaim responsibility for any injury to people or property resulting from any ideas, methods, instructions or products referred to in the content. |
© 2025 by the authors. Licensee MDPI, Basel, Switzerland. This article is an open access article distributed under the terms and conditions of the Creative Commons Attribution (CC BY) license.