
Integrating AHP and GIS for Sustainable Surface Water Planning: Identifying Vulnerability to Agricultural Diffuse Pollution in the Guachal River Watershed

 , , , and
Abstract
1. Introduction
2. Theoretical Foundation and Related Work
2.1. Agricultural Diffuse Pollution
2.2. Multi-Criteria Decision Making (MCDM)
2.3. Other Multicriteria Analysis Methods
2.4. Adaptability of AHP-GIS Frameworks for Surface Water Assessment
2.5. Case Studies
3. Methods
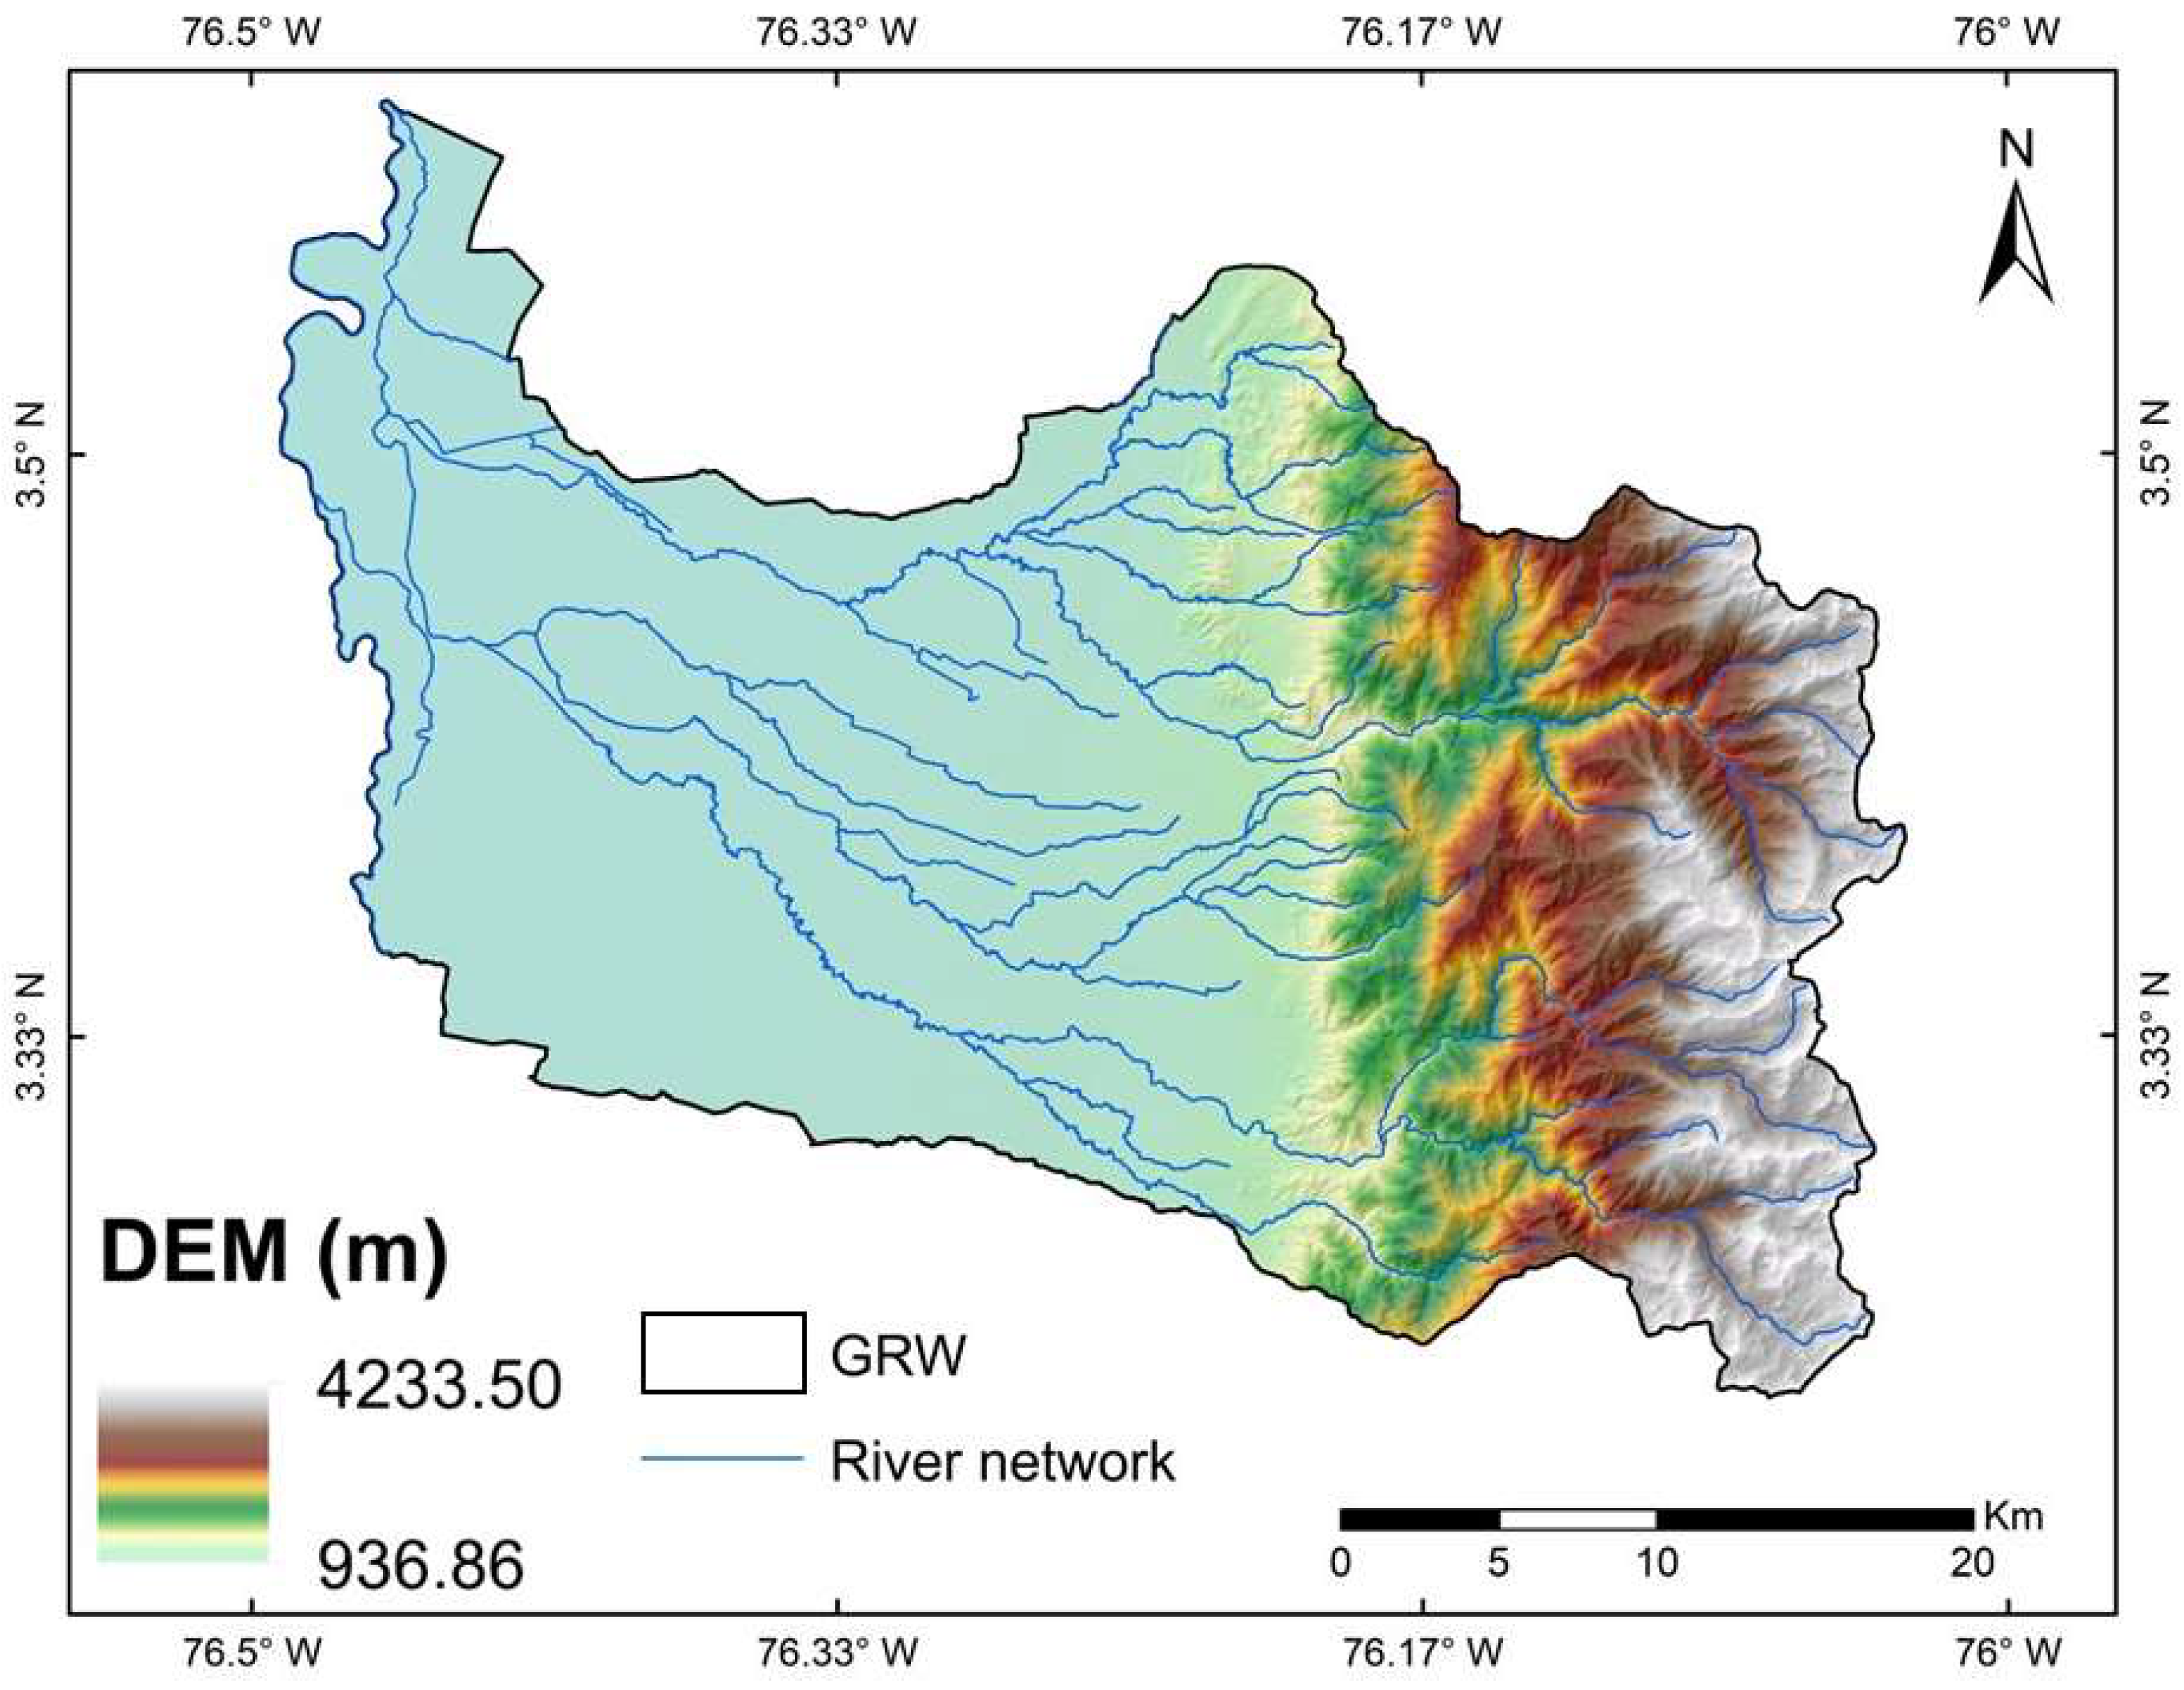
3.1. Study Area
3.2. Development of the IIVDC
- Structured MCDM: AHP provides a hierarchical framework to integrate heterogeneous spatial datasets (slope, land use, connectivity) with stakeholder priorities, aligning with the need for participatory decision-making in sustainability planning. Unlike graph theory, which focuses on network topology (e.g., clustering nodes in structured doubly stochastic graphs), AHP explicitly weights criteria based on their relative importance to water vulnerability, a critical requirement for prioritization in land use governance.
- Data Constrains and Interpretability: Deep learning approaches like capsule attention networks require large-labeled datasets for training, which are unavailable in many developing regions like the GRW. AHP’s reliance on expert elicitation and pairwise comparisons make it robust in data-limited contexts while maintaining interpretability for stakeholders—a key advantage over “black-box” neural networks.
- Spatial Explicitness vs. Feature Learning: While graph theory could model hydrological connectivity as a network, and deep learning could extract complex patterns from hyperspectral data, neither inherently combines biophysical parameters with human judgment. The AHP-GIS framework bridges this gap by embedding expert-derived weights into spatially continuous vulnerability maps, enabling direct translation of results into watershed management actions.
3.2.1. Selection of Vulnerability Parameters
3.2.2. Parameter Definition, Classification, and Normalization
3.2.3. Spatial Operationalization and Normalization of Parameters
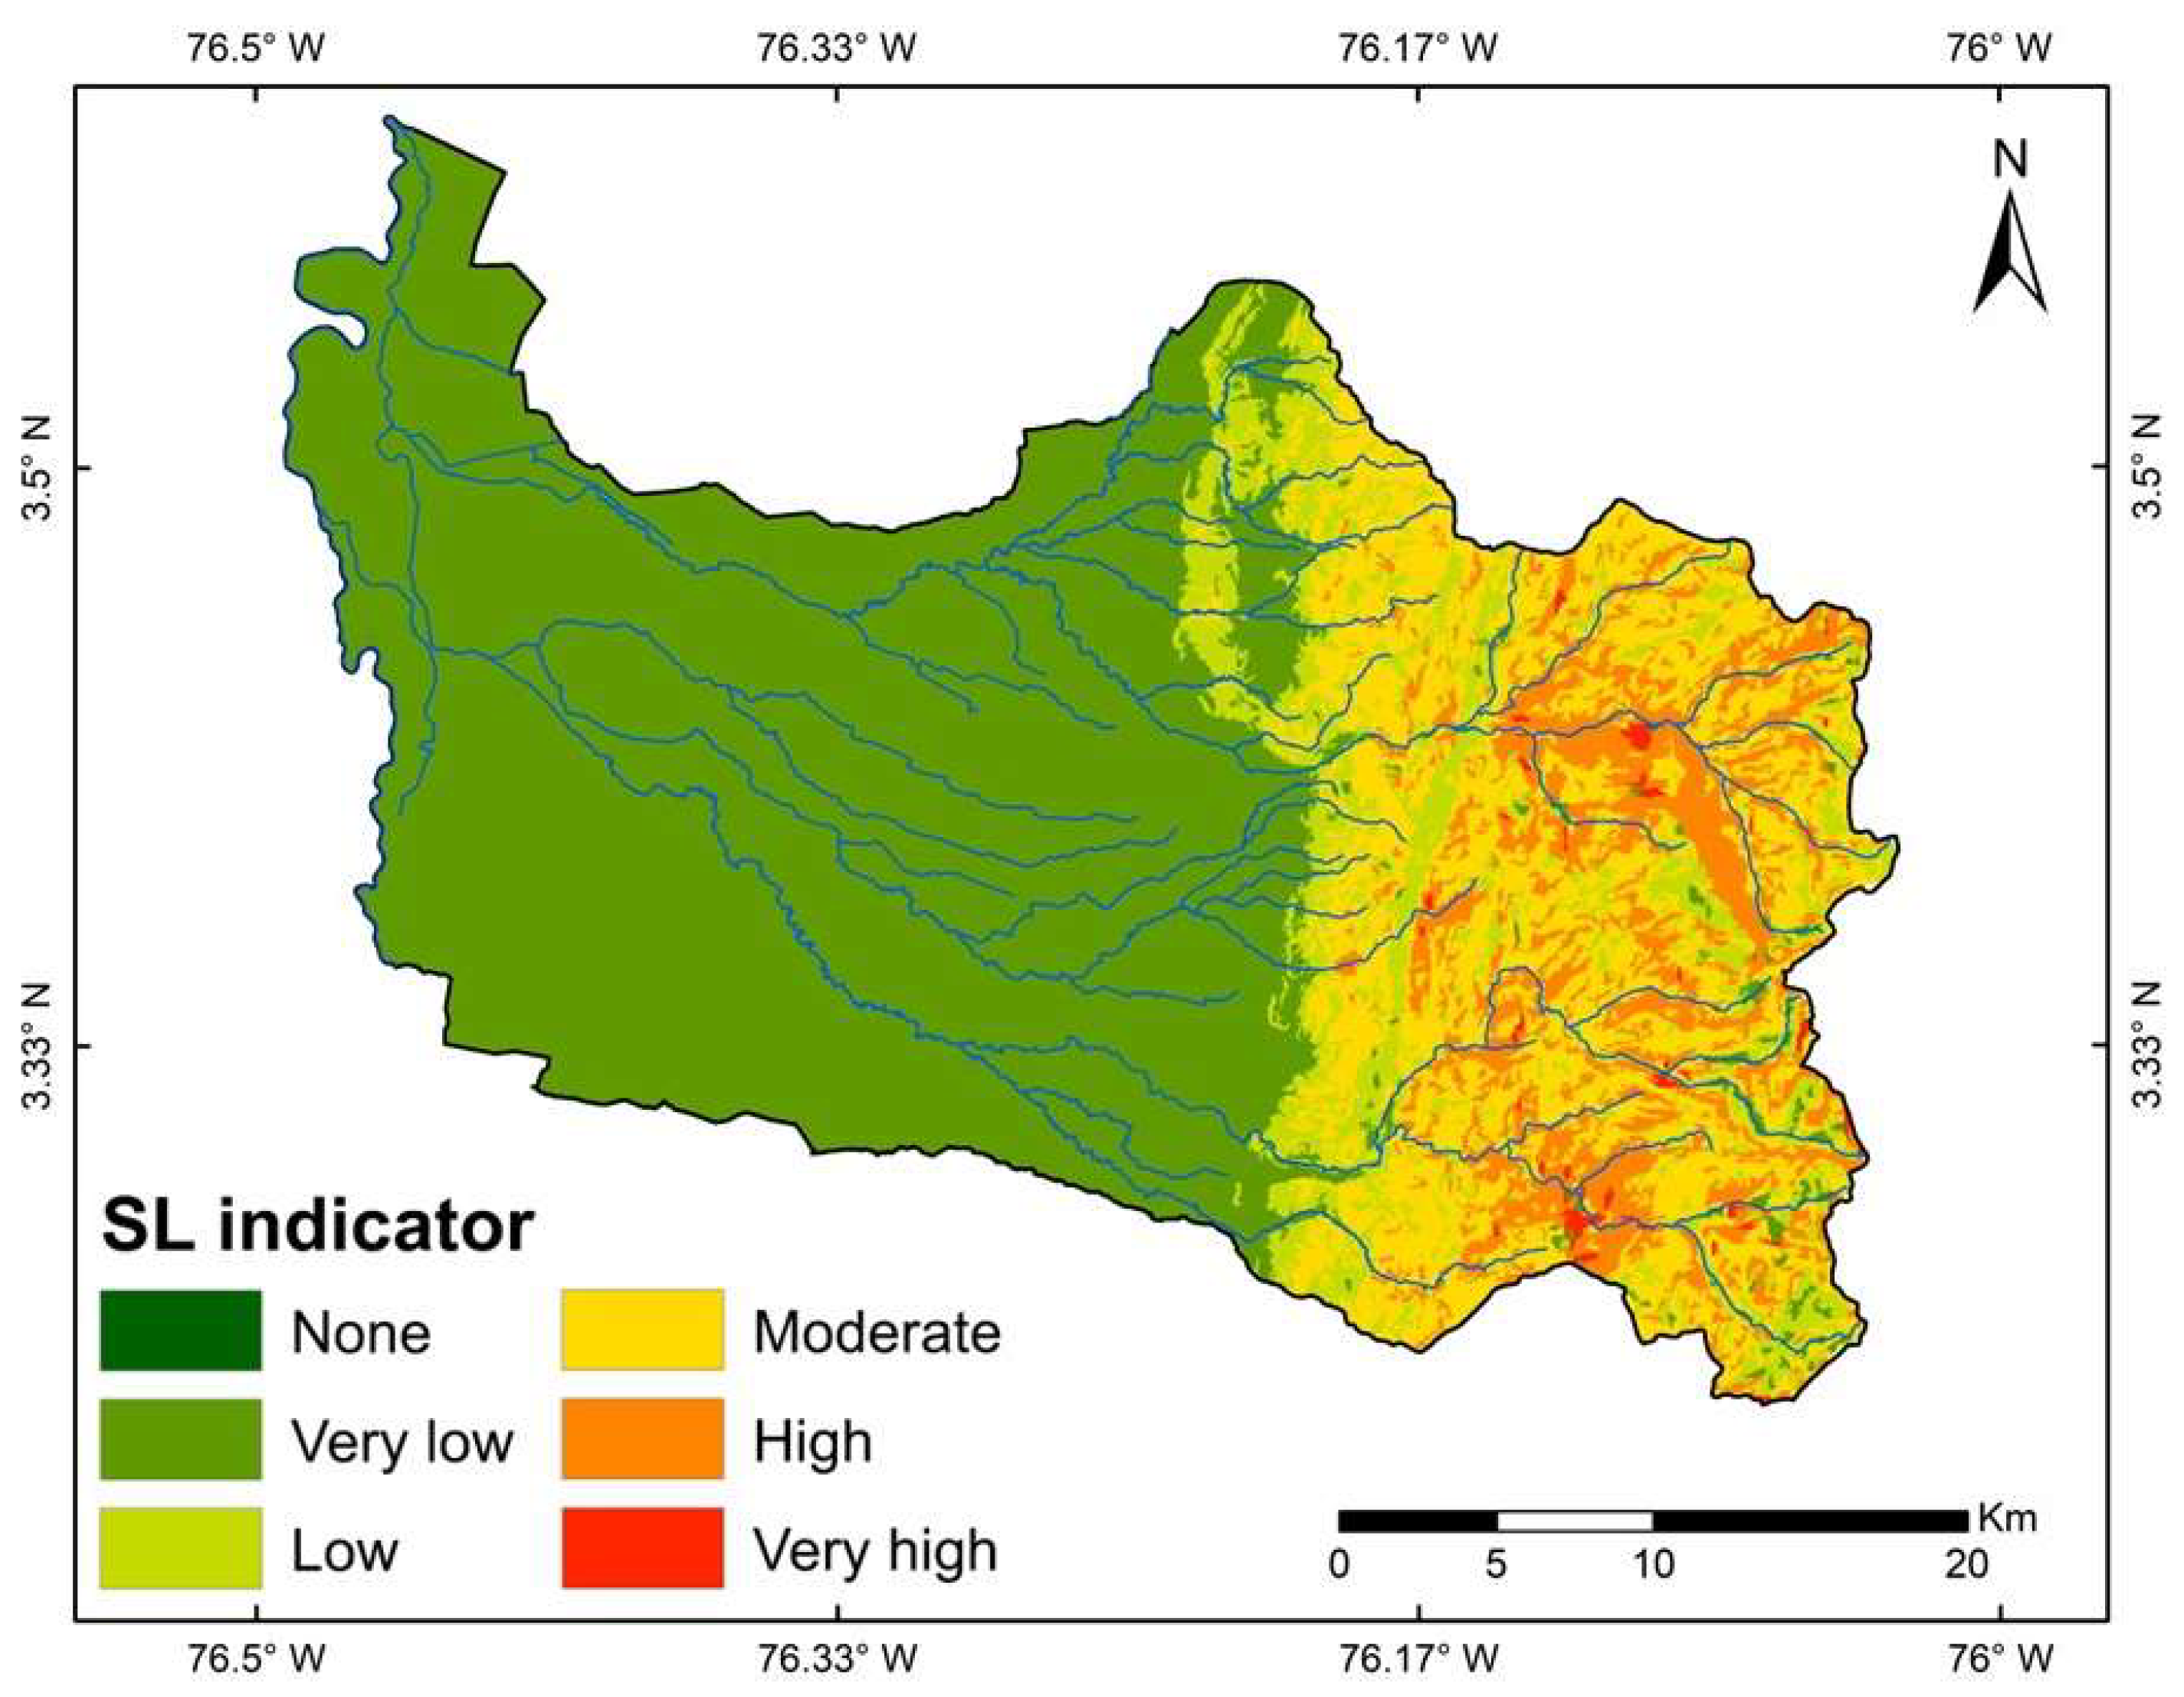
- SL: Derived from a 30 m DEM and categorized into seven vulnerability classes following [135]. Steeper slopes were associated with higher vulnerability due to increased runoff velocity and erosion potential.
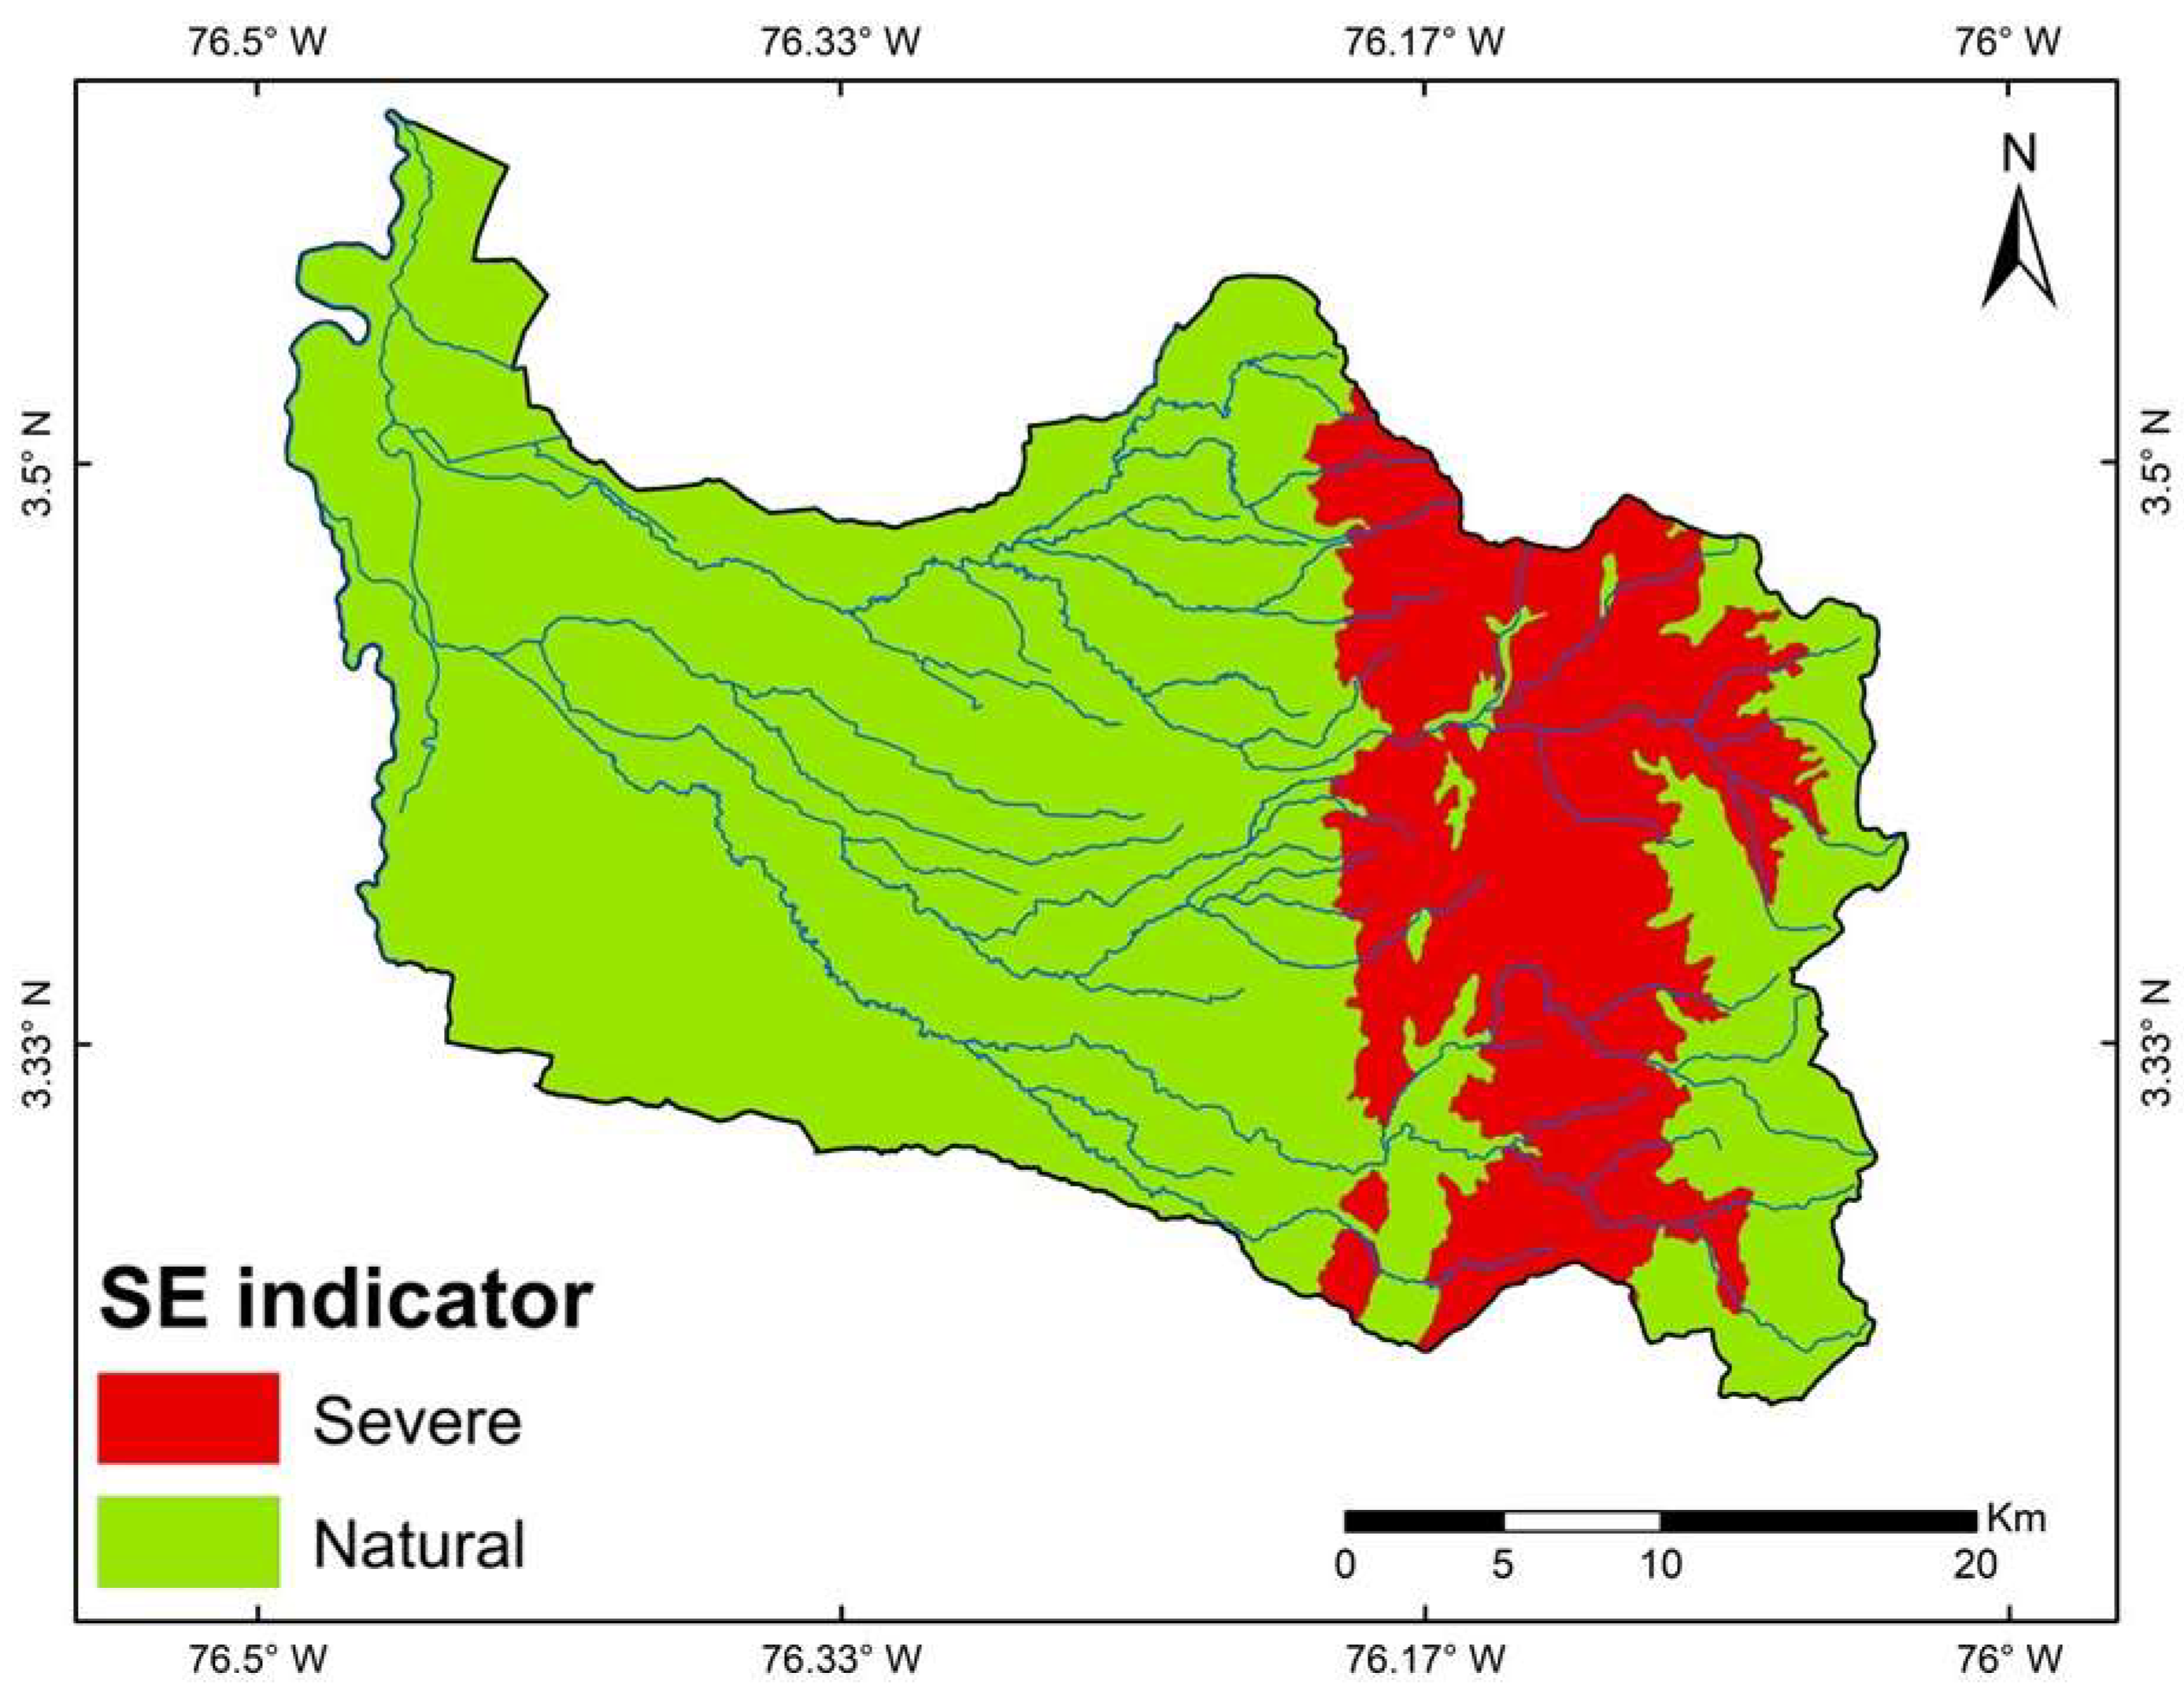
- SE: Calculated using the USDA equation for the K-factor based on soil texture and OMC. Reclassified based on sediment detachment potential. Detailed calculation steps and values are included in Supplementary S2.
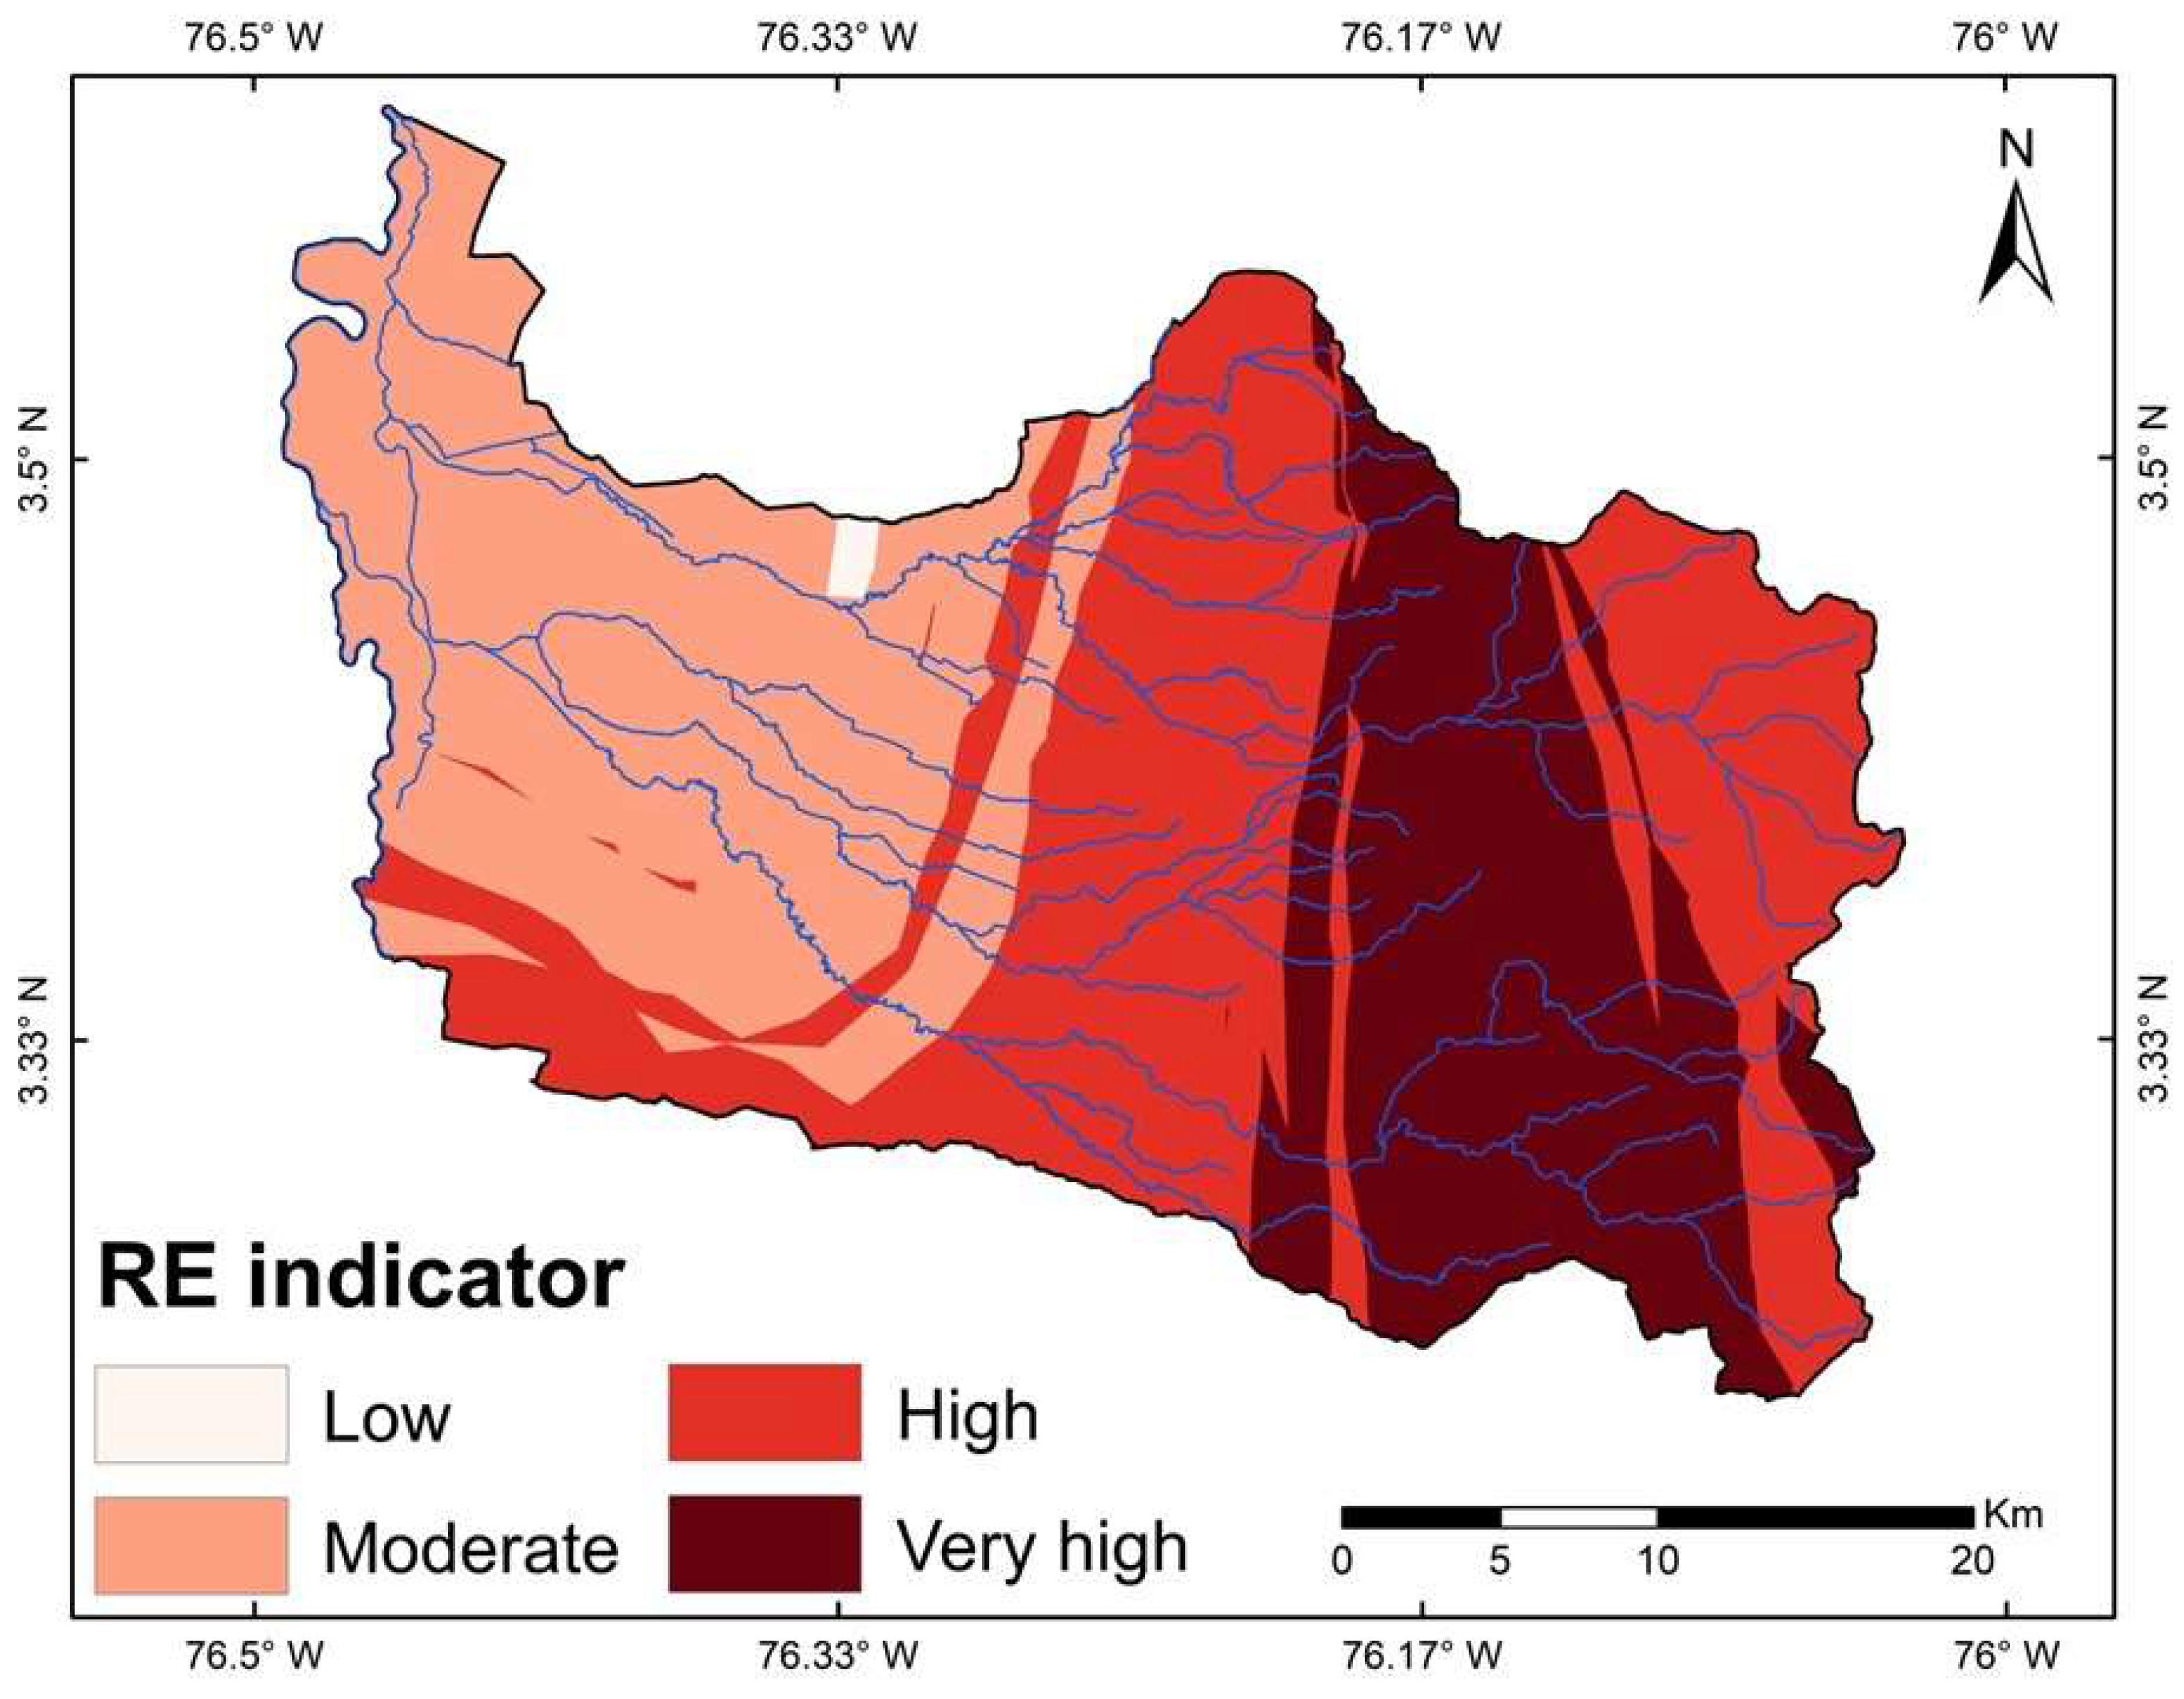
- RE: Estimated using rainfall intensity and kinetic energy functions from the Colombian Institute of Hydrology, Meteorology and Environmental Studes (IDEAM) meteorological stations. Vulnerability classes were defined based on annual erosivity thresholds (Supplementary S9).
- RC: Computed using the CN method from USDA-NRCS, combining land use/land cover (LULC) and hydrologic soil group (HSG) data. Reclassification schemes for HSGs and LULC are provided in Supplementary S3 and S4, respectively.
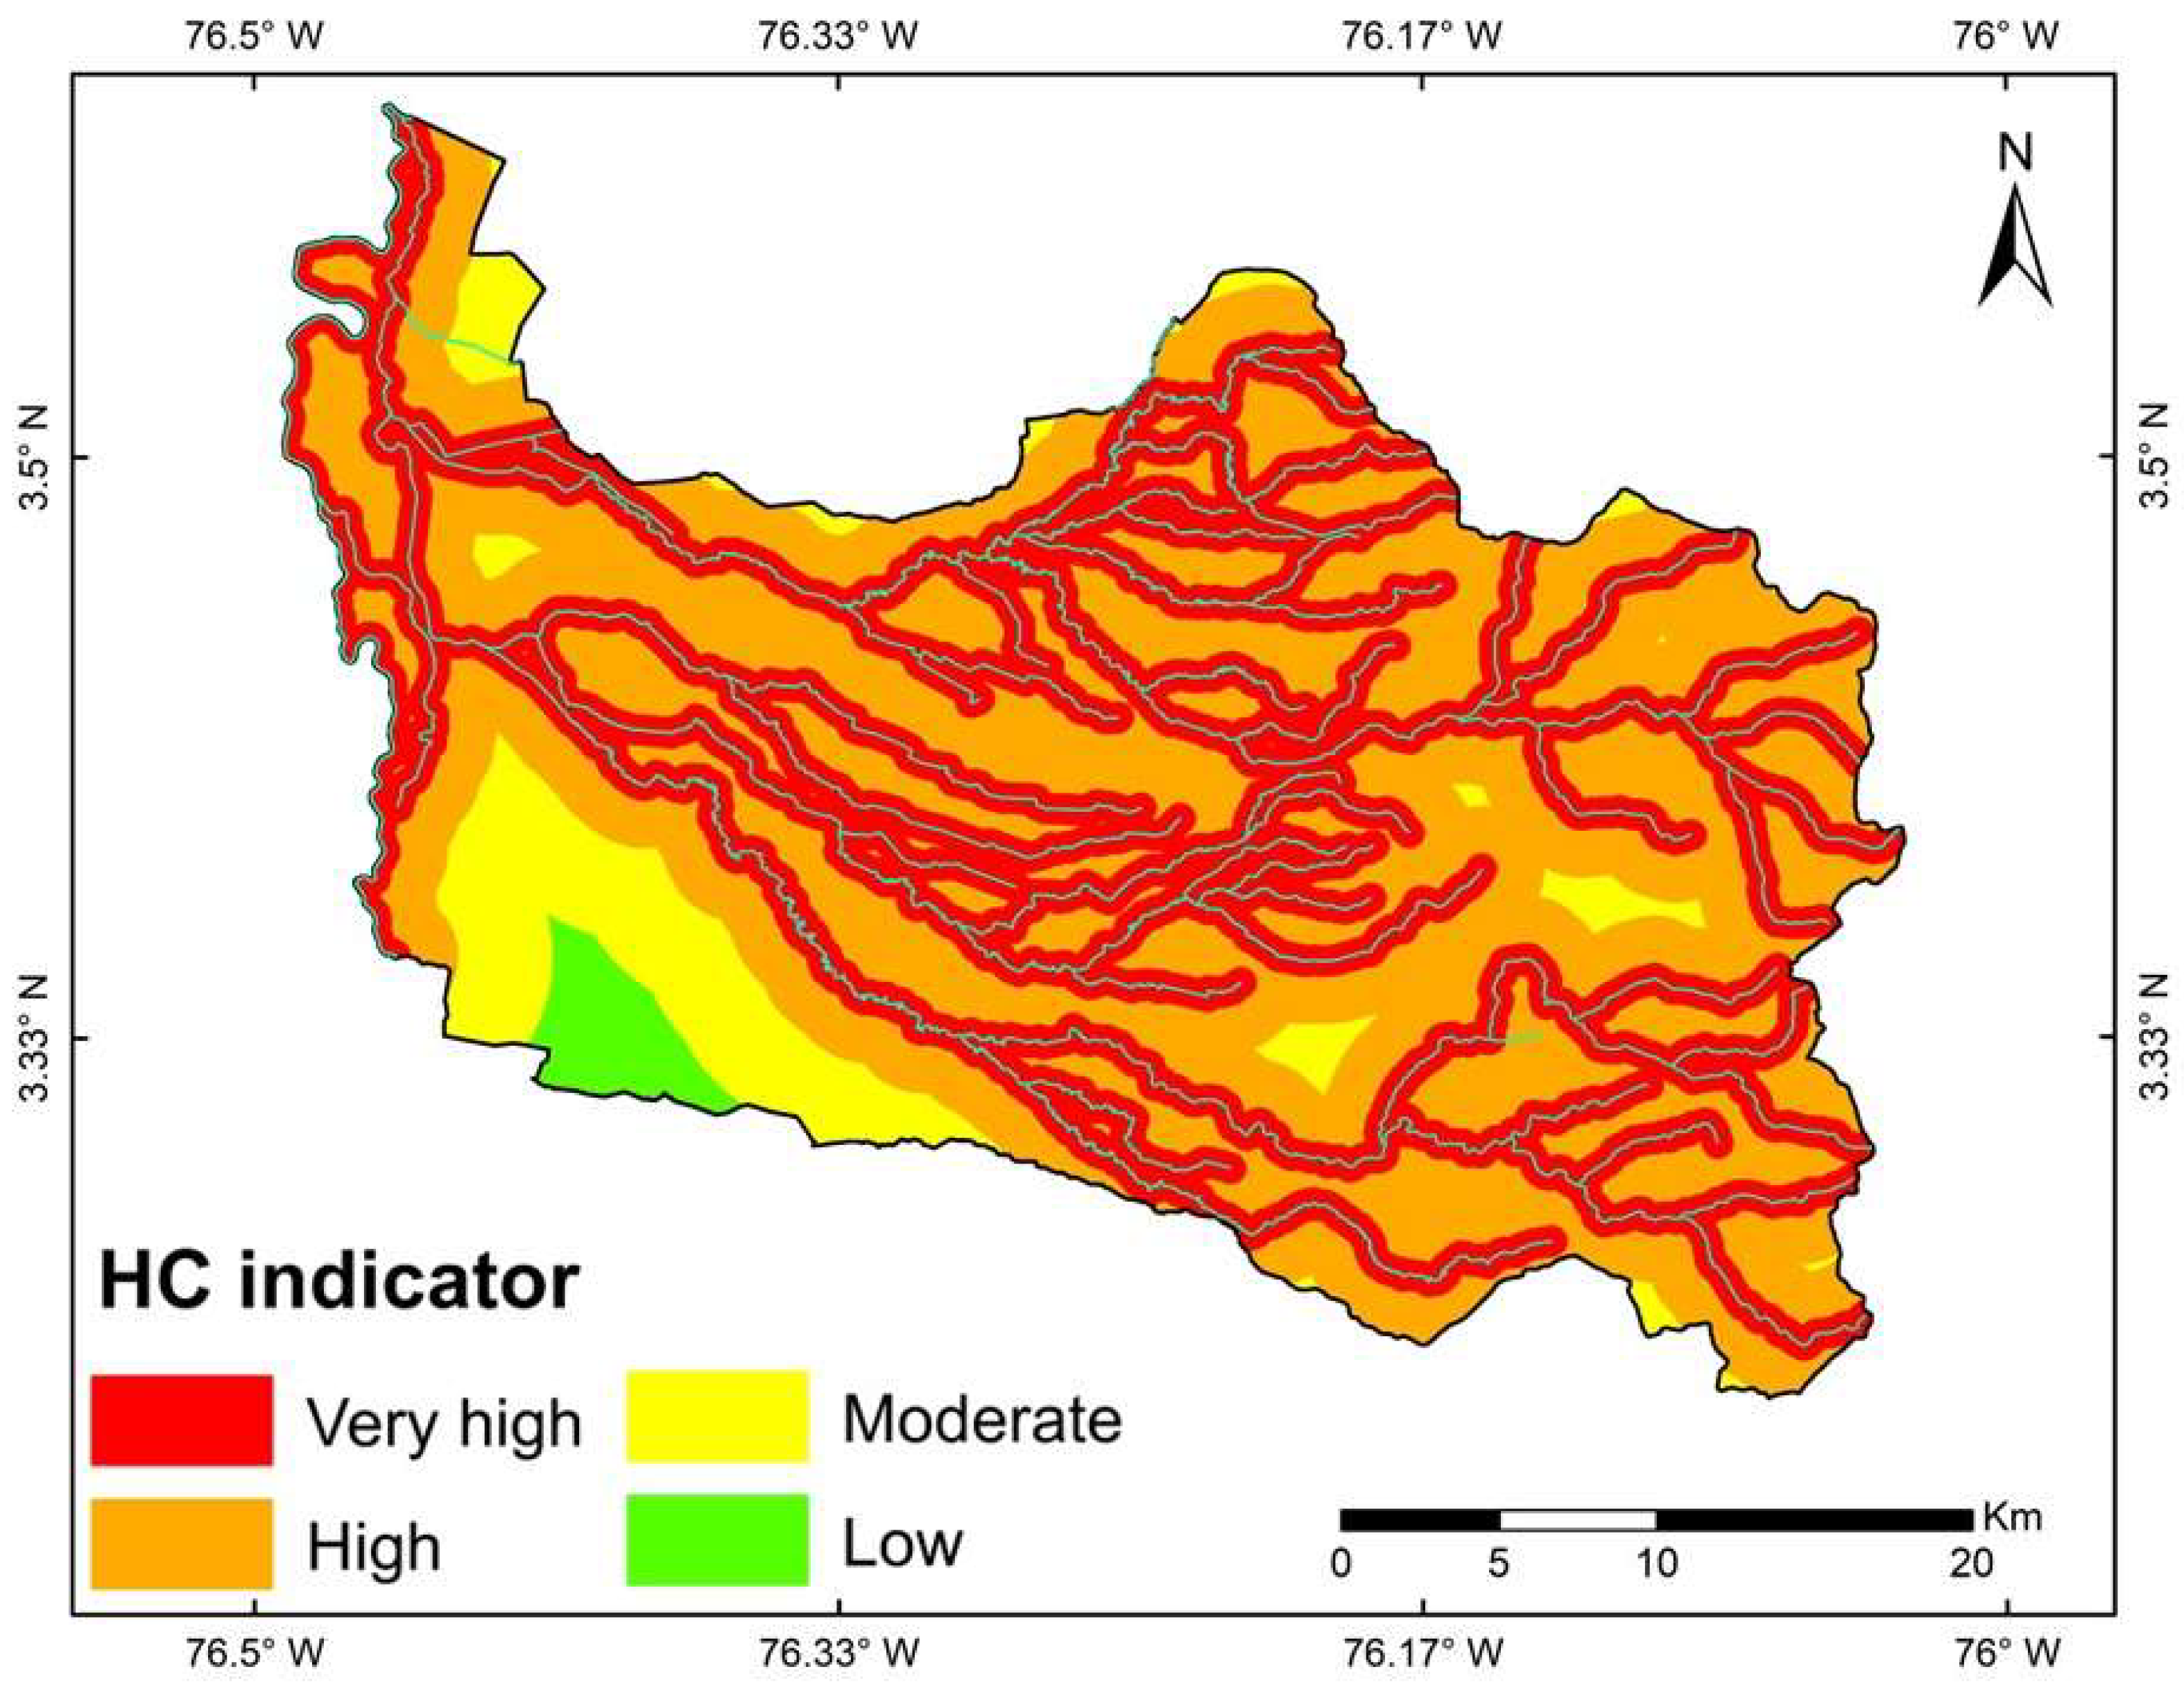
- HC: Assessed using proximity and spatial connection between agricultural land uses and nearby water bodies. A raster model incorporating buffer zones and connectivity values was generated following the methodology adapted from [42]. Class definitions are included in Supplementary S9.
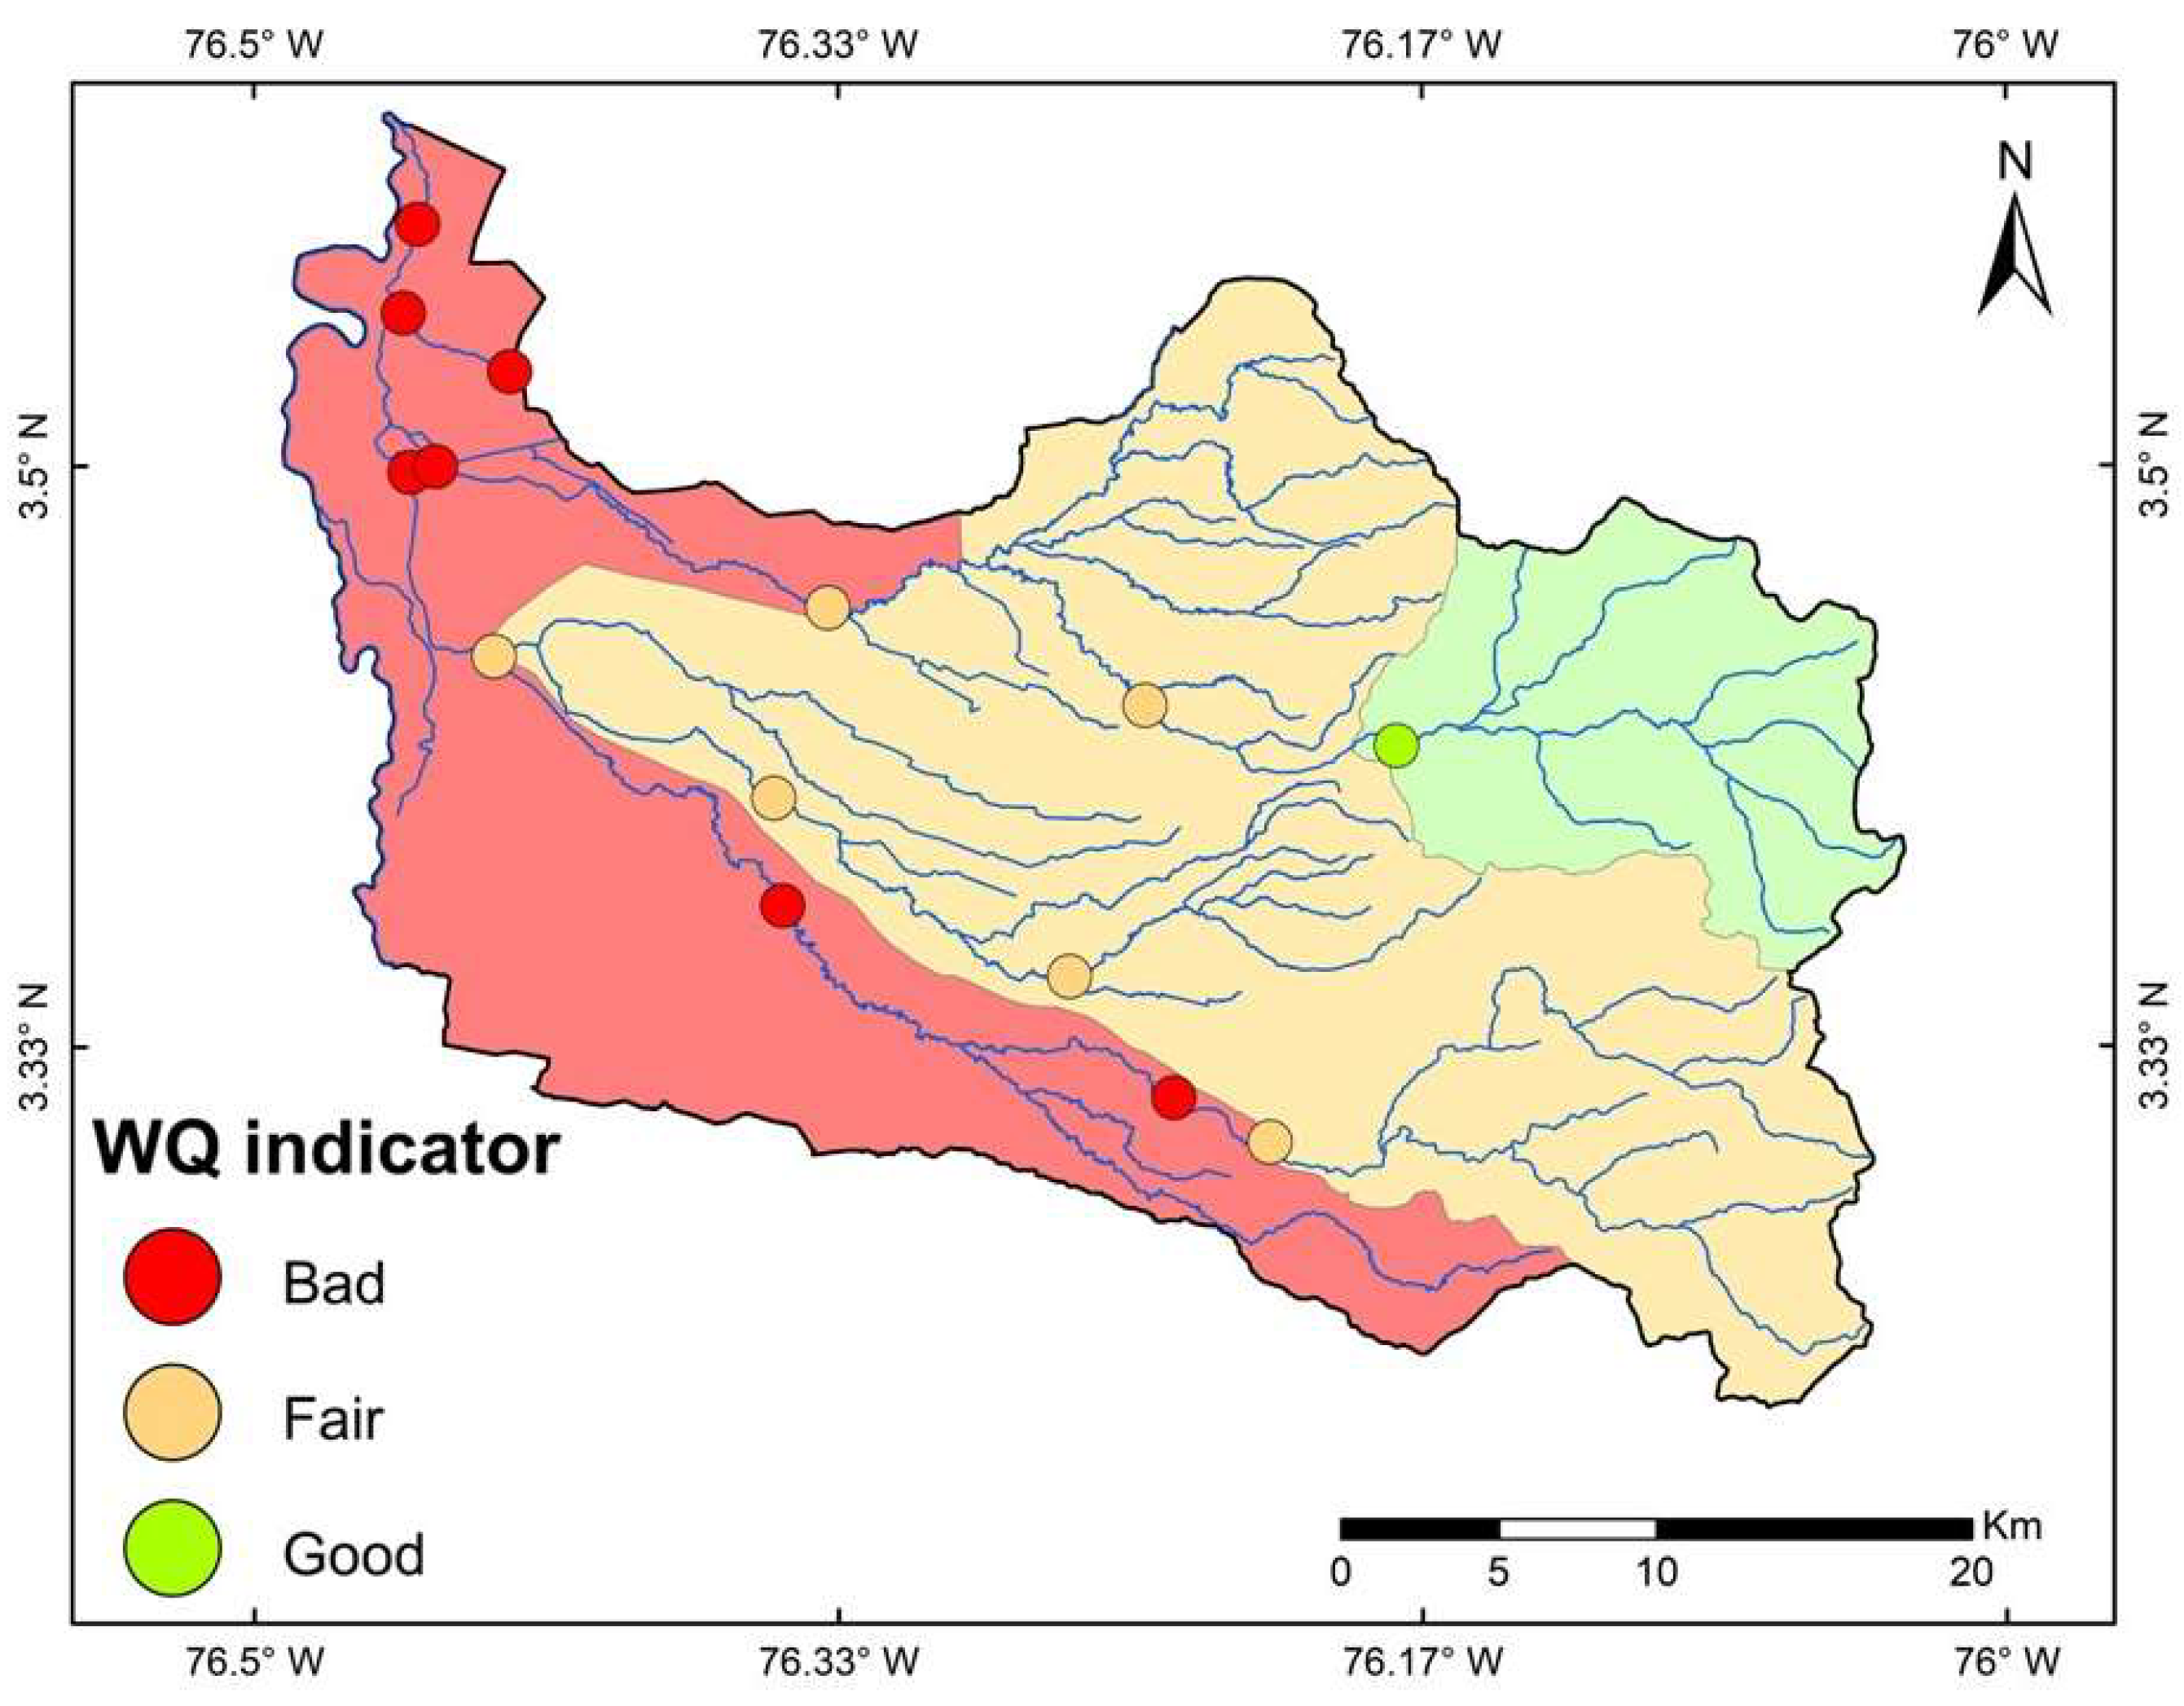
- WQ: Integrated using the ICAUCA methodology, which combines physical, chemical, and biological indicators into sub-indices (Supplementary S6 and S7). Vulnerability levels were assigned based on mean values across 12 sampling stations within the GRW. The WQ data obtained from 12 monitoring stations were pre-processed to ensure temporal consistency and reliability. Records with incomplete parameter sets or inconsistent timestamps relative to other datasets were excluded from the final analysis. For isolated missing values (i.e., single gaps within an otherwise consistent time series), interpolation was performed using either monthly averages from the same station or spatially neighboring stations. Temporal harmonization ensured that the WQ dataset used for the IIVDC preserved seasonal representativeness and spatial coverage across the watershed. Additionally, statistical screening was conducted to detect outliers, which were removed if not supported by nearby measurements or physical plausibility.
3.2.4. IIVDC Application to the GRW
Limitations and Applicable Condition Exploration
4. Results
4.1. Application of the IIVDC in the GRW
4.1.1. SL Indicator
4.1.2. SE Indicator
4.1.3. RE Indicator
4.1.4. CN and RC Indicator
4.1.5. HC Indicator
4.1.6. WQ Indicator
4.1.7. IIVDC
5. Discussion
5.1. Spatial Distribution of Vulnerability and Driving Factors
5.2. Methodological Novelty and Limitations
5.3. Implications for Watershed Management and Policy
5.4. Integration with Existing Frameworks and Future Research Directions
6. Conclusions
Supplementary Materials
Author Contributions
Funding
Data Availability Statement
Acknowledgments
Conflicts of Interest
References
- Hao, C.L.; Yan, D.H.; Xiao, W.H.; Yin, J. Research framework & key issues for non-point source pollution in agriculture induced by water-loss and soil-erosion. Adv. Mater. Res. 2013, 726, 3855–3866. [Google Scholar] [CrossRef]
- Ongley, E.D. Non-point source water pollution in China: Current status and future prospects. Water Int. 2004, 29, 299–306. [Google Scholar] [CrossRef]
- Stagnari, F.; Jan, S.; Angelica, G.; Michele, P. Sustainable agricultural practices for water quality protection. In Water Stress and Crop Plants: A Sustainable Approach; Ahmad, P., Ed.; John Wiley and Sons: Hoboken, NJ, USA, 2016; Volume 1, pp. 75–85. ISBN 978-111-905-445-0. [Google Scholar]
- Macintosh, K.A.; Mayer, B.K.; McDowell, R.W.; Powers, S.M.; Baker, L.A.; Boyer, T.H.; Rittmann, B.E. Managing diffuse phosphorus at the source versus at the sink. Environ. Sci. Technol. 2018, 52, 11995–12009. [Google Scholar] [CrossRef]
- Harrison, S.; McAree, C.; Mulville, W.; Sullivan, T. The problem of agricultural ‘diffuse’ pollution: Getting to the point. Sci. Total Environ. 2019, 677, 700–717. [Google Scholar] [CrossRef] [PubMed]
- Panagopoulos, Y.; Makropoulos, C.; Mimikou, M. Decision support for diffuse pollution management. Environ. Model. Softw. 2012, 30, 57–70. [Google Scholar] [CrossRef]
- Pang, S.; Wang, X.; Melching, C.S.; Guo, H.; Li, W. Identification of multilevel priority management areas for diffuse pollutants based on streamflow continuity in a water-deficient watershed. J. Clean. Prod. 2022, 351, 131322. [Google Scholar] [CrossRef]
- Liu, R.; Zhang, P.; Wang, X.; Wang, J.; Yu, W.; Shen, Z. Cost-effectiveness and cost-benefit analysis of BMPs in controlling agricultural nonpoint source pollution in China based on the SWAT model. Environ. Monit. Assess. 2014, 186, 9011–9022. [Google Scholar] [CrossRef]
- Saaty, T.L. The modern science of multicriteria decision making and its practical applications: The AHP/ANP approach. Oper. Res. 2013, 61, 1101–1118. [Google Scholar] [CrossRef]
- Asfaw, D.; Mengistu, D. Modeling Megech watershed aquifer vulnerability to pollution using modified DRASTIC model for sustainable groundwater management, Northwestern Ethiopia. Groundw. Sustain. Dev. 2020, 11, 100375. [Google Scholar] [CrossRef]
- Paul, M.; Negahban-Azar, M.; Shirmohammadi, A.; Montas, H.J. Developing a multicriteria decision analysis framework to evaluate reclaimed wastewater use for agricultural irrigation: The case study of Maryland. Hydrology 2021, 8, 4. [Google Scholar] [CrossRef]
- Gad, M.; Saleh, A.; Hussein, H.; Elsayed, S.; Farouk, M. Water quality evaluation and prediction using irrigation indices, artificial neural networks, and partial least square regression models for the Nile River, Egypt. Water 2023, 15, 2244. [Google Scholar] [CrossRef]
- Chen, H.; Fu, Y.; Brown, L.C. GIS-based Environmental Analysis Method for Rural Areas. In Proceedings of the 2013 ASABE Annual International Meeting, Kansas City, MO, USA, 21–24 July 2013; American Society of Agricultural and Biological Engineers: St. Joseph, MI, USA, 2013. [Google Scholar]
- Husen, S.; Khamitkar, S.; Bhalchandra, P.; Tamsekar, P.; Kulkarni, G.; Hambarde, K. Integrated Use of AHP and GIS Techniques for Selection of Artificial Water Recharge Sites. In Information and Communication Technology for Sustainable Development, Proceedings of the ICT4SD 2018, Goa, India, 30–31 August 2018; Tuba, M., Akashe, S., Joshi, A., Eds.; Advances in Intelligent Systems and Computing; Springer: Singapore, 2020; Volume 933, pp. 171–181. [Google Scholar] [CrossRef]
- Do, T.N.; Nguyen, D.-M.T.; Ghimire, J.; Vu, K.-C.; Do Dang, L.-P.; Pham, S.-L.; Pham, V.-M. Assessing surface water pollution in Hanoi, Vietnam, using remote sensing and machine learning algorithms. Environ. Sci. Pollut. Res. 2023, 30, 82230–82247. [Google Scholar] [CrossRef] [PubMed]
- Lai, E.; Lundie, S.; Ashbolt, N.J. Review of multi-criteria decision aid for integrated sustainability assessment of urban water systems. Urban Water J. 2008, 5, 315–327. [Google Scholar] [CrossRef]
- Saeed, M.O.; Aziz, H.A.; Azizli, K.A. The art of integrated GIS/AHP for siting landfill: A review. Appl. Mech. Mater. 2014, 567, 144–149. [Google Scholar] [CrossRef]
- Tone, K.; Tsutsui, M. Dynamic DEA with network structure: A slacks-based measure approach. Omega 2014, 42, 124–131. [Google Scholar] [CrossRef]
- Lee, E.H. eXplainable DEA approach for evaluating performance of public transport origin-destination pairs. Res. Transp. Econ. 2024, 108, 101491. [Google Scholar] [CrossRef]
- Yılmaz, B.; Yurdusev, M.A. Use of data envelopment analysis as a multi-criteria decision tool—A case of irrigation management. Math. Comput. Appl. 2011, 16, 669–679. [Google Scholar] [CrossRef]
- Wątróbski, J.; Jankowski, J.; Ziemba, P.; Karczmarczyk, A.; Zioło, M. Generalised framework for multi-criteria method selection. Omega 2018, 86, 107–124. [Google Scholar] [CrossRef]
- Izadikhah, M. Modeling bank performance: A novel fuzzy two-stage DEA approach. Fuzzy Inf. Eng. 2020, 11, 149–174. [Google Scholar] [CrossRef]
- Andersson, T.D.; Hartman, T. Productivity and efficiency in restaurants: A data envelopment approach. J. Hosp. Financ. Manag. 1995, 4, 1–20. [Google Scholar] [CrossRef]
- De Angeli, S.; Malamud, B.D.; Rossi, L.; Taylor, F.E.; Trasforini, E.; Rudari, R. A multi-hazard framework for spatial-temporal impact analysis. Int. J. Disaster Risk Reduct. 2022, 73, 102829. [Google Scholar] [CrossRef]
- Zhang, H.; Huang, G.H. Assessment of non-point source pollution using a spatial multicriteria analysis approach. Ecol. Model. 2011, 222, 313–321. [Google Scholar] [CrossRef]
- Grimene, C.; Mghirbi, O.; Louvet, S.; Bord, J.-P.; Le Grusse, P. Spatial characterization of surface water vulnerability to diffuse pollution related to pesticide contamination: Case of the Gimone watershed in France. Environ. Sci. Pollut. Res. 2022, 29, 17–39. [Google Scholar] [CrossRef] [PubMed]
- Kumar, A.; Pant, S. Analytical hierarchy process for sustainable agriculture: An overview. MethodsX 2023, 10, 101954. [Google Scholar] [CrossRef]
- Sanchez, E.F.; Alvarez, C.I. Prioritization of hydrological restoration areas using AHP and GIS in Dulcepamba River Basin in Bolivar–Ecuador. Hydrology 2024, 11, 81. [Google Scholar] [CrossRef]
- Kucuker, D.M.; Cedano Giraldo, D. Assessment of soil erosion risk using an integrated approach of GIS and Analytic Hierarchy Process (AHP) in Erzurum, Turkiye. Ecol. Inform. 2022, 71, 101788. [Google Scholar] [CrossRef]
- Pramanik, M.K. Site suitability analysis for agricultural land use of Darjeeling district using AHP and GIS techniques. Model. Earth Syst. Environ. 2016, 2, 56. [Google Scholar] [CrossRef]
- Topuz, M.; Deniz, M. Application of GIS and AHP for land use suitability analysis: Case of Demirci district (Turkey). Humanit. Soc. Sci. Commun. 2023, 10, 342. [Google Scholar] [CrossRef]
- Agyenim, J.B.; Gupta, J. IWRM and developing countries: Implementation challenges in Ghana. Phys. Chem. Earth 2012, 47–48, 46–57. [Google Scholar] [CrossRef]
- Croke, B.F.W.; Ticehurst, J.L.; Letcher, R.A.; Norton, J.P.; Newham, L.T.H.; Jakeman, A.J. Integrated assessment of water resources: Australian experiences. Water Resour. Manag. 2007, 21, 351–373. [Google Scholar] [CrossRef]
- Guzman, C.D.; Hoyos-Villada, F.; Da Silva, M.; Zimale, F.A.; Chirinda, N.; Botero, C.; Morales Vargas, A.; Rivera, B.; Moreno, P.; Steenhuis, T.S. Variability of soil surface characteristics in a mountainous watershed in Valle del Cauca, Colombia: Implications for runoff, erosion, and conservation. J. Hydrol. 2019, 576, 273–286. [Google Scholar] [CrossRef]
- Hamel, P.; Riveros-Iregui, D.; Ballari, D.; Browning, T.; Célleri, R.; Chandler, D.; Chun, K.P.; Destouni, G.; Jacobs, S.; Jasechko, S.; et al. Watershed services in the humid tropics: Opportunities from recent advances in ecohydrology. Ecohydrology 2018, 11, e1921. [Google Scholar] [CrossRef]
- Hoyos, N.; Waylen, P.R.; Jaramillo, Á. Seasonal and spatial patterns of erosivity in a tropical watershed of the Colombian Andes. J. Hydrol. 2005, 314, 177–191. [Google Scholar] [CrossRef]
- Tiwari, A.K.; Suozzi, E.; Silva, C.; De Maio, M.; Zanetti, M. Role of integrated approaches in water resources management: Antofagasta region, Chile. Sustainability 2021, 13, 1297. [Google Scholar] [CrossRef]
- Villamizar, M.L.; Brown, C.D. Modelling triazines in the valley of the River Cauca, Colombia, using the annualized agricultural non-point source pollution model. Agric. Water Manag. 2016, 177, 24–36. [Google Scholar] [CrossRef]
- Hung, P.; Le, T.V.; Vo, P.L.; Duong, H.C.; Rahman, M.M. Vulnerability assessment of water resources using GIS, remote sensing and SWAT model—A case study: The upper part of Dong Nai river basin, Vietnam. Int. J. River Basin Manag. 2022, 20, 517–532. [Google Scholar] [CrossRef]
- Kiesling, R.L.; Elliott, S.M.; Kennedy, J.L.; Hummel, S.L. Validation of a vulnerability index of exposure to chemicals of emerging concern in surface water and sediment of Great Lakes tributaries of the United States. Sci. Total Environ. 2022, 830, 154618. [Google Scholar] [CrossRef] [PubMed]
- Ghiasvand, F.; Babaei, A.A.; Yazdani, M.; Birgani, Y.T. Spatial modeling of environmental vulnerability in the biggest river in Iran using geographical information systems. J. Environ. Health Sci. Eng. 2021, 19, 1069–1074. [Google Scholar] [CrossRef] [PubMed]
- Weissteiner, C.J.; Pistocchi, A.; Marinov, D.; Bouraoui, F.; Sala, S. An indicator to map diffuse chemical river pollution con-sidering buffer capacity of riparian vegetation—A pan-European case study on pesticides. Sci. Total Environ. 2014, 484, 64–73. [Google Scholar] [CrossRef]
- Fernandes, A.C.P.; Terêncio, D.P.S.; Pacheco, F.A.L.; Fernandes, L.F.S. A combined GIS-MCDA approach to prioritize stream water quality interventions, based on the contamination risk and intervention complexity. Sci. Total Environ. 2021, 798, 149322. [Google Scholar] [CrossRef]
- Drohan, P.J.; Bechmann, M.; Buda, A.; Djodjic, F.; Doody, D.; Duncan, J.M.; Iho, A.; Jordan, P.; Kleinman, P.J.; McDowell, R.; et al. A global perspective on phosphorus management decision support in agriculture: Lessons learned and future directions. J. Environ. Qual. 2019, 48, 1218–1233. [Google Scholar] [CrossRef] [PubMed]
- Rose, D.C.; Sutherland, W.J.; Parker, C.; Lobley, M.; Winter, M.; Morris, C.; Twining, S.; Ffoulkes, C.; Amano, T.; Dicks, L.V. Decision support tools for agriculture: Towards effective design and delivery. Agric. Syst. 2016, 149, 165–174. [Google Scholar] [CrossRef]
- Anandhi, A.; Kannan, N. Vulnerability assessment of water resources—Translating a theoretical concept to an operational framework using systems thinking approach in a changing climate: Case study in Ogallala Aquifer. J. Hydrol. 2018, 557, 460–474. [Google Scholar] [CrossRef]
- Caković, M.; Beloica, J.; Simić, S.B.; Miljković, P.; Lukić, S.; Baumgertel, A.; Schwaiger, F. Diffuse pollution and ecological risk assessment in Ludaš Lake Special Nature Reserve and Palić Nature Park (Pannonian Basin). Forests 2021, 12, 11461. [Google Scholar] [CrossRef]
- Candido, L.A.; Coêlho, G.A.G.; de Moraes, M.M.G.A.; Florêncio, L. Review of decision support systems and allocation models for integrated water resources management focusing on joint water quantity-quality. J. Water Resour. Plan. Manag. 2022, 148, 04021149. [Google Scholar] [CrossRef]
- Chen, G.; Liu, L.; Wang, W.; Wang, R.; Li, Y.; Tang, X.; Li, X. Effectiveness of best management practices for non-point source pollution in intensively managed agricultural watersheds. J. Clean. Prod. 2025, 495, 145076. [Google Scholar] [CrossRef]
- Chen, H.; Wang, C.; Ren, Q.; Liu, X.; Ren, J.; Kang, G.; Wang, Y. Long-term water quality dynamics and trend assessment reveal the effectiveness of ecological compensation: Insights from China’s first cross-provincial compensation watershed. Ecol. Indic. 2024, 169, 112853. [Google Scholar] [CrossRef]
- Chen, T.; Li, Y.; Wu, Z.; Guo, H.; Huang, Z. Contribution of the ratoon sugarcane with planting years to river pollution evidenced from the four-year watershed observation. Agric. Ecosyst. Environ. 2024, 373, 109099. [Google Scholar] [CrossRef]
- Chen, W.; Chen, Y.; Feng, Y. Assessment and prediction of water resources vulnerability based on a NRS-RF model: A case study of the Song-Liao River Basin, China. Entropy 2021, 23, 882. [Google Scholar] [CrossRef]
- Chhetri, R.; Kumar, P.; Pandey, V.P.; Singh, R.; Pandey, S. Vulnerability assessment of water resources in hilly region of Nepal. Sustain. Water Resour. Manag. 2020, 6, 39. [Google Scholar] [CrossRef]
- Cool, G.; Rodriguez, M.J.; Bouchard, C.; Levallois, P.; Joerin, F. Evaluation of the vulnerability to contamination of drinking water systems for rural regions in Québec, Canada. J. Environ. Plan. Manag. 2010, 53, 615–638. [Google Scholar] [CrossRef]
- Das, A. Surface water quality evaluation, apportionment of pollution sources and aptness testing for drinking using water quality indices and multivariate modelling in Baitarani River basin, Odisha. HydroResearch 2025, 8, 244–264. [Google Scholar] [CrossRef]
- de Ataide, L.C.P.; Silva, M.T.; Serrão, E.A.O.; Dantas, L.G.; Almeida, G.S.S.; Campos, J.H.B.C.; da Silva, V.P.R.; Silva, F.D.D.S. Application of factor analysis to determine hydrometeorological vulnerability for the Middle São Francisco. Rev. Bras. Meteorol. 2022, 37, 405–417. [Google Scholar] [CrossRef]
- Djodjic, F.; Markensten, H. From single fields to river basins: Identification of critical source areas for erosion and phosphorus losses at high resolution. Ambio 2019, 48, 1129–1142. [Google Scholar] [CrossRef]
- Djodjic, F.; Elmquist, H.; Collentine, D. Targeting critical source areas for phosphorus losses: Evaluation with soil testing, farmers’ assessment and modelling. Ambio 2018, 47, 45–56. [Google Scholar] [CrossRef] [PubMed]
- Ebrahimi, E.; Asadi, H.; Rahmani, M.; Farhangi, M.B.; Ashrafzadeh, A. Effect of precipitation and sediment concentration on the loss of nitrogen and phosphorus in the Pasikhan River. Aqua Water Infrastruct. Ecosyst. Soc. 2022, 71, 211–228. [Google Scholar] [CrossRef]
- El-Mahdy, M.E.S. A unified index of water resources systems vulnerability assessment—Translating the theoretical approach into a simple tool to assess climate change impact: Case study in Limpopo River Basin, Africa. Ain Shams Eng. J. 2022, 13, 101687. [Google Scholar] [CrossRef]
- Evenson, G.R.; Kalcic, M.; Wang, Y.C.; Robertson, D.; Scavia, D.; Martin, J.; Aloysius, N.; Apostel, A.; Boles, C.; Brooker, M.; et al. Uncertainty in critical source area predictions from watershed-scale hydrologic models. J. Environ. Manag. 2021, 279, 111506. [Google Scholar] [CrossRef]
- Moraes, J.F.S.; Cantalice, J.R.B.; Singh, V.P.; Piscoya, V.C.; Cunha Filho, M.; Guerra, S.M.; Almeida, P.L.R. Lateral sediment connectivity by curve number and a proposed approach to soil erodibility at the watershed scale. Catena 2024, 234, 107611. [Google Scholar] [CrossRef]
- Fernandes, A.C.P.; de Oliveira Martins, L.M.; Pacheco, F.A.L.; Fernandes, L.F.S. The consequences for stream water quality of long-term changes in landscape patterns: Implications for land use management and policies. Land Use Policy 2021, 109, 105679. [Google Scholar] [CrossRef]
- Ganasri, B.P.; Ramesh, H. Assessment of soil erosion by RUSLE model using remote sensing and GIS—A case study of Nethravathi Basin. Geosci. Front. 2016, 7, 953–961. [Google Scholar] [CrossRef]
- Giri, S.; Nejadhashemi, A.P.; Zhang, Z.; Woznicki, S.A. Integrating statistical and hydrological models to identify implementation sites for agricultural conservation practices. Environ. Model. Softw. 2015, 72, 327–340. [Google Scholar] [CrossRef]
- Giri, S.; Qiu, Z.; Zhang, Z. Assessing the impacts of land use on downstream water quality using a hydrologically sensitive area concept. J. Environ. Manag. 2018, 213, 309–319. [Google Scholar] [CrossRef]
- Giuliani, C.; Veisz, A.C.; Piccinno, M.; Recanatesi, F. Estimating vulnerability of water body using Sentinel-2 images and environmental modelling: The study case of Bracciano Lake (Italy). Eur. J. Remote Sens. 2019, 52 (Suppl. 4), 64–73. [Google Scholar] [CrossRef]
- Gui, Z.; Chen, X.; He, Y. Spatiotemporal analysis of water resources system vulnerability in the Lancang River Basin, China. J. Hydrol. 2021, 601, 126614. [Google Scholar] [CrossRef]
- Hai, D.T.; Phin, T.T. Determine the vulnerability of urban surface water resources in Rach Gia city, Vietnam using geographic information system. Int. J. GEOMATE 2019, 17, 340–346. [Google Scholar] [CrossRef]
- Hou, G.; Zheng, J.; Cui, X.; He, F.; Zhang, Y.; Wang, Y.; Li, X.; Fan, C.; Tan, B. Suitable coverage and slope guided by soil and water conservation can prevent non-point source pollution diffusion: A case study of grassland. Ecotoxicol. Environ. Saf. 2022, 241, 113804. [Google Scholar] [CrossRef] [PubMed]
- Hu, C.; Wu, Q.; Liu, G.; Ran, H.; Guo, M.; Zhu, J.; Zeng, J. Nitrogen and phosphorus non-point source pollution in the upper Wujiang River Karst Basin: Critical source areas identification and influencing factors. Ecol. Indic. 2025, 170, 112989. [Google Scholar] [CrossRef]
- Hu, J.; Ouyang, W.; Hou, C.; Ji, K.; Yang, Z. Effects of urban stormwater pollution on watershed diffuse loads under extreme precipitation conditions. J. Hydrol. 2025, 654, 132802. [Google Scholar] [CrossRef]
- Jiang, F.; Preisendanz, H.E.; Veith, T.L.; Cibin, R.; Drohan, P.J. Riparian buffer effectiveness as a function of buffer design and input loads. J. Environ. Qual. 2020, 49, 1599–1611. [Google Scholar] [CrossRef]
- Jun, K.S.; Chung, E.S.; Sung, J.Y.; Lee, K.S. Development of spatial water resources vulnerability index considering climate change impacts. Sci. Total Environ. 2011, 409, 5228–5242. [Google Scholar] [CrossRef] [PubMed]
- Kamalamma, A.G.; Babel, M.S.; Sridhar, V.; Vellingiri, G. A novel approach to vulnerability assessment for adaptation planning in agriculture: An application to the Lower Bhavani Irrigation Project, India. Clim. Serv. 2023, 30, 100358. [Google Scholar] [CrossRef]
- Kaur, L.; Rishi, M.S.; Arora, N.K. Deciphering pollution vulnerability zones of River Yamuna in relation to existing land use land cover in Panipat, Haryana, India. Environ. Monit. Assess. 2021, 193, 204. [Google Scholar] [CrossRef]
- Lee, G.; Jun, K.S.; Kang, M. Framework to prioritize watersheds for diffuse pollution management in the Republic of Korea: Application of multi-criteria analysis using the Delphi method. Nat. Hazards Earth Syst. Sci. 2019, 19, 2767–2779. [Google Scholar] [CrossRef]
- Lei, M.; Long, Y.; Li, T.; Ma, Y.; Zhang, G.; Peng, B.; Li, Z.; Liu, Y. Nitrogen dynamic transport processes shaped by watershed hydrological functional connectivity. J. Hydrol. 2024, 645, 132218. [Google Scholar] [CrossRef]
- Li, W.; Zhao, Z.; Lv, S.; Zhao, W.; Su, W. Vulnerability assessment of water resources in a karst mountainous area based on GIS/RS technology: A case study of Guiyang, Southwest China. Water Supply 2022, 22, 5206–5220. [Google Scholar] [CrossRef]
- Liu, X.; Zhou, S.; Qi, S.; Yang, B.; Chen, Y.; Huang, R.; Du, P. Zoning of rural water conservation in China: A case study at Ashihe River Basin. Int. Soil Water Conserv. Res. 2015, 3, 130–140. [Google Scholar] [CrossRef]
- Lou, H.; Yang, S.; Zhao, C.; Shi, L.; Wu, L.; Wang, Y.; Wang, Z. Detecting and analyzing soil phosphorus loss associated with critical source areas using a remote sensing approach. Sci. Total Environ. 2016, 573, 397–408. [Google Scholar] [CrossRef]
- Maniquiz, M.C.; Lee, S.; Min, K.S.; Kim, J.H.; Kim, L.H. Diffuse pollutant unit loads of various transportation land uses. Desalin. Water Treat. 2012, 38, 222–229. [Google Scholar] [CrossRef]
- Mansir, I.; Bouchaou, L.; Chebli, B.; Ait Brahim, Y.; Choukr-Allah, R. A specific indicator approach for the assessment of water resource vulnerability in arid areas: The case of the Souss-Massa Region (Morocco). Hydrol. Sci. J. 2021, 66, 1151–1168. [Google Scholar] [CrossRef]
- Mansour, S.; Kouz, T.; Belkendil, A.; Dekkaki, H.C. A comparative study to assess surface water’s anthropic and natural vulnerability using the DKPR and RUSLE approaches. Case of the watershed of the Joumouaa dam (Coastal basin of Ghiss, North East Morocco). E3S Web Conf. 2021, 298, 05005. [Google Scholar] [CrossRef]
- Samareh Hashemi, M.; Bagheri, A.; Rizzoli, A.E. The role of ex-post and ex-ante integrated assessment frameworks in conceptualization of the modeling process in the context of integrated water resources management. Water Resour. 2019, 46, 296–307. [Google Scholar] [CrossRef]
- Meng, X.; Xu, F.; Huang, Y.; Zhang, X.; Zhang, M. Evolution characteristics and driving factors of potential non-point source pollution risks in a watershed affected by land use changes. Heliyon 2024, 10, e37247. [Google Scholar] [CrossRef]
- Moncada, A.M.; Escobar, M.; Betancourth, A.; Vélez Upegui, J.J.; Zambrano, J.; Alzate, L.M. Modelling water stress vulnerability in small Andean basins: Case study of Campoalegre River Basin, Colombia. Int. J. Water Resour. Dev. 2021, 37, 640–657. [Google Scholar] [CrossRef]
- Mosquera, D.C.; López, C.M.; Flores, J.C.M. Evaluation of models to estimate rainfall erosivity in Valle del Cauca, Colombia. Acta Agron. 2021, 70, 164–170. [Google Scholar] [CrossRef]
- Ngene, B.U.; Nwafor, C.O.; Bamigboye, G.O.; Ogbiye, A.S.; Ogundare, J.O.; Akpan, V.E. Integrated water resources management in Nigeria: Implications for sustainable national development. IOP Conf. Ser. Mater. Sci. Eng. 2019, 640, 012101. [Google Scholar] [CrossRef]
- Nguyen, T.T.; Ngo, H.H.; Guo, W.; Nguyen, H.Q.; Luu, C.; Dang, K.B.; Liu, Y.; Zhang, X. New approach of water quantity vulnerability assessment using satellite images and GIS-based model: An application to a case study in Vietnam. Sci. Total Environ. 2020, 737, 139784. [Google Scholar] [CrossRef]
- Nuruzzaman, M.; Bahar, M.M.; Naidu, R. Diffuse soil pollution from agriculture: Impacts and remediation. Sci. Total Environ. 2025, 962, 178398. [Google Scholar] [CrossRef]
- Orlikowski, D.; Bugey, A.; Périllon, C.; Julich, S.; Guégain, C.; Soyeux, E.; Matzinger, A. Development of a GIS method to localize critical source areas of diffuse nitrate pollution. Water Sci. Technol. 2011, 64, 892–898. [Google Scholar] [CrossRef]
- Packham, I.; Mockler, E.; Archbold, M.; Mannix, A.; Daly, D.; Deakin, J.; Bruen, M. Catchment Characterisation Tool: Prioritising critical source areas for managing diffuse nitrate pollution. Environ. Model. Assess. 2020, 25, 23–39. [Google Scholar] [CrossRef]
- Pan, J.; Cai, F.; Yi, Z.; Zhang, W.; Yan, B.; Xue, C.; Yu, B.; Li, R. Landscape connectivity significantly influences the spatial spillover effects of soil erosion: Based on examples from typical karst watersheds. Ecol. Indic. 2025, 173, 113373. [Google Scholar] [CrossRef]
- Pang, S.; Wang, X.; Melching, C.S.; Feger, K.-H. Development and testing of a modified SWAT model based on slope condition and precipitation intensity. J. Hydrol. 2020, 588, 125098. [Google Scholar] [CrossRef]
- Park, Y.; Park, S.R.; Lee, S.W.; Lee, J. Impacts of watershed and meteorological characteristics on stream water quality resilience. J. Hydrol. 2025, 652, 132663. [Google Scholar] [CrossRef]
- Patiño-Gutiérrez, S.E.; Domínguez-Rivera, I.C.; Daza-Torrez, M.C.; Ochoa-Tocachi, B.F.; Oviedo-Ocaña, E.R. Effects of rainfall seasonality and land use change on soil hydrophysical properties of high-Andean dry páramo grasslands. Catena 2024, 238, 107866. [Google Scholar] [CrossRef]
- Peng, K.; Li, J.K.; Hao, G.R.; Liu, Y.W.; Zhou, X.; Xie, W.F. Characteristics of non-point source pollution based on monitoring experiment in the Yingwugou small watershed, China. Ecohydrol. Hydrobiol. 2023, 23, 1–14. [Google Scholar] [CrossRef]
- Pujiono, E.; Prasetyo, B.D.; Setyowati, R.; Kurniadi, R. Vulnerability assessment of water resources to climate variability in Noelmina watershed, Timor Island, Indonesia. IOP Conf. Ser. Earth Environ. Sci. 2021, 874, 012007. [Google Scholar] [CrossRef]
- Qin, J.; Ding, Y.J.; Zhao, Q.D.; Wang, S.P.; Chang, Y.P. Assessments on surface water resources and their vulnerability and adaptability in China. Adv. Clim. Change Res. 2020, 11, 381–391. [Google Scholar] [CrossRef]
- Reaney, S.M.; Mackay, E.B.; Haygarth, P.M.; Fisher, M.; Molineux, A.; Potts, M.; Benskin, C.M.H. Identifying critical source areas using multiple methods for effective diffuse pollution mitigation. J. Environ. Manag. 2019, 250, 109366. [Google Scholar] [CrossRef] [PubMed]
- Sharpley, A.N.; Kleinman, P.J.A.; Flaten, D.N.; Buda, A.R. Critical source area management of agricultural phosphorus: Experiences, challenges and opportunities. Water Sci. Technol. 2011, 64, 945–952. [Google Scholar] [CrossRef]
- Shi, C.; Liang, Y.; Qin, W.; Ding, L.; Cao, W.; Zhang, M.; Zhang, Q. Review of sediment connectivity: Conceptual connotations, characterization indicators, and their relationships with soil erosion and sediment yield. Earth-Sci. Rev. 2025, 264, 105091. [Google Scholar] [CrossRef]
- Shi, W.; Xia, J.; Gippel, C.J.; Chen, J.X.; Hong, S. Influence of disaster risk, exposure and water quality on vulnerability of surface water resources under a changing climate in the Haihe River basin. Water Int. 2017, 42, 462–485. [Google Scholar] [CrossRef]
- Singh, S.; Bhardwaj, A.; Verma, V.K. Remote sensing and GIS based analysis of temporal land use/land cover and water quality changes in Harike wetland ecosystem, Punjab, India. J. Environ. Manag. 2020, 262, 110355. [Google Scholar] [CrossRef]
- Stathatou, P.; Kampragou, E.; Grigoropoulou, H.; Assimacopoulos, D.; Karavitis, C.; Porto, M.F.A.; Gironás, J.; Vanegas, M.; Reyna, S. Vulnerability of water systems: A comprehensive framework for its assessment and identification of adaptation strategies. Desalin. Water Treat. 2016, 57, 2243–2255. [Google Scholar] [CrossRef]
- Sun, M.; Kato, T. Spatial-temporal analysis of urban water resource vulnerability in China. Ecol. Indic. 2021, 133, 108436. [Google Scholar] [CrossRef]
- Taloor, A.K.; Khajuria, V.; Parsad, G.; Bandral, S.; Mahajan, S.; Singh, S.; Sharma, M.; Kothyari, G.C. Geospatial assessment of soil erosion in the Basantar and Devak watersheds of the NW Himalaya: A study utilizing USLE and RUSLE models. Geosyst. Geoenviron. 2025, 4, 100355. [Google Scholar] [CrossRef]
- Thomas, I.A.; Jordan, P.; Mellander, P.E.; Fenton, O.; Shine, O.; hUallacháin, D.Ó.; Creamer, R.; McDonald, N.T.; Dunlop, P.; Murphy, P.N.C. Improving the identification of hydrologically sensitive areas using LiDAR DEMs for the delineation and mitigation of critical source areas of diffuse pollution. Sci. Total Environ. 2016, 556, 276–290. [Google Scholar] [CrossRef] [PubMed]
- Thomas, I.A.; Mellander, P.E.; Murphy, P.N.C.; Fenton, O.; Shine, O.; Djodjic, F.; Dunlop, P.; Jordan, P. A sub-field scale critical source area index for legacy phosphorus management using high resolution data. Agric. Ecosyst. Environ. 2016, 233, 238–252. [Google Scholar] [CrossRef]
- Torres, P.; Cruz, C.H.; Patiño, P.; Escobar, J.C.; Pérez, A. Aplicación de índices de calidad de agua-ICA orientados al uso de la fuente para consumo humano. Ing. Investig. 2010, 30, 86–95. [Google Scholar] [CrossRef]
- Tran, N.H.; Reinhard, M.; Khan, E.; Chen, H.; Nguyen, V.T.; Li, Y.; Goh, S.G.; Nguyen, Q.B.; Saeidi, N.; Gin, K.Y.H. Emerging contaminants in wastewater, stormwater runoff, and surface water: Application as chemical markers for diffuse sources. Sci. Total Environ. 2019, 676, 252–267. [Google Scholar] [CrossRef]
- Troian, A.; Gomes, M.C.; Tiecher, T.; Berbel, J.; Gutiérrez-Martín, C. The drivers-pressures-state-impact-response model to structure cause-effect relationships between agriculture and aquatic ecosystems. Sustainability 2021, 13, 9365. [Google Scholar] [CrossRef]
- Turunen, J.; Markkula, J.; Rajakallio, M.; Aroviita, J. Riparian forests mitigate harmful ecological effects of agricultural diffuse pollution in medium-sized streams. Sci. Total Environ. 2019, 649, 495–503. [Google Scholar] [CrossRef]
- Viessman, W.; Lewis, G.L. Introduction to Hydrology, 5th ed.; Pearson Education: Upper Saddle River, NJ, USA, 2003; ISBN 9780673993373. [Google Scholar]
- Wallace, C.W.; McCarty, G.; Lee, S.; Brooks, R.P.; Veith, T.L.; Kleinman, P.J.A.; Sadeghi, A.M. Evaluating concentrated flow-paths in riparian forest buffer contributing areas using LiDAR imagery and topographic metrics. Remote Sens. 2018, 10, 614. [Google Scholar] [CrossRef]
- Walter, M.T.; Walter, M.F.; Brooks, E.S.; Steenhuis, T.S.; Boll, J.; Weiler, K.R. Hydrologically sensitive areas: Variable source area hydrology implications for water quality risk assessment. J. Soil Water Conserv. 2000, 55, 277–284. [Google Scholar] [CrossRef]
- Wang, H.; Guan, Y.; Hu, M.; Hou, Z.; Ping, Y.; Zhang, Z.; Zhang, Q.; Shang, F.; Lin, K.; Feng, C. Enhancing pollution management in watersheds: A critical review of total maximum daily load (TMDL) implementation. Environ. Res. 2025, 264, 120394. [Google Scholar] [CrossRef] [PubMed]
- Wang, J.; Yin, W.; Wang, L.X.; Li, N.X.; Hao, R.; Xu, J.F.; Xiao, H.B.; Zhong, Z.M.; Zhang, Y.P.; Shi, Z.H. Unraveling the effects of hydrological connectivity and landscape characteristics on reservoir water quality. J. Hydrol. 2022, 613, 128410. [Google Scholar] [CrossRef]
- Wang, L.; Zhang, F.; Shi, X.; Zeng, C.; Ahmad, I.; Wang, G.; Thapa, S.; Xu, X. Water resources system vulnerability in high mountain areas under climate change. J. Clean. Prod. 2023, 403, 136789. [Google Scholar] [CrossRef]
- Wang, S.; Wang, Y.; Wang, Y.; Wang, Z. Assessment of influencing factors on non-point source pollution critical source areas in an agricultural watershed. Ecol. Indic. 2022, 141, 109084. [Google Scholar] [CrossRef]
- Wang, T.; Zhong, M.; Lu, M.; Xu, D.; Xue, Y.; Huang, J.; Blaney, L.; Yu, G. Occurrence, spatiotemporal distribution, and risk assessment of current-use pesticides in surface water: A case study near Taihu Lake, China. Sci. Total Environ. 2021, 782, 146826. [Google Scholar] [CrossRef]
- Wischmeier, W.H.; Smith, D.D. Predicting Rainfall Erosion Losses. A Guide to Conservation Planning. The USDA Agricultural Handbook No. 537; USDA: Washington, DC, USA, 1981. Available online: https://www.ars.usda.gov/ARSUserFiles/60600505/RUSLE/AH_537%20Predicting%20Rainfall%20Soil%20Losses.pdf (accessed on 4 March 2025).
- Xiang, Z.; Chen, X.; Lian, Y. Quantifying the vulnerability of surface water environment in humid areas based on DEA method. Water Resour. Manag. 2016, 30, 5101–5112. [Google Scholar] [CrossRef]
- Xu, Q.; Zhai, L.; Guo, S.; Wang, C.; Yin, Y.; Min, X.; Liu, H. Using surface runoff to reveal the mechanisms of landscape patterns driving on various forms of nitrogen in non-point source pollution. Sci. Total Environ. 2024, 954, 176338. [Google Scholar] [CrossRef]
- Xu, Y.; Li, P.; Ma, F.; Liu, X.; Zhang, N.; Pan, J.; Meng, Y. Watershed landscape characteristics and connectivity drive river water quality under seasonal dynamics. J. Clean. Prod. 2024, 473, 143533. [Google Scholar] [CrossRef]
- Xue, J.; Wang, Q.; Zhang, M. A review of non-point source water pollution modeling for the urban–rural transitional areas of China: Research status and prospect. Sci. Total Environ. 2022, 826, 154146. [Google Scholar] [CrossRef] [PubMed]
- Xue, S.; He, Y.; Cai, H.; Li, J.; Zhu, L.; Ye, C. Risk assessment of non-point source pollution in tropical watersheds considering water functional zones. Ecol. Indic. 2025, 171, 113128. [Google Scholar] [CrossRef]
- Yang, S.; Yang, G.; Li, B.; Wan, R. Water quality improves with increased spatially surface hydrological connectivity in plain river network areas. J. Environ. Manag. 2025, 377, 124703. [Google Scholar] [CrossRef]
- Yao, L.; Shuai, Y.; Chen, X. Regional water system vulnerability evaluation: A bi-level DEA with multi-followers approach. J. Hydrol. 2020, 589, 125160. [Google Scholar] [CrossRef]
- Zeleňáková, M.; Kubiak-Wojcicka, K.; Weiss, R.; Weiss, E.; Elhamid, H.F.A. Environmental risk assessment focused on water quality in the Laborec River watershed. Ecohydrol. Hydrobiol. 2021, 21, 641–654. [Google Scholar] [CrossRef]
- Zhang, H.; Zhou, X.; Lv, X.; Xu, X.; Weng, Q.; Lei, K. Exploration of the factors that influence total phosphorus in surface water and an evaluation of surface water vulnerability based on an advanced algorithm and traditional index method. J. Environ. Manag. 2023, 342, 118155. [Google Scholar] [CrossRef] [PubMed]
- Zhang, X.; Tian, Y.; Dong, N.; Wu, H.; Li, S. The projected futures of water resources vulnerability under climate and socioeconomic change in the Yangtze River Basin, China. Ecol. Indic. 2023, 147, 109933. [Google Scholar] [CrossRef]
- Cardinali, A.; Carletti, P.; Nardi, S.; Zanin, G. Design of riparian buffer strips affects soil quality parameters. Appl. Soil Ecol. 2014, 80, 67–76. [Google Scholar] [CrossRef]
- Echeverri, A.F.; Urrutia Cobo, N.; Barona Ramírez, S.M. Vulnerabilidad de fuentes hídricas superficiales de la cuenca del río Cerrito a la contaminación difusa agrícola. Rev. Investig. Agrar. Ambient. 2020, 11, 117–130. [Google Scholar] [CrossRef]
- Ramírez, O.F.A.; Hincapié, G.E.; Sadeghian, K.S. Erodabilidad de los suelos de la zona central cafetera del departamento de Caldas. Cenicafé 2009, 60, 58–71. [Google Scholar]
- Chow, V.T.; Maidment, D.R.; Mays, L.W. Applied Hydrology, 1st ed.; McGraw-Hill: New York, NY, USA, 1988; ISBN 9780070108103. [Google Scholar]
- McCuen, R.H. Hydrologic Analysis and Design, 4th ed.; Pearson: Upper Saddle River, NJ, USA, 2016; ISBN 978-0-13-431312-2. [Google Scholar]
- Urban Hydrology for Small Watersheds: Technical Release 55 (TR-55). USDA NRCS. Available online: https://www.nrc.gov/docs/ML1421/ML14219A437.pdf (accessed on 2 January 2025).
- National Engineering Handbook, Part 630: Hydrology; U.S. Department of Agriculture, Natural Resources Conservation Service. USDA NRCS. Available online: https://directives.nrcs.usda.gov/sites/default/files2/1712930592/29495.pdf (accessed on 2 January 2025).
- Buda, A.R.; Kleinman, P.J.A.; Srinivasan, M.S.; Bryant, R.B.; Feyereisen, G.W. Effects of hydrology and field management on phosphorus transport in surface runoff. J. Environ. Qual. 2009, 38, 2273–2284. [Google Scholar] [CrossRef] [PubMed]
- Buda, A.R.; Kleinman, P.J.A.; Srinivasan, M.S.; Bryant, R.B.; Feyereisen, G.W. Factors influencing surface runoff generation from two agricultural hillslopes in central Pennsylvania. Hydrol. Process. 2009, 23, 1295–1312. [Google Scholar] [CrossRef]
- Agnew, L.J.; Lyon, S.; Gérard-Marchant, P.; Collins, V.B.; Lembo, A.J.; Steenhuis, T.S.; Walter, M.T. Identifying hydrologically sensitive areas: Bridging the gap between science and application. J. Environ. Manag. 2006, 78, 63–76. [Google Scholar] [CrossRef]
- Young, E.O.; Ross, D.S. Total and labile phosphorus concentrations as influenced by riparian buffer soil properties. J. Environ. Qual. 2016, 45, 294–304. [Google Scholar] [CrossRef]
- Kuria, A.W.; Barrios, E.; Pagella, T.; Muthuri, C.W.; Mukuralinda, A.; Sinclair, F.L. Farmers’ knowledge of soil quality indicators along a land degradation gradient in Rwanda. Geoderma Reg. 2019, 16, e00199. [Google Scholar] [CrossRef]
- Suhardiman, D.; Giordano, M.; Leebouapao, L.; Keovilignavong, O. Farmers’ strategies as building block for rethinking sustainable intensification. Agric. Hum. Values 2016, 33, 563–574. [Google Scholar] [CrossRef]


| Selected Parameters | Summary |
|---|---|
| Slope (SL) | Indicates terrain steepness, which directly influences surface runoff velocity and erosion potential [110]. Steeper slopes facilitate faster runoff, increasing the likelihood of soil particle detachment and pollutant transport toward adjacent water bodies. |
| Soil Erodibility (SE) | Reflects the intrinsic susceptibility of soils to erosion based on texture, structure, and organic matter content (OMC). Highly erodible soils are more prone to detachment under rainfall or runoff events, contributing to sediment and contaminant transport [62]. |
| Rainfall Erosivity (RE) | Quantifies the erosive force of precipitation, considering both rainfall intensity and duration. High erosivity values are associated with an increased capacity to dislodge soil particles, thereby intensifying pollutant mobilization during storm events [5]. |
| Runoff Coefficient (RC) | Represents the proportion of rainfall that becomes surface runoff, calculated using the Curve Number (CN) method. It integrates land use and soil hydrological properties to estimate water available for contaminant transport, with higher CN values indicating greater runoff potential [62]. |
| Hydrological Connectivity (HC) | Measures the spatial relationship between agricultural areas and surface water bodies. High connectivity suggests a more direct and efficient pathway for pollutants to reach aquatic systems, particularly in the absence of vegetative buffers or landscape filters [134]. |
| Water Quality Index (WQ) | Serves as an integrative indicator of a water body’s capacity to dilute or assimilate pollutants. It reflects cumulative contamination from multiple sources and provides empirical validation for the vulnerability assessment based on observed in situ data. |
| Parameters | References |
|---|---|
| SL | [135] |
| SE | [135,136] |
| RE | [136] |
| RC | [88,137,138,139] |
| HC | [88,135,136,137,138,139,140] |
| WQ | [97,111] |
| Level | Vulnerability |
|---|---|
| IIVDC < 0.2 | Very low |
| 0.2 ≤ IIVDC < 0.4 | Low |
| 0.4 ≤ IIVDC < 0.6 | Moderate |
| 0.6 ≤ IIVDC < 0.8 | High |
| 0.8 ≤ IIVDC ≤ 1.0 | Very high |
| IIVDC | Area (ha) | Proportion |
|---|---|---|
| Moderate | 72,930.93 | 62.71% |
| High | 38,415.25 | 33.03% |
| Very high | 4944.12 | 4.25% |
Disclaimer/Publisher’s Note: The statements, opinions and data contained in all publications are solely those of the individual author(s) and contributor(s) and not of MDPI and/or the editor(s). MDPI and/or the editor(s) disclaim responsibility for any injury to people or property resulting from any ideas, methods, instructions or products referred to in the content. |
© 2025 by the authors. Licensee MDPI, Basel, Switzerland. This article is an open access article distributed under the terms and conditions of the Creative Commons Attribution (CC BY) license (https://creativecommons.org/licenses/by/4.0/).
Share and Cite
Terán-Gómez, V.F.; Buitrago-Ramírez, A.M.; Echeverri-Sánchez, A.F.; Figueroa-Casas, A.; Benavides-Bolaños, J.A. Integrating AHP and GIS for Sustainable Surface Water Planning: Identifying Vulnerability to Agricultural Diffuse Pollution in the Guachal River Watershed. Sustainability 2025, 17, 4130. https://doi.org/10.3390/su17094130
Terán-Gómez VF, Buitrago-Ramírez AM, Echeverri-Sánchez AF, Figueroa-Casas A, Benavides-Bolaños JA. Integrating AHP and GIS for Sustainable Surface Water Planning: Identifying Vulnerability to Agricultural Diffuse Pollution in the Guachal River Watershed. Sustainability. 2025; 17(9):4130. https://doi.org/10.3390/su17094130
Chicago/Turabian StyleTerán-Gómez, Víctor Felipe, Ana María Buitrago-Ramírez, Andrés Fernando Echeverri-Sánchez, Apolinar Figueroa-Casas, and Jhony Armando Benavides-Bolaños. 2025. "Integrating AHP and GIS for Sustainable Surface Water Planning: Identifying Vulnerability to Agricultural Diffuse Pollution in the Guachal River Watershed" Sustainability 17, no. 9: 4130. https://doi.org/10.3390/su17094130
APA StyleTerán-Gómez, V. F., Buitrago-Ramírez, A. M., Echeverri-Sánchez, A. F., Figueroa-Casas, A., & Benavides-Bolaños, J. A. (2025). Integrating AHP and GIS for Sustainable Surface Water Planning: Identifying Vulnerability to Agricultural Diffuse Pollution in the Guachal River Watershed. Sustainability, 17(9), 4130. https://doi.org/10.3390/su17094130