Abstract
The rapid development of Connected and Autonomous Vehicles (CAVs) presents challenges in managing mixed traffic flows. Previous studies have primarily focused on mixed traffic flow involving CAVs and Human-Driven Vehicles (HDVs), or on the combination of trucks and cars. However, these studies have not fully addressed the heterogeneous mixed traffic flow consisting of CAVs and HDVs, including trucks and cars, influenced by varying human driving styles. Therefore, this study investigates the influences of the market penetration rate (MPR) of CAVs, truck proportion, and driving style on operational characteristics in heterogeneous mixed traffic flow. A total of 1105 events were extracted from highD dataset to analyze four car-following types: car-following-car (CC), car-following-truck (CT), truck-following-car (TC), and truck-following-truck (TT). Principal Component Analysis (PCA) and clustering techniques were employed to categorize distinct driving styles, while the Intelligent Driver Model (IDM) was calibrated to represent the various car-following behaviors. Subsequently, microscopic simulations were conducted using the Simulation of Urban Mobility (SUMO) platform to evaluate the impact of CAVs on sustainable traffic operations, including road capacity, stability, safety, traffic oscillations, fuel consumption, and emissions under various traffic conditions. The results demonstrate that CAVs can significantly enhance road capacity, improve emissions, and stabilize traffic flow at high MPRs. For instance, when the MPR increases from 40% to 80%, the road capacity improves by approximately 25%, while stability enhances by approximately 33%. In contrast, higher truck proportions lead to reduced capacity, increased emissions, and decreased traffic flow stability. In addition, an increased proportion of mild drivers reduces capacity, raises emissions per kilometer, and improves stability and safety. However, a high proportion of mild human drivers (e.g., 100% mild drivers) may negatively impact traffic safety when CAVs are present. This study provides valuable insights into evaluating heterogeneous traffic flows and supports the development of future traffic management strategies for more sustainable transportation systems.
1. Introduction
In recent years, the emergence of heterogeneous traffic flows, comprising Connected and Autonomous Vehicles (CAVs) and Human-Driven Vehicles (HDVs) with diverse vehicle types (e.g., trucks and cars) and driving styles (e.g., aggressive, timid, etc.), has introduced significant complexities to traffic systems. The interactions between these different vehicle types and drivers with diverse driving styles create challenges in managing traffic flow dynamics, impacting safety, efficiency, and emissions. Unlike homogeneous traffic flows dominated by cars, heterogeneous traffic flows are characterized by variations in vehicle sizes, maneuverability, and driving behaviors, making their study essential for understanding mixed traffic flow dynamics.
With the anticipated rapid adoption of CAVs in the coming years, highways are expected to sustain mixed traffic flows of CAVs and HDVs for a considerable period [1]. The integration of CAVs into traditional traffic systems introduces additional complexity, highlighting the critical need for comprehensive research to address the associated challenges [2,3]. Previous studies have extensively investigated the effects of CAVs on roadway capacity using microscopic simulations [4,5,6]. In general, CAVs facilitate the maintenance of shorter headways within traffic flows, thereby enhancing road capacity. Moreover, a significant finding is that when the market penetration rate (MPR) of CAVs reaches medium to high levels (e.g., above 40%), a notable increase in traffic capacity is realized [7,8]. However, while reduced headways can enhance traffic capacity, inappropriate headway configurations may adversely affect traffic flow safety [9]. Previous studies have revealed that with the increasing MPRs of CAVs, traffic safety identified by the Critical Impact Factor (CIF) becomes more pronounced [10,11]. This is mainly because CIF is proportional to the square of traffic speed, and CAVs typically operate at higher speeds than HDVs [12]. Similarly, studies have shown that HDVs exhibit a significantly higher susceptibility to potential collision incidents in mixed traffic flows involving CAVs [13,14,15]. In terms of fuel consumption and emissions, the application of CAVs has been shown to mitigate these metrics in diverse traffic scenarios. For example, Zhao et al. [16] designed a simulation platform to validate that the deployment of CAVs can effectively decrease fuel consumption and emissions across various road sections. In addition, Bandeira et al. [17] investigated the impact of CAVs on emissions, highlighting that the extent of reduction varies significantly across different road types, with a decrease of up to 10% observed on highways.
Earlier studies frequently assumed that traffic flows were primarily comprising cars, with trucks accounting for only a small proportion [18,19]. However, the presence of trucks significantly alters the speed distribution and affects the actual road capacity due to their greater length, weight, and reduced maneuverability compared to cars [20]. With an increasing proportion of trucks in the traffic flow, the resulting speed disparity becomes more pronounced, necessitating greater attention to its significant implications for traffic stability [21]. Mason and Woods [22] identified that trucks have a more unstable impact on traffic flow compared to cars, often contributing to increased traffic congestion. In contrast, Jin et al. [23] pointed out that trucks exhibit a greater capacity for stabilizing traffic flow compared to cars, attributed to their larger size, as demonstrated through a visual car-following model. At the same time, extensive studies have consistently confirmed the adverse impact of trucks on emissions [24,25,26]. Moreover, Yang et al. [20] highlighted the importance of considering four distinct car-following types in the analysis of heterogeneous traffic flows involving cars and trucks. These car-following types include car-following-car (CC), car-following-truck (CT), truck-following-car (TC), and truck-following-truck (TT).
Some studies have highlighted the substantial impact of distinct human driving styles (e.g., aggressive, non-aggressive) on traffic flow dynamics [27]. These revealed the critical importance of accounting for driving styles within car-following models to investigate the traffic flow dynamics. In general, driving styles were classified into two categories (i.e., aggressive and normal) [28] or three categories (i.e., aggressive, normal, and calm) [29] to facilitate the analysis of their impacts on traffic capacity, stability, and other related dynamics. Moreover, some studies have examined the influence of driving styles on car-following model parameters, identifying driving styles from the actual trajectory data [27,30]. According to the calibrated Intelligent Driver Model (IDM) parameters, Li et al. [31] investigated the influences of aggressive driving style on traffic capacity and stability using linear methods and the capacity calculation method. It has been widely recognized that aggressive driving styles can enhance traffic capacity and improve traffic efficiency to some extent, but this comes at the expense of reduced traffic safety [30,31,32]. Notably, variations in the data utilized across studies, coupled with substantial differences in the calibrated parameters of car-following models, have resulted in the absence of a consistent standard for defining driving styles.
Table 1 provides the studies that investigated heterogeneous traffic flows, focusing on distinct vehicle types and human driving styles. Most studies focused on mixed traffic flow consisting of CAVs and HDVs, or on the combination of trucks and cars, while failing to account for the impact of human driving style. To fill this gap, this study aims to investigate the traffic flow dynamics of mixed traffic flows comprising CAVs, cars, and trucks, while also accounting for the effects of human driving styles. Specifically, this study examines the influence of the MPR of CAVs, truck proportion, and human driving style on the operational characteristics of heterogeneous mixed traffic flow. The Simulation of Urban Mobility (SUMO) platform is applied to design microscopic simulations for analyzing the operational characteristics, including capacity, stability, safety, etc. Overall, the contributions of this study are summarized as follows:

Table 1.
Summary of the existing studies in investigating traffic flow characteristics.
- (1)
- This study examines the traffic operational characteristics of mixed traffic flows, consisting of CAVs, cars, and trucks, through the implementation of microscopic simulations on the SUMO platform.
- (2)
- A comprehensive evaluation of mixed traffic flow is conducted, examining key metrics such as capacity, stability, safety, oscillation, fuel consumption, and emissions. This analysis considers the impacts of varying MPRs of CAVs, truck proportions, and the distribution of human driving styles.
The structure of this paper is organized as follows. Section 2 presents the methodology adopted in this study. Section 3 describes the experimental results, including the data source, driving style classification, and car-following model calibration. Section 4 presents the simulation analysis for the traffic flow characteristics. Section 5 summarizes the main conclusions.
2. Methodology
This study focuses on heterogeneous traffic flows on multilane freeways, consisting of CAVs and HDVs, with the latter encompassing both car and trucks. The research framework consists of three stages: data preparation, ciliation of car-following models, and microscopic simulations, as shown in Figure 1. In the first stage, the car-following data were extracted from the highD dataset and categorized into four car-following types, that is CC, CT, TC, and TT. Then, the car-following data are applied to classify driving styles and calibrate car-following models for each style. Finally, a set of microscopic simulations are performed to examine the traffic flow characteristics, including fundamental diagrams, stability, safety, and so on.
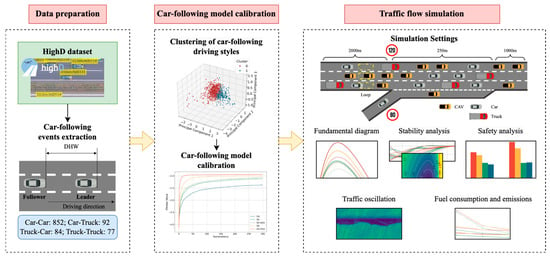
Figure 1.
Research framework of this study.
2.1. Car-Following Models for Vehicle Control
2.1.1. Intelligent Driver Model
The Intelligent Driver Model (IDM), introduced by Treiber et al. [43], has been widely recognized for its strong capability in describing human car-following behaviors. Therefore, this study adopts the IDM as the foundational car-following model to represent and control car-following behaviors of human drivers. The formulation of IDM is given as follows:
where denotes the acceleration of the following vehicle at time , as calculated using the IDM; , , and denote speed, speed difference, and spacing at time , respectively; is the maximum desired acceleration; denotes the maximum desired speed, which is the highest speed achievable under free-flow traffic conditions and is generally considered as the maximum speed limit (33.3 ) [31]; and indicates the optimal distance between two sequential vehicles, formulated as follows:
where is the minimum safe distance, denotes the safe time headway, and is the comfortable deceleration.
2.1.2. Cooperative Adaptive Cruise Control
The car-following behavior of CAVs is modeled using the cooperative adaptive cruise control (CACC) model, which effectively captures the relationship between vehicle acceleration, relative speed, and distance. The CACC model incorporates more realistic dynamics, with its parameters calibrated using empirical trajectory data obtained from field experiments [44,45]. The formulations of the CACC model are expressed as follows:
where and are the gap error and its differential of the following vehicle, respectively. and are the control gains used to adjust the time-gap error relative to the preceding vehicle. Based on experimental recommendations, the typical parameter values are and . In this study, intra-platoon following is defined by a time gap of [44]. For inter-platoon following, where a CAV follows the last vehicle of a maximum-size platoon, the time gap increases to , with control gains adjusted to and [46]. Then, the acceleration of the following vehicles is determined using a first-order Taylor expansion, formulated as follows:
where is the iteration time step, set to 0.01 [40].
2.2. Calibration of Car-Following Model
The objective of calibrating car-following models is to adjust the model parameters so that the model’s output (i.e., simulated trajectory) closely aligns with the observed real-world trajectory. Generally, the calibration process is considered a nonlinear optimization problem, provided as follows:
where represents the parameter vector of the car-following model to be calibrated, with its dimensionality varying according to the specific model; denotes the function of the car-following models; and denote the lower and upper bounds for , respectively; is a vector of constraint functions, and and refer to the observed and simulated measures of performance (MoPs). The objective function quantifies the difference between and , and the goodness-of-fit function is used to evaluate the calibration performance. Overall, the calibration process seeks to minimize by integrating the car-following model, observed data, and optimization algorithm while considering model parameters, MoPs, and constraints.
For the objective function, according to the study by Punzo et al. [47], the Normalized Root Mean Square Error (NRMSE) is adopted to measure the differences between the observed and simulated motion states. The formulations are given as follows:
where , , and represent the predicted spacing, speed, and acceleration, while , , and denote the actual spacing, speed, and acceleration, respectively. represents the length of the time series in the car-following event.
To ensure the accurate calibration of the car-following model parameters, five widely recognized optimization algorithms were selected for a comparative analysis, including Differential Evolution–Particle Swarm Optimization (DE-PSO) [48], the Genetic Algorithm (GA) [49,50], Simulated Annealing (SA) [51], Differential Evolution (DE) [52], and the Simulated Annealing–Adaptive Genetic Algorithm (SA-AGA) [53].
2.3. Analysis of Traffic Flow Characteristics
2.3.1. Fundamental Diagram Model
The Van Aerde model is widely regarded as capable of effectively capturing traffic flow dynamics under various conditions, including highways, arterial roads, and tunnels [54]. This model excellently represents the relationship between flow, speed, and density, demonstrating strong applicability and descriptive power. As a classic single-regime model, the speed–density and speed–flow relationship functions in the Van Aerde model are given as follows:
where , , and represent flow, density, and speed, respectively. The fundamental diagram model is grounded in four critical traffic flow parameters, including the free-flow speed , the capacity , the jam density , and the critical speed . In addition, , , and represent intermediate variables within the model, which are determined as follows:
2.3.2. Stability
To theoretically analyze the stability of heterogeneous traffic flow, it is necessary to determine the proportion of different car-following types. Let and denote the proportion of trucks and CAVs in the mixed traffic flows, respectively, and let represent the total number of vehicles; then, the number of trucks, cars, and CAVs can be calculated as follows:
where , , and are the number of trucks, cars, and CAVs in the mixed traffic flow, respectively. Subsequently, it is essential to determine the proportion of various car-following types within each vehicle category (i.e., car, truck, and CAV). Given that this study primarily examines the impact of composition proportions on stability, the platoon intensity of CAVs is disregarded for simplicity. Furthermore, the car-following types of vehicles preceding CAVs are not differentiated in the calculations.
The number of vehicles for different car-following types is calculated as follows:
where and . To account for the diverse driving styles of human drivers, is introduced to represent the proportion of a specific driving style within a certain car-following type , and . Note the car-following type and driving style in this study. The number of vehicles and the corresponding proportion for car-following type under driving style are formulated as follows:
where is the proportion of CAVs in the mixed traffic flow, and . Then, the condition of linear stability for homogenous traffic flow can be formulated as follows:
where quantifies the relationship between the sensitivity of traffic flow to changes in speed, speed differences, and time headway. A positive value denotes that the traffic flow is stable.
As this study primarily focuses on the impact of traffic composition on traffic stability, the effects of time delays are not considered [40]. Consequently, . Substituting Equations (1)–(5) into Equations (24) and (25) yields the corresponding stability discriminant:
where represents the vehicle speed; is the free-flow speed (i.e., 33.3 ); , , and denote the maximum acceleration, desired deceleration, minimum safe distance, and safe time headway for a specific car-following type under driving style of HDVs, respectively. For CAVs, there is
Regardless of the maximum platoon size (i.e., intra-platoon), is a defined value in related studies [40]. For the mixed traffic flow, Ngoduy [55] introduced a stability discriminant formula based on Equation (32). Here, represents a composite stability index that assesses the overall stability of mixed traffic flow by incorporating the proportions of various car-following behaviors. A value of signifies stable traffic conditions. Considering the influence of the proportions of various car-following types, the stability condition for mixed traffic flow developed in this study is formulated as follows:
2.3.3. Fuel Consumption and Emissions
Various models have been developed to assess vehicle fuel consumption and emissions. Among them, the VT-Micro model, which estimates fuel consumption and emission rates based on instantaneous speed and acceleration, is regarded as highly effective. This model is frequently used in traffic research due to its ease of computation, straightforward parameterization, and flexibility across different traffic conditions. In this study, this model is employed to calculate fuel consumption and emission rates, with its mathematical expression provided as follows:
where represents the rate of fuel consumption or emissions (e.g., carbon monoxide CO, hydrocarbon HC, etc.); and denote the exponent coefficients of speed and acceleration, respectively, while refers to the regression coefficient corresponding to the -th power of speed and the -th power of acceleration, while and represent the vehicle’s speed and acceleration, respectively. This model was proposed and calibrated using field data form Oak Ridge National Laboratory [56], and the calibrated regression coefficients have been adopted in various studies [16,34].
3. Experimental Results
3.1. Data Preparation
3.1.1. HighD Dataset
The highD dataset is a high-precision naturalistic driving trajectory dataset collected on German highways [57]. It covers traffic conditions in six different highway segments, each approximately 420 m long, and comprises 60 video recordings with a total duration of around 16.5 h. The dataset includes trajectories of 69,751 cars and 16,211 trucks, with vehicle trajectory data sampled at 25 Hz. Each trajectory contains detailed information, such as timestamps, vehicle IDs, motion states (e.g., position, speed), and the information of leading vehicles. In this study, all 60 videos (Videos 1–60) were selected for the subsequent analysis.
3.1.2. Car-Following Event Extraction
In previous studies, numerous studies have proposed criteria for extracting car-following events [58]. These criteria typically focus on factors such as distance headway (DHW), time headway (THW), and vehicle speed. In this study, the criteria for identifying and extracting car-following events were established as follows:
- The leading and following vehicles must be in the same lane and travel in the same direction;
- The DHW between vehicles must be less than 150 m;
- The THW between vehicles must be less than 6 s;
- The duration of the car-following event must exceed 30 s.
Finally, according to the highD dataset, 852 CC events, 92 CT events, 84 TC events, and 77 TT events were extracted for analysis.
3.2. Classification of Driving Styles
To investigate the variations in driving styles across different car-following types, this section employs several clustering methods to classify car-following events into distinct driving styles. According to the classified car-following event data, the model parameters corresponding to various driving styles can be effectively calibrated.
In this study, seven common driving behavior parameters, including average and maximum acceleration/deceleration, the frequency of acceleration/deceleration changes, and average time headway were selected as metrics to cluster distinct driving styles [27]. To obtain satisfied clustering results, the Gaussian mixture model, spectral, K-means, and agglomerative average clustering methods were chosen to categorize driving styles, and the method with the best performance is regarded as the final result. Before clustering, the Principal Component Analysis (PCA) was employed to reduce the dimensionality of the high-dimensional imputed variables. Unlike nonlinear methods discussed in the work by Lespinats et al. [59], PCA offers advantages in terms of interpretability and computational efficiency. During the PCA training process, four principal components were selected, which collectively retained approximately 90% of the total variance in the data. The main contributing metrics included average acceleration, average deceleration, maximum acceleration, maximum deceleration, and average time headway. Moreover, the silhouette score and the Davies–Bouldin (DB) index are selected as evaluation metrics. Figure 2 illustrates the variation in silhouette scores and DB indices across different numbers of clusters for the CC events. Accordingly, the number of clusters is set to two, grouping driving styles into two categories, consist with findings from previous studies [28,31].
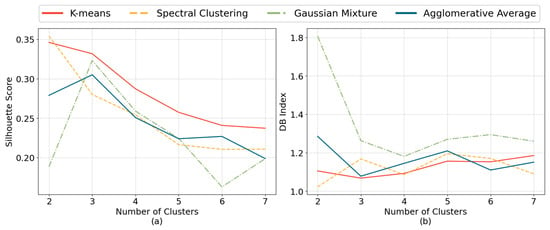
Figure 2.
Trends of evaluation metrics for different clustering methods applied to CC events. (a) silhouette score; (b) DB index.
According to the comparison, the optimal clustering results for driving styles are summarized in Table 2. Note that the most suitable model determined by the silhouette coefficient may vary depending on the specific car-following type. Moreover, the classification diagrams for diverse car-following types are illustrated in Figure 3. To further validate the differences in driving behaviors for the classified driving styles, a Multivariate Analysis of Variance (MANOVA) was performed. Compared to Univariate Analysis of Variance (ANOVA), MANOVA incorporates the covariance structure among multiple dependent variables, providing a more comprehensive evaluation of group differences and improving the ability to detect overall variations. In this study, Wilks’ Lambda is used to measure the magnitude of between-group differences, with smaller values indicating larger differences. The Pillai’s Trace assesses the proportion of variance explained by the between-group differences, with larger values indicating stronger differences. The results are shown in Table 3; there are significant differences among district driving styles and car-following types, with p-values all less than 0.001. In addition, in terms of F-value, the differences in the car-following types composed of the same vehicle type (i.e., CC, TT) are more pronounced than those between car-following pairs composed of different vehicle types (i.e., CT and TC).

Table 2.
Summary of clustering results for driving styles.
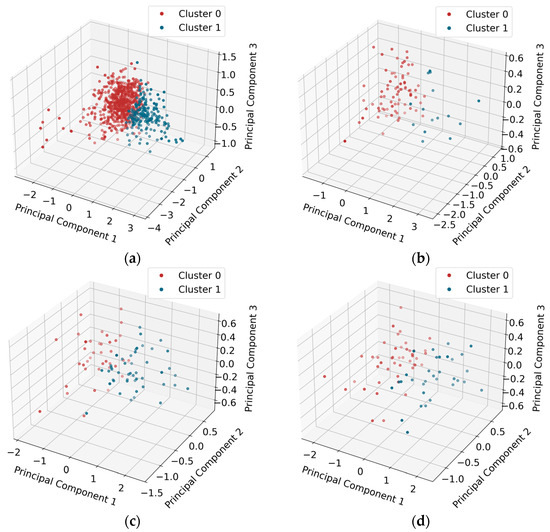
Figure 3.
Classification diagrams for different car-following types. (a) CC; (b) CT; (d) TC; (d) TT.

Table 3.
Summary of MANOVA results.
Furthermore, four metrics were chosen to capture the differences in driving behaviors, including average acceleration, average deceleration, average time headway, and average CIF. The kernel density estimation functions are presented in Figure 4. From Figure 4, the driving behavior parameters of two driving styles exhibit obvious differences with a specific car-following type. Cluster 0 exhibits higher acceleration, deceleration, and CIF values, as well as smaller time headways, while cluster 1 shows the opposite trends.
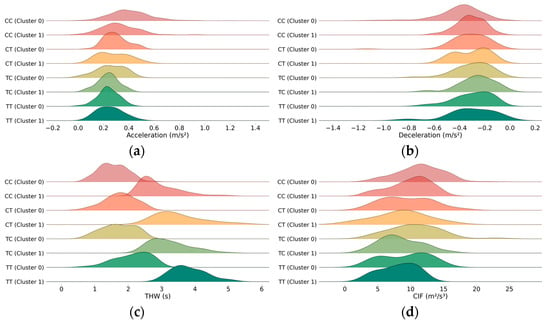
Figure 4.
Kernel density estimation distributions for driving behavior parameters. (a) Acceleration; (b) deceleration; (c) THW; (d) CIF. The colors are for visual distinction only.
3.3. Calibration Results Analysis
For the calibration of the car-following model, five optimization algorithms are employed, including DE-PSO, GA, SA, DE, and SA-AGA. To ensure convergence, the maximum number of generations is set to 300. The corresponding convergence curves are presented in Figure 5. In addition, the ranges of car-following model parameters are set as follows: the maximum desired acceleration and comfort deceleration are set to [0.1, 5] , the minimum safe distance is set to [0.1, 10] , and the safe time headway is set to [0.1, 5] . As shown in Figure 5, all optimization algorithms demonstrate satisfactory calibration of the car-following model parameters. Among these, the DE-PSO algorithm exhibits superior performance in terms of convergence speed and final fitness value compared to the other algorithms. Consequently, the results obtained from the DE-PSO algorithm are selected for subsequent analysis.
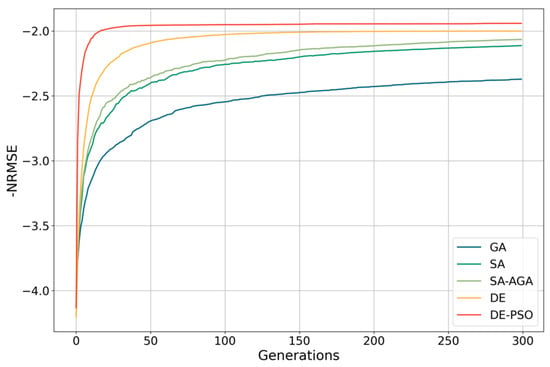
Figure 5.
Fitting performance for different optimization algorithms.
Table 4 presents the calibration results of the IDM parameters for various car-following types. Recall that only four parameters were calibrated in this study, while the maximum desired speed was set to a default value of 33.3 . According to previous studies using car-following data from similar scenarios [31,32,60], the most sensitive parameter, the safe time headway , is approximately 1.5 for the normal driving style and 2.0 for the mild driving style. Therefore, cluster 0 and cluster 1 are labeled as the normal and mild driving styles, respectively. In addition, the maximum desired acceleration of normal driving style is generally higher than that of mild driving style. Taking CC type as an example, the safe time headway and the maximum desired acceleration are 1.33 and 1.13 for the normal driving style and 2.07 and 0.97 for the mild style, respectively.

Table 4.
Calibration results of IDM parameters.
4. Simulation Analysis
4.1. Simulation Settings
In this study, the simulations were performed on the SUMO platform. The schematic diagram of the simulation scenario is presented in Figure 6. The scenario consists of a 3.25 km freeway with three lanes and a single-lane on-ramp. The on-ramp, located 2 km from the starting point of the segment, includes a 250 m acceleration lane and frequently serves as a congestion hotspot [11]. The main roadway is regulated with a speed limit of 120 km/h, while the on-ramp has a speed limit of 80 km/h [57]. Additionally, trucks on the main road are subject to a speed limit of 80 km/h [61]. Traffic parameters, including flow, speed, and density, are recorded at one-second intervals at the entry point of the on-ramp using installed detectors.
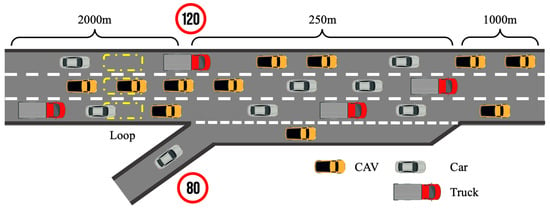
Figure 6.
Schematic diagram of the simulation road segment.
This study aims to investigate the traffic flow dynamics under complex conditions, including MPR for CAVs, truck proportion, and driving style for HDVs. The MPR of CAVs is set at 40%, 60%, and 80%, corresponding to medium-to-high MPR levels [7,62,63], while the truck proportion is configured at 10%, 20%, and 30%, according to the observed typical proportion [21]. For HDVs, the proportion of driving styles is set to three categories: (a) only normal, representing HDVs driven exclusively by normal drivers; (b) realistic proportions based on the results presented in Table 2; (c) only mild, representing HDVs driven exclusively by mild drivers. In addition, the traffic flow is set to 1200 on the mainline and 500 on the on-ramp. This setting represents a moderately congested traffic condition. The lane-changing behavior is controlled by the LC2013 model in SUMO.
4.2. Fundamental Diagrams
In this section, the impacts of the MPR of CAVs and the truck proportion on the fundamental diagram across various traffic conditions are investigated. The proportions of HDVs are set to only normal, realistic proportions, and only mild. In contrast to the Greenshields and Newell models, which are suited for free-flow traffic conditions, the Van Aerde model is employed in this study to capture the dynamics of congested traffic flow [64]. This model is used to fit the fundamental diagrams, with the resulting density–flow plots, based on the recorded traffic parameters (such as flow, density, and speed) during the simulation, presented in Figure 7. It is evident that as the proportion of normal drivers increases, the road capacity demonstrates a significant improvement. This can be attributed to the tendency of normal drivers to maintain shorter headways, thereby reducing the spacing between vehicles and enhancing traffic density. Moreover, the presence of trucks substantially decreases road capacity, with a reduction of up to 30% observed as truck proportions increase from 10% to 30%. In contrast, CAVs exhibit a positive impact on road capacity by facilitating smoother traffic flow and minimizing time headway variations.
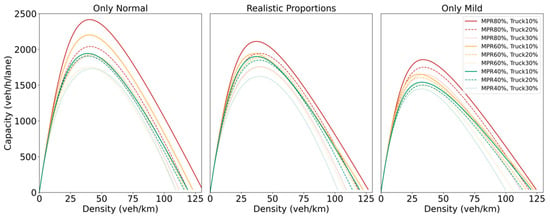
Figure 7.
Density–flow plots for different traffic conditions.
4.3. Traffic Stability
4.3.1. Stability Analysis
The purpose of stability analysis is to determine whether disturbances arising from disruptions in a string of vehicles will propagate or dissipate along the string [65]. The stability analysis in this study is grounded in theoretical exploration, focusing on the effects of the IDM parameters on stability within mixed traffic flow. Figure 8 presents the stability conditions for a single parameter of IDM within mixed traffic flow. Note that in this section, the mixed traffic flow consists of 40% CAVs and 60% HDVs, with all HDVs following the CC type under a normal driving style. Figure 8a–d illustrate the stability curves as a function of speed, where three IDM parameters are held constant, and the remaining parameter is varied. The F values are computed using Equation (26). It can be observed that an increase in the maximum desired acceleration and safe time headway enhances stability, which is consistent with the findings in [66]. In addition, an increase in comfortable deceleration and minimum safe distance results in a decrease in stability.
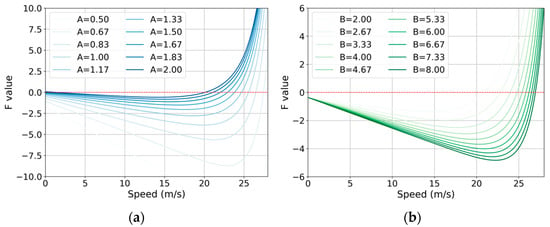
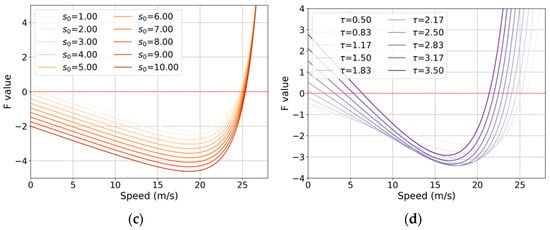
Figure 8.
Impact of IDM parameters on stability. (a) B = 4.07, = 3.83, and τ = 1.33; (b) = 1.13, = 3.83, and = 1.33; (c) = 1.13, = 4.07, and = 1.33; (d) = 1.13, = 4.07, and = 3.83.
We investigated traffic stability under various car-following types and driving styles, assuming the presence of HDVs in the traffic flow. The stability curves are illustrated in Figure 9. While it is unrealistic for only one vehicle type (car or truck) to exhibit CT and TC behaviors, these behaviors are included in the figure for the sake of a comprehensive comparison. The two behaviors observed in practice, namely CC and TT, are depicted by bold curves. It is evident that when only trucks are present, mild driving behavior reaches a stable state more quickly than normal driving behavior, although it exhibits lower stability within the medium-speed range. Conversely, when only cars are present, the speed range at which stability is achieved is nearly identical. However, within the unstable speed range, mild driving behavior displays lower stability compared to normal driving behavior. Regarding the CT and TC behaviors, the stability differences attributable to the driving styles within each type mirror those observed for CC and TT. Moreover, CT demonstrates higher stability, whereas TC shows significantly lower stability than the other behaviors.
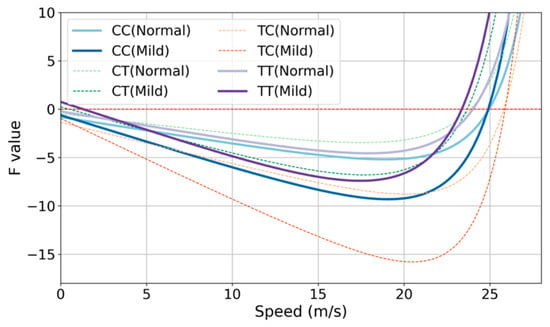
Figure 9.
Stability curves of different car-following types.
This study also investigates the stability of mixed traffic flow under varying MPRs of CAVs, truck proportions, and distributions of human driving styles, with the results presented in Figure 10. In Figure 10, the dotted lines represent the values calculated using Equation (32). The red curve indicates the boundary where , with regions where considered stable. It can be observed that as the MPR of CAVs increases, the stability of the heterogeneous traffic flow progressively improves. In contrast, as the proportion of trucks rises, the blue area within the unstable region expands, signifying a decrease in the stability of the mixed traffic flow. Moreover, an increase in the proportion of mild drivers results in an expansion of the stable speed range for heterogeneous traffic flow, although the value within the unstable region decreases. Notably, Figure 10 reveals a higher contour density in the high-speed range (15–25 m/s) compared to the low-speed range (0–15 m/s), suggesting that heterogeneous traffic flow in the high-speed region is more sensitive to changes in the MPR of CAVs. In addition, higher proportions of trucks and mild drivers lead to denser contour distributions, further emphasizing the impact of these factors on traffic flow stability.
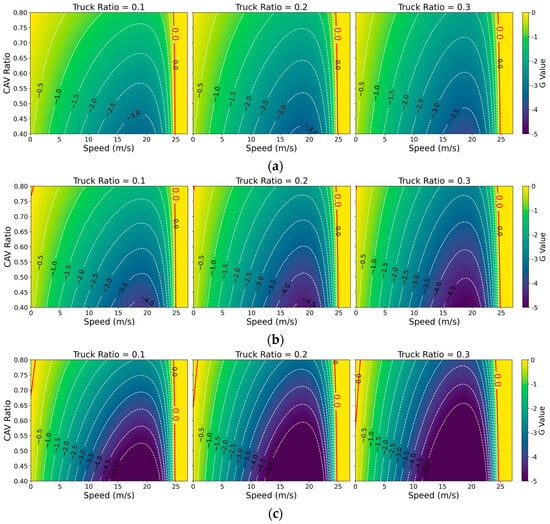
Figure 10.
Stability analysis of heterogeneous traffic flow. (a) Only normal; (b) realistic proportions; (c) only mild.
4.3.2. Fluctuation in Speed and Acceleration
In this section, we analyze the recovery process of heterogeneous traffic flow by introducing small disturbances. The simulations randomly generate cars, trucks, and CAVs on a highway, and their distribution is simulated using Equations (14)–(23). Subsequently, the initial state is disturbed by altering the speed of the leading vehicle [66]. Figure 11, Figure 12 and Figure 13 display the speed and acceleration curves as a function of time under different conditions, with the equilibrium speed set to 20 m/s [40]. The speed curves are zoomed in on the 70–80 s range in the lower right corner to observe the consistency in the string of vehicles’ speed after recovery. Figure 11 shows the time required for the disturbance to dissipate under varying MPRs of CAVs, with the proportion of trucks fixed at 20% and the proportion of human driver styles as specified in Table 4. It can be observed that as the MPR of CAVs increases, the recovery time decreases, and the consistency of speed after recovery significantly improves. Figure 12 shows the speed curve when only the truck proportion is adjusted. As the truck proportion increases, the recovery time does not increase significantly, but the speed differences within the string of vehicles after recovery become more pronounced. In Figure 13, when only the proportion of human driver styles is altered, as the proportion of mild drivers increases, both the recovery time and the speed differences after recovery gradually increase. These findings align with the conclusions of the theoretical analysis in the previous section.
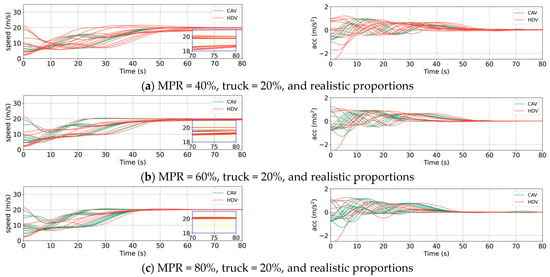
Figure 11.
Speeds and accelerations of vehicles under different MPRs of CAV. (a) MPR = 40%; (b) MPR = 60%; (c) MPR = 80%.
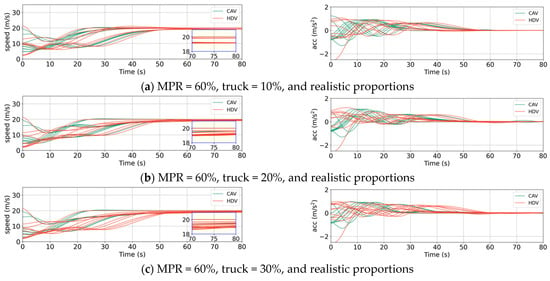
Figure 12.
Speeds and accelerations of vehicles under different truck proportions. (a) Truck = 10%; (b) truck = 20%; (c) truck = 30%.
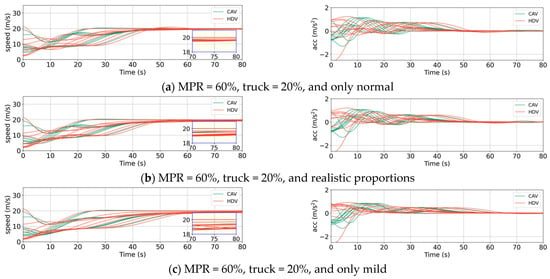
Figure 13.
Speeds and accelerations of vehicles with different compositions of driving styles. (a) Only normal; (b) realistic proportions; (c) only mild.
4.4. Traffic Safety
CIF quantifies the severity of potential collisions in mixed traffic conditions. It is calculated based on the relationship between the following vehicle’s speed and the time required for two vehicles to collide, assuming they maintain their current speed and trajectory. CIF reflects the ratio of the following vehicle’s kinetic energy to the available time before a collision, thus serving as an indicator of traffic safety. The formulas of the CIF are given as follows:
where and denote the speeds of the leading and following vehicles, respectively, and is the distance between these two vehicles.
Figure 14 presents the distributions of the CIF across various scenarios. The results suggest that an increase in the proportion of normal driving styles among HDVs is associated with a decline in overall traffic safety. Notably, when considering different compositions of HDV driving styles that are only normal and realistic proportions, variations in the MPRs of CAVs have a minimal impact on overall traffic safety. However, in scenarios where HDVs exclusively exhibit mild driving styles, and the proportion of trucks is relatively high, an increase in the MPRs of CAVs may potentially detriment traffic safety to some degree. Moreover, the results demonstrate that trucks consistently exhibit considerably lower CIF values compared to cars, suggesting a higher safety level within the traffic flow. As the proportion of trucks increases, particularly in scenarios where all HDVs follow mild driving styles, the presence of trucks further mitigates collision risks and enhances overall traffic safety. In sum, these findings suggest that in heterogeneous traffic flows, CAVs are more effective in environments where HDVs exhibit more aggressive driving behaviors. Conversely, in scenarios dominated by cautious driving behaviors, an increase in the MPR of CAVs may lead to a deterioration in the safety of HDVs.
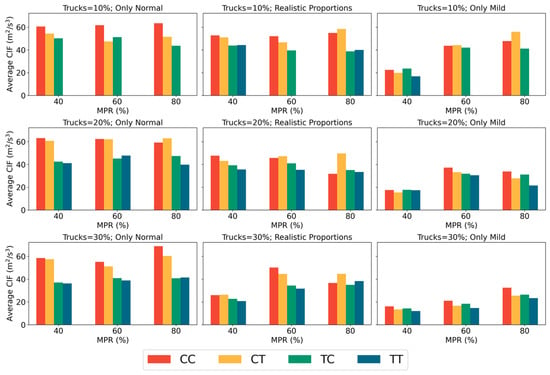
Figure 14.
Comparison of average CIF values under different scenarios.
4.5. Traffic Oscillation
Figure 15, Figure 16 and Figure 17 illustrate the spatiotemporal diagrams for various scenarios, offering a comprehensive visualization of traffic dynamics along the roadway. These diagrams are employed to investigate the shockwaves induced by stop-and-go behaviors in mixed traffic environments. Vehicle speeds are encoded using a color gradient, with dark blue representing congested areas, thereby facilitating an intuitive representation of traffic flow patterns. For the sake of clarity, the warm-up period is set to 300 .
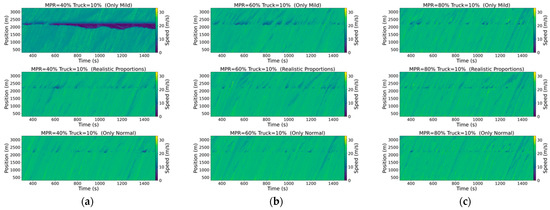
Figure 15.
Spatiotemporal diagrams under different scenarios with a truck proportion of 10%. (a) MPR = 40%; (b) MPR = 60%; (c) MPR = 80%.
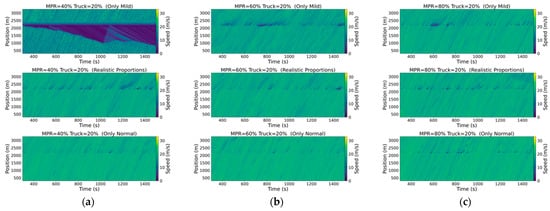
Figure 16.
Spatiotemporal diagrams under different scenarios with a truck proportion of 20%. (a) MPR = 40%; (b) MPR = 60%; (c) MPR = 80%.
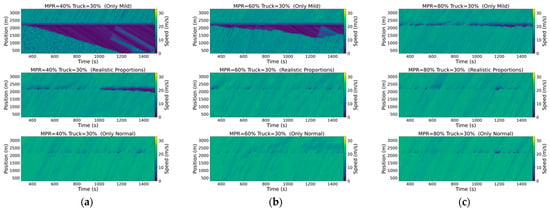
Figure 17.
Spatiotemporal diagrams under different scenarios with a truck proportion of 30%. (a) MPR = 40%; (b) MPR = 60%; (c) MPR = 80%.
These spatiotemporal diagrams illustrate the directional patterns and extent of shockwave propagation resulting from stop-and-go behavior. It can be observed from the figures that as the MPR of CAVs increases, both the frequency and intensity of upstream shockwaves decrease. Additionally, when the driving behavior of human drivers predominantly exhibits mild driving styles, congestion tends to worsen across several scenarios. In contrast, the impact is the opposite when normal driving behaviors dominate. This suggests that more cautious driving styles lead to more frequent braking and reduced speeds, resulting in longer-lasting congestion. These findings align with subsequent analyses on emissions, where an increase in the proportion of mild-style drivers correlates with higher emissions, attributable to the more congested traffic conditions. Furthermore, an increase in the proportion of trucks in the traffic flow is associated with a significant expansion in the range of upstream shockwave propagation. Overall, these findings suggest that while an increase in the MPR of CAVs contributes to alleviating traffic congestion, the driving style and truck proportion within the traffic flow play a critical role in shaping traffic dynamics. Specifically, when human drivers exhibit a mild driving style, higher truck proportions coupled with an increased MPR of CAVs can exacerbate congestion and reduce traffic efficiency.
4.6. Fuel Consumption and Emissions
This section investigates the influence of varying proportions of different driving styles, MPRs of CAVs, and truck proportions on fuel consumption and emissions. The analysis is expressed in terms of veh/km, as the focus is on the consumption and emissions associated with car types, including CAVs and excluding trucks. The results are presented in Figure 18, which shows that as the proportion of trucks increases, both fuel consumption and emissions rise. In contrast, a higher MPR of CAVs leads to a significant reduction in both fuel consumption and emissions. Additionally, when the traffic flow is dominated by drivers exhibiting normal driving styles, fuel consumption and emissions per kilometer generally decrease. This can be attributed to the fact that, under similar traffic demand, mild-style drivers tend to lower average speeds, which increases traffic congestion and consequently leads to higher fuel consumption and emissions per kilometer.
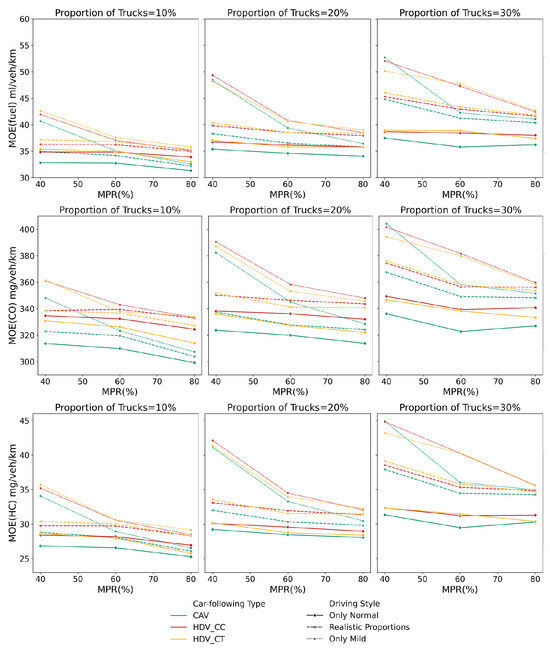
Figure 18.
Comparison of fuel consumption and emissions under different scenarios.
5. Conclusions
We investigated the traffic operational characteristics in mixed flow, consisting of both CAVs and HDVs, with HDVs further categorized into cars and trucks. The car-following event data extracted from the highD dataset were used to identify the driving styles of HDVs. This study examined the fundamental diagrams, stability, safety, oscillation, consumption, and emission associated with various driving styles, MPRs of CAVs, and truck proportions in mixed traffic flow. The main findings are concluded as follows:
- (1)
- As the MPR of CAVs increases, the road capacity improves significantly. However, this enhancement is more sensitive to variations in the truck proportions within the traffic flow. For instance, when the MPR of CAVs increases from 40% to 80%, the road capacity improves by approximately 25% under the same truck proportion. Moreover, as the proportion of mild driving styles among HDVs increases, the effect on road capacity becomes more significant, particularly at higher MPRs of CAVs. This is primarily reflected in greater reductions in capacity when the truck proportion increases or when the proportion of mild drivers rises.
- (2)
- With an increase in the MPR of CAVs and the proportion of normal driving styles among human drivers, the stability improves markedly, resulting in smaller speed differences within the vehicle string once stability is restored. As the MPR of CAVs increases from 40% to 80%, the stability recovery time decreases by approximately 33%. When all human drivers exhibit mild driving styles, the recovery time increases by 25% compared to scenarios where all drivers adopt normal driving styles. When the truck proportion rises, the trend of longer transition times from disturbance to stability becomes less pronounced. Nevertheless, it remains evident that a higher truck proportion correlates with greater speed disparities within the vehicle string after stability is regained.
- (3)
- In traffic safety, when the proportion of normal driving styles among human drivers is high, an increase in the MPR of CAVs has a minimal impact on the safety of human drivers. However, when all human drivers adopt mild driving styles, an increase in the MPR of CAVs results in a significant decline in safety, as evidenced by higher CIF values. In this context, an increase in the truck proportion enhances safety, with this improvement being particularly noticeable in environments with a high MPR of CAVs. Hence, the introduction of CAVs should prioritize adaptation to the mild driving styles of human drivers to avoid safety degradation caused by higher MPRs of CAVs, ultimately leading to an overall improvement in traffic safety.
- (4)
- Finally, an increase in the truck proportion or the proportion of mild drivers leads to higher fuel consumption and emissions, with this effect being more pronounced in environments with low MPRs of CAVs. Traffic oscillation analysis reveals that these scenarios result in more severe congestion, contributing to poorer ecological and environmental outcomes. Additionally, fuel consumption and emissions are higher in the CC type than in the CT type as cars tend to exhibit more aggressive behaviors when following other cars.
Several limitations should be addressed in future work. First, the consideration of driver heterogeneity is limited. Due to constraints in the SUMO simulation logic, the study does not incorporate the distribution of driving style parameters within car-following models. Secondly, this study does not account for external factors such as weather conditions and road surface quality. Future work should comprehensively explore the impact of these external variables on mixed traffic flow dynamics. Thirdly, macroscopic approaches [67,68,69], such as Partial Differential Equations (PDEs), should be considered to examine the heterogeneous traffic flow dynamics within a traffic network system, offering a complementary perspective to the microscopic approach.
Author Contributions
Conceptualization, D.L. and Y.Z.; methodology, S.W. and D.L.; software, D.L. and X.C.; validation, X.C., Y.W. and A.M.; formal analysis, S.W. and Y.Z.; investigation, Y.W. and A.M.; resources, S.W. and Y.Z.; data curation, D.L.; writing—original draft preparation, S.W., Y.Z. and D.L.; writing—review and editing, S.W., D.L. and X.C.; visualization, Y.W.; supervision, Y.Z. and A.M.; project administration, Y.Z. and X.C.; funding acquisition, Y.Z. All authors have read and agreed to the published version of the manuscript.
Funding
This research was funded by the Shanghai Science and Technology Committee (Grant No. 22QB1406100) and the Fundamental Research Funds for the Central Universities (Grant No. 22120230310).
Institutional Review Board Statement
Not applicable.
Informed Consent Statement
Not applicable.
Data Availability Statement
Dataset available on request from the authors.
Conflicts of Interest
Author Yinsong Wang was employed by the company Nebula Link (Shanghai) Technology Co., Ltd. The remaining authors declare that the research was conducted in the absence of any commercial or financial relationships that could be construed as a potential conflict of interest.
References
- Gong, B.; Wang, F.; Lin, C.; Wu, D. Modeling HDV and CAV mixed traffic flow on a foggy two-lane highway with cellular automata and game theory model. Sustainability 2022, 14, 5899. [Google Scholar] [CrossRef]
- Chen, D.; Srivastava, A.; Ahn, S.; Li, T. Traffic dynamics under speed disturbance in mixed traffic with automated and non-automated vehicles. Transp. Res. Part C Emerg. Technol. 2020, 113, 293–313. [Google Scholar]
- Chen, X.; Wu, H.; Han, B.; Liu, W.; Montewka, J.; Liu, R.W. Orientation-aware ship detection via a rotation feature decoupling supported deep learning approach. Eng. Appl. Artif. Intell. 2023, 125, 106686. [Google Scholar]
- Zhou, J.; Zhu, F. Modeling the fundamental diagram of mixed human-driven and connected automated vehicles. Transp. Res. Part C Emerg. Technol. 2020, 115, 102614. [Google Scholar]
- Yang, S.; Du, M.; Chen, Q. Impact of connected and autonomous vehicles on traffic efficiency and safety of an on-ramp. Simul. Model. Pract. Theory 2021, 113, 102374. [Google Scholar] [CrossRef]
- Yao, Z.; Ma, Y.; Ren, T.; Jiang, Y. Impact of the heterogeneity and platoon size of connected vehicles on the capacity of mixed traffic flow. Appl. Math. Model. 2024, 125, 367–389. [Google Scholar]
- Shladover, S.E.; Su, D.; Lu, X.-Y. Impacts of cooperative adaptive cruise control on freeway traffic flow. Transp. Res. Rec. 2012, 2324, 63–70. [Google Scholar]
- Jiang, Y.; Cong, H.; Wang, Y.; Wu, Y.; Li, H.; Yao, Z. A new control strategy of CAVs platoon for mitigating traffic oscillation in a two-lane highway. Phys. A Stat. Mech. Appl. 2023, 630, 129289. [Google Scholar]
- Shi, X.; Li, X. Constructing a fundamental diagram for traffic flow with automated vehicles: Methodology and demonstration. Transp. Res. Part B Methodol. 2021, 150, 279–292. [Google Scholar]
- Chen, X.; Zheng, J.; Li, C.; Wu, B.; Wu, H.; Montewka, J. Maritime traffic situation awareness analysis via high-fidelity ship imaging trajectory. Multimed. Tools Appl. 2024, 83, 48907–48923. [Google Scholar]
- Yang, X.; Zou, Y.; Chen, L. Operation analysis of freeway mixed traffic flow based on catch-up coordination platoon. Accid. Anal. Prev. 2022, 175, 106780. [Google Scholar] [CrossRef]
- Peng, Y.; Liu, D.; Wu, S.; Yang, X.; Wang, Y.; Zou, Y. Enhancing mixed traffic flow with platoon control and lane management for connected and autonomous vehicles. Sensors 2025, 25, 644. [Google Scholar] [CrossRef]
- Sinha, A.; Chand, S.; Wijayaratna, K.P.; Virdi, N.; Dixit, V. Comprehensive safety assessment in mixed fleets with connected and automated vehicles: A crash severity and rate evaluation of conventional vehicles. Accid. Anal. Prev. 2020, 142, 105567. [Google Scholar] [CrossRef]
- Sinha, A.; Chand, S.; Wijayaratna, K.P.; Virdi, N.; Dixit, V. Crash severity and rate evaluation of conventional vehicles in mixed fleets with connected and automated vehicles. Procedia Comput. Sci. 2020, 170, 688–695. [Google Scholar] [CrossRef]
- Shin, S.; Cho, Y.; Lee, S.; Park, J. Assessing traffic-flow safety at various levels of autonomous-vehicle market penetration. Appl. Sci. 2024, 14, 5453. [Google Scholar] [CrossRef]
- Zhao, B.; Lin, Y.; Hao, H.; Yao, Z. Fuel consumption and traffic emissions evaluation of mixed traffic flow with connected automated vehicles at multiple traffic scenarios. J. Adv. Transp. 2022, 2022, 6345404. [Google Scholar] [CrossRef]
- Bandeira, J.M.; Macedo, E.; Fernandes, P.; Rodrigues, M.; Andrade, M.; Coelho, M.C. Potential pollutant emission effects of connected and automated vehicles in a mixed traffic flow context for different road types. IEEE Open J. Intell. Transp. Syst. 2021, 2, 364–383. [Google Scholar] [CrossRef]
- Mu, R.; Yamamoto, T. Analysis of traffic flow with micro-cars with respect to safety and environmental impact. Transp. Res. Part A Policy Pract. 2019, 124, 217–241. [Google Scholar] [CrossRef]
- Beza, A.D.; Maghrour Zefreh, M.; Torok, A. Impacts of different types of automated vehicles on traffic flow characteristics and emissions: A microscopic traffic simulation of different freeway segments. Energies 2022, 15, 6669. [Google Scholar] [CrossRef]
- Yang, D.; Qiu, X.; Yu, D.; Sun, R.; Pu, Y. A cellular automata model for car–truck heterogeneous traffic flow considering the car–truck following combination effect. Phys. A Stat. Mech. Appl. 2015, 424, 62–72. [Google Scholar] [CrossRef]
- Zhang, J.; Wu, K.; Cheng, M.; Yang, M.; Cheng, Y.; Li, S. Safety evaluation for connected and autonomous vehicles’ exclusive lanes considering penetrate ratios and impact of trucks using surrogate safety measures. J. Adv. Transp. 2020, 2020, 5847814. [Google Scholar] [CrossRef]
- Mason, A.D.; Woods, A.W. Car-following model of multispecies systems of road traffic. Phys. Rev. E 1997, 55, 2203. [Google Scholar] [CrossRef]
- Jin, S.; Wang, D.-H.; Huang, Z.-Y.; Tao, P.-F. Visual angle model for car-following theory. Phys. A Stat. Mech. Appl. 2011, 390, 1931–1940. [Google Scholar] [CrossRef]
- Huai, T.; Shah, S.D.; Miller, J.W.; Younglove, T.; Chernich, D.J.; Ayala, A. Analysis of heavy-duty diesel truck activity and emissions data. Atmos. Environ. 2006, 40, 2333–2344. [Google Scholar] [CrossRef]
- Kamakate, F.; Schipper, L. Trends in truck freight energy use and carbon emissions in selected OECD countries from 1973 to 2005. Energy Policy 2009, 37, 3743–3751. [Google Scholar] [CrossRef]
- He, L.; Zhang, S.; Hu, J.; Li, Z.; Zheng, X.; Cao, Y.; Xu, G.; Yan, M.; Wu, Y. On-road emission measurements of reactive nitrogen compounds from heavy-duty diesel trucks in China. Environ. Pollut. 2020, 262, 114280. [Google Scholar] [CrossRef]
- Chen, X.; Sun, J.; Ma, Z.; Sun, J.; Zheng, Z. Investigating the long-and short-term driving characteristics and incorporating them into car-following models. Transp. Res. Part C Emerg. Technol. 2020, 117, 102698. [Google Scholar] [CrossRef]
- Zhu, H.; Zhou, Y.; Wu, W. Modeling traffic flow mixed with automated vehicles considering drivers’ character difference. Phys. A Stat. Mech. Appl. 2020, 549, 124337. [Google Scholar] [CrossRef]
- Feng, Y.; Pickering, S.; Chappell, E.; Iravani, P.; Brace, C. Driving style analysis by classifying real-world data with support vector clustering. In Proceedings of the 2018 3rd IEEE International Conference on Intelligent Transportation Engineering (ICITE), Singapore, 3–5 September 2018; IEEE: New York, NY, USA, 2018; pp. 264–268. [Google Scholar]
- Lu, Q.-L.; Qurashi, M.; Varesanovic, D.; Sodnik, J.; Antoniou, C. Exploring the influence of automated driving styles on network efficiency. Transp. Res. Procedia 2021, 52, 380–387. [Google Scholar] [CrossRef]
- Li, Y.; Zhang, S.; Pan, Y.; Zhou, B.; Peng, Y. Exploring the stability and capacity characteristics of mixed traffic flow with autonomous and human-driven vehicles considering aggressive driving. J. Adv. Transp. 2023, 2023, 2578690. [Google Scholar] [CrossRef]
- Sun, Z.; Yan, Q.; Liu, Y.; Fu, Z.; Yang, L. Fundamental diagram and stability analysis of mixed traffic considering heterogeneous car-following behaviors and platoon factors. Intell. Transp. Infrastruct. 2024, 3, liae010. [Google Scholar] [CrossRef]
- Yang, D.; Jin, P.J.; Pu, Y.; Ran, B. Stability analysis of the mixed traffic flow of cars and trucks using heterogeneous optimal velocity car-following model. Phys. A Stat. Mech. Appl. 2014, 395, 371–383. [Google Scholar] [CrossRef]
- Qin, Y.; Wang, H.; Ran, B. Stability analysis of connected and automated vehicles to reduce fuel consumption and emissions. J. Transp. Eng. Part A Syst. 2018, 144, 04018068. [Google Scholar] [CrossRef]
- Park, S.; Ahn, K.; Rakha, H.A. Environmental impact of freight signal priority with connected trucks. Sustainability 2019, 11, 6819. [Google Scholar] [CrossRef]
- Ye, L.; Yamamoto, T. Evaluating the impact of connected and autonomous vehicles on traffic safety. Phys. A Stat. Mech. Its Appl. 2019, 526, 121009. [Google Scholar] [CrossRef]
- Sala, M.; Soriguera, F. Capacity of a freeway lane with platoons of autonomous vehicles mixed with regular traffic. Transp. Res. Part B Methodol. 2021, 147, 116–131. [Google Scholar] [CrossRef]
- Wang, Y.; Xu, R.; Zhang, K. A car-following model for mixed traffic flows in intelligent connected vehicle environment considering driver response characteristics. Sustainability 2022, 14, 11010. [Google Scholar] [CrossRef]
- Oikonomou, M.G.; Ziakopoulos, A.; Chaudhry, A.; Thomas, P.; Yannis, G. From conflicts to crashes: Simulating macroscopic connected and automated driving vehicle safety. Accid. Anal. Prev. 2023, 187, 107087. [Google Scholar] [CrossRef]
- Yao, Z.; Wu, Y.; Wang, Y.; Zhao, B.; Jiang, Y. Analysis of the impact of maximum platoon size of CAVs on mixed traffic flow: An analytical and simulation method. Transp. Res. Part C Emerg. Technol. 2023, 147, 103989. [Google Scholar] [CrossRef]
- Jiang, C.; Yin, S.; Yao, Z.; He, J.; Jiang, R.; Jiang, Y. Safety evaluation of mixed traffic flow with truck platoons equipped with (cooperative) adaptive cruise control, stochastic human-driven cars and trucks on port freeways. Phys. A Stat. Mech. Appl. 2024, 643, 129802. [Google Scholar] [CrossRef]
- Liu, Q.; Gao, C.; Wang, H.; Cai, Y.; Chen, L.; Lv, C. Learning from trajectories: How heterogeneous CACC platoons affect the traffic flow in highway merging area. IEEE Trans. Veh. Technol. 2024, 73, 16212–16224. [Google Scholar] [CrossRef]
- Treiber, M.; Hennecke, A.; Helbing, D. Microscopic simulation of congested traffic. In Traffic and Granular Flow’99: Social, Traffic, and Granular Dynamics; Springer: Berlin/Heidelberg, Germany, 2000; pp. 365–376. [Google Scholar]
- Milanés, V.; Shladover, S.E. Modeling cooperative and autonomous adaptive cruise control dynamic responses using experimental data. Transp. Res. Part C Emerg. Technol. 2014, 48, 285–300. [Google Scholar] [CrossRef]
- Milanés, V.; Shladover, S.E.; Spring, J.; Nowakowski, C.; Kawazoe, H.; Nakamura, M. Cooperative adaptive cruise control in real traffic situations. IEEE Trans. Intell. Transp. Syst. 2013, 15, 296–305. [Google Scholar] [CrossRef]
- Zhou, J.; Zhu, F. Analytical analysis of the effect of maximum platoon size of connected and automated vehicles. Transp. Res. Part C Emerg. Technol. 2021, 122, 102882. [Google Scholar] [CrossRef]
- Punzo, V.; Zheng, Z.; Montanino, M. About calibration of car-following dynamics of automated and human-driven vehicles: Methodology, guidelines and codes. Transp. Res. Part C Emerg. Technol. 2021, 128, 103165. [Google Scholar] [CrossRef]
- Ali, A.F.; Tawhid, M.A. A hybrid PSO and DE algorithm for solving engineering optimization problems. Appl. Math. Inf. Sci. 2016, 10, 431–449. [Google Scholar] [CrossRef]
- Huang, Y.; Ye, Y.; Sun, J.; Tian, Y. Characterizing the impact of autonomous vehicles on macroscopic fundamental diagrams. IEEE Trans. Intell. Transp. Syst. 2023, 24, 6530–6541. [Google Scholar] [CrossRef]
- Kim, B.; Heaslip, K.P. Identifying suitable car-following models to simulate automated vehicles on highways. Int. J. Transp. Sci. Technol. 2023, 12, 652–664. [Google Scholar] [CrossRef]
- Lidbe, A.D.; Hainen, A.M.; Jones, S.L. Comparative study of simulated annealing, tabu search, and the genetic algorithm for calibration of the microsimulation model. Simulation 2017, 93, 21–33. [Google Scholar] [CrossRef]
- Ahmad, M.F.; Isa, N.A.M.; Lim, W.H.; Ang, K.M. Differential evolution: A recent review based on state-of-the-art works. Alex. Eng. J. 2022, 61, 3831–3872. [Google Scholar] [CrossRef]
- Sajid, M.; Jafar, A.; Sharma, S. Hybrid genetic and simulated annealing algorithm for capacitated vehicle routing problem. In Proceedings of the 2020 Sixth International Conference on Parallel, Distributed and Grid Computing (PDGC), Waknaghat, India, 6–8 November 2020; IEEE: New York, NY, USA, 2020; pp. 131–136. [Google Scholar]
- Van Aerde, M.; Rakha, H. Multivariate calibration of single regime speed-flow-density relationships [road traffic management]. In Proceedings of the Pacific Rim TransTech Conference, 1995 Vehicle Navigation and Information Systems Conference Proceedings, 6th International VNIS, A Ride into the Future, Seattle, WA, USA, 30 July–2 August 1995; IEEE: New York, NY, USA, 1995; pp. 334–341. [Google Scholar]
- Ngoduy, D. Analytical studies on the instabilities of heterogeneous intelligent traffic flow. Commun. Nonlinear Sci. Numer. Simul. 2013, 18, 2699–2706. [Google Scholar] [CrossRef]
- Ahn, K.; Rakha, H.; Trani, A.; Van Aerde, M. Estimating vehicle fuel consumption and emissions based on instantaneous speed and acceleration levels. J. Transp. Eng. 2002, 128, 182–190. [Google Scholar] [CrossRef]
- Krajewski, R.; Bock, J.; Kloeker, L.; Eckstein, L. The highd dataset: A drone dataset of naturalistic vehicle trajectories on german highways for validation of highly automated driving systems. In Proceedings of the 2018 21st International Conference on Intelligent Transportation Systems (ITSC), Maui, HI, USA, 4–7 November 2018; IEEE: New York, NY, USA, 2018; pp. 2118–2125. [Google Scholar]
- Zhu, M.; Wang, X.; Tarko, A. Modeling car-following behavior on urban expressways in Shanghai: A naturalistic driving study. Transp. Res. Part C Emerg. Technol. 2018, 93, 425–445. [Google Scholar] [CrossRef]
- Lespinats, S.; Colange, B.; Dutykh, D. Nonlinear Dimensionality Reduction Techniques; Springer: Berlin/Heidelberg, Germany, 2022. [Google Scholar]
- Yao, X.; Yan, Q.; Sun, Z.; Calvert, S.C.; Hoogendoorn, S.P. Investigation on car-following heterogeneity and its impacts on traffic safety and sustainability. Transp. A Transp. Sci. 2024; in press. [Google Scholar] [CrossRef]
- Thiedig, J. An Economic Cost-Benefit Analysis of a General Speed Limit on German Highways; Free University Berlin, School of Business & Economics: Berlin, Germany, 2018. [Google Scholar]
- Song, L.; Fan, W. Intersection capacity adjustments considering different market penetration rates of connected and automated vehicles. Transp. Plan. Technol. 2023, 46, 286–303. [Google Scholar] [CrossRef]
- Wang, P.; Wu, X.; He, X. Vibration-theoretic approach to vulnerability analysis of nonlinear vehicle platoons. IEEE Trans. Intell. Transp. Syst. 2023, 24, 11334–11344. [Google Scholar] [CrossRef]
- Rakha, H.; Crowther, B. Comparison of Greenshields, Pipes, and Van Aerde car-following and traffic stream models. Transp. Res. Rec. 2002, 1802, 248–262. [Google Scholar] [CrossRef]
- Montanino, M.; Monteil, J.; Punzo, V. From homogeneous to heterogeneous traffic flows: Lp String stability under uncertain model parameters. Transp. Res. Part B Methodol. 2021, 146, 136–154. [Google Scholar] [CrossRef]
- Sun, J.; Zheng, Z.; Sun, J. Stability analysis methods and their applicability to car-following models in conventional and connected environments. Transp. Res. Part B Methodol. 2018, 109, 212–237. [Google Scholar] [CrossRef]
- Caputo, J.-G.; Dutykh, D. Nonlinear waves in networks: Model reduction for the sine-Gordon equation. Phys. Rev. E 2014, 90, 022912. [Google Scholar] [CrossRef]
- Dutykh, D.; Caputo, J.-G. Wave dynamics on networks: Method and application to the sine-Gordon equation. Appl. Numer. Math. 2018, 131, 54–71. [Google Scholar] [CrossRef]
- Caputo, J.G.; Dutykh, D.; Gleyse, B. Coupling conditions for water waves at forks. Symmetry 2019, 11, 434. [Google Scholar] [CrossRef]
Disclaimer/Publisher’s Note: The statements, opinions and data contained in all publications are solely those of the individual author(s) and contributor(s) and not of MDPI and/or the editor(s). MDPI and/or the editor(s) disclaim responsibility for any injury to people or property resulting from any ideas, methods, instructions or products referred to in the content. |
© 2025 by the authors. Licensee MDPI, Basel, Switzerland. This article is an open access article distributed under the terms and conditions of the Creative Commons Attribution (CC BY) license (https://creativecommons.org/licenses/by/4.0/).