
Unlocking Green Export Opportunities: Empirical Insights from Southern Cone Economies

 , and
, and
Abstract
1. Introduction
2. Background Literature
Knowledge and Complexity-Based Diversification Strategies
3. Methods and Data
3.1. Revealed Comparative Advantage (RCA)
3.2. The Product Space (Proximity) and Relatedness
3.3. Economic Complexity Index and Derived Metrics
3.4. Empirical Strategy
4. Results
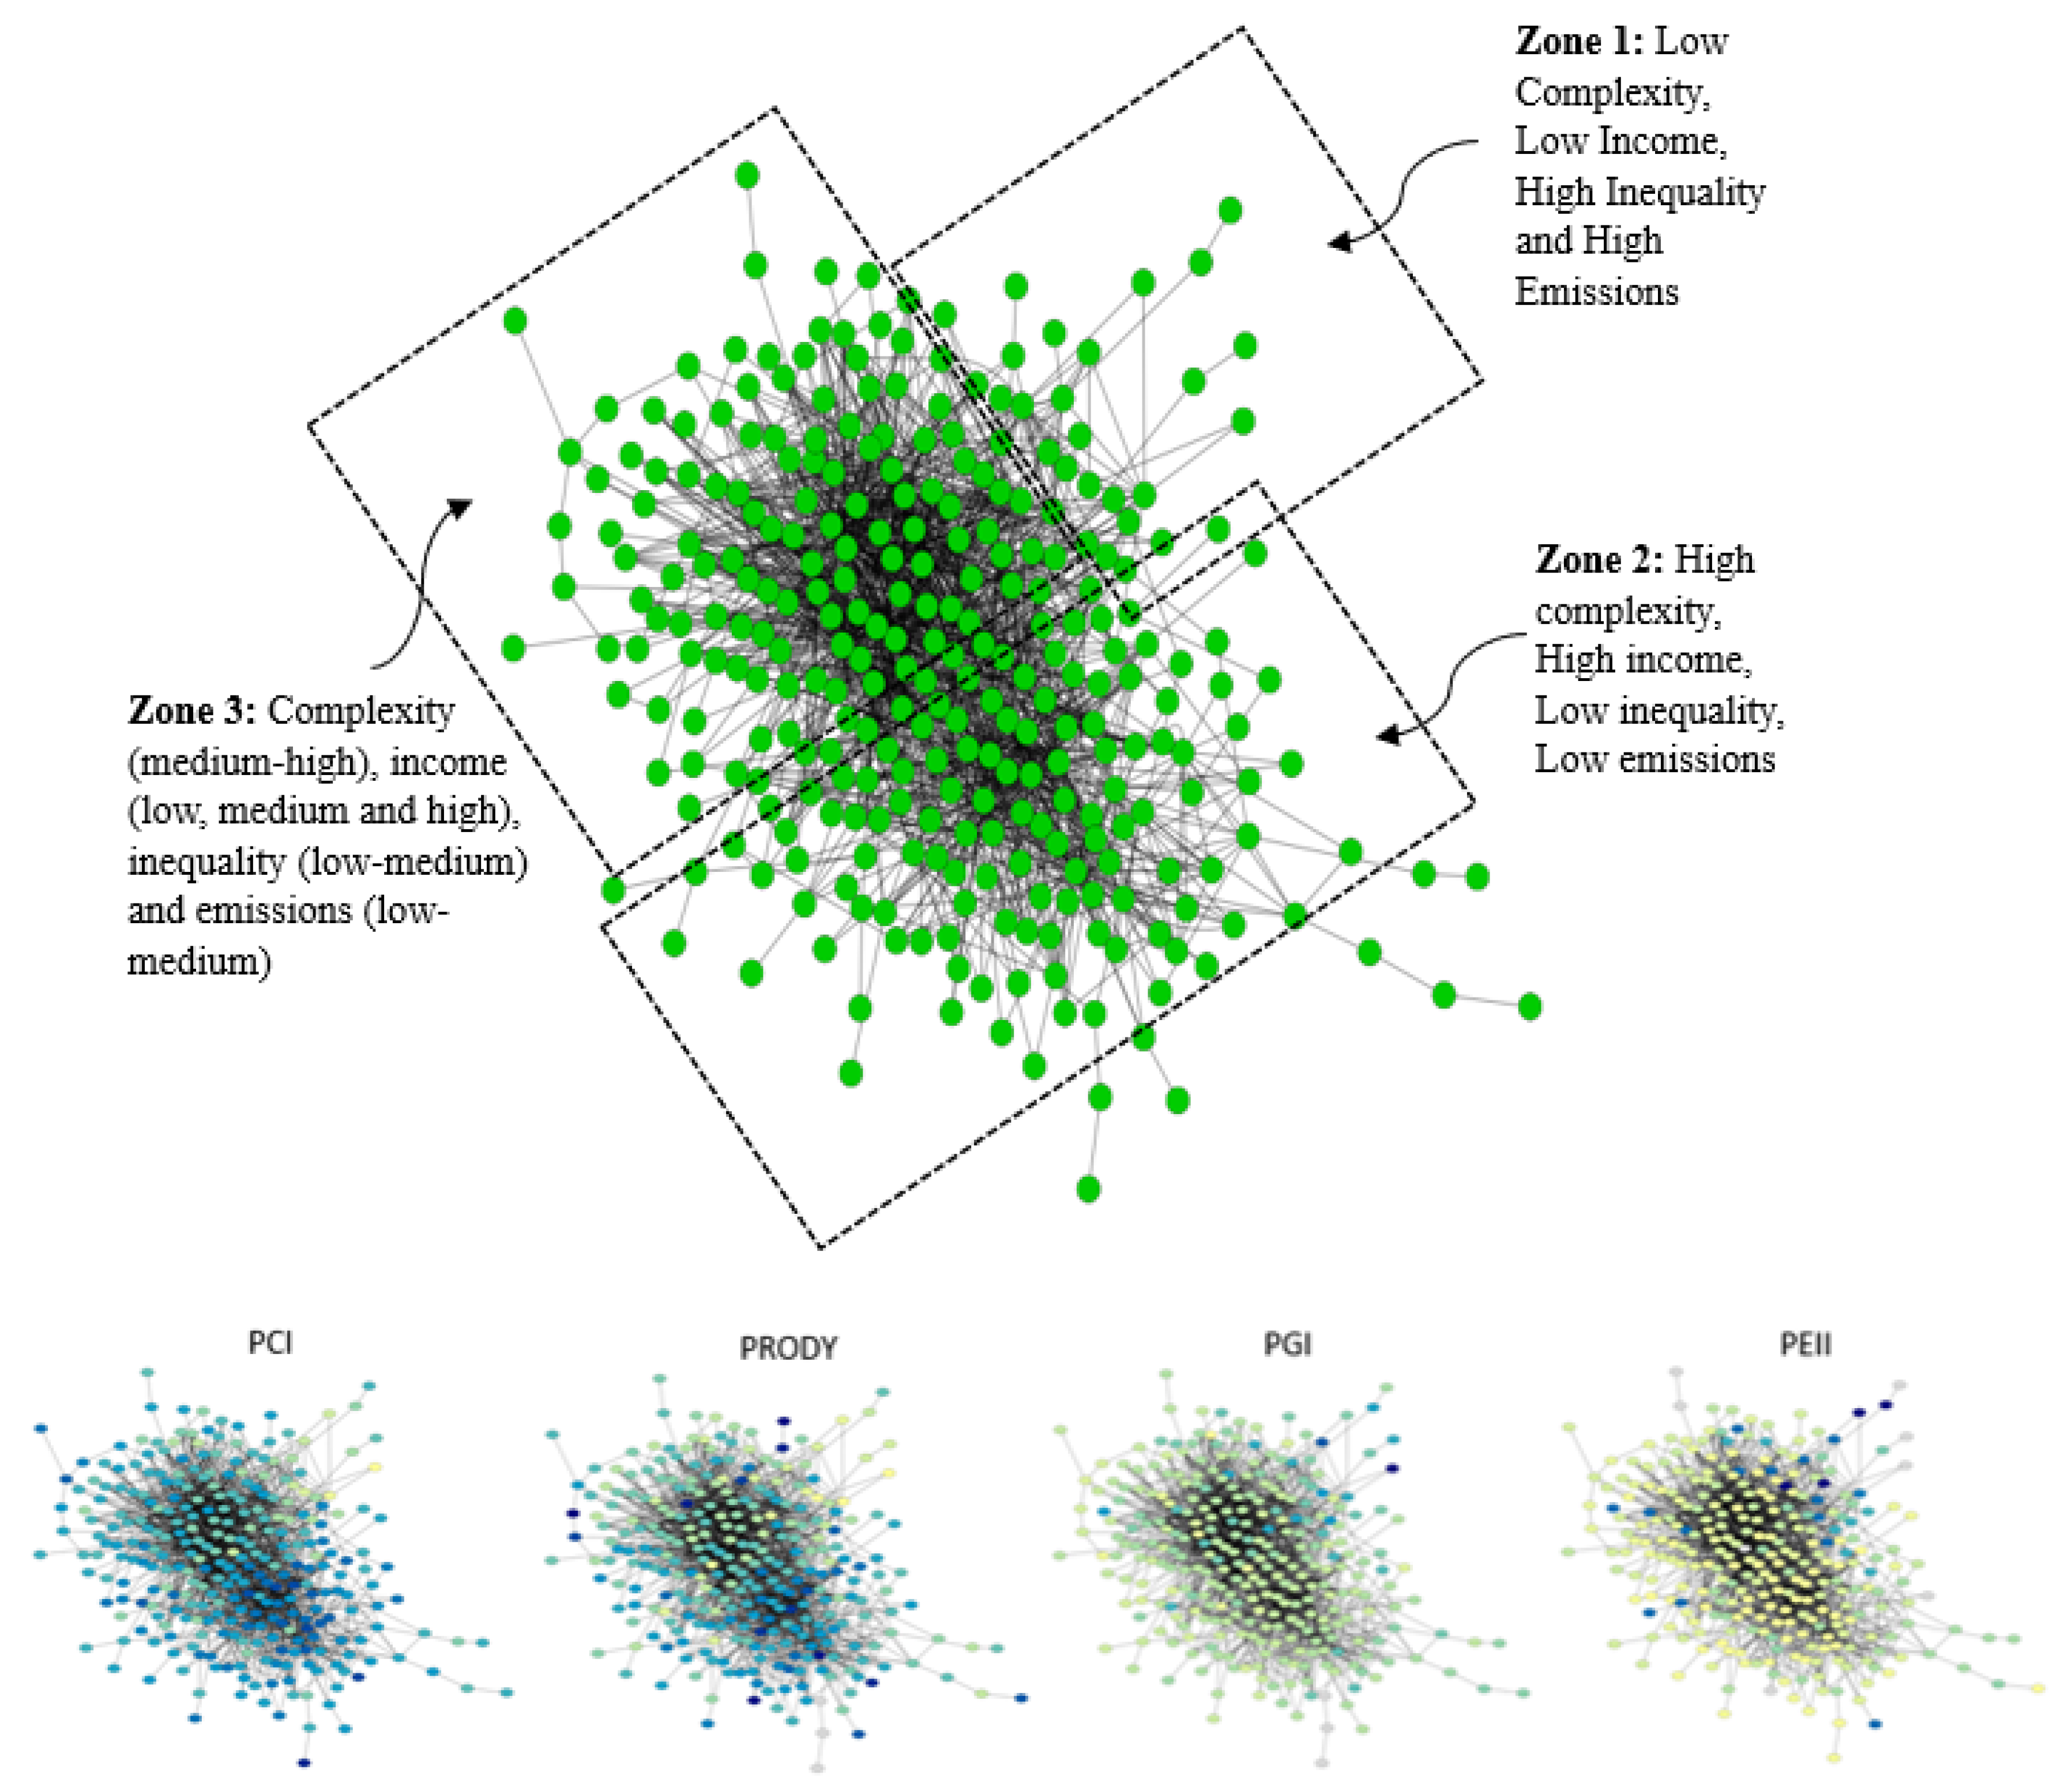
4.1. Green Diversification Dashboard of the Southern Cone
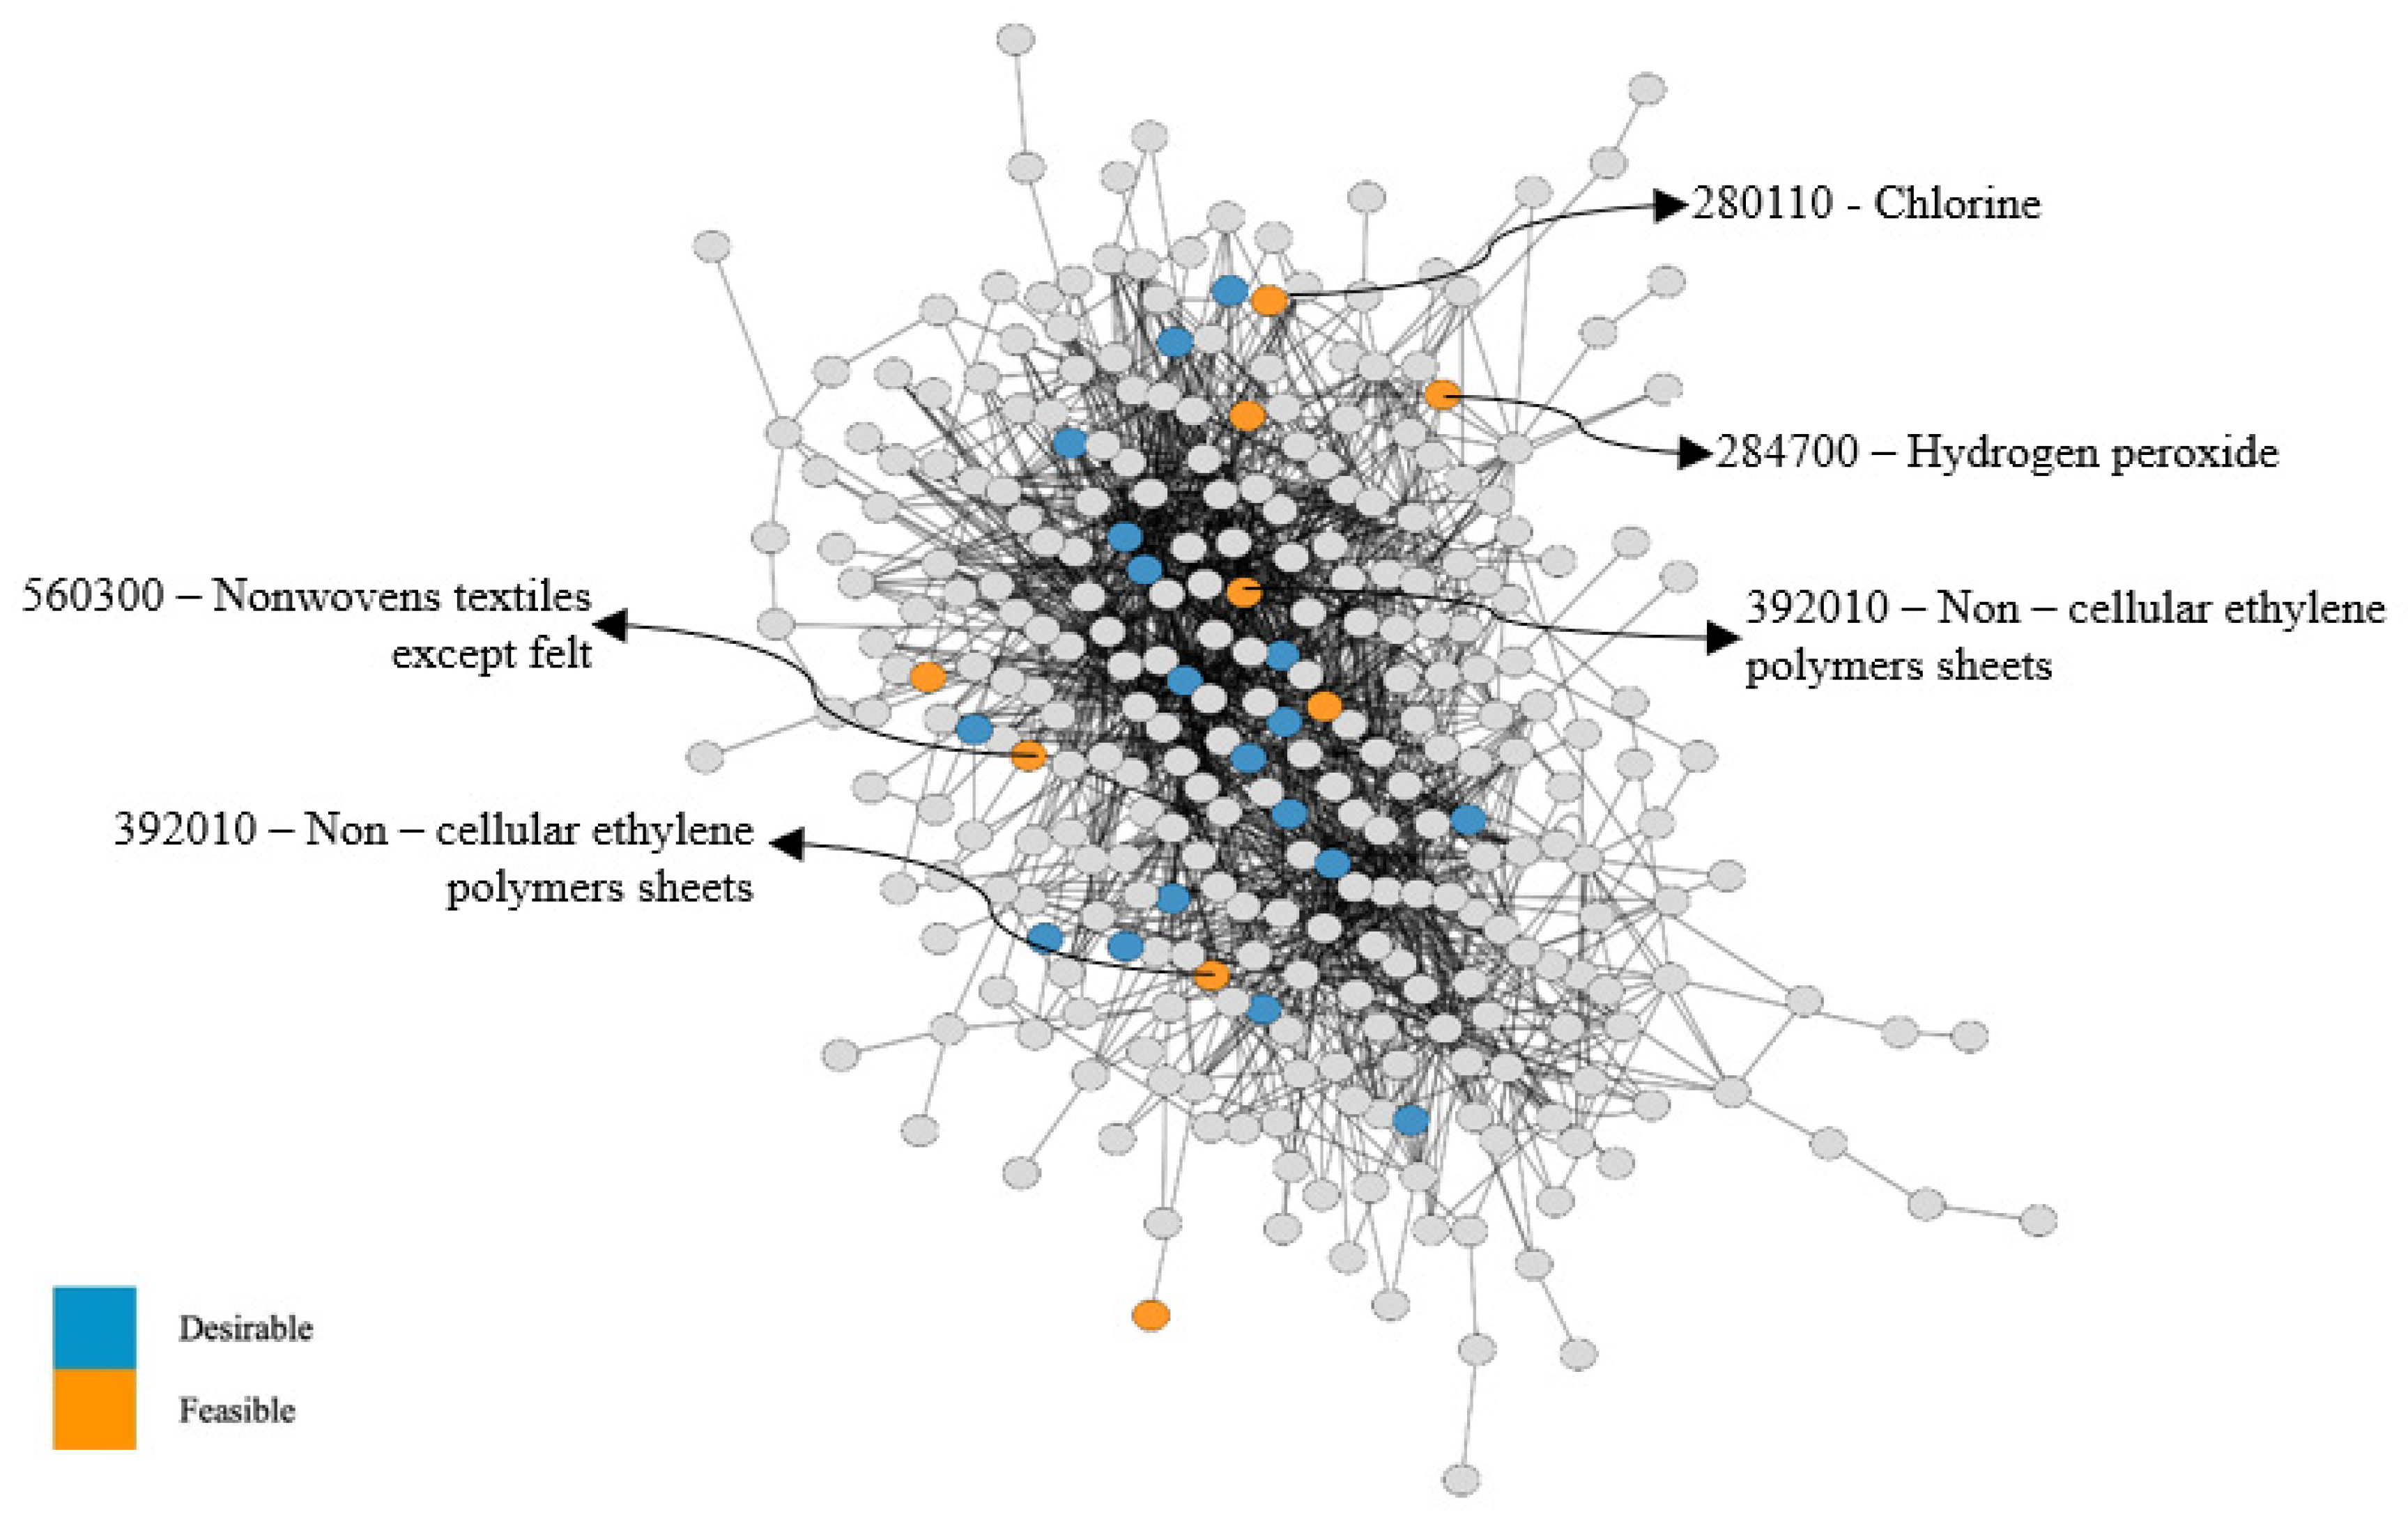
4.2. Green Product Space
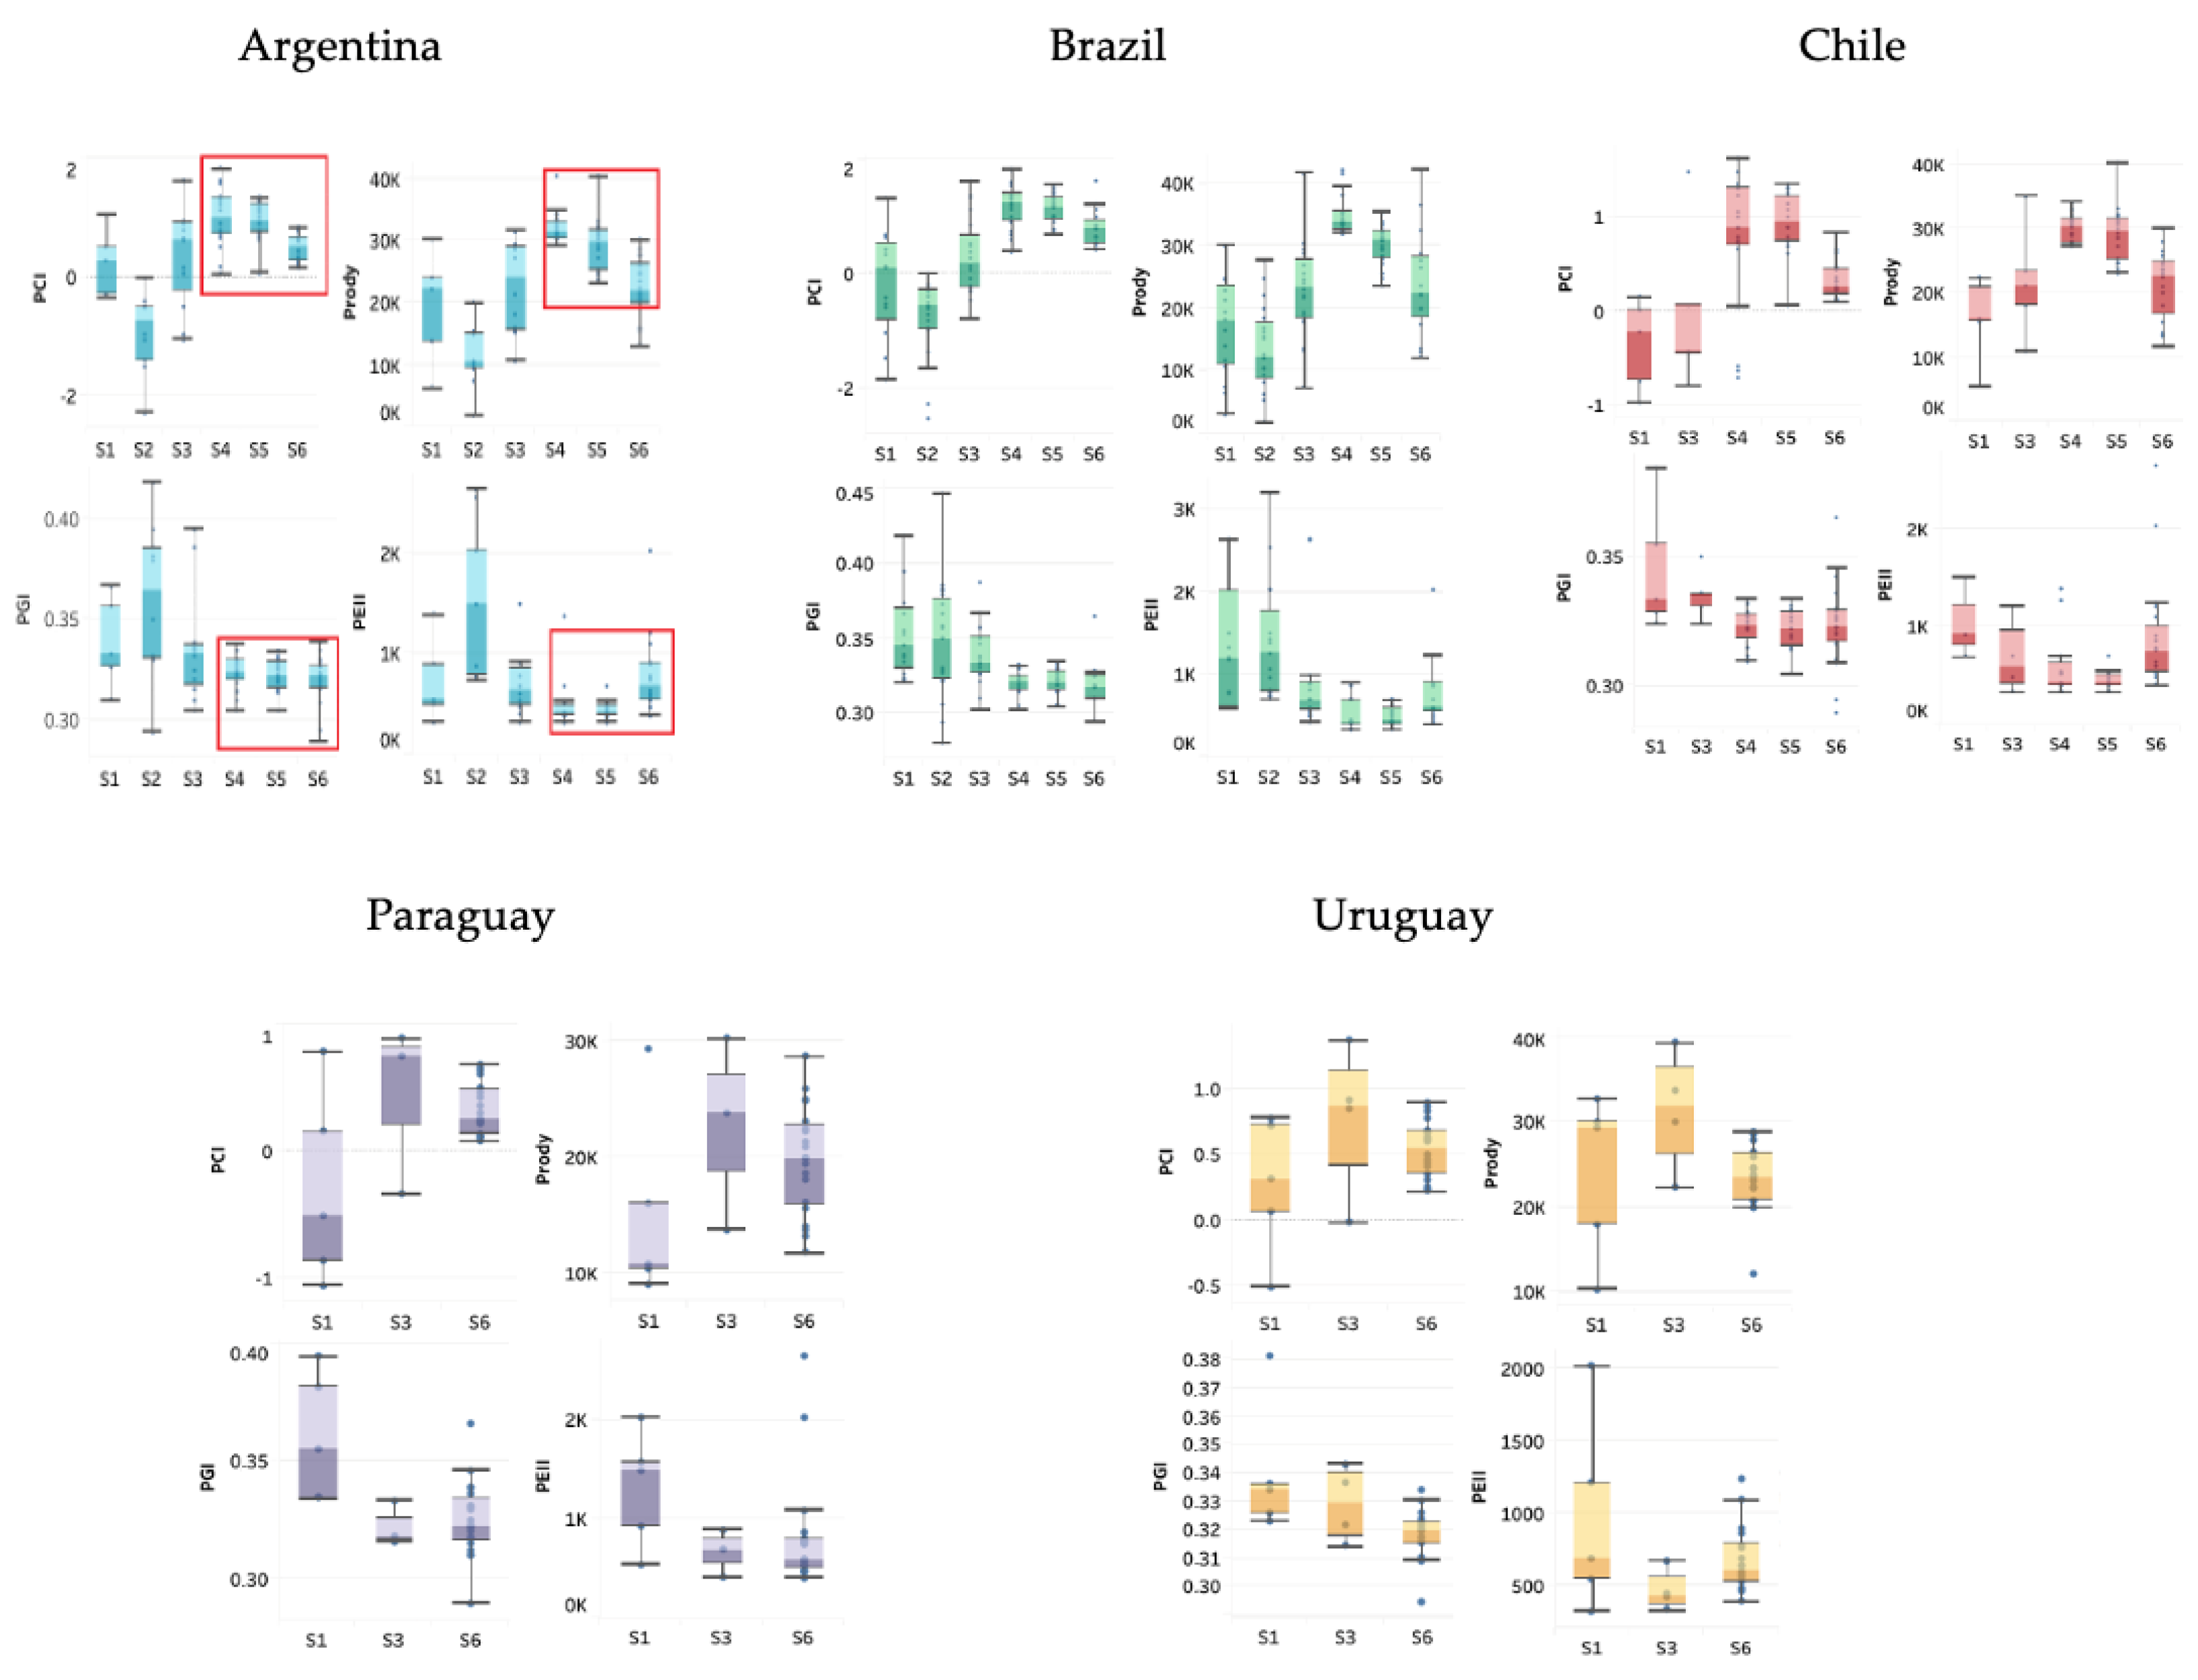
4.3. Highlights by Country
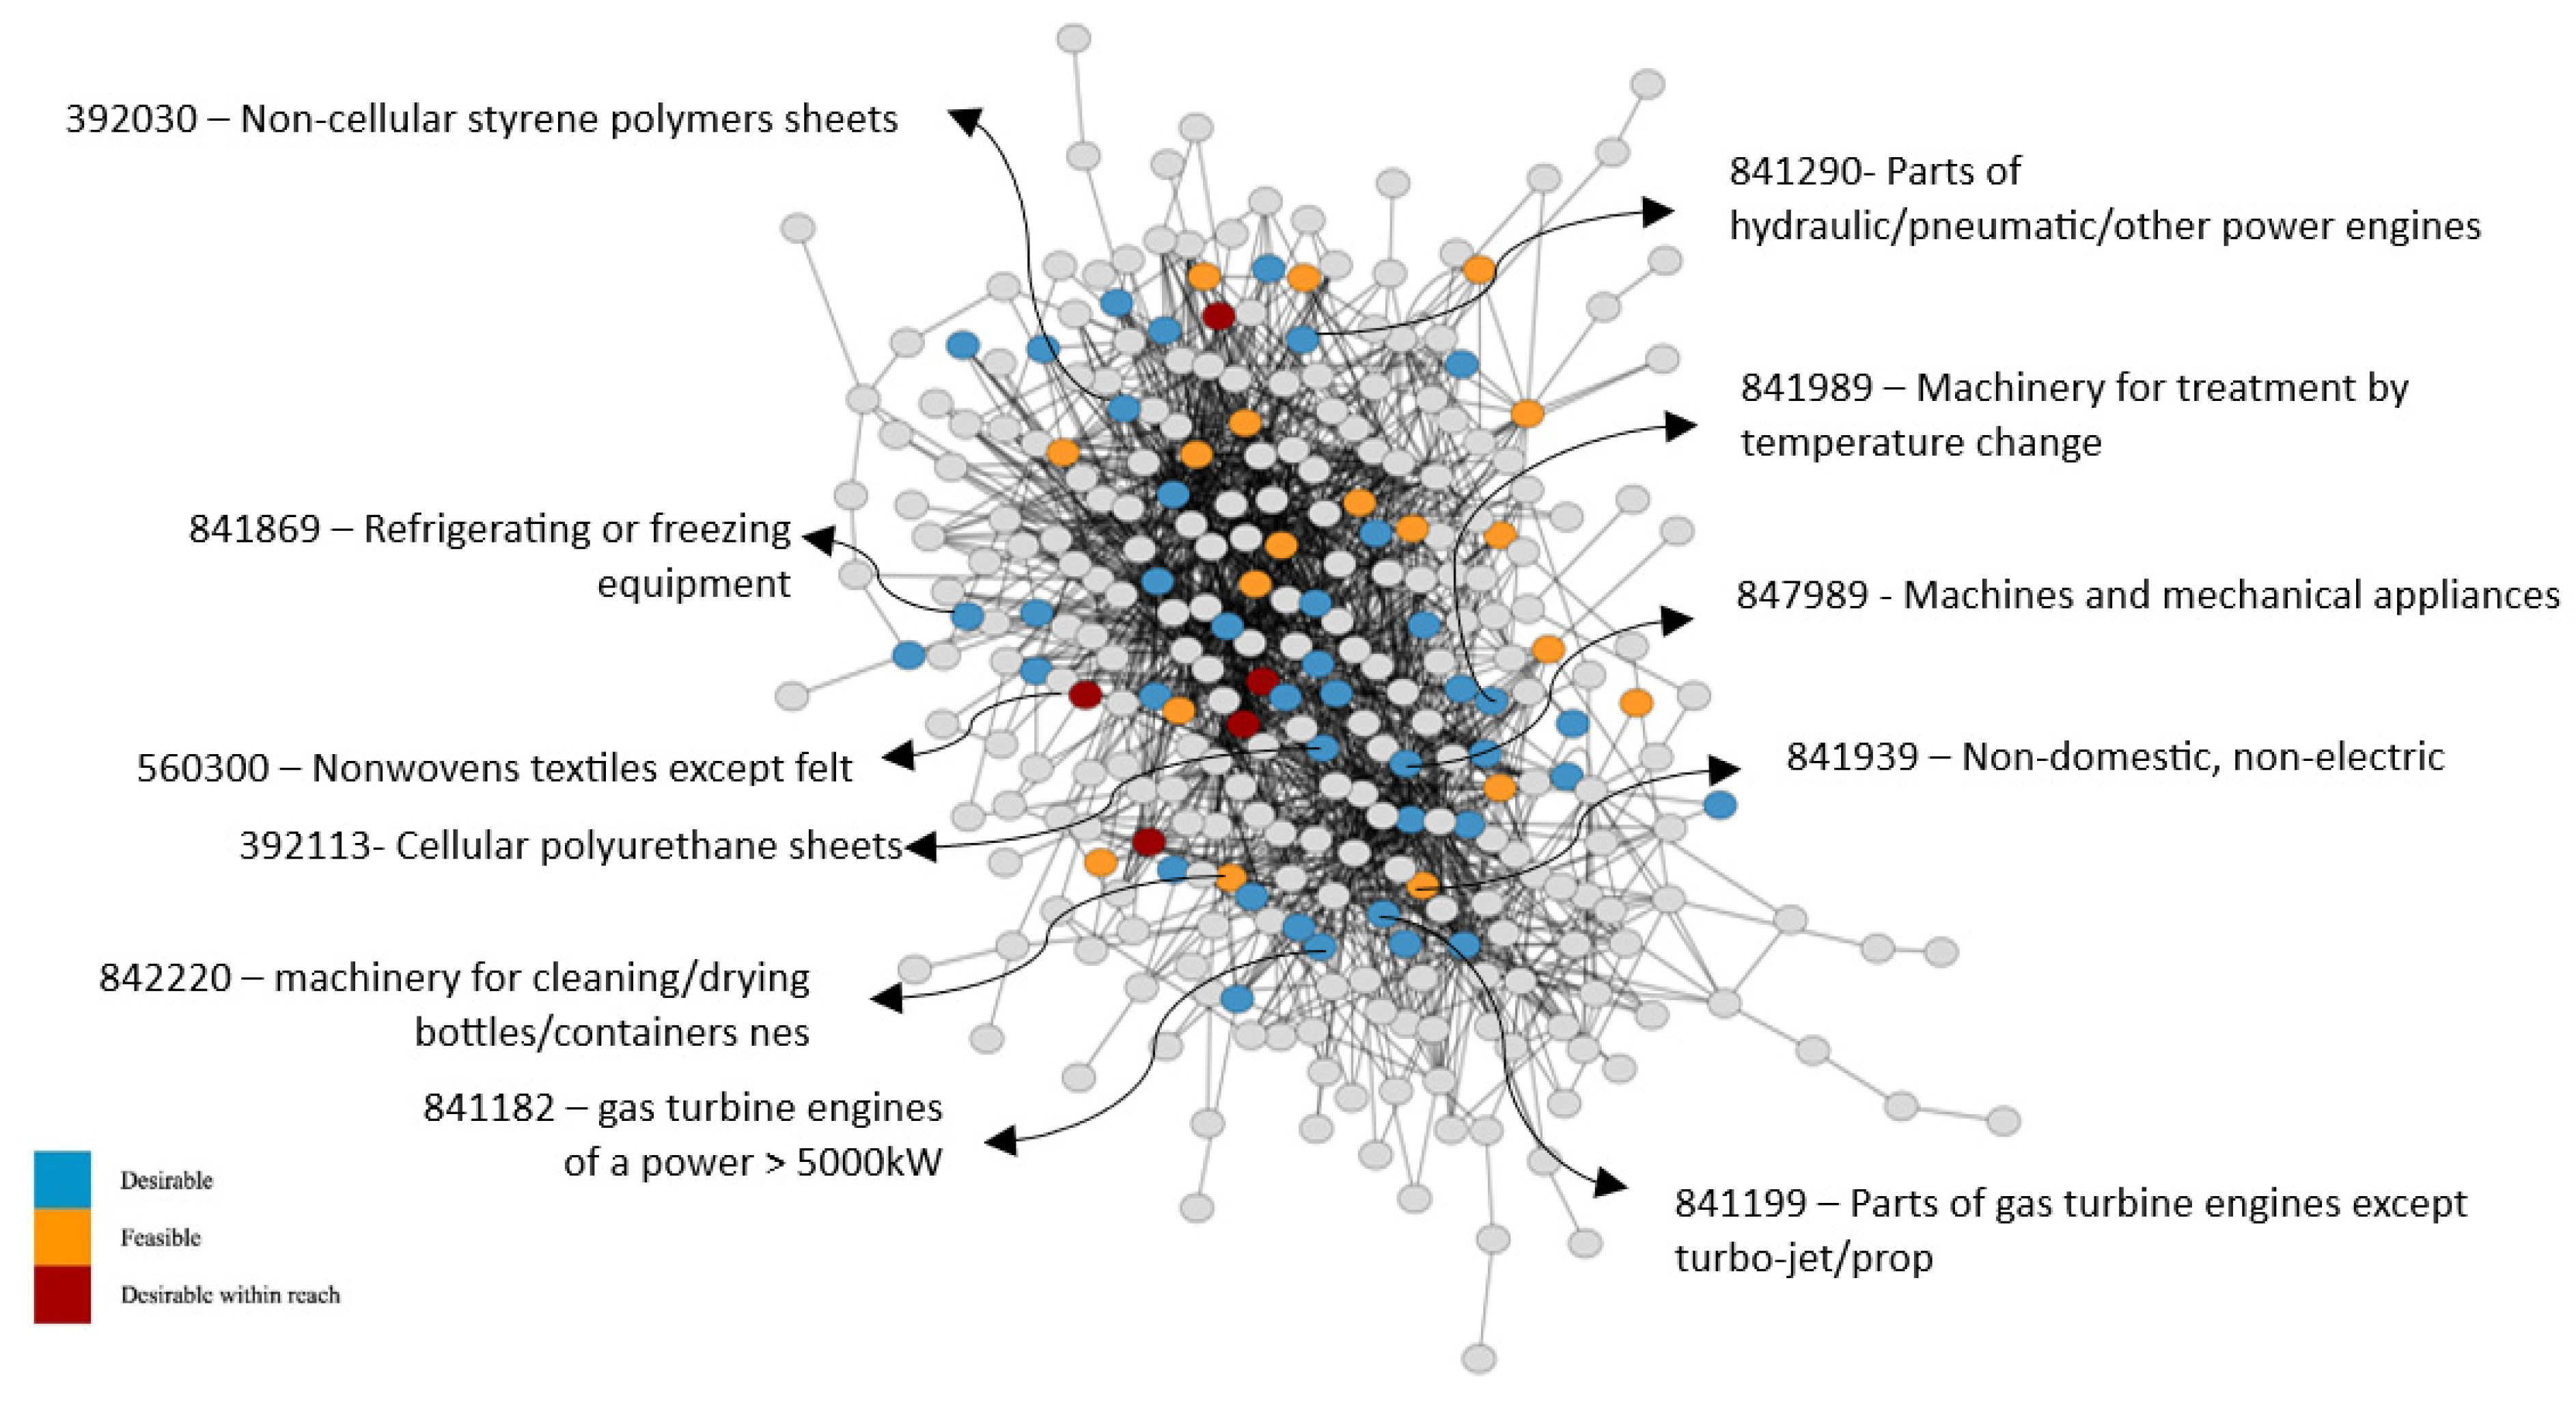
4.3.1. Argentina
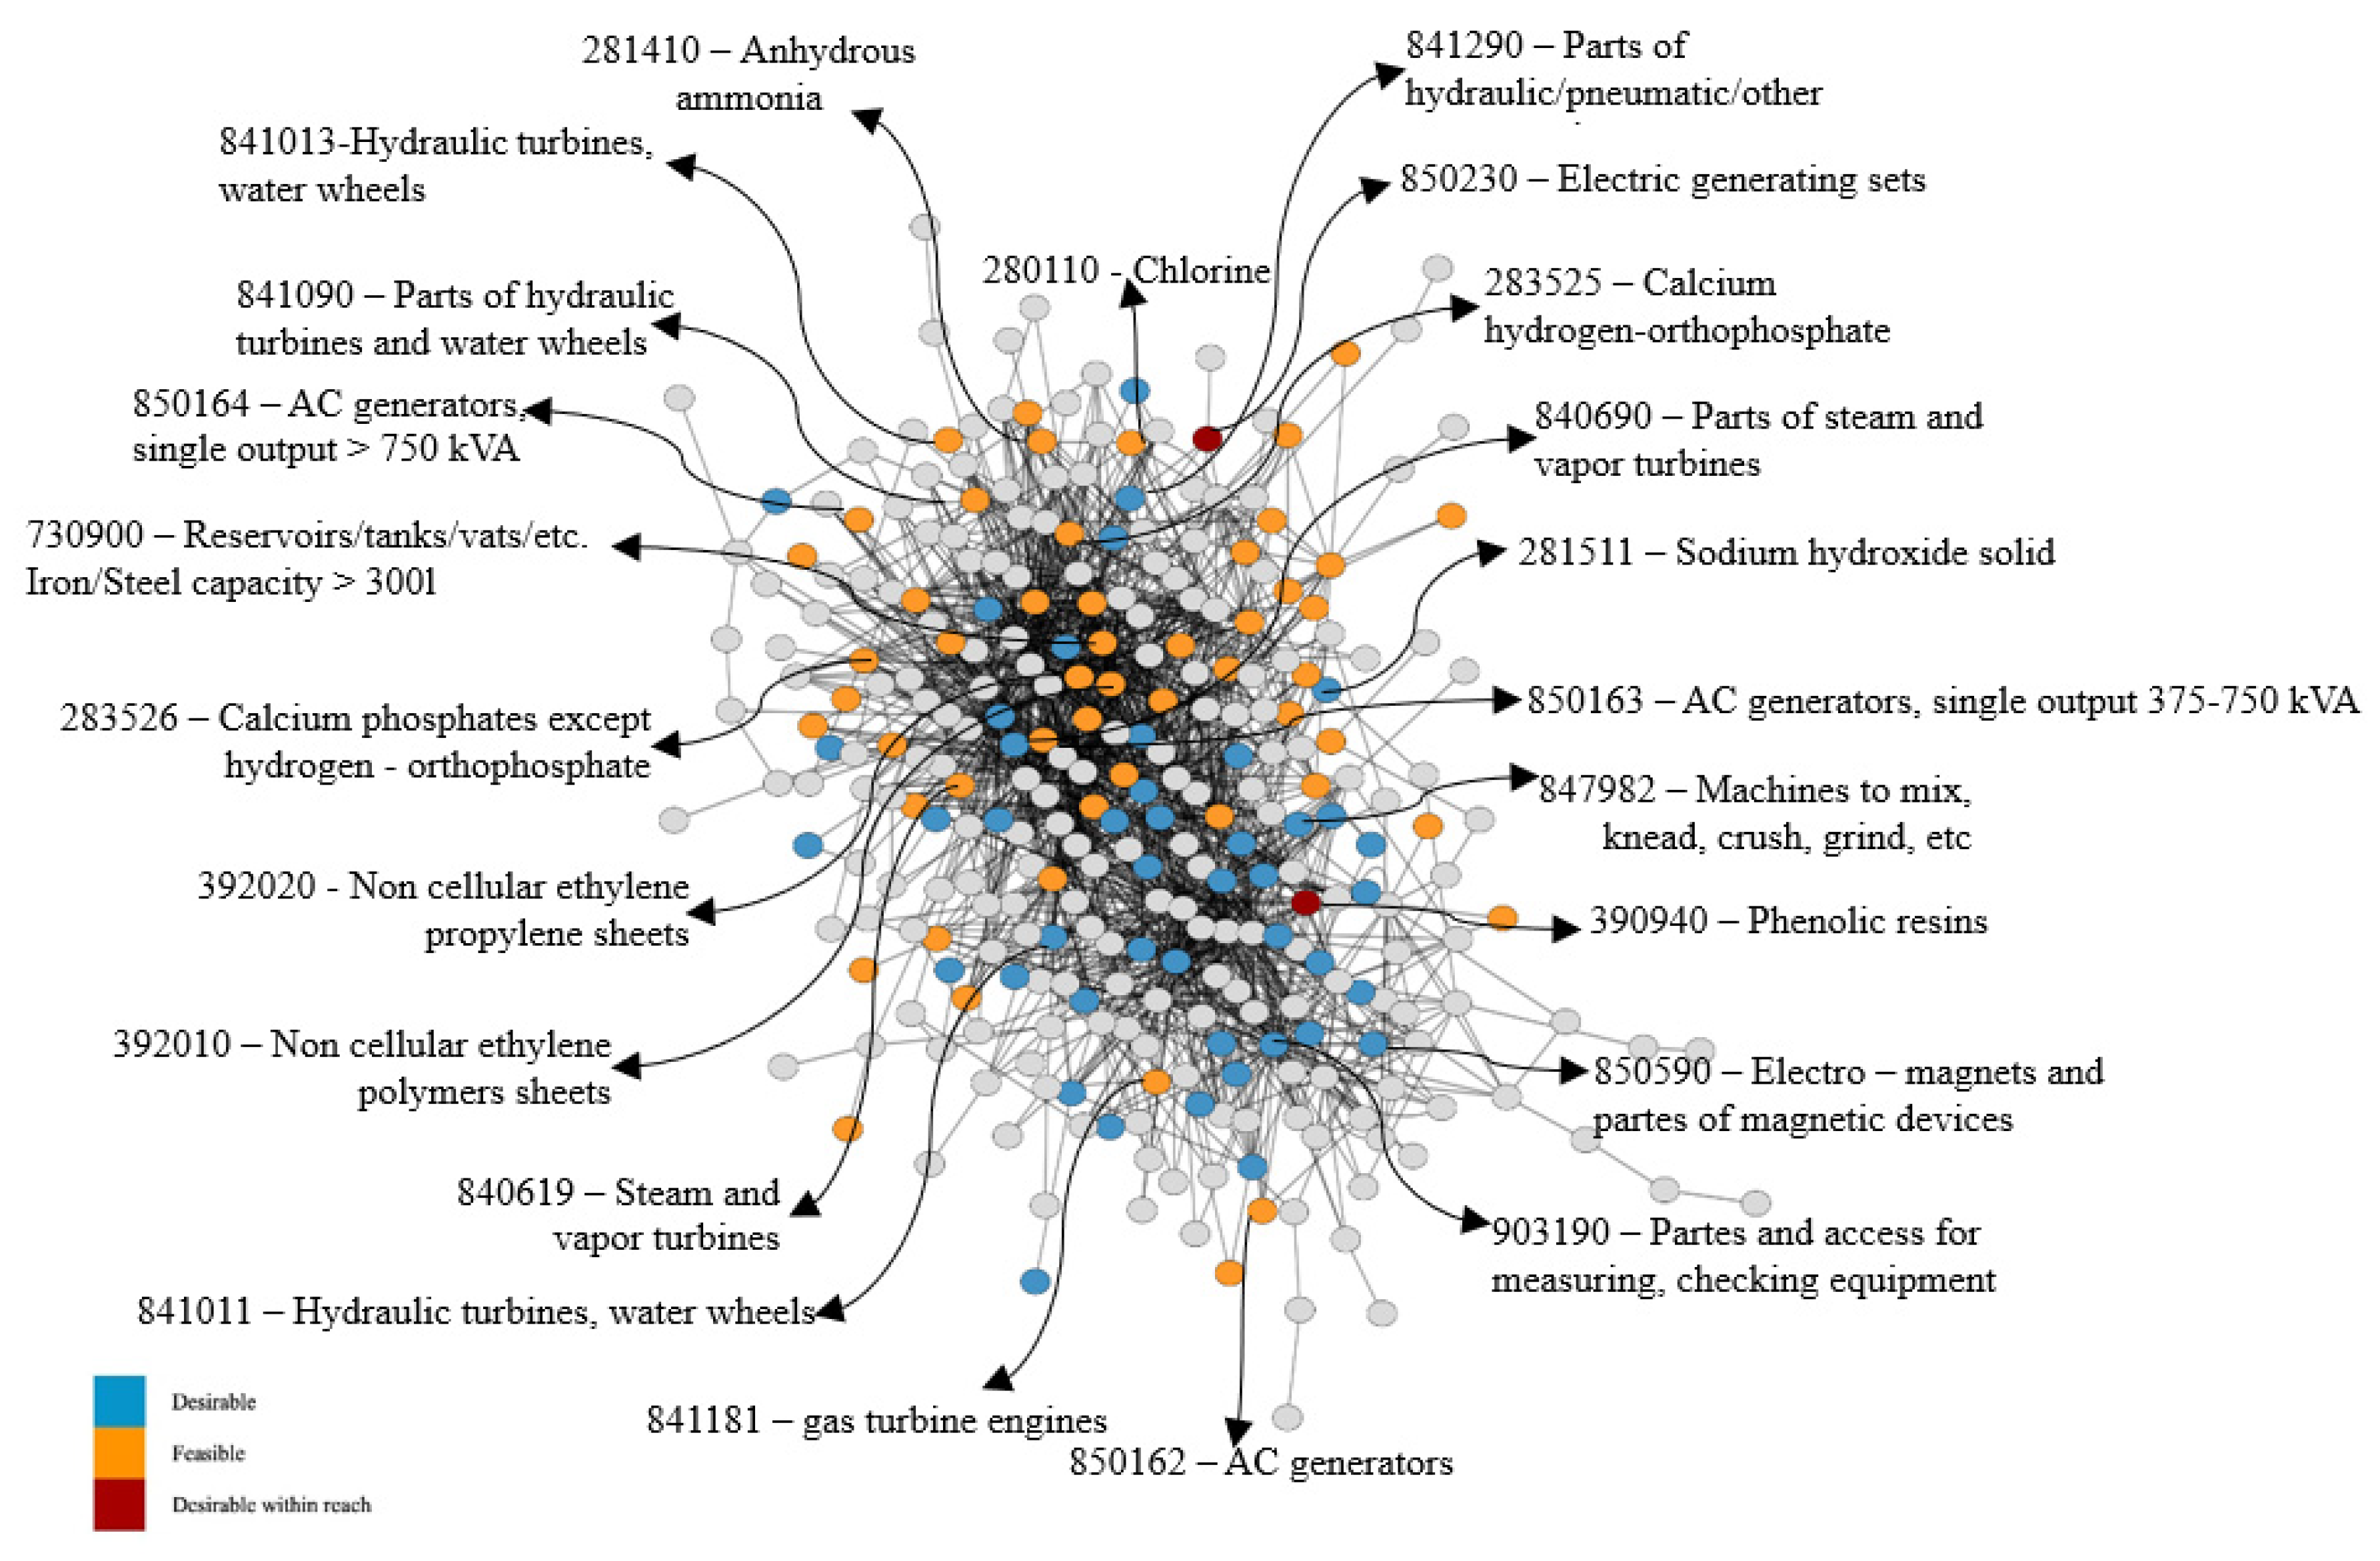
4.3.2. Brazil
4.3.3. Chile
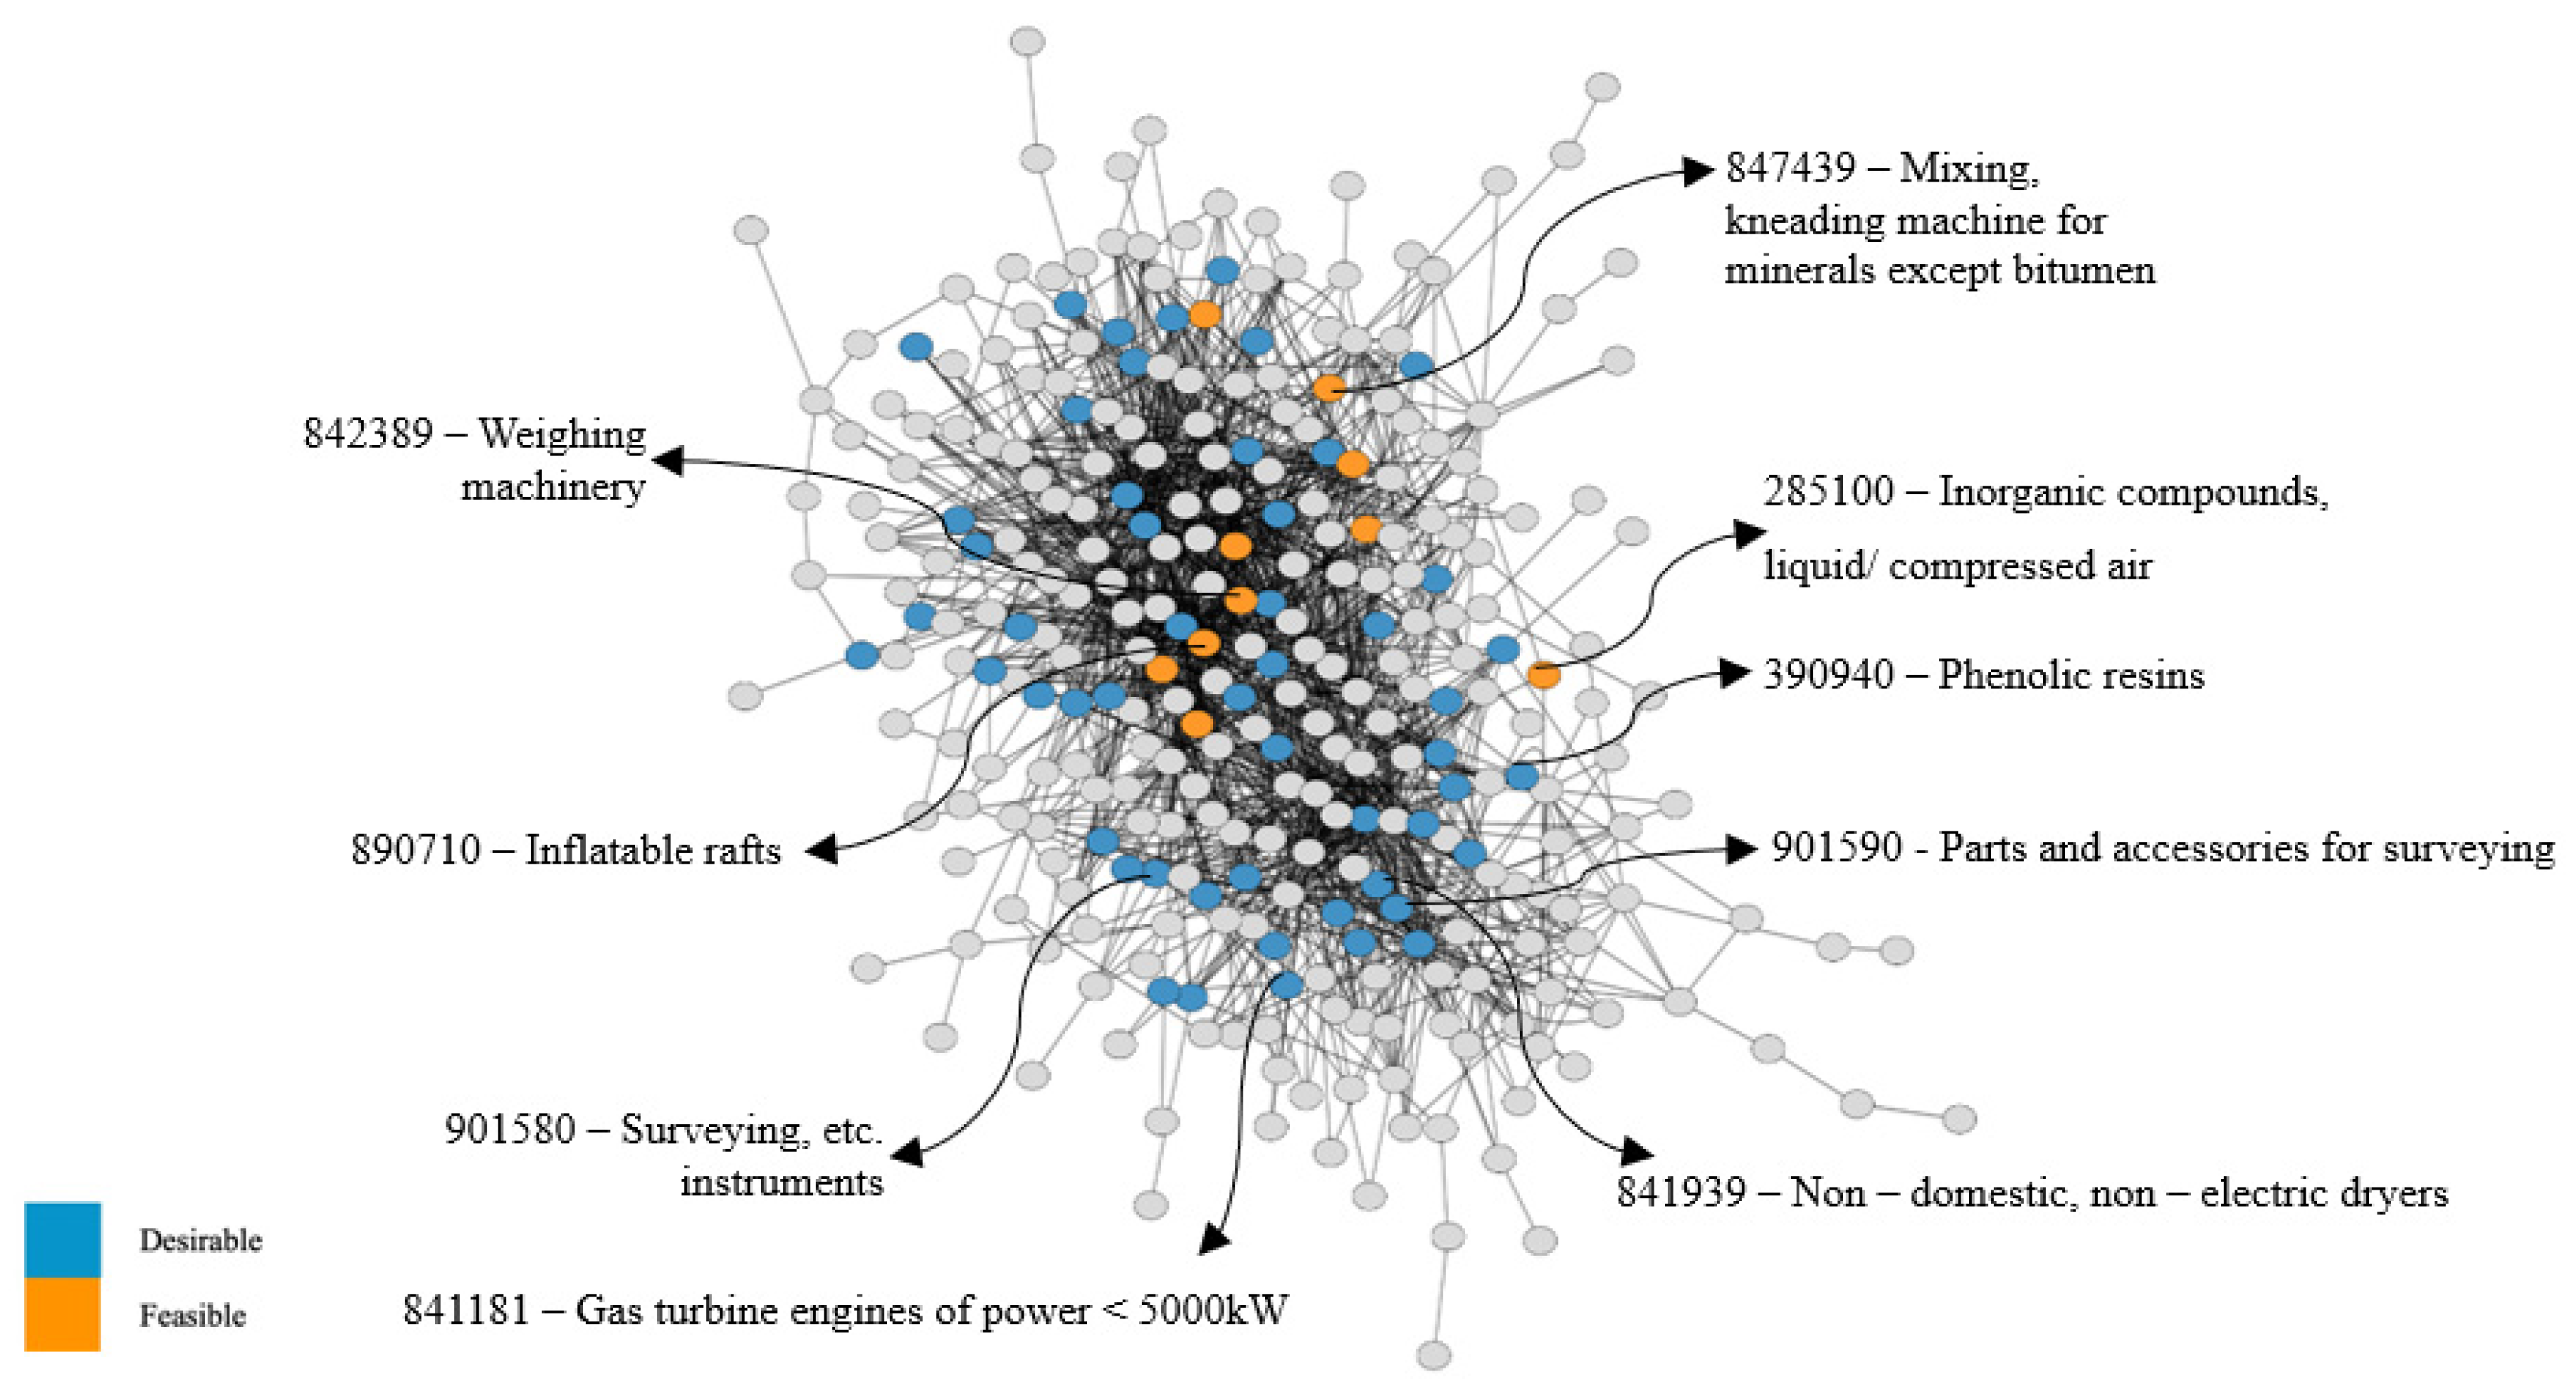
4.3.4. Paraguay
4.3.5. Uruguay
4.4. Expected Outcomes Across Different Diversification Strategies
5. Final Remarks
- -
- The significance of accumulated industrial capabilities, which can be leveraged for the green transition. For example, the knowledge base in machinery and equipment sectors used for developing inputs and machinery linked to renewable energy, waste management, and water treatment.
- -
- The opportunity to drive development by tapping into natural resources linked to regional capabilities. In particular, the region’s renewable energy products in Argentina and Brazil (solar, wind, and marine energy); lithium-based products in Chile; agro-energy (biofuels) in Paraguay, given the country’s favorable natural conditions; and green hydrogen products in Uruguay.
6. Limitations and Research Agenda
Supplementary Materials
Author Contributions
Funding
Data Availability Statement
Conflicts of Interest
References
- ECLAC. Estudio Económico de América Latina y el Caribe 2019. El Nuevo Contexto Financiero Mundial: Efectos y Mecanismos de Transmisión en la Región. In Études Caribéennes; ECLAC: Port of Spain, Trinidad and Tobago, 2019; No. 43–44. [Google Scholar]
- OECD. Future Liberalisation Trade in Environmental Goods and Services: Ensuring Environmental Protection as Well as Economic Benefits; OECD: Paris, France, 1999. [Google Scholar]
- UNEP. Green Economy; UNEP-UN Environment Programme. Available online: http://www.unep.org/regions/asia-and-pacific/regional-initiatives/supporting-resource-efficiency/green-economy (accessed on 26 May 2024).
- Hansen, U.E.; Nygaard, I.; Romijn, H.; Wieczorek, A.; Kamp, L.M.; Klerkx, L. Sustainability Transitions in Developing Countries: Stocktaking, New Contributions and a Research Agenda. Environ. Sci. Policy 2018, 84, 198–203. Available online: https://www.sciencedirect.com/science/article/pii/S1462901117311838 (accessed on 27 May 2024). [CrossRef]
- OECD; European Commission; CAF Development Bank of Latin America; Economic Commission for Latin America and the Caribbean. Perspectivas Económicas de América Latina 2022: Hacia una Transición Verde y Justa; Perspectivas Económicas de América Latina; OECD: Paris, France, 2022. [Google Scholar] [CrossRef]
- Cooke, P. Regional Innovation Systems: Development Opportunities from the ‘Green Turn’. Technol. Anal. Strateg. Manag. 2010, 22, 831–844. [Google Scholar] [CrossRef]
- Kautish, P.; Sharma, R. Value Orientation, Green Attitude and Green Behavioral Intentions: An Empirical Investigation among Young Consumers. Young Consum. 2019, 20, 338–358. [Google Scholar] [CrossRef]
- Alshamsi, A.; Pinheiro, F.L.; Hidalgo, C.A. When to Target Hubs? Strategic Diffusion in Complex Networks. arXiv 2017, arXiv:1705.00232. [Google Scholar]
- Balland, P.-A.; Boschma, R.; Crespo, J.; Rigby, D.L. Smart Specialization Policy in the European Union: Relatedness, Knowledge Complexity and Regional Diversification. Reg. Stud. 2019, 53, 1252–1268. [Google Scholar] [CrossRef]
- Boschma, R.; Minondo, A.; Navarro, M. The Emergence of New Industries at the Regional Level in S Pain: A Proximity Approach Based on Product Relatedness. Econ. Geogr. 2012, 89, 29–51. [Google Scholar] [CrossRef]
- Rigby, D. The Geography of Knowledge Relatedness and Technological Diversification in U.S. Cities. Res. Pap. Econ. 2012. Available online: http://econ.geo.uu.nl/peeg/peeg1218.pdf (accessed on 27 May 2024).
- Boschma, R. Relatedness as Driver of Regional Diversification: A Research Agenda. Reg. Study 2017, 51, 351–364. [Google Scholar] [CrossRef]
- Boschma, R.; Frenken, K. The Emerging Empirics of Evolutionary Economic Geography. J. Econ. Geogr. 2011, 11, 295–307. [Google Scholar] [CrossRef]
- Hidalgo, C.A. Economic Complexity: From Useless to Keystone. Nat. Phys. 2018, 14, 9–10. [Google Scholar] [CrossRef]
- Neffke, F.; Henning, M.; Boschma, R. How Do Regions Diversify over Time? Industry Relatedness and the Development of New Growth Paths in Regions: ECONOMIC GEOGRAPHY. Econ. Geogr. 2011, 87, 237–265. [Google Scholar] [CrossRef]
- Teece, D.J.; Pisano, G.; Shuen, A. Dynamic Capabilities and Strategic Management. Strat. Mgmt. J. 1997, 18, 509–533. [Google Scholar] [CrossRef]
- Hidalgo, C.A.; Klinger, B.; Barabási, A.-L.; Hausmann, R. The Product Space Conditions the Development of Nations. Science 2007, 317, 482–487. [Google Scholar] [CrossRef]
- Hidalgo, C.A.; Hausmann, R. The Building Blocks of Economic Complexity. Proc. Natl. Acad. Sci. USA 2009, 106, 10570–10575. [Google Scholar] [CrossRef]
- Hidalgo, C.A. The Policy Implications of Economic Complexity. Res. Policy 2023, 52, 104863. [Google Scholar] [CrossRef]
- Caldarola, B.; Mazzilli, D.; Napolitano, L.; Patelli, A.; Sbardella, A. Economic Complexity and the Sustainability Transition: A Review of Data, Methods, and Literature. arXiv 2023, arXiv:2308.07172v1. [Google Scholar] [CrossRef]
- Esmaeili, P.; Balsalobre Lorente, D.; Anwar, A. Revisiting the Environmental Kuznetz Curve and Pollution Haven Hypothesis in N-11 Economies: Fresh Evidence from Panel Quantile Regression. Environ. Res. 2023, 228, 115844. [Google Scholar] [CrossRef]
- Froy, F.; Heroy, S.; Uyarra, E.; O’Clery, N. What Drives the Creation of Green Jobs, Products and Technologies in Cities and Regions? Insights from Recent Research on Green Industrial Transitions. Local Econ. J. Local Econ. Policy Unit 2022, 37, 584–601. [Google Scholar] [CrossRef]
- Pérez-Hernández, C.C. Complejidad Económica y Economía Verde en México: Buscando Nuevos Caminos para la Sustentabilidad; UAEH: Mineral de la Reforma, Mexico, 2022. [Google Scholar] [CrossRef]
- Safi, A.; Wei, X.; Sansaloni, E.M.; Umar, M. Breaking down the Complexity of Sustainable Development: A Focus on Resources, Economic Complexity, and Innovation. Resour. Policy 2023, 83, 103746. [Google Scholar] [CrossRef]
- Barrios, D.; Ramos, J.; Tapia, J.; Grisanti, A.; Morales, J.R. Baja California: Reporte de Complejidad Económica; Harvard University: Cambridge, MA, USA, 2018; p. 106. [Google Scholar]
- Barrios, D.; Ramos, J.; Tapia, J.; Grisanti, A.; Obach, J. Tabasco: Diagnóstico de Crecimiento; Harvard University: Cambridge, MA, USA, 2018. [Google Scholar]
- Barrios, D.; Ramos, J.; Tapia, J.; Grisanti, A.; Obach, J. Campeche: Diagnóstico de Crecimiento; Harvard University: Cambridge, MA, USA, 2018. [Google Scholar]
- Bittencourt, P.F.; Gonçalves, J.; Hartmann, D.; Arend, M.; Cardoso, B.-H. Estratégia de Diversificação Inteligente Para as Microrregiões de Santa Catarina; Federação das Indústrias do Estado de Santa Catarina (FIESC): Florianópolis, Brazil, 2023. [Google Scholar] [CrossRef]
- Castañeda, G. Complejidad Económica, Estructuras Productivas Regionales y Política Industrial. Rev. De Econ. Mex. Anu. UNAM 2018, 3, 144–206. [Google Scholar]
- Felipe, J.; Kumar, U.; Abdon, A. How Rich Countries Became Rich and Why Poor Countries Remain Poor: It’s the Economic Structure…Duh! Dev. Econ. Ejournal 2010. [Google Scholar] [CrossRef]
- Hartmann, D.; Bezerra, M.; Pinheiro, F.L. Identifying Smart Strategies for Economic Diversification and Inclusive Growth in Developing Economies. The Case of Paraguay. Microecon. Welf. Econ. Collect. Decis. Mak. Ejournal 2019. [Google Scholar] [CrossRef]
- Hausmann, R.; Cheston, T.; Santos, M.A. La Complejidad Economica de Chiapas; Analisis de Capacidades y Posibilidades de Diversificacion Productiva; Harvard University: Cambridge, MA, USA, 2015. [Google Scholar]
- Hausmann, R.; Morales-Arilla, J.; Santos, M. Panama beyond the Canal: Using Technological Proximities to Identify Opportunities for Productive Diversification. Emerg. Mark. Econ. Ind. Policy Regul. Ejournal 2016. [Google Scholar] [CrossRef]
- Hausmann, R.; O’Brien, T.; Santos, M.A.; Grisanti, A.; Kasoolu, S.; Taniparti, N.; Tapia, J.; Villasmil, R. Jordan: The Elements of a Growth Strategy; Harvard University: Cambridge, MA, USA, 2019. [Google Scholar]
- Hausmann, R.; Santos, M.; Tudela, J.; Li, Y.; Grisanti, A. La Riqueza Escondida de Loreto: Análisis de Complejidad Económica y Oportunidades de Diversificación Productiva (The Hidden Treasure on the Peruvian Amazonia: Economic Complexity Analysis and Sustainable Opportunities to Productive Diversification); Harvard University: Cambridge, MA, USA, 2020. [Google Scholar] [CrossRef]
- Hausmann, R.; Hidalgo, C.A. The Atlas of Economic Complexity: Mapping Paths to Prosperity; Mit Press: Cambridge, MA, USA, 2011. [Google Scholar]
- Hidalgo, C.A. Discovering East Africa’s Industrial Opportunities. arXiv 2012, arXiv:1203.0163. [Google Scholar]
- O’Brien, T. Sri Lanka´s North Central Province: A Growth Diagnostic; Harvard’s Growth Lab: Cambridge, MA, USA, 2018. [Google Scholar]
- Pérez-Hernández, C.C.; Hernández-Calzada, M.A.; Ferreiro-Seoane, F.J. Diversification in Tourism-Related Activities and Social Sustainability in the State of Hidalgo, Mexico. Sustainability 2019, 11, 6429. [Google Scholar] [CrossRef]
- Romero, J.P.; Freitas, E.; Silveira, F.; Britto, G.; Cimini, F.; Jayme, F.G., Jr. Complexity-Based Diversification Strategies: A New Method for Ranking Promising Activities for Regional Diversification. Spat. Econ. Anal. 2024, 1–24. [Google Scholar] [CrossRef]
- Sánchez, R.R.; Hinojosa, A.S.; Wright, S.S. Growth Diagnostic for the State of Oaxaca; Harvard’s Growth Lab: Cambridge, MA, USA, 2018. [Google Scholar]
- Romero, J.P.; Gramkow, C. Economic Complexity and Greenhouse Gas Emission Intensity; University of Cambridge: Cambridge, UK, 2020. [Google Scholar]
- Bittó, V.; Koch, P.; Schwarzbauer, W. Perspektiven Des Zukünftigen Produktportfolios Des Österreichischen Außenhandels; FIW-Research Reports, 2024. Available online: https://www.econstor.eu/handle/10419/295131 (accessed on 27 June 2024).
- McKay, M. Product Space Analysis of Green Trade in Developing Asia. Asian Development Bank. 2024. Available online: https://www.adb.org/documents/ado2023-thematic-report-background-papers (accessed on 27 May 2024).
- Pérez-Hernández, C.C.; Salazar-Hernández, B.C.; Mendoza-Moheno, J.; Cruz-Coria, E.; Hernández-Calzada, M.A. Mapping the Green Product-Space in Mexico: From Capabilities to Green Opportunities. Sustainability 2021, 13, 945. [Google Scholar] [CrossRef]
- Belmartino, A. Green & Non-Green Relatedness: Challenges and Diversification Opportunities for Regional Economies in Argentina; GSSI Discussion Paper Series in Regional Science & Economic Geography No. 2022-3; GSSI: L’Aquila, Itlay, 2022. [Google Scholar]
- Palazzo, G.; Feole, M.; Gutman, M.; Bercovich, S.; Pezzarini, L.; Lourenco, M.B.D.; Mascarenhas, T.B. El Potencial Productivo Verde de la Argentina; Fundar: Buenos Aires, Argentina, 2021. [Google Scholar]
- Hamwey, R.; Pacini, H.; Assunção, L. Mapping Green Product Spaces of Nations. J. Environ. Dev. 2013, 22, 155–168. [Google Scholar] [CrossRef]
- Andres, P.; Mealy, P. Green Transition Navigator. Available online: https://green-transition-navigator.org/ (accessed on 27 May 2024).
- Mealy, P.; Teytelboym, A. Economic Complexity and the Green Economy. Res. Policy 2020, 51, 103948. [Google Scholar] [CrossRef]
- Hausmann, R.; O’Brien, T.; Fortunato, A.; Lochmann, A.; Shah, K.; Venturi, L.; Enciso-Valdivia, S.; Vashkinskaya, E.; Ahuja, K.; Klinger, B.; et al. Growth Through Inclusion in South Africa; CID Faculty Working Paper No. 434; Harvard’s Growth Lab: Cambridge, MA, USA, 2023. [Google Scholar]
- Growth Lab. Harvard Growth Lab Viz Hub. Available online: https://growthlab.app/greenplexity (accessed on 7 January 2025).
- Alshamsi, A.; Pinheiro, F.L.; Hidalgo, C.A. Optimal Diversification Strategies in the Networks of Related Products and of Related Research Areas. Nat. Commun. 2018, 9, 1328. [Google Scholar] [CrossRef]
- Essletzbichler, J. Relatedness, Industrial Branching and Technological Cohesion in US Metropolitan Areas. Reg. Stud. 2013, 49, 752–766. [Google Scholar] [CrossRef]
- Colombelli, A.; Quatraro, F. Green Start-Ups and Local Knowledge Spillovers from Clean and Dirty Technologies. Small Bus. Econ. 2019, 52, 773–792. [Google Scholar] [CrossRef]
- Santoalha, A.; Consoli, D.; Castellacci, F. Digital Skills, Relatedness and Green Diversification: A Study of European Regions. Res. Policy 2021, 50, 104340. [Google Scholar] [CrossRef]
- Montiel-Hernández, M.G.; Pérez-Hernández, C.C.; Salazar-Hernández, B.C. The Intrinsic Links of Economic Complexity with Sustainability Dimensions: A Systematic Review and Agenda for Future Research. Sustainability 2024, 16, 391. [Google Scholar] [CrossRef]
- Huber, S. Indicators of Product Sophistication and Factor Intensities: Measurement Matters. JEM 2017, 42, 27–65. [Google Scholar] [CrossRef]
- Hartmann, D.; Guevara, M.R.; Jara-Figueroa, C.; Aristaran, M.; Hidalgo, C.A. Linking Economic Complexity, Institutions, and Income Inequality. World Dev. 2017, 93, 75–93. [Google Scholar] [CrossRef]
- Balassa, B. Trade Liberalisation and “Revealed” Comparative Advantage 1. Manch. Sch. 1965, 33, 99–123. [Google Scholar] [CrossRef]
- Boschma, R.; Heimeriks, G.; Balland, P.-A. Scientific Knowledge Dynamics and Relatedness in Bio-Tech Cities. Res. Policy 2013. [Google Scholar] [CrossRef]
- Hausmann, R.; Hwang, J.; Rodrik, D. What You Export Matters. J. Econ. Growth 2007, 12, 1–25. [Google Scholar] [CrossRef]
- Hui, Z.; Choi, C.H. Is Carbon Emission Trading Policy a Panacea? The Implications of Promoting Green Total Factor Productivity. Asian-Pac Econ. Lit 2024, 38, 42–55. [Google Scholar] [CrossRef]
- Gaulier, G.; Zignago, S. BACI: International Trade Database at the Product-Level (the 1994–2007 Version). 2010. Available online: https://www.cepii.fr/CEPII/en/bdd_modele/bdd_modele_item.asp?id=37 (accessed on 27 May 2024).
- World Bank. World Bank Open Data. Available online: https://data.worldbank.org (accessed on 27 May 2024).
- Hidalgo, C.A. Economic Complexity Theory and Applications. Nat. Rev. Phys. 2021, 3, 92–113. [Google Scholar] [CrossRef]
- Balland, P.-A.; Broekel, T.; Diodato, D.; Giuliani, E.; Hausmann, R.; O’Clery, N.; Rigby, D. The New Paradigm of Economic Complexity. Res. Policy 2022, 51, 104450. [Google Scholar] [CrossRef] [PubMed]
- Jaramillo, D.; Calá, C.D.; Belmartino, A. Especialización Industrial En Argentina: Patrones Provinciales y Evolución Reciente (1996–2014). Pymes Innovación Y Desarrollo. 2016, 4, 3–20. [Google Scholar]
- Clasco. Hacia la Economía del Hidrógeno: Perspectivas de La Agenda Internacional y las Oportunidades Locales; Documentos de Trabajo del CCE; 2021. Available online: https://www.clacso.org/wp-content/uploads/2023/12/V1_Energia-y-Desarrollo-Sustentable_N7.pdf (accessed on 23 May 2024).
- Roger, D.D. Propuesta para el Desarrollo de La Industria Eólica Argentina; 2016. Available online: https://www.iade.org.ar/system/files/articulos/6roger.pdf (accessed on 23 May 2024).
- Agora. 12 Insights on Hydrogen-Argentina Edition. Available online: https://www.agora-energiewende.org/publications/12-insights-on-hydrogen-argentina-edition (accessed on 27 June 2024).
- Bril, T.; Gutman, V.; Dias, M.B.; Pezzarini, L.; Palazzo, G.; Anauati, M.V. Políticas de Desarrollo Productivo Verde para la Argentina Fundar; Fundar: Buenos Aires, Argentina, 2021; Available online: https://fund.ar/publicacion/politicas-de-desarrollo-productivo-verde/ (accessed on 23 May 2024).
- Paredes, J.R. La Red del Futuro: Desarrollo de una Red Eléctrica Limpia y Sostenible para América Latina; Inter-American Development Bank: Washington, DC, USA, 2017. [Google Scholar] [CrossRef]
- Roger, D.D.; Arroyo, J.I. Elementos para una transición energética sostenible y progresiva en Argentina. Cienc. Tecnol. Y Política 2023, 6. [Google Scholar] [CrossRef]
- Barbieri, N.; Consoli, D.; Napolitano, L.; Perruchas, F.; Emanuele; Pugliese; Sbardella, A. Regional Technological Capabilities and Green Opportunities in Europe. J. Technol. Transf. 2021, 48, 749–778. [Google Scholar] [CrossRef]
- Montresor, S.; Quatraro, F. Green Technologies and Smart Specialisation Strategies: A European Patent-Based Analysis of the Intertwining of Technological Relatedness and Key Enabling Technologies. Reg. Stud. 2019, 54, 1354–1365. [Google Scholar] [CrossRef]
- Herrera, D.; Verona, J.; dos Santos, J.; Robayo, K.; Salla, L.; Rodríguez, N.A.; Amador, V.; Posada, V.; Botello, W.; Duda, R.M. Estaciones de tratamiento de agua potable (ptap/etas): Brasil y Colombia. Ciência Tecnol. 2022, 14, 60–68. [Google Scholar] [CrossRef]
- Silva, A.J.B.d.; Souza, M.C.d.S.A.d. Gestión del Agua y Saneamiento Básico en una Reserva de Desarrollo Sostenible: Comunidad de Nossa Senhora do Livramento do Tupé, Brasil; Universitat d’Alacant: Alicante, Spain, 2023. [Google Scholar]
- Yang, M.; Chen, L.; Wang, J.; Msigwa, G.; Osman, A.I.; Fawzy, S.; Rooney, D.W.; Yap, P.-S. Circular Economy Strategies for Combating Climate Change and Other Environmental Issues. Environ. Chem. Lett. 2023, 21, 55–80. [Google Scholar] [CrossRef]
- Silva, H.M.F.D.; Araújo, F.J.C. Energia Solar Fotovoltaica No Brasil: Uma Revisão Bibliográfica. Rease 2022, 8, 859–869. [Google Scholar] [CrossRef]
- Cea Gago, M. Argentina, Brasil y Uruguay Como Polo Para La Generación de Hidrógeno Verde. EMBA Thesis, Universidad Torcuato Di Tella, Autónoma de Buenos Aires, Argentina, 2021. [Google Scholar]
- Chantre, C.; Andrade Eliziário, S.; Pradelle, F.; Católico, A.C.; Branquinho Das Dores, A.M.; Torres Serra, E.; Campello Tucunduva, R.; Botelho Pimenta Cantarino, V.; Leal Braga, S. Hydrogen Economy Development in Brazil: An Analysis of Stakeholders’ Perception. Sustain. Prod. Consum. 2022, 34, 26–41. [Google Scholar] [CrossRef]
- World Bank. Brasil Puede ser Más Rico y Más Verde: El Grupo Banco Mundial Presenta Oportunidades para la Acción Climática y el Crecimiento. World Bank. Available online: https://www.bancomundial.org/es/news/press-release/2023/05/04/brazil-can-be-both-richer-and-greener-world-bank-group-outlines-opportunities-for-climate-action-and-growth (accessed on 3 December 2024).
- APEC. ANNEX C-APEC List of Environmental Goods|2012 Leaders’ Declaration. APEC. Available online: https://www.apec.org/meeting-papers/leaders-declarations/2012/2012_aelm/2012_aelm_annexc (accessed on 23 May 2024).
- Algarin, C.R.; Álvarez, O.R. Un panorama de las energías renovables en el Mundo, Latinoamérica y Colombia. Espacios 2018, 39, 10. [Google Scholar]
- Government of Chile. Biblioteca del Congreso Nacional|Ley Chile. Available online: https://www.bcn.cl/leychile (accessed on 14 June 2024).
- WTO. WTO|Environmental Goods Agreement. Available online: https://www.wto.org/english/tratop_e/envir_e/ega_e.htm (accessed on 27 June 2024).
- Garcés, I. La Industria del Litio en Chile. 2022. Available online: https://intranetua.uantof.cl/salares/litio%20y%20derivados.pdf. (accessed on 27 June 2024).
- Gabbay, R.G.; Domingues, A.M.; Spindlegger, A.; Mair-Bauernfeind, C.; Part, F. Review of the Current Knowledge and Identified Gaps in Assessing the Social and Environmental Impacts of Mining Processes in the Lithium Triangle. Sustain. Prod. Consum. 2024, 53, 40–63. [Google Scholar]
- Sola, I.; Sánchez-Lizaso, J.L.; Muñoz, P.T.; García-Bartolomei, E.; Sáez, C.A.; Zarzo, D. Assessment of the Requirements within the Environmental Monitoring Plans Used to Evaluate the Environmental Impacts of Desalination Plants in Chile. Water 2019, 11, 2085. [Google Scholar] [CrossRef]
- Borda, D.C.; Caballero, M.V. Crecimiento y Desarrollo Económico en Paraguay: Balance y Propuestas para una Economía Sostenible e Inclusiva; Centro de Análisis y Difusión de la Economía Paraguaya: Asunción, Paraguay, 2020. [Google Scholar]
- Feal, S. Paraguay: Transitando Hacia El Desarrollo Sostenible. In Banco Interamericano de Desarrollo; IADB: Washington, DC, USA, 2023. [Google Scholar]
- Rodríguez Miranda, A.; Galaso, P.; Goinheix, S.; Martínez, C. Especializaciones Productivas y Desarrollo Económico Regional en Uruguay; Serie Documentos de Trabajo; IECON; 7/17; 2017. Available online: https://otu.opp.gub.uy/gestor/imagesbiblioteca/Especializaciones%20productivas%20y%20DET%20Uruguay_IECON_0.pdf (accessed on 27 June 2024).
- WHO. Estadísticas Sanitarias Mundiales 2009. Available online: https://www.who.int/es/publications/i/item/9789241563819 (accessed on 10 December 2024).
- Fukuzumi, S.; Lee, Y.-M.; Nam, W. Recent Progress in Production and Usage of Hydrogen Peroxide. Chin. J. Catal. 2021, 42, 1241–1252. [Google Scholar] [CrossRef]
- McDonnell, G. The Use of Hydrogen Peroxide for Disinfection and Sterilization Applications. In Patai’s Chemistry of Functional Groups; Wiley: Hoboken, NJ, USA, 2014; pp. 1–34. [Google Scholar] [CrossRef]
- Green Hydrogen Development Platform. Uruguay y la Unión Europea Impulsan de Forma Conjunta el Avance del Hidrógeno Verde. H2LAC. Available online: https://h2lac.org/noticias/uruguay-y-la-union-europea-impulsan-de-forma-conjunta-el-avance-del-hidrogeno-verde/ (accessed on 10 December 2024).
- Fetzer, T.; Lambert, P.J.; Feld, B.; Garg, P. AI-Generated Production Networks: Measurement and Applications to Global Trade; 2024. Available online: https://aipnet.io/ (accessed on 7 January 2025).
- IDB. Hidrógeno Verde y el Potencial para Uruguay: Insumos para la Elaboración de la Hoja de Ruta de Hidrógeno Verde de Uruguay | Publicaciones. Available online: https://publications.iadb.org/es/publications/spanish/viewer/Hidrogeno-verde-y-el-potencial-para-Uruguay-insumos-para-la-elaboracion-de-la-Hoja-de-Ruta-de-Hidrogeno-Verde-de-Uruguay.pdf (accessed on 10 December 2024).
- IDB. Hidrógeno Verde: Un Paso Natural para Uruguay Hacia la Descarbonización, 2021st ed.; Banco Interamericano de Desarrollo: Washington, DC, USA, 2022. [Google Scholar] [CrossRef]
- Rodrigues, G.; Robaina, M. National Innovation Systems and Sustainable Environmental Performance: A Cross Country Analysis. Environ. Chall. 2024, 16, 100978. [Google Scholar] [CrossRef]
- Tisdell, E.J.; Merriam, S.B.; Stuckey-Peyrot, H.L. Qualitative Research: A Guide to Design and Implementation; John Wiley & Sons: Hoboken, NJ, USA, 2025. [Google Scholar]
- Stiglitz, J. Making Globalisation Work; ESRI: Redlands, CA, USA, 2006. [Google Scholar]
- Mulder, N.; Albaladejo, M. El Comercio Internacional y la Economía Circular en América Latina y el Caribe; CEPAL: Santiago, Chile, 2020. [Google Scholar]
- WCO. World Customs Organization. Available online: https://www.wcoomd.org/en/topics/nomenclature/instrument-and-tools/hs-nomenclature-2022-edition.aspx (accessed on 10 December 2024).
- Gallego-Schmid, A.; López-Eccher, C.; Muñoz, E.; Salvador, R.; Londono, N.A.C.; Barros, M.V.; Bernal, D.C.; Mendoza, J.M.F.; Nadal, A.; Guerrero, A.B. Circular Economy in Latin America and the Caribbean: Drivers, Opportunities, Barriers and Strategies. Sustain. Prod. Consum. 2024, 51, 118–136. [Google Scholar] [CrossRef]
- Zhang, T.; Choi, C.H. Will Digital Trade Be Friend or Foe of the Green Economy? Unveiling the Complexities of Green Growth. J. Appl. Econ. 2025, 28, 2464591. [Google Scholar] [CrossRef]
- Marcon, A.; Ribeiro, J.L.D.; Dangelico, R.M.; de Medeiros, J.F.; Marcon, É. Exploring Green Product Attributes and Their Effect on Consumer Behaviour: A Systematic Review. Sustain. Prod. Consum. 2022, 32, 76–91. [Google Scholar] [CrossRef]
- Valverde Carbonell, J.; Menéndez de Medina, M.; Pietrobelli, C. Critical Minerals and Countries’ Mining Competitiveness: An Estimate Through Economic Complexity Techniques; Working Papers No. 025; UNU-MERIT: Maastricht, The Netherlands, 2023. [Google Scholar]
- McCauley, D.; Pettigrew, K.A.; Heffron, R.J.; Droubi, S. Identifying, Improving, and Investing in National Commitments to Just Transition: Reflections from Latin America and the Caribbean. Environ. Sustain. Indic. 2023, 17, 100225. [Google Scholar] [CrossRef]
- Hwang, Y.K.; Díez, Á.S.; Inglesi-Lotz, R. The Effects of Critical Mineral Endowments on Green Economic Growth in Latin America. Resour. Policy 2024, 98, 105355. [Google Scholar] [CrossRef]
- Gao, J.; Jun, B.; Pentland, A.S.; Zhou, T.; Hidalgo, C.A. Spillovers across Industries and Regions in China’s Regional Economic Diversification. Reg. Stud. 2021, 55, 1311–1326. [Google Scholar] [CrossRef]


| Variable | Definition | Period | Data Source |
|---|---|---|---|
| Average Exports | Average exports of products (classified at the 6-digit level of the Harmonized System HS-1992). Values expressed in USD. | 2018–2022 | Own elaboration based on BACI, version 2024-01b [64] |
| Revealed Comparative Advantage (RCA) | RCA = 1 indicates that the country competitively exports the product [60]. | ||
| Relatedness | Indicates the degree of proximity of a product to the other products in a country’s export basket [17]. | ||
| Product Complexity Index (PCI) | Quantifies the degree of sophistication of products [66]. | ||
| PRODY | Indicates the income level associated with a specific product or set of products [62]. | 2019 | Own elaboration based on BACI data and World Bank |
| Product Gini Index (PGI) | Links exported products to the average level of income inequality in exporting countries [59]. | ||
| Product Emissions Intensity Index (PEII) | Provides a weighted measure of emissions at the product level [42]. | 2003–2012 | Compiled from Romero and Gramkow [42] |
| Strategy | Feasibility Criteria | Parameters | Reference |
|---|---|---|---|
| S1 | Maintenance | RCA ≤ 1.5 | Romero et al. [40] |
| S2 | Related Capabilities | Relatedness ≥ 0.10 | Hartmann et al. [31] |
| S3 | Trade Inertia | 0.50 ≤ RCA < 1 | Hartmann et al. [31] |
| Strategy | Feasibility Criteria | Parameters | Reference |
|---|---|---|---|
| S4 | High Income | [Relatedness > 0.05] and [0.05 ≤ RCA < 1] and [Mean Exports > 1 M] and [PRODY ≥ 20,024] | Hartmann et al. [31] |
| S5 | Just Transition | [Relatedness > 0.05] and [0.05 ≤ RCA < 1] and [Mean Exports > 1 M] and [PRODY ≥ 20,024] and [PCI > Diversification Frontier*] and [PGI < 0.405] and [PEII = Low-emission intensity] | Adapted according to Hartmann et al. [31] and Romero and Gramkow [42] |
| S6 | High Complexity | PCI > Diversification Frontier* & Q3 ≤ Relatedness < Q4 | Balland et al. [9,67]; Hidalgo [19] |
Disclaimer/Publisher’s Note: The statements, opinions and data contained in all publications are solely those of the individual author(s) and contributor(s) and not of MDPI and/or the editor(s). MDPI and/or the editor(s) disclaim responsibility for any injury to people or property resulting from any ideas, methods, instructions or products referred to in the content. |
© 2025 by the authors. Licensee MDPI, Basel, Switzerland. This article is an open access article distributed under the terms and conditions of the Creative Commons Attribution (CC BY) license (https://creativecommons.org/licenses/by/4.0/).
Share and Cite
Pérez-Hernández, C.C.; Montiel-Hernández, M.G.; Salazar-Hernández, B.C. Unlocking Green Export Opportunities: Empirical Insights from Southern Cone Economies. Sustainability 2025, 17, 2257. https://doi.org/10.3390/su17052257
Pérez-Hernández CC, Montiel-Hernández MG, Salazar-Hernández BC. Unlocking Green Export Opportunities: Empirical Insights from Southern Cone Economies. Sustainability. 2025; 17(5):2257. https://doi.org/10.3390/su17052257
Chicago/Turabian StylePérez-Hernández, Carla Carolina, María Guadalupe Montiel-Hernández, and Blanca Cecilia Salazar-Hernández. 2025. "Unlocking Green Export Opportunities: Empirical Insights from Southern Cone Economies" Sustainability 17, no. 5: 2257. https://doi.org/10.3390/su17052257
APA StylePérez-Hernández, C. C., Montiel-Hernández, M. G., & Salazar-Hernández, B. C. (2025). Unlocking Green Export Opportunities: Empirical Insights from Southern Cone Economies. Sustainability, 17(5), 2257. https://doi.org/10.3390/su17052257