Abstract
Understanding the spatiotemporal evolution patterns and drivers of cropping structures is crucial for adjusting cropping structure policies, ensuring the sustainability of land resources, and safeguarding food security. However, existing research lacks sub-pixel scale data on planting structure, where planted area data are mainly derived from manual counting results. In this study, remote sensing technology was combined with geostatistical methods to realize the spatiotemporal evolution of crop planting structure at sub-pixel scale. Firstly, the spatial distribution of the multiple cropping structure in Henan Province was extracted based on a mixed-pixel decomposition model, and spatiotemporal evolution of the crop planting structure was analyzed using a combination of Sen’s slope estimator and Mann–Kendall trend analysis, as well as centroid migration. Then, Pearson correlation coefficients were calculated to explore the contribution of driving factors. The results indicate the following: (1) from 2001 to 2022, the cropping structure in Henan Province shows a slightly obvious increase. (2) The centroid of different cropping structures migrates to the main production areas as a whole. (3) Among the driving factors, there was a positive correlation with the labor force and a negative correlation with the urbanization rate. This study provides new insights into the evolution of large-scale crop planting structures and offers significant theoretical and practical value for sustainable agricultural development and the optimization of agricultural planting structures.
1. Introduction
Crop planting structures play a vital role in maintaining global food security and offer critical information to assist governments in agricultural restructuring and water resource management [1]. The planting structure denotes the yearly sequence and spatial distribution of crops within an area or country over the course of a year [2]. This includes spatial distribution information and cropping patterns such as continuous cropping, rotation cropping, intercropping, and fallowing [3]. Analyzing the evolution characteristics and driving factors of crop planting structures is vital for sustainable agricultural development, which is of great significance in theoretical and practical implications for food security early warning and assessment.
Currently, the primary methods for studying the spatiotemporal changes in crop planting structures involve using multi-year statistical yearbook data and interpreting remotely sensed imagery [4]. The data for analyzing the evolution characteristics of planting structures based on statistical data primarily come from the planting area and yield data of administrative divisions in statistical yearbooks [5]. Jiang et al. analyzed the spatiotemporal changes in crop planting structure across China over a 30-year period, starting from 1985, based on county-level planting area statistics and concluded that the cultivation of major crops in China has become increasingly concentrated and that crop planting structures have been simplified [6]. Deng et al. used spatial autocorrelation analysis and descriptive statistical using provincial-level regional statistics to study changes in the spatial distribution of grain production (including wheat, maize, and rice) in China over a period of more than 30 years starting from 1978, in which the cultivation of wheat and maize gradually clustered in the main production areas [7]. Li et al. analyzed the impact of spatial shifts in cultivated land on grain crops in China by converting county-level average grain crop yields and sown areas into pixel-level data with 1 km spatial resolution data, and the results showed that built-up areas affected the reduction of cultivated land and crop planting structures [8]. However, the distribution of agricultural planting in China exhibits significant regional differences and is not primarily based on administrative divisions. Although this method can obtain multi-year continuous results of planting structures, the data on administrative divisions cannot accurately reflect the refined spatial distribution characteristics of different planting structures over large areas [9].
With ongoing advancements in sensor technology, remote sensing offers efficient and extensive coverage of ground surfaces, enabling effective extraction of planting structure information within a large study area [9,10]. Chen et al. used moderate resolution imaging spectroradiometer (MODIS) MOD09Q1 data to analyze trends in the crop planting structure in the Yangtze River Basin in the past 20 years. They employed a combined method of differential algorithms, spectral mutation algorithms, and threshold algorithms and briefly analyzed the effects of irrigation and changes in policy and food prices on the structure of food cultivation [11]. Guo et al. deciphered the crop planting structure through remote sensing data from 2000 to 2020 in Qinghai Province, China, and explored the driving mechanisms affecting the crop planting structure, such as economic, environmental, and agricultural production conditions [12]. Although high-resolution, remotely sensed imagery can provide detailed information on land cover types, their longer temporal resolution and narrower swath width limit the applicability of extraction methods to larger study areas [13]. Low-resolution, remotely sensed imagery covers a wide range of areas, but low spatial resolution is challenging for detailed vegetation extraction in complex landscapes. Moreover, the extraction accuracy and resolution at regional and national scales do not meet the demands of refined mapping [14]. Affected by the imaging principles and sensor influences, mixed pixels commonly exist in remotely sensed imagery [15,16]. Therefore, accurately and synchronously obtaining planting structure information over large areas is crucial for studying the evolution characteristics and driving factors of planting structures.
To address these concerns, this study aims to develop a sub-pixel scale analytical model based on a mixed-pixel decomposition method to extract the crop planting structures in Henan Province from 2001 to 2022. This model is used to analyze the evolutionary trends and driving factors in crop planting structures. Specifically, the study includes the following objectives: (1) to analyze the temporal evolution trends in crop planting structures in Henan Province over 2001–2022; (2) to track the centroid migration of multiple crop planting structures; and (3) to comprehensively consider and analyze the driving factors leading to the evolution of multiple cropping structures under various conditions, including natural factors, social factors, and agricultural production factors. By integrating remote sensing technology and geostatistical methods, this study holds significant theoretical and practical value for understanding the distribution and evolutionary characteristics of regional crop planting structures, providing a scientific basis for optimizing crop planting structures and promoting sustainable agricultural development.
2. Materials and Methods
2.1. Study Area
Henan Province (110°21′–116°39′ E, 31°23′–36°22′ N), China, is located in the central part of China and covers an area of 167,000 km2 [17]. The province consists of 18 cities, with Zhengzhou as its provincial capital (Figure 1a) [18]. The topography of Henan Province is high in the west and low in the east, and the terrain within the region is diverse, including plains, basins, and mountains [19]. The central and eastern parts of the province are part of the North China Plain, which accounts for more than 50% of the total area of Henan Province (Figure 1b). The region has a continental monsoon climate transitioning from the northern subtropical zone to the warm temperate zone, characterized by four distinct seasons, simultaneous rain and heat, and complex and diverse climatic features. Over the past 10 years, the average annual temperature in the province has ranged from 15.1 °C to 15.9 °C, and the average annual precipitation has ranged from 512.6 mm to 1129.1 mm [20].
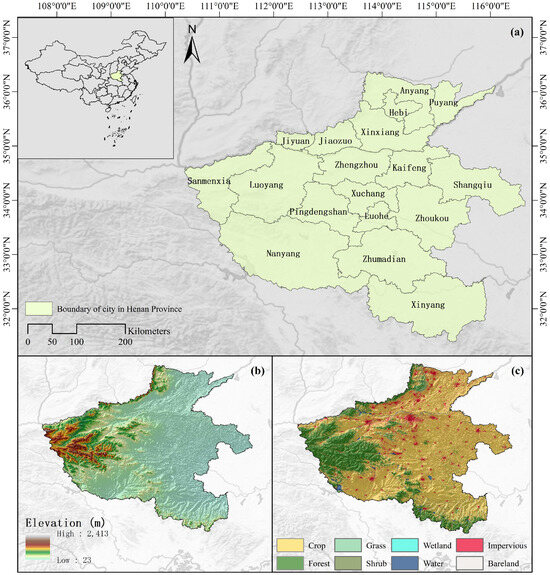
Figure 1.
Regional context and overview of Henan Province, China. (a) Location map and administrative map. (b) Digital elevation model map. (c) Land cover classification map.
The vast plains provide Henan Province with a large amount of flat land, combined with favorable climatic characteristics, making it a major agricultural province and a significant grain producer in China. The main land-use type in the study area is crop land (Figure 1c), primarily for growing crops like winter wheat, summer maize, and rice. Henan Province features 15 major soil types, including cinnamon soil, fluvo-aquic soil, brown soil, and yellow cinnamon soil. Notably, fluvo-aquic soil, predominantly distributed across river valleys and intermountain basins, constitutes more than 30% of the total soil area [21]. Henan Province accounts for only 1.73% of China total land area but houses approximately 7% of the national total population, and 10% of the country’s food production is grown there [22]. For ten consecutive years, Henan’s grain output has exceeded 60 million tons, with a sown area of over 14.7 million hectares, playing a crucial role in China’s food security [23].
2.2. Data Sources and Descriptions
Long time-series normalized difference vegetation index (NDVI) datasets in this study are used for planting structure extraction based on the mixed-pixel decomposition model. The NDVI data are obtained from the MODIS MOD13Q1 NDVI composite product, with a temporal resolution of 16 days and a spatial resolution of 250 m. Annual average temperature and annual cumulative precipitation were calculated and downloaded from Google Earth Engine (GEE). In particular, the annual average temperature was derived from the daily temperature values provided by MODIS MOD11A1 product, while the cumulative annual precipitation was obtained by summing daily precipitation data from the Climate Hazards Group Infrared Precipitation with Stations (CHIRPS) [24]. Social and agricultural production factors were sourced from the China Statistical Yearbook and the Henan Statistical Yearbook. Detailed information on the multiple source data is provided in Table 1. The time span for all of the above data ranges from 2001 to 2022.

Table 1.
Data description and source used in the study.
2.3. Research Methodology
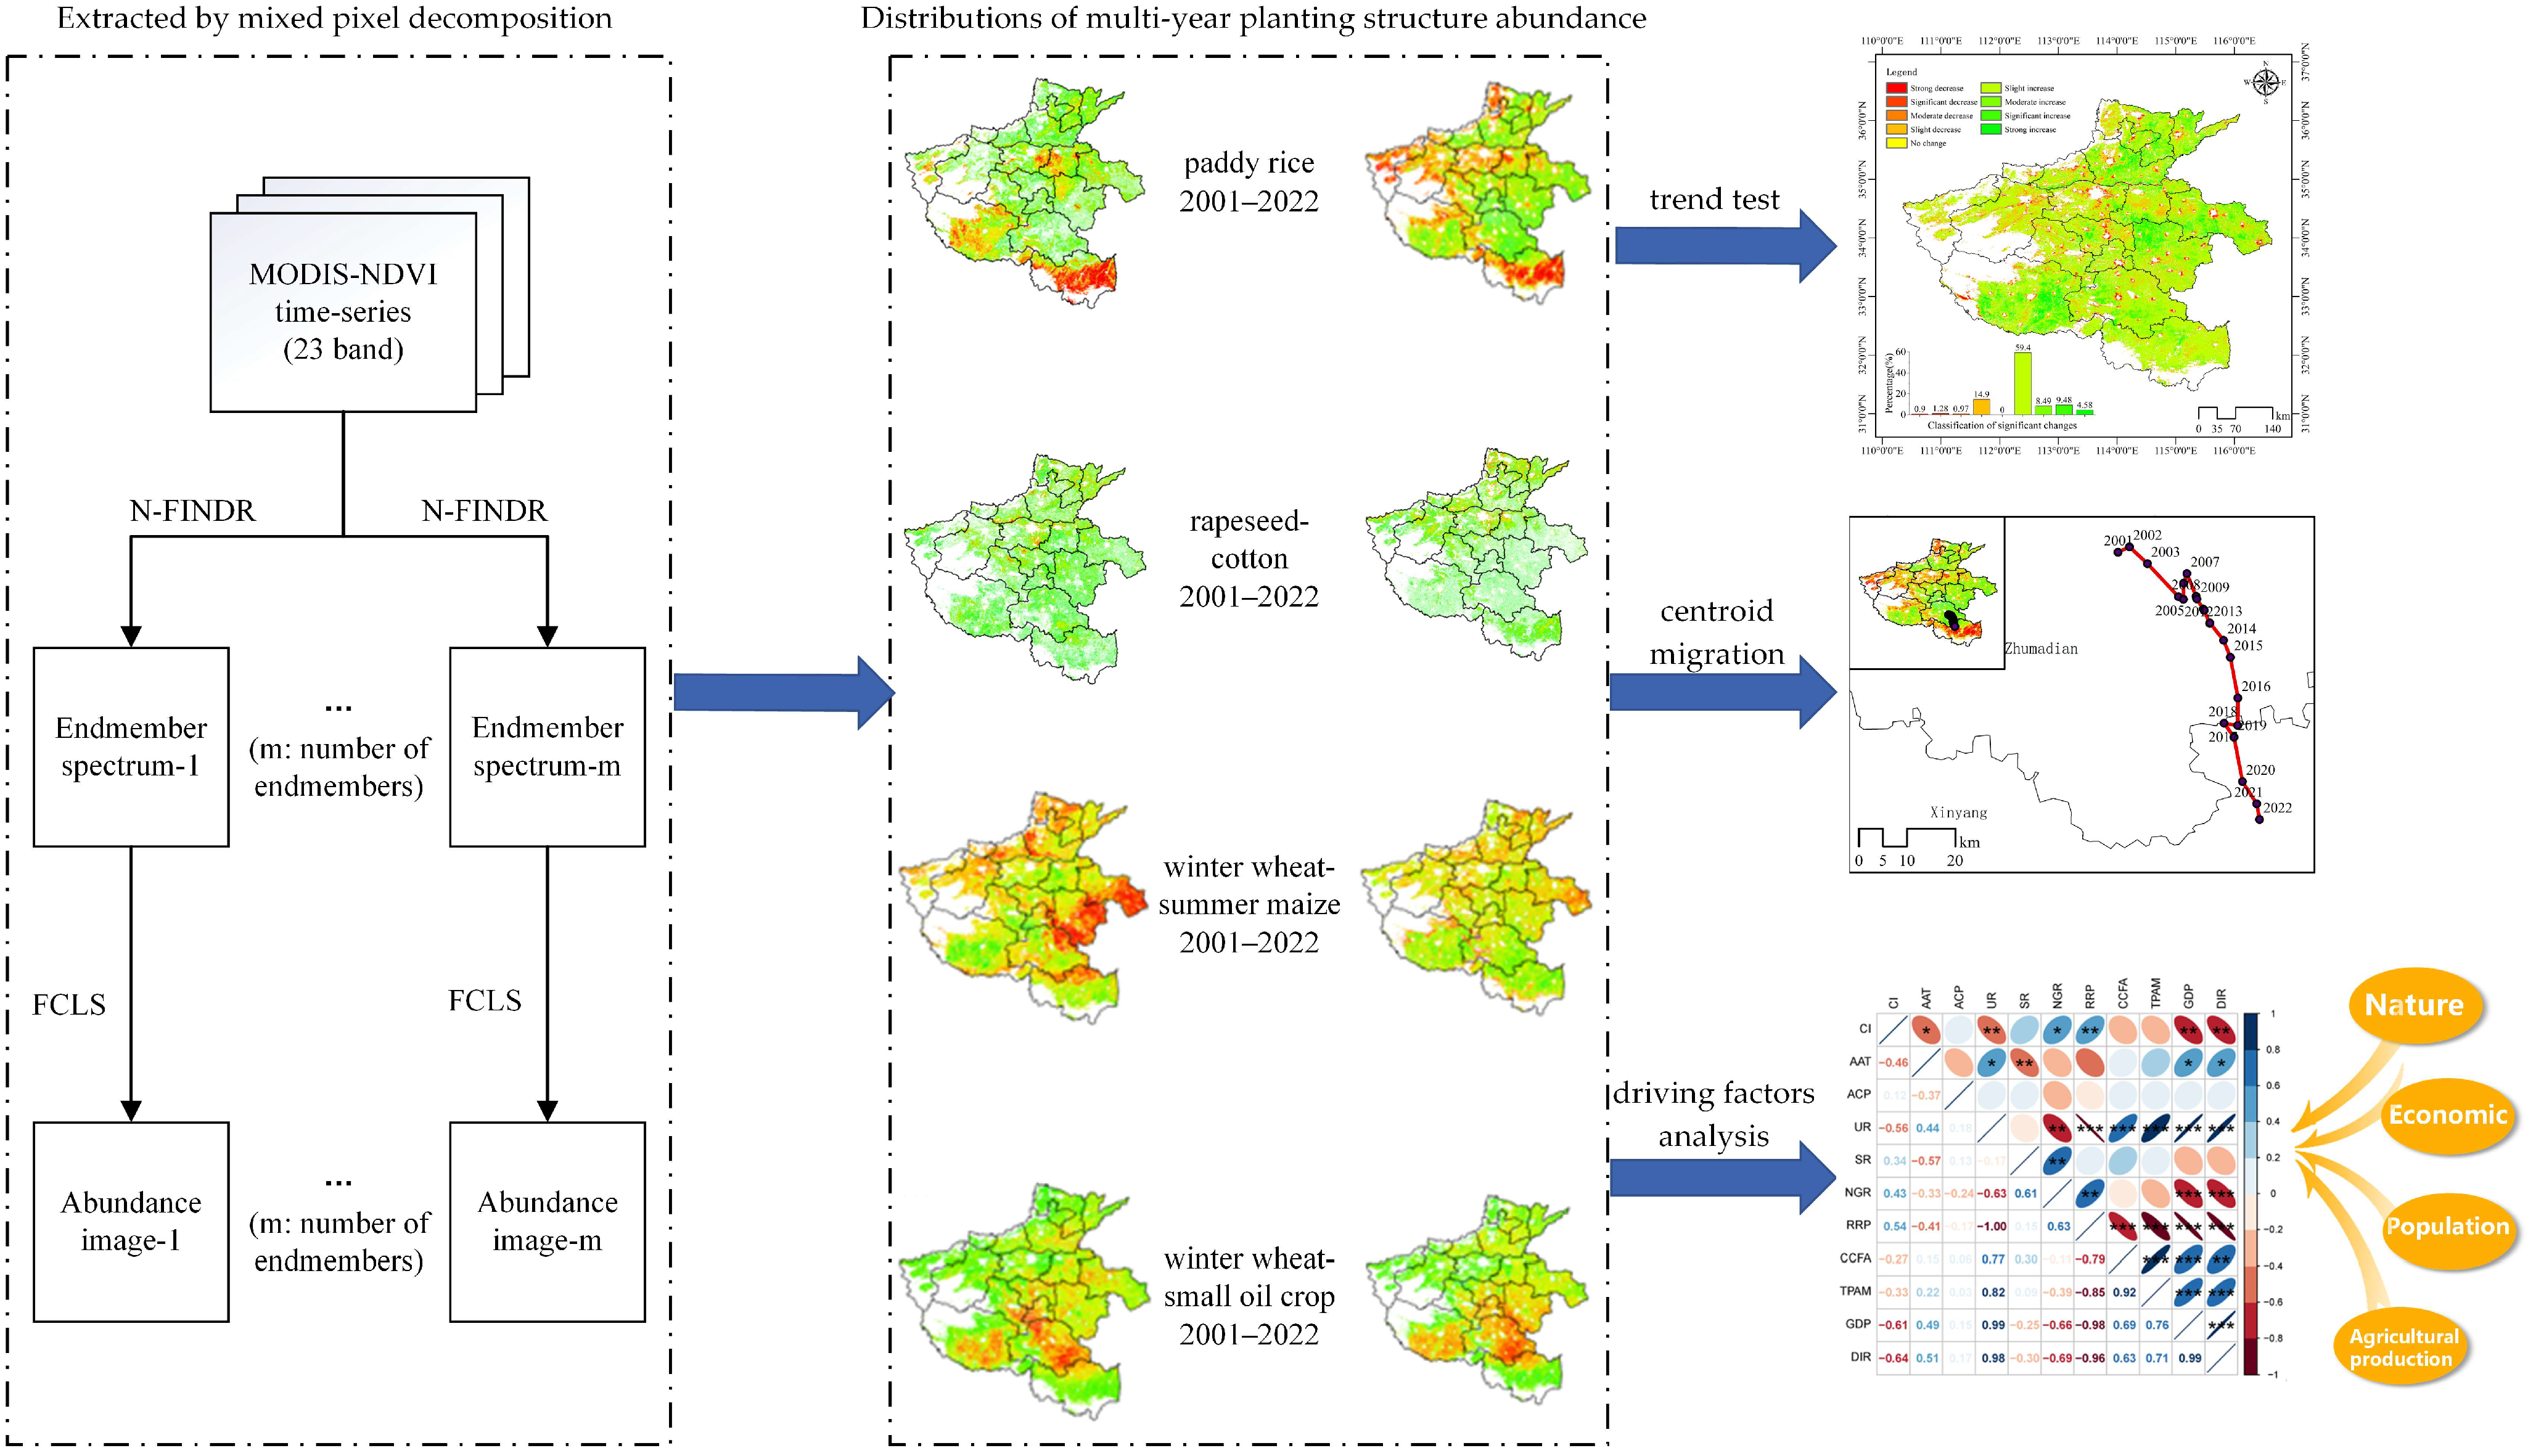
The primary framework for analyzing the evolution trends and driving factors, at a sub-pixel scale, of planting structure information of main grain crops is provided in Figure 2. Firstly, based on the phenological differences of various crops in the time series profiles, the mixed-pixel decomposition method of N-FINDR [25] combined with the fully constrained least squares (FCLS) [26] method was used to extract the spatial distribution information of crop planting structures in Henan Province from 2001 to 2022. Secondly, by calculating the cropping index (CI), the dynamic evolution of crop planting structures over 22 years was investigated. Finally, the correlation between the cropping index and ten driving factors was analyzed from the perspectives of natural factors, economic factors, population factors, and agricultural production factors.
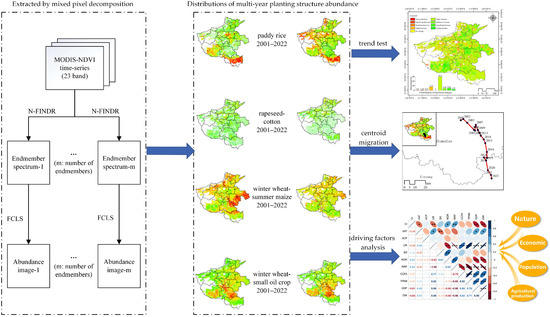
Figure 2.
Overall study framework of analyzing the spatiotemporal evolution patterns and driving factors. NDVI: normalized difference vegetation index; FCLS: fully constrained least squares.
2.3.1. The Mixed-Pixel Decomposition Method
This study utilized MODIS MOD13Q1 NDVI products to extract the spatial distribution of various crop planting structures. First, a time series data cube was constructed based on the original data of the study area, and the Savitzky–Golay filtering method [27] was used to reconstruct the data. Among them, the annual time series cube data consist of 23 periods of MOD13Q1 NDVI in one year [28]. Next, principal component analysis (PCA) [29] was used to process the constructed time series dataset to determine the number of “phenological endmembers” and reduce the dimensionality. Subsequently, the N-FINDR method combined with the FCLS algorithm was used to extract the endmembers of different planting structures, generating abundance spatial distributions for each phenological endmember. Finally, the accuracy of the extraction results was verified using a confusion matrix based on high-resolution remotely sensed imagery. The overall classification accuracy of this method was 85.65%, with a Kappa coefficient of 0.82. Yang et al. provided the specific steps for sub-pixel extraction of crop planting structures [28].
2.3.2. Centroid Migration Model
The centroid is the geometric center of one or more polygons; it can be used to determine the specific location of a certain land cover type in space and is represented by Xc and Yc, respectively [30,31]. The centroid migration model, on the other hand, tracks the changes in the spatial and temporal patterns of multiple cropping structures in Henan Province by determining the location of the centroid of a certain cropping structure and its changing trend. In addition, the spatial and temporal changes of the centroid help in the study of the impacts of natural and social factors on the planting structure. The formula for calculating the centroid is as follows:
where n is the number of polygons, xi and yi are the coordinates of the centroid of each polygon, respectively, and ai is the weight represented by the centroid of each polygon, which is also the area of that planting type in that polygon. Among them, the calculation of the centroid in this paper takes the municipal boundaries of Henan Province as the polygon for calculation.
2.3.3. Sen + Mann–Kendall Trend Test
The Sen’s slope estimator is a nonparametric statistical computational method for estimating the skewed trend in a long time series, which is highly robust and efficient to compute [32]. The β of Sen’s slope is calculated as follows:
where Xi and Xj are the ith and jth values in the time series, respectively, and Median(*) is the median function. According to Equation (1), a value of β less than 0 indicates a decreasing trend and vice versa.
The Mann–Kendall test is an effective nonparametric statistical method for analyzing trends in time series data. The method does not require all data to follow a normal distribution and is not significantly affected by missing data and data anomalies in the time series, making it suitable for analyzing trend changes in long time series. The test statistic S value is calculated as follows:
where sgn(*) is a sign function. The formula is as follows:
Since the length of the time series is greater than 10, the test statistic Z is calculated as follows:
where var(*) is the variance function. The formula is as follows:
where n is the number of time series data, g is the number of tied groups data, and tp is the number of repetition points in the pth tied group.
The Sen’s slope estimator, while good at reducing noise interference, is limited in its ability to determine the significance of the temporal trends. However, the Mann–Kendall method does not require data to follow a specific temporal distribution, is not sensitive to outliers, and can be supplemented by the insufficiency of Sen’s slope estimator to achieve significance testing of temporal trends. As a result, the combination of the Sen’s slope estimator and the Mann–Kendall test enables effective prediction of sequence trends through significance testing. This method is widely used for analyzing changing trends in long time series data such as temperature, precipitation, and vegetation index [33,34]. In this paper, the significance level α = 0.05 is used. Z values greater than 1.96 indicate that the trend passes 95% significance tests. Five classifications were obtained from the Sen’s slope estimator values (β) and significance test statistics (Z), as shown in Table 2.
Table 2.
Sen + Mann–Kendall test trend categories.
2.3.4. Pearson’s Correlation Coefficient
The Pearson’s correlation coefficient is a statistical measure used to quantify the degree of linear correlation between two elements [35]. It is usually denoted by r, and its theoretical range is between −1 and 1. A value of 1 for r indicates a positive correlation, meaning that one element increases as the other increases. Conversely, −1 is a negative linear correlation, while 0 indicates that there is no linear relationship between the two. The formula for r is shown below:
where Xi and Yi are the data values of variables X and Y, respectively; n is the number of data for X or Y, which in this paper is the number of years in the time series; and and are the average of all data for variables X and Y, respectively. What is more, the correlations were tested for significance, denoted by p and labeled with *.
3. Results
3.1. Spatial Distribution of Different Crop Planting Structures
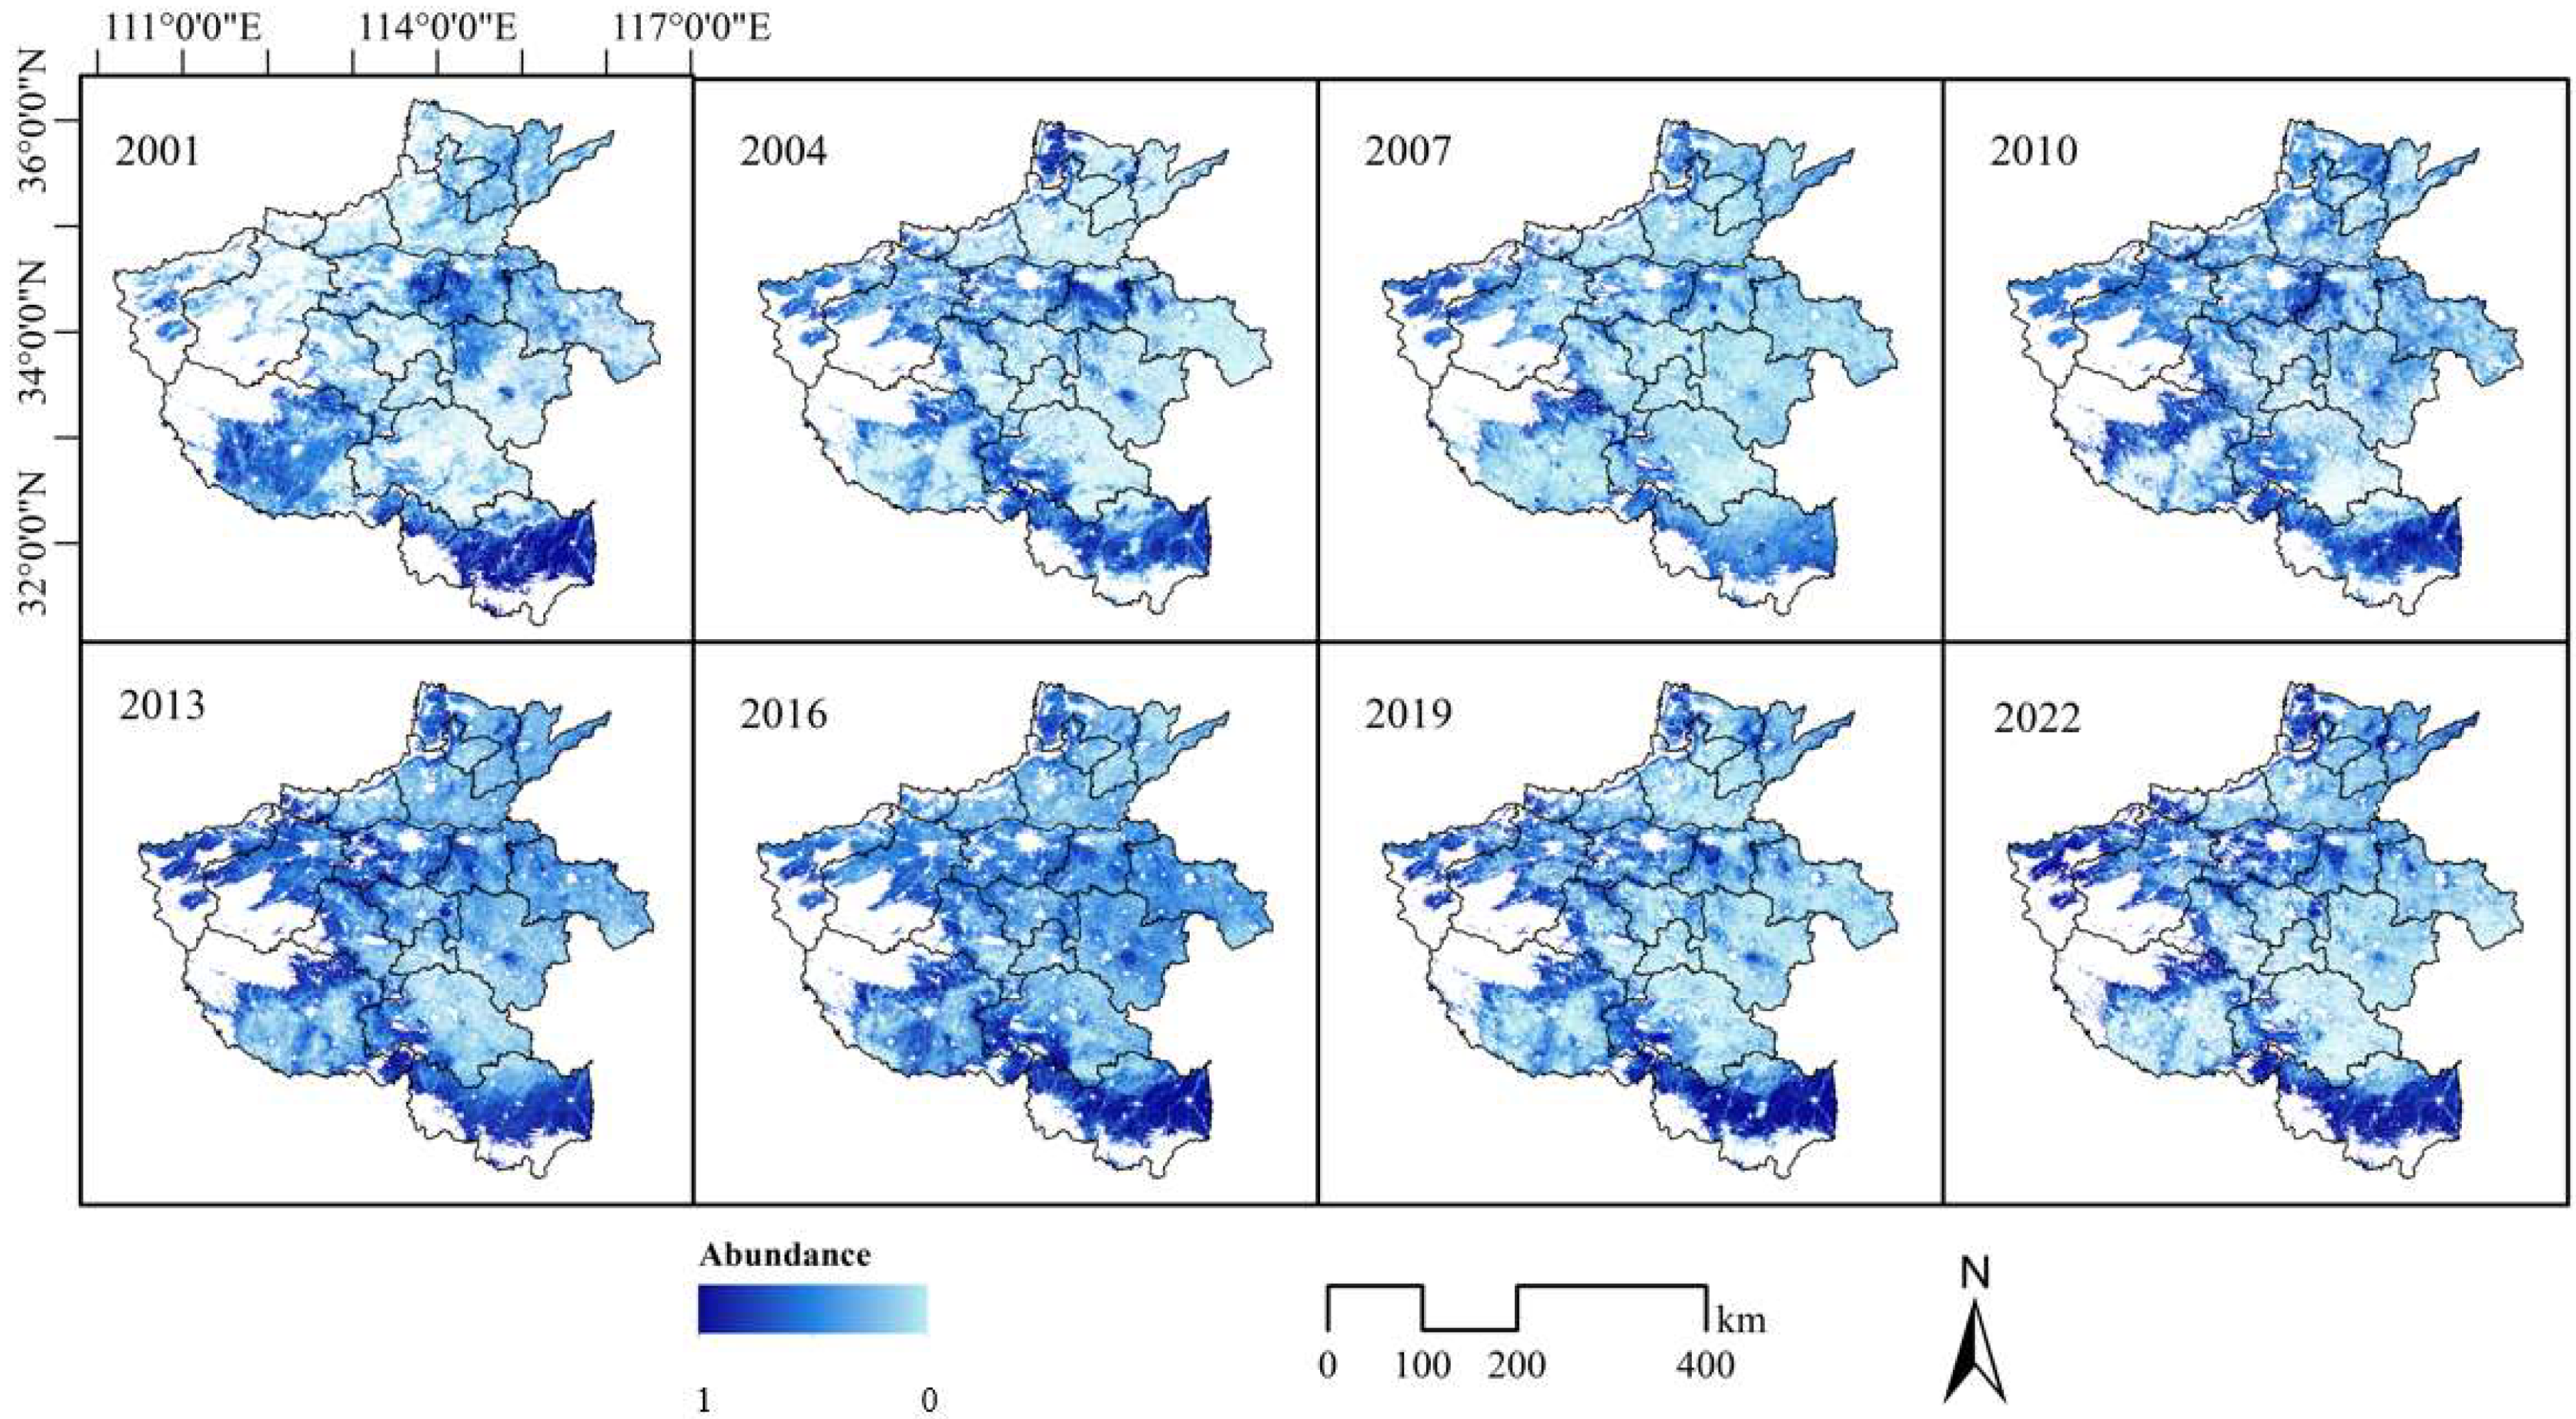
Based on the mixed-pixel decomposition method, the spatial distributions of paddy rice, rapeseed–cotton, winter wheat–summer maize, and winter wheat–small oilseeds were extracted in Henan Province from 2001 to 2022. Figure 3 shows the spatial distribution of abundance values for paddy rice. Paddy rice cultivation in Henan Province primarily consists of single-season crops, with the main production areas located in the southern part, along the Yellow River, and at the edges of mountainous regions. Xinyang City is a major rice-producing city in Henan Province. In northern Henan, rice is mainly planted in the middle and lower reaches of the Yellow River, where water resources are abundant. In 2001, the abundance of rice fields was notably higher in the southern region, with a limited distribution along the Yellow River; however, the overall abundance remained relatively low. From 2004 to 2010, there was a slight expansion in the extent of paddy fields, particularly in the southern region where the intensity of cultivation increased and the area under cultivation expanded. Between 2013 and 2016, the planting density in both the southern region and along the Yellow River continued to rise, leading to increasingly contiguous blue areas. Additionally, the abundance near the southern mountain margins also increased, suggesting that rice cultivation had extended into more marginal but suitable areas. By 2019–2022, paddy planting in Xinyang approached its peak abundance, while the intensity of cultivation in the Yellow River basin further intensified. Some northern regions also saw an increase in cultivation intensity, as indicated by the deepening blue color. However, there has been no significant expansion in rice cultivation into mountainous areas, indicating that geographical constraints continue to limit paddy planting.
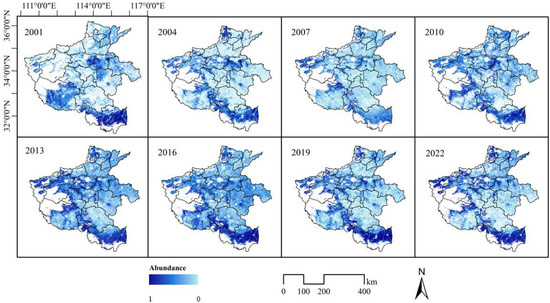
Figure 3.
Paddy rice abundance distribution in Henan Province over multiple years.
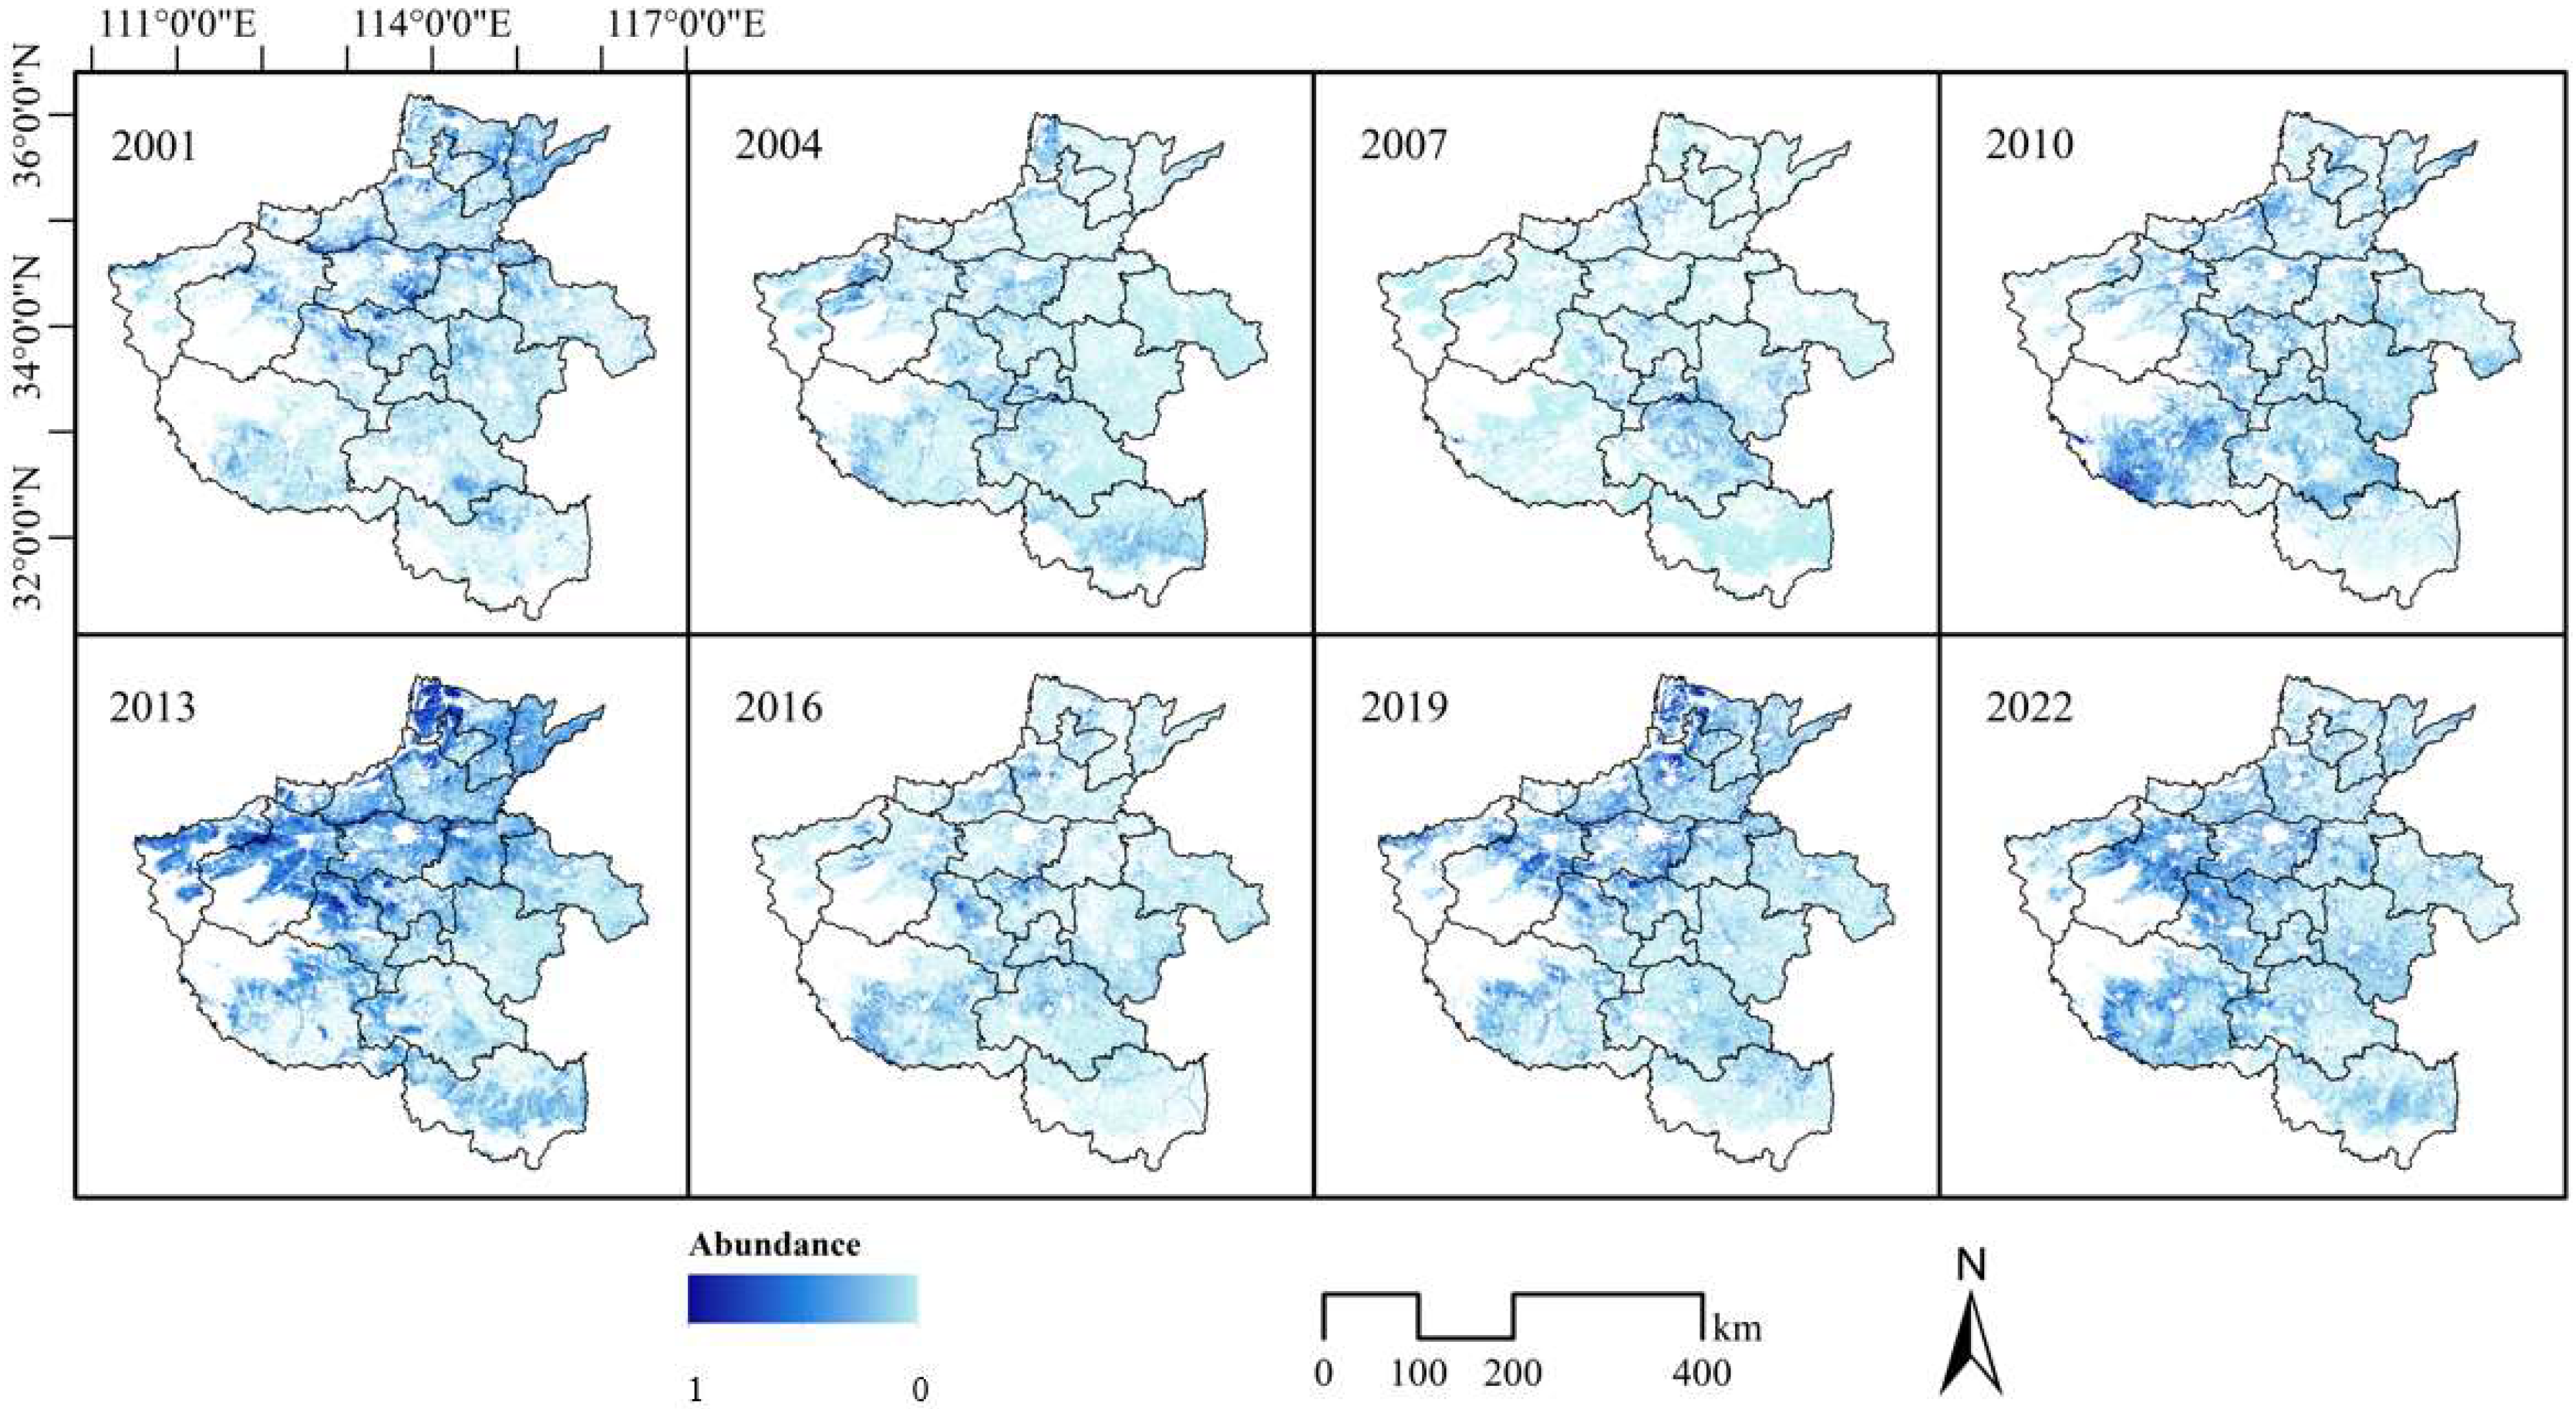
Figure 4 shows the spatial distribution of abundance values for rapeseed–cotton. The area of rapeseed–cotton cultivation is relatively small compared to other planting patterns in the province and is primarily distributed in the southern and western regions. Between 2001 and 2013, there was a notable increase in the cultivation of canola seed–cotton, particularly in the southern region. This trend suggests an expansion or intensification in planting activities. From 2016 to 2022, the spatial distribution of canola seed–cotton cultivation remained largely stable, with the southern and western regions continuing to be predominant. However, no significant expansion into other areas was observed during this period, indicating a stabilization of canola seed–cotton cultivation within these key regions.
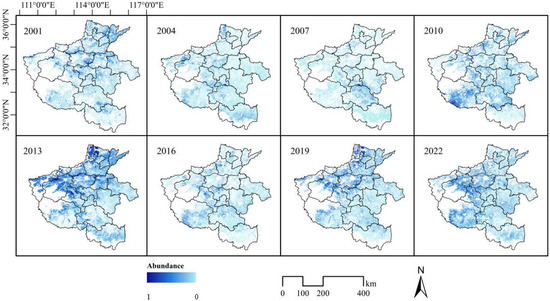
Figure 4.
Rapeseed–cotton abundance distribution in Henan Province over multiple years.
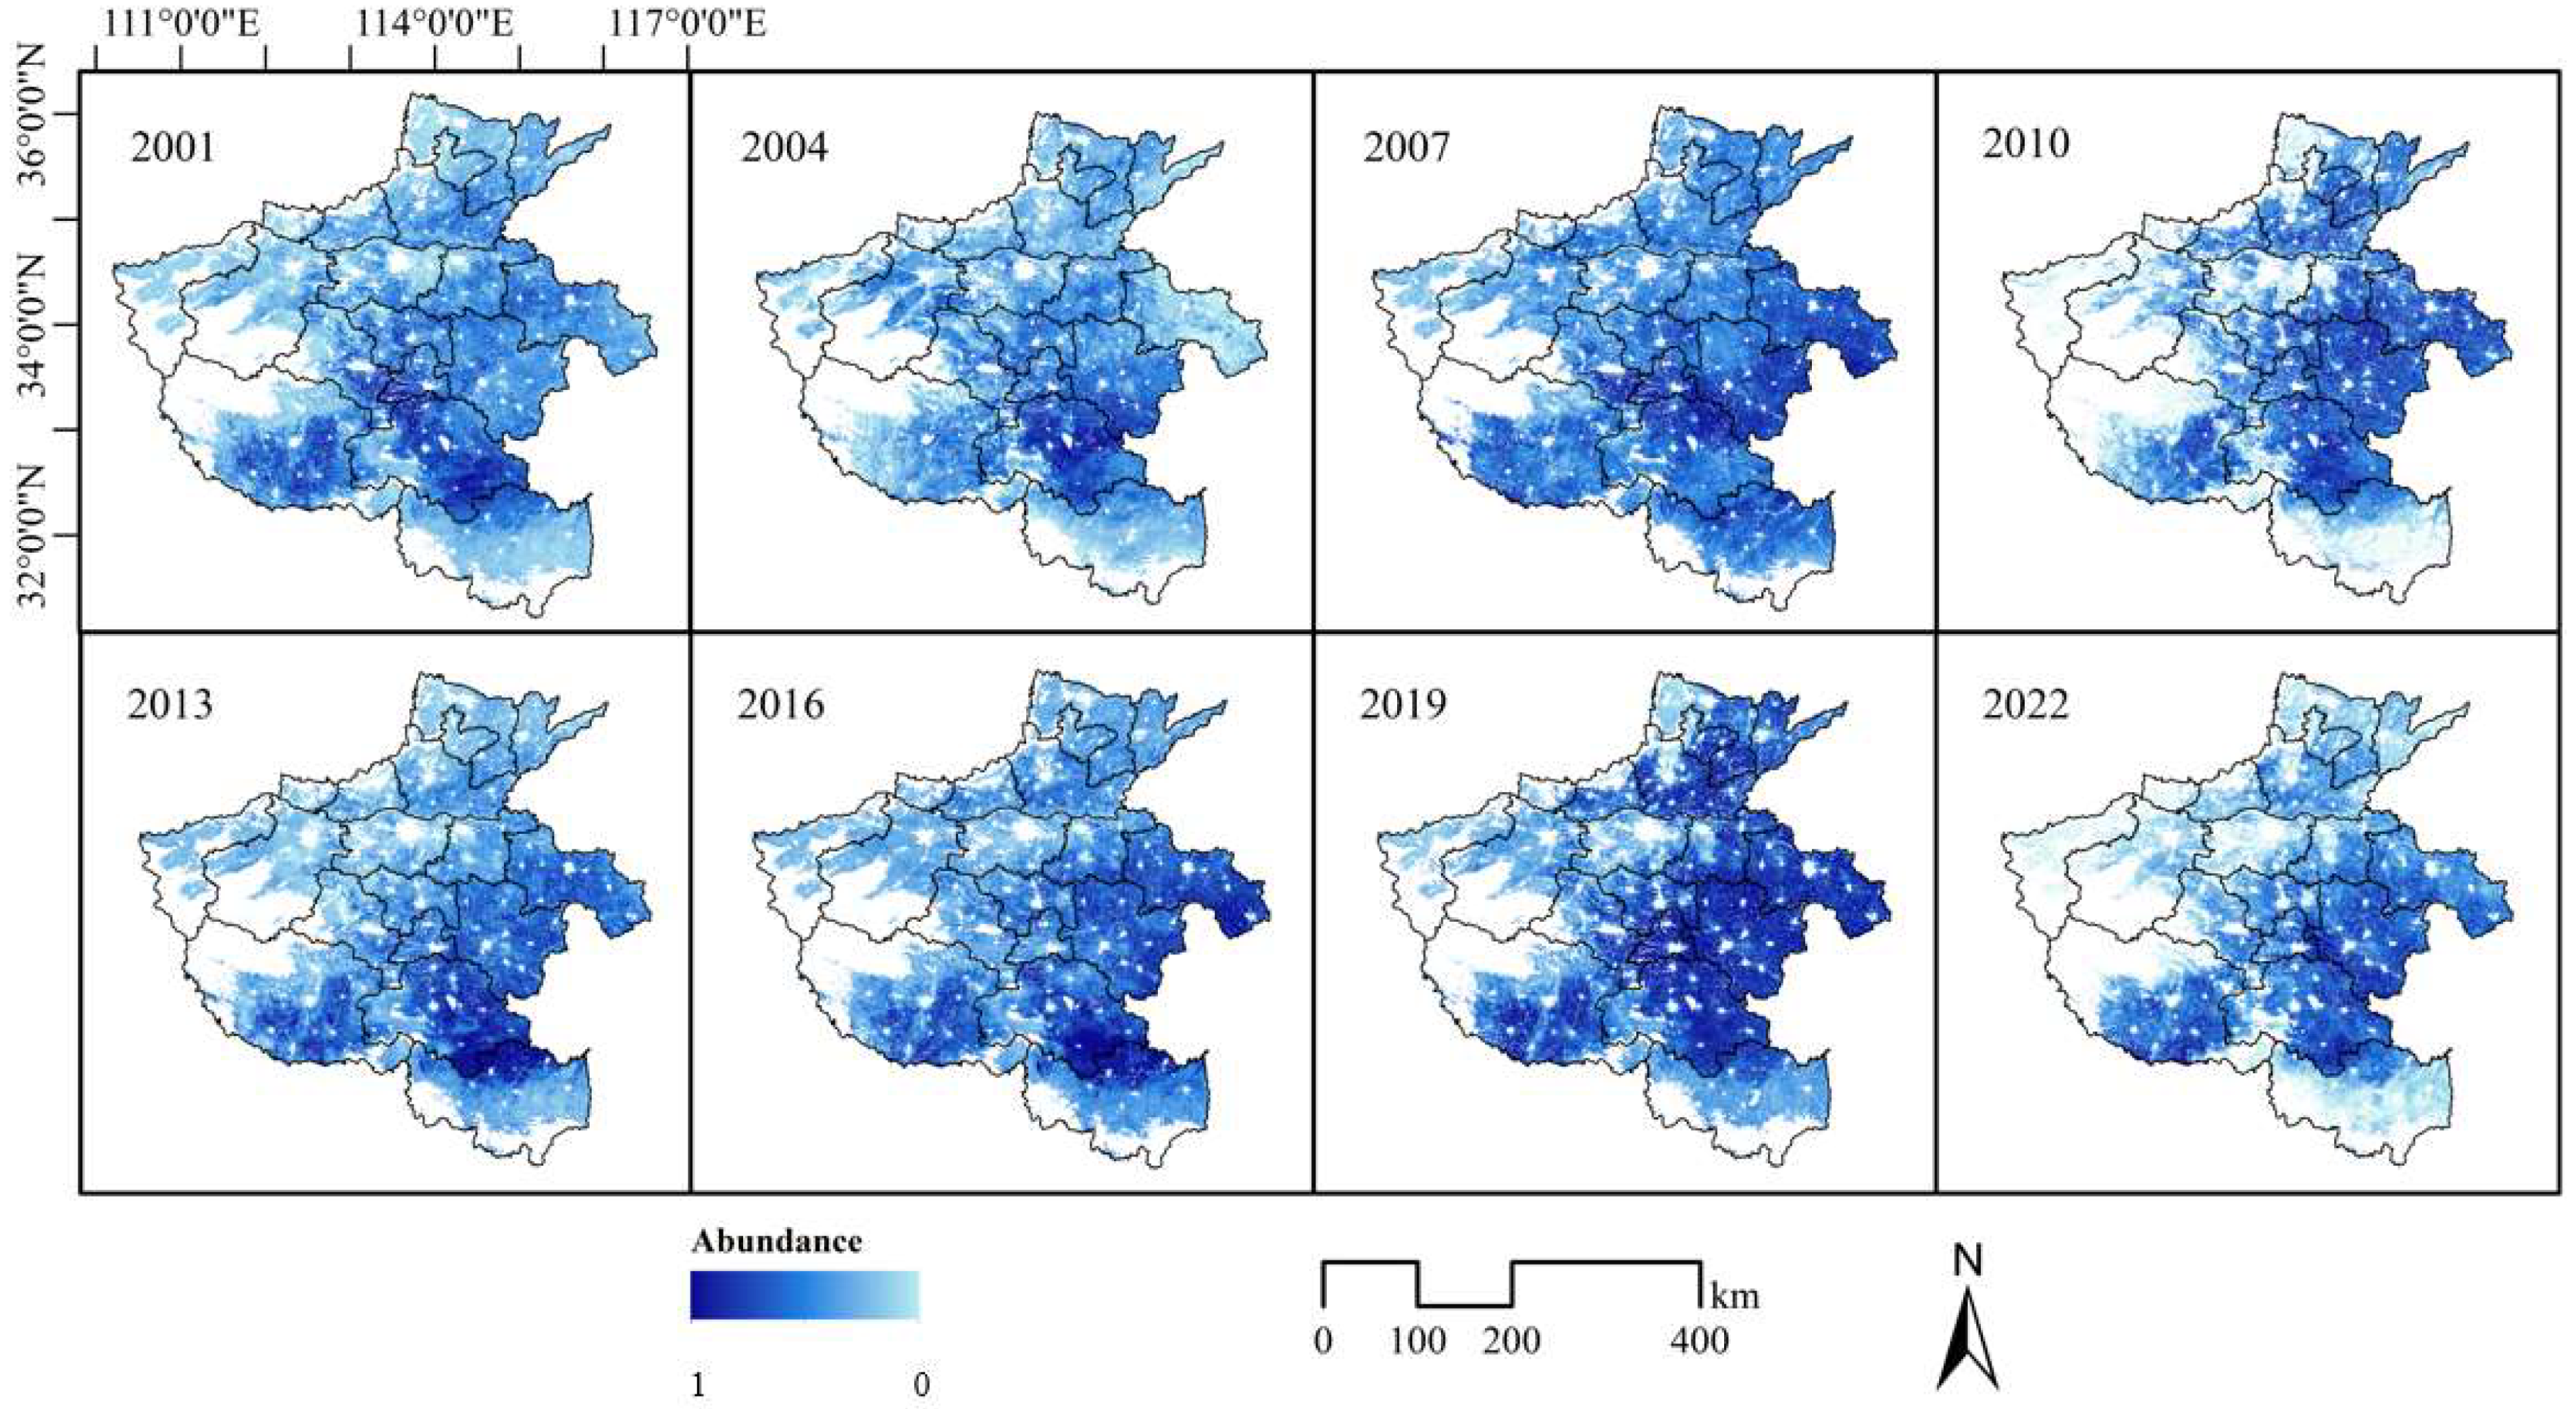
Figure 5 and Figure 6 show the spatial distribution of abundance values for winter wheat–summer maize and for winter wheat–small oilseeds, respectively. Winter wheat is the main crop in Henan Province during the winter, while corn is the primary crop during the summer. The spatial distribution of winter wheat–summer corn covers all prefecture-level cities in Henan. The spatial distribution of this cropping pattern has remained largely stable from 2001 to 2022, underscoring the predominant and consistent role of the winter wheat–summer maize rotation in Henan’s agricultural landscape. Small oilseeds, such as soybeans and peanuts, are also major summer crops in Henan, and their planting pattern rotates with winter wheat due to differences in planting phenology. The winter wheat–small oilseeds planting areas are mainly concentrated in the central and eastern plains of the province, including prefecture-level cities like Zhumadian, Nanyang, and Shangqiu. In terms of planting areas, the acreage of corn and small oilseeds in the summer is generally complementary, as crop prices can influence farmers’ planting preferences. Between 2001 and 2013, the cultivated area for winter wheat and small oilseed crops experienced a substantial expansion, particularly in the eastern plains region. From 2016 to 2022, the spatial distribution of these crops has tended to stabilize, with high-density cultivation areas persisting in the central and eastern plains. This suggests that the land use within this agricultural system has undergone significant optimization.
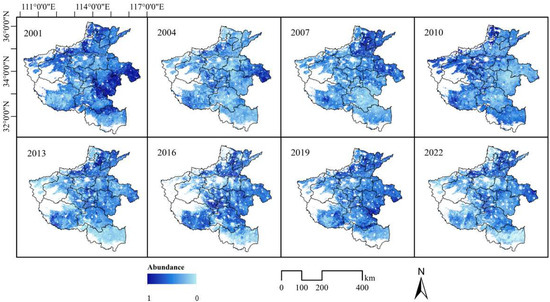
Figure 5.
The winter wheat–summer maize abundance distribution in Henan Province over multiple years.

Figure 6.
The winter wheat–small oilseeds abundance distribution in Henan Province over multiple years.
3.2. Centroid Migration for Different Crop Planting Structures
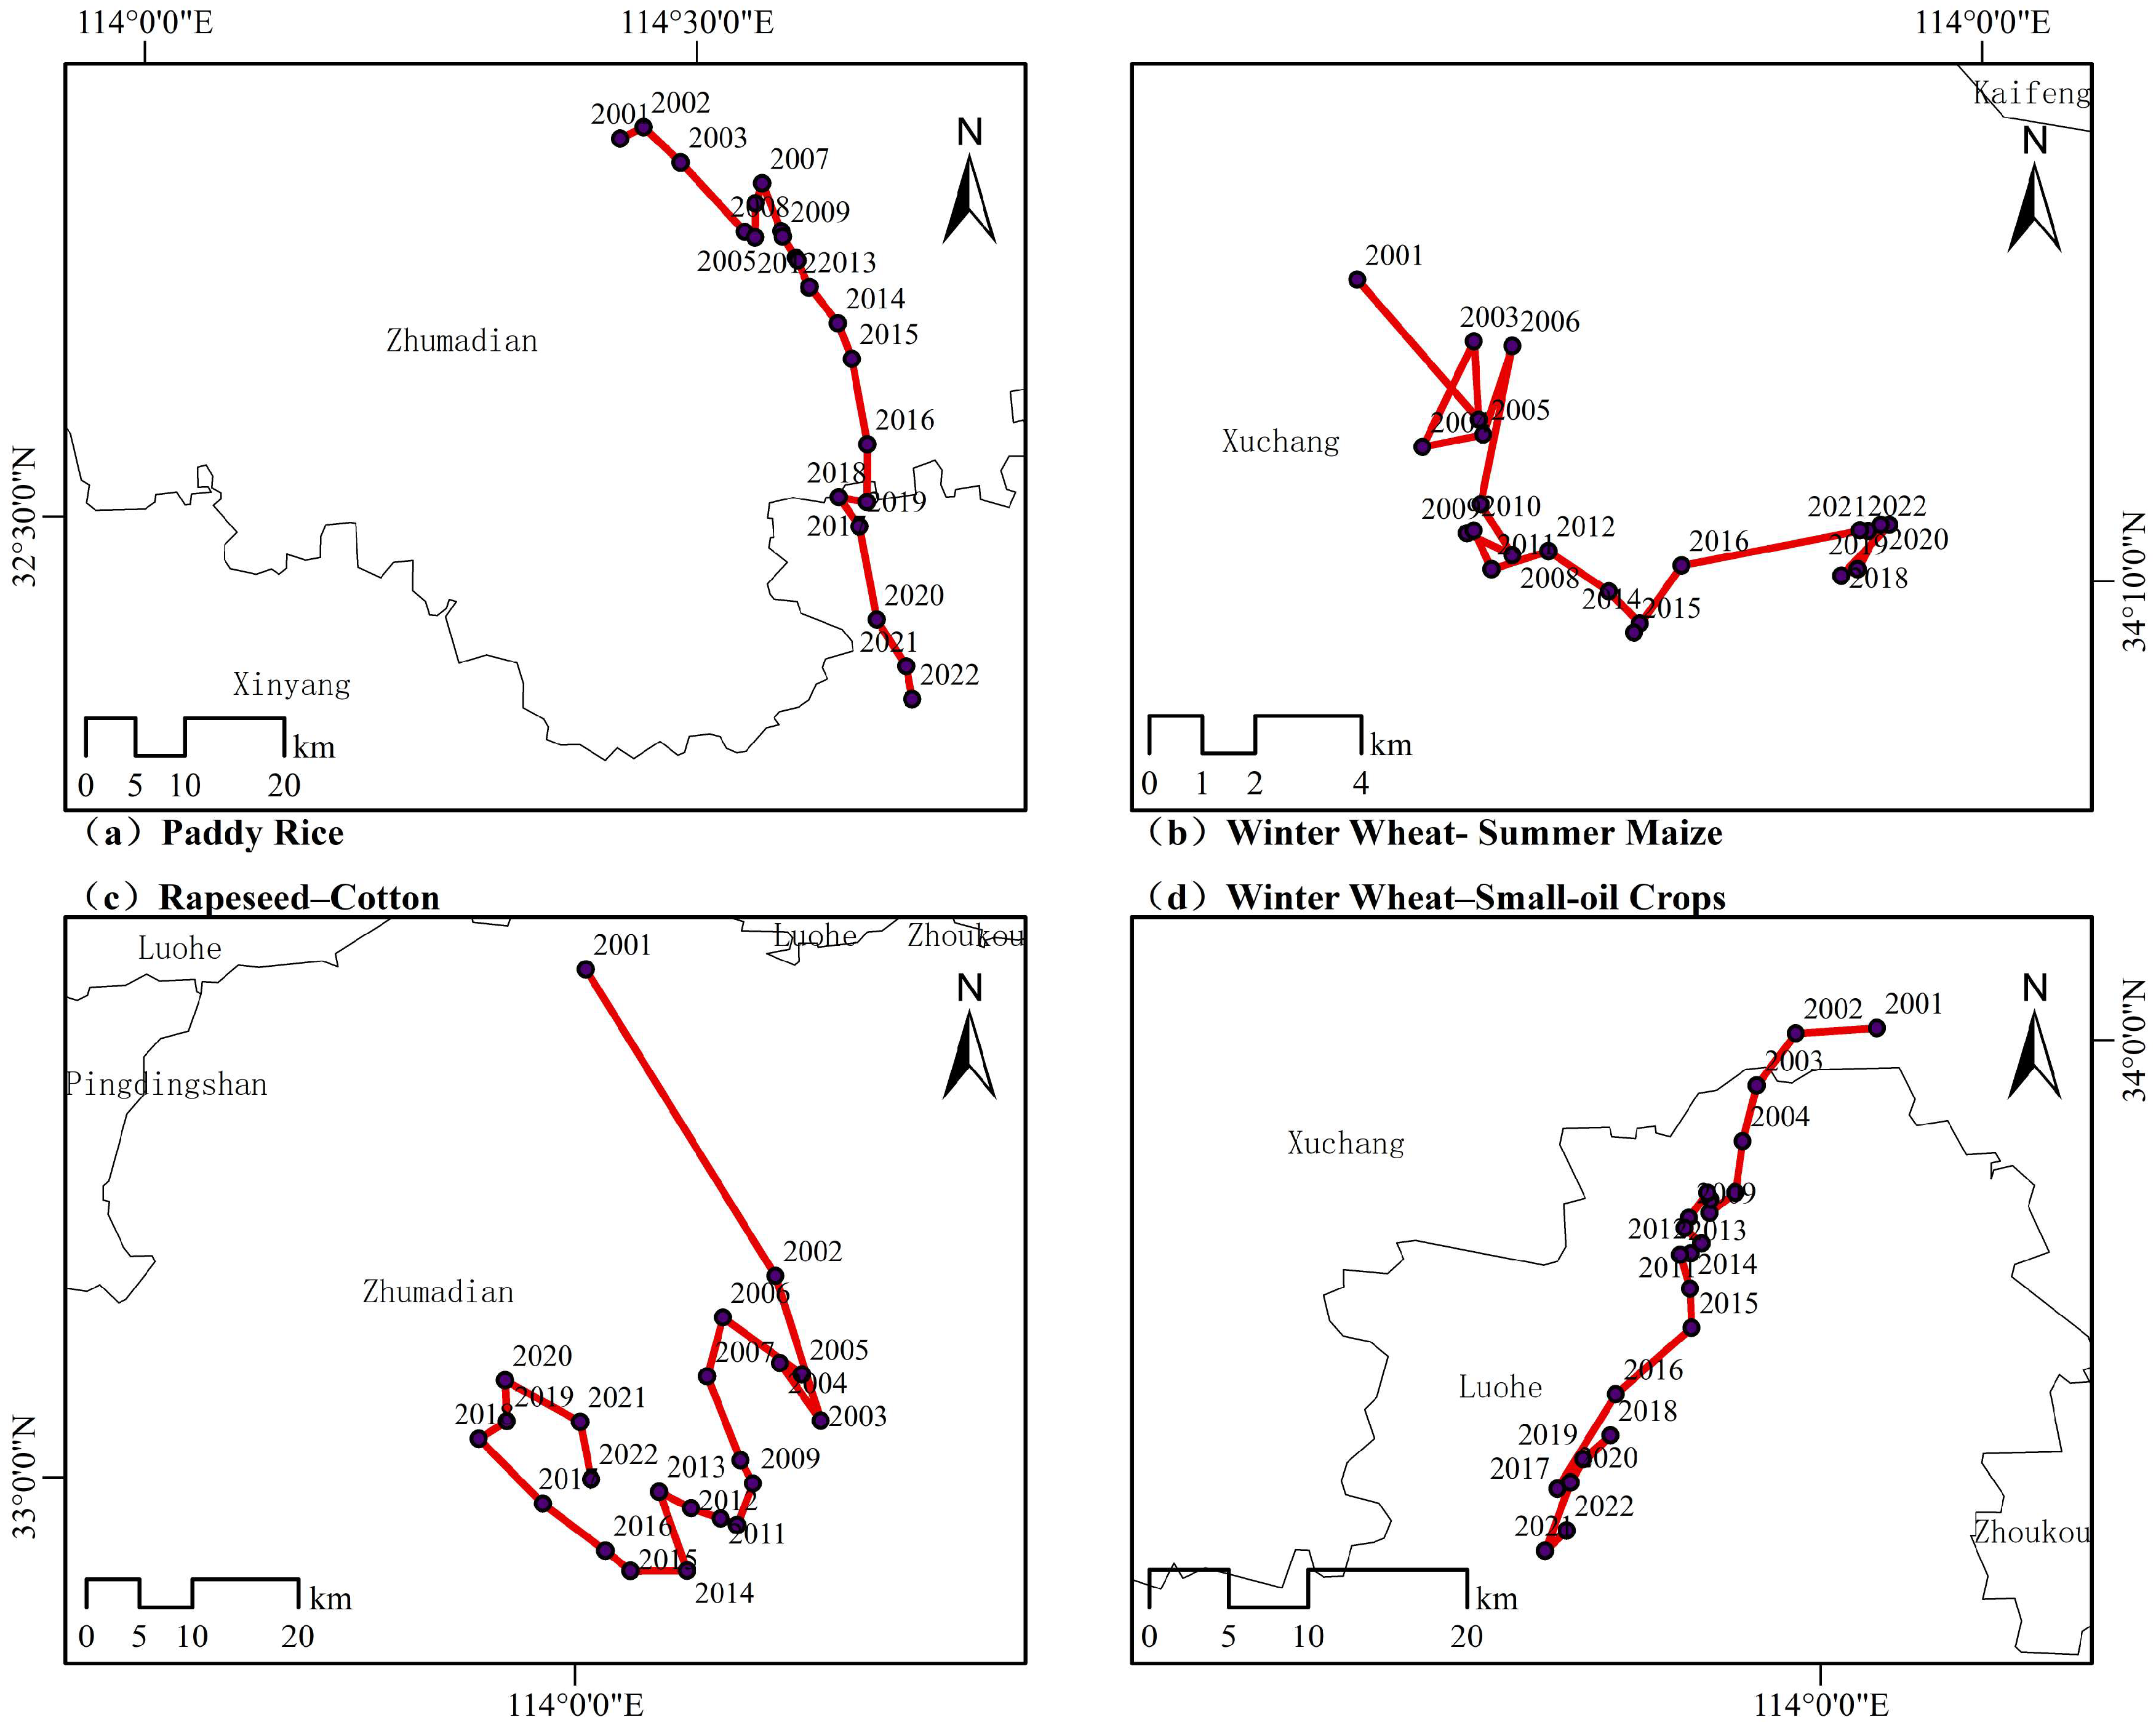
Analyzing the centroids and migration patterns of different crop planting structures provides insight into the planting habits and main grain areas within the study region. The migration trajectories can elucidate the relationship between crop planting structures and driving factors. In this study, the cumulative abundance values of different crop planting structures were calculated at the prefecture-level city scale in Henan Province, serving as the weights for the centroid. The centroids and migration patterns of different cropping structures were then determined based on the weights. Figure 7 shows the centroids and their migration trajectories for various crop planting structures from 2001 to 2022.
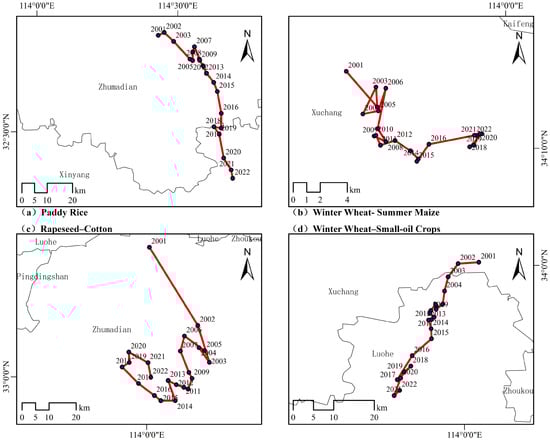
Figure 7.
Centroid migration for different planting structures from 2001 to 2022.
As shown in Figure 7, the centroids of the four crop planting structures are either within or near cities with larger planting areas. The centroid of paddy rice is located in the southeast of Zhumadian and close to Xinyang, with the geographic centroid of 114.43 E/32.84 N in 2001. Starting in 2017, the centroid (114.65 E/32.51 N) started to migrate to Xinyang, reflecting its status as a major rice-growing city. The migration trajectory of the paddy rice centroid continues to move towards the southeast of Henan Province, indicating a reduction in rice planting in other prefecture-level cities while Xinyang continued to increase. In 2001, the centroid of winter wheat and summer maize was located within Xuchang (113.89 E/34.22 N), which is also near the center of Henan Province. This suggests that winter wheat and summer maize are widely planted across various prefecture-level cities in Henan Province. However, the centroid is slightly eastward due to the mountainous terrain in the west and the predominance of rice planting in the east. Although the migration trajectory lacks regularity, it shows a trend of shifting towards the eastern part of Henan Province, driven by the increasing planting area of winter wheat and summer maize in that region year by year. The centroid (114.01 E/33.43 N) of the rapeseed and cotton crop planting structure was located in Zhumadian in 2001 and began to migrate towards the southwest in a spiral pattern. This migration indicates a lower proportion of rapeseed and cotton planting compared to rice in Xinyang, resulting in a more northerly centroid compared to rice. The centroid of the winter wheat and small oil crop structure was located in Luohe in 2001 (114.03 E/34.00 N) and had been continuously shifting southwards. This shift is attributed to Zhumadian and Nanyang being major production areas for small oilseed crops such as peanuts and soybeans. The centroid migration shows a trend of transferring to specific agricultural areas in Henan Province, which may mean that the integration or intensification of crop planting structure in Henan Province becomes higher.
3.3. Evolution Rrend for Different Crop Planting Structures
Based on the crop planting structure information of several major grain crops, the cropping index was calculated. The cropping index calculation assigns weights to single-season and double-season crop categories based on their abundance. Using the Sen’s slope estimator combined with the M-K test method and the trend analysis criteria in Table 1, a trend analysis and significance of the cropping index for Henan Province from 2001 to 2022 was conducted.
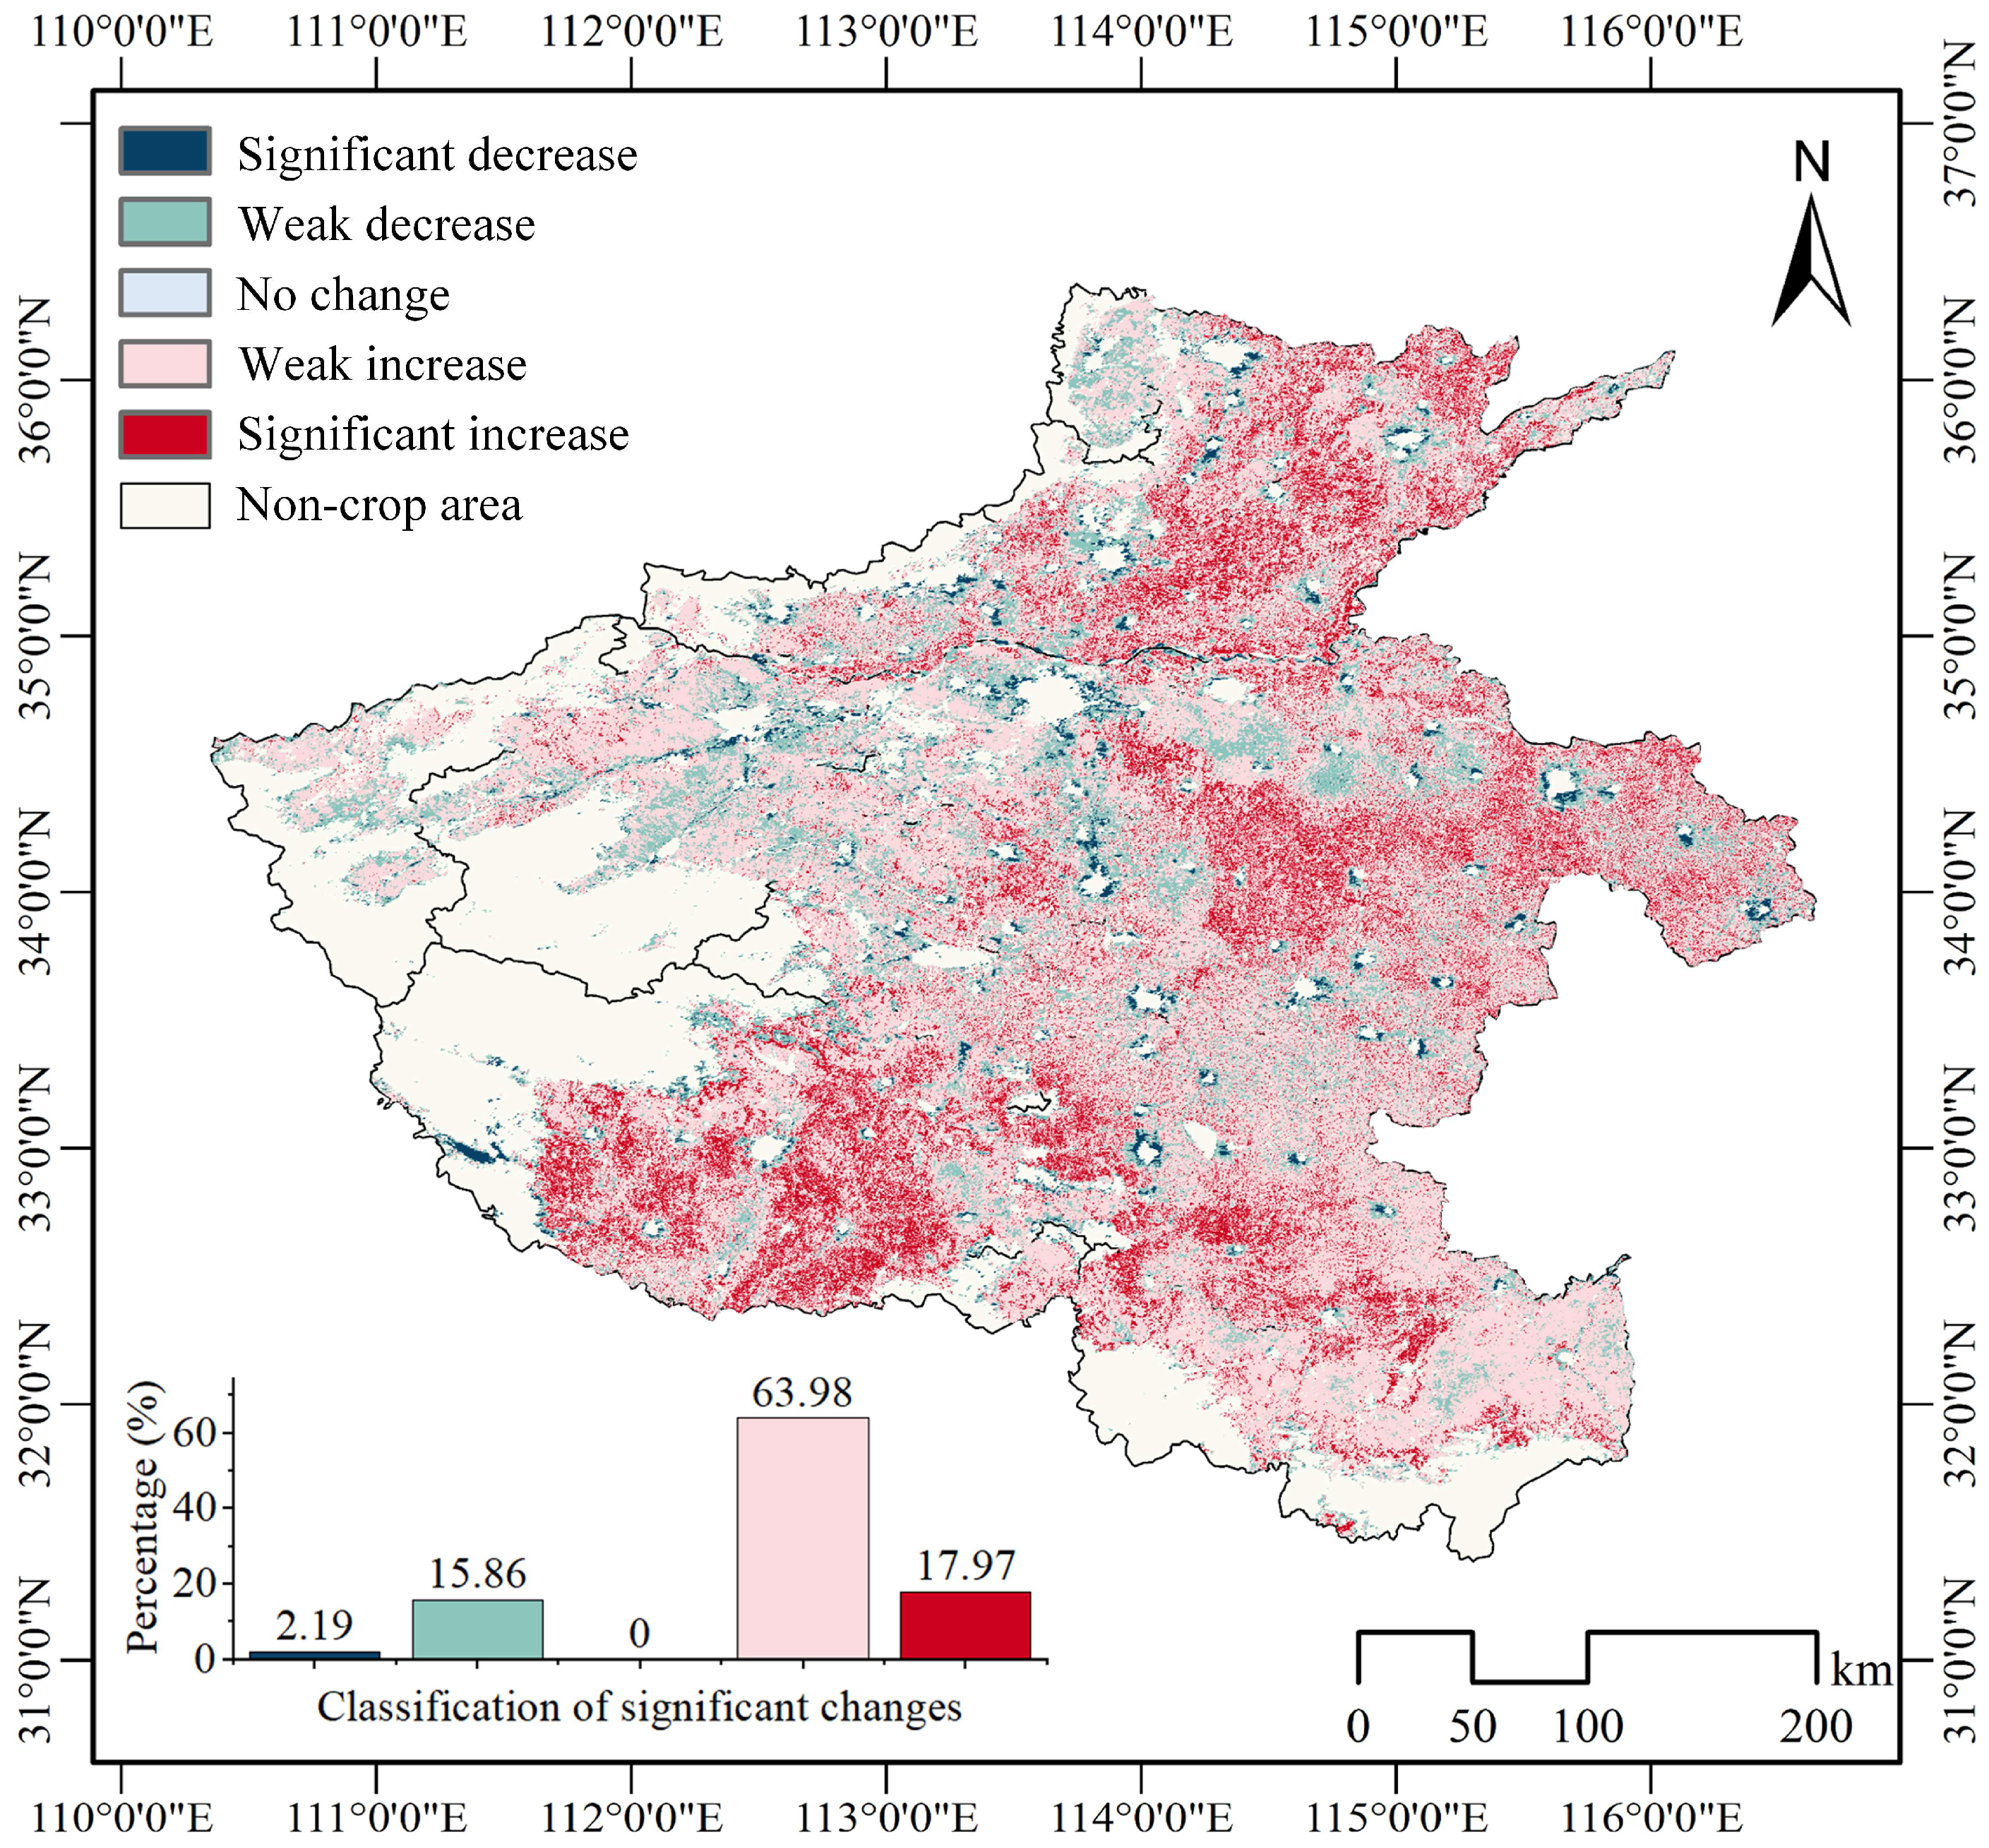
Figure 8 shows the trend changes and distribution of the cropping index in Henan Province over the 22 years starting from 2001. The overall trend shows an increase, with the areas of the cropping index increasing significantly and outnumbering those with a decrease. Specifically, areas with a weak increase account for nearly 64%, while those with a weak decrease make up 14.9%, and regions with no change are minimal: numerically close to 0%. The regions with a decrease are mainly distributed around urban areas and some mountainous regions in Henan Province. This is because each year’s data are masked according to cultivated land classification data, and relevant endmembers are added during the unmixing process to prevent interference from other land cover types. The results indicate that cultivated land around cities decreases with urbanization, leading to a significant decrease in the cropping index, with a significant decrease at 2.19%. Additionally, the high proportion of weak increases suggests that farmers’ planting intentions and habits have remained largely unchanged. Henan Province’s cropping structure continues to be dominated by single-season rice and double-season winter wheat and summer crops in rotation.
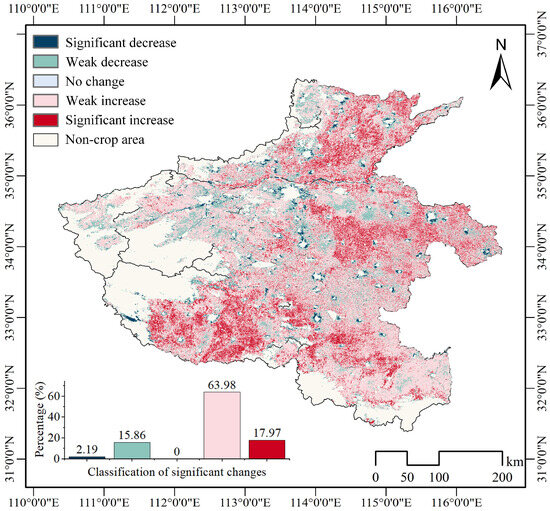
Figure 8.
Spatial distributions in trend and significance of the cropping index from 2001 to 2022.
3.4. Analysis of Crop Planting Structure Driving Factors
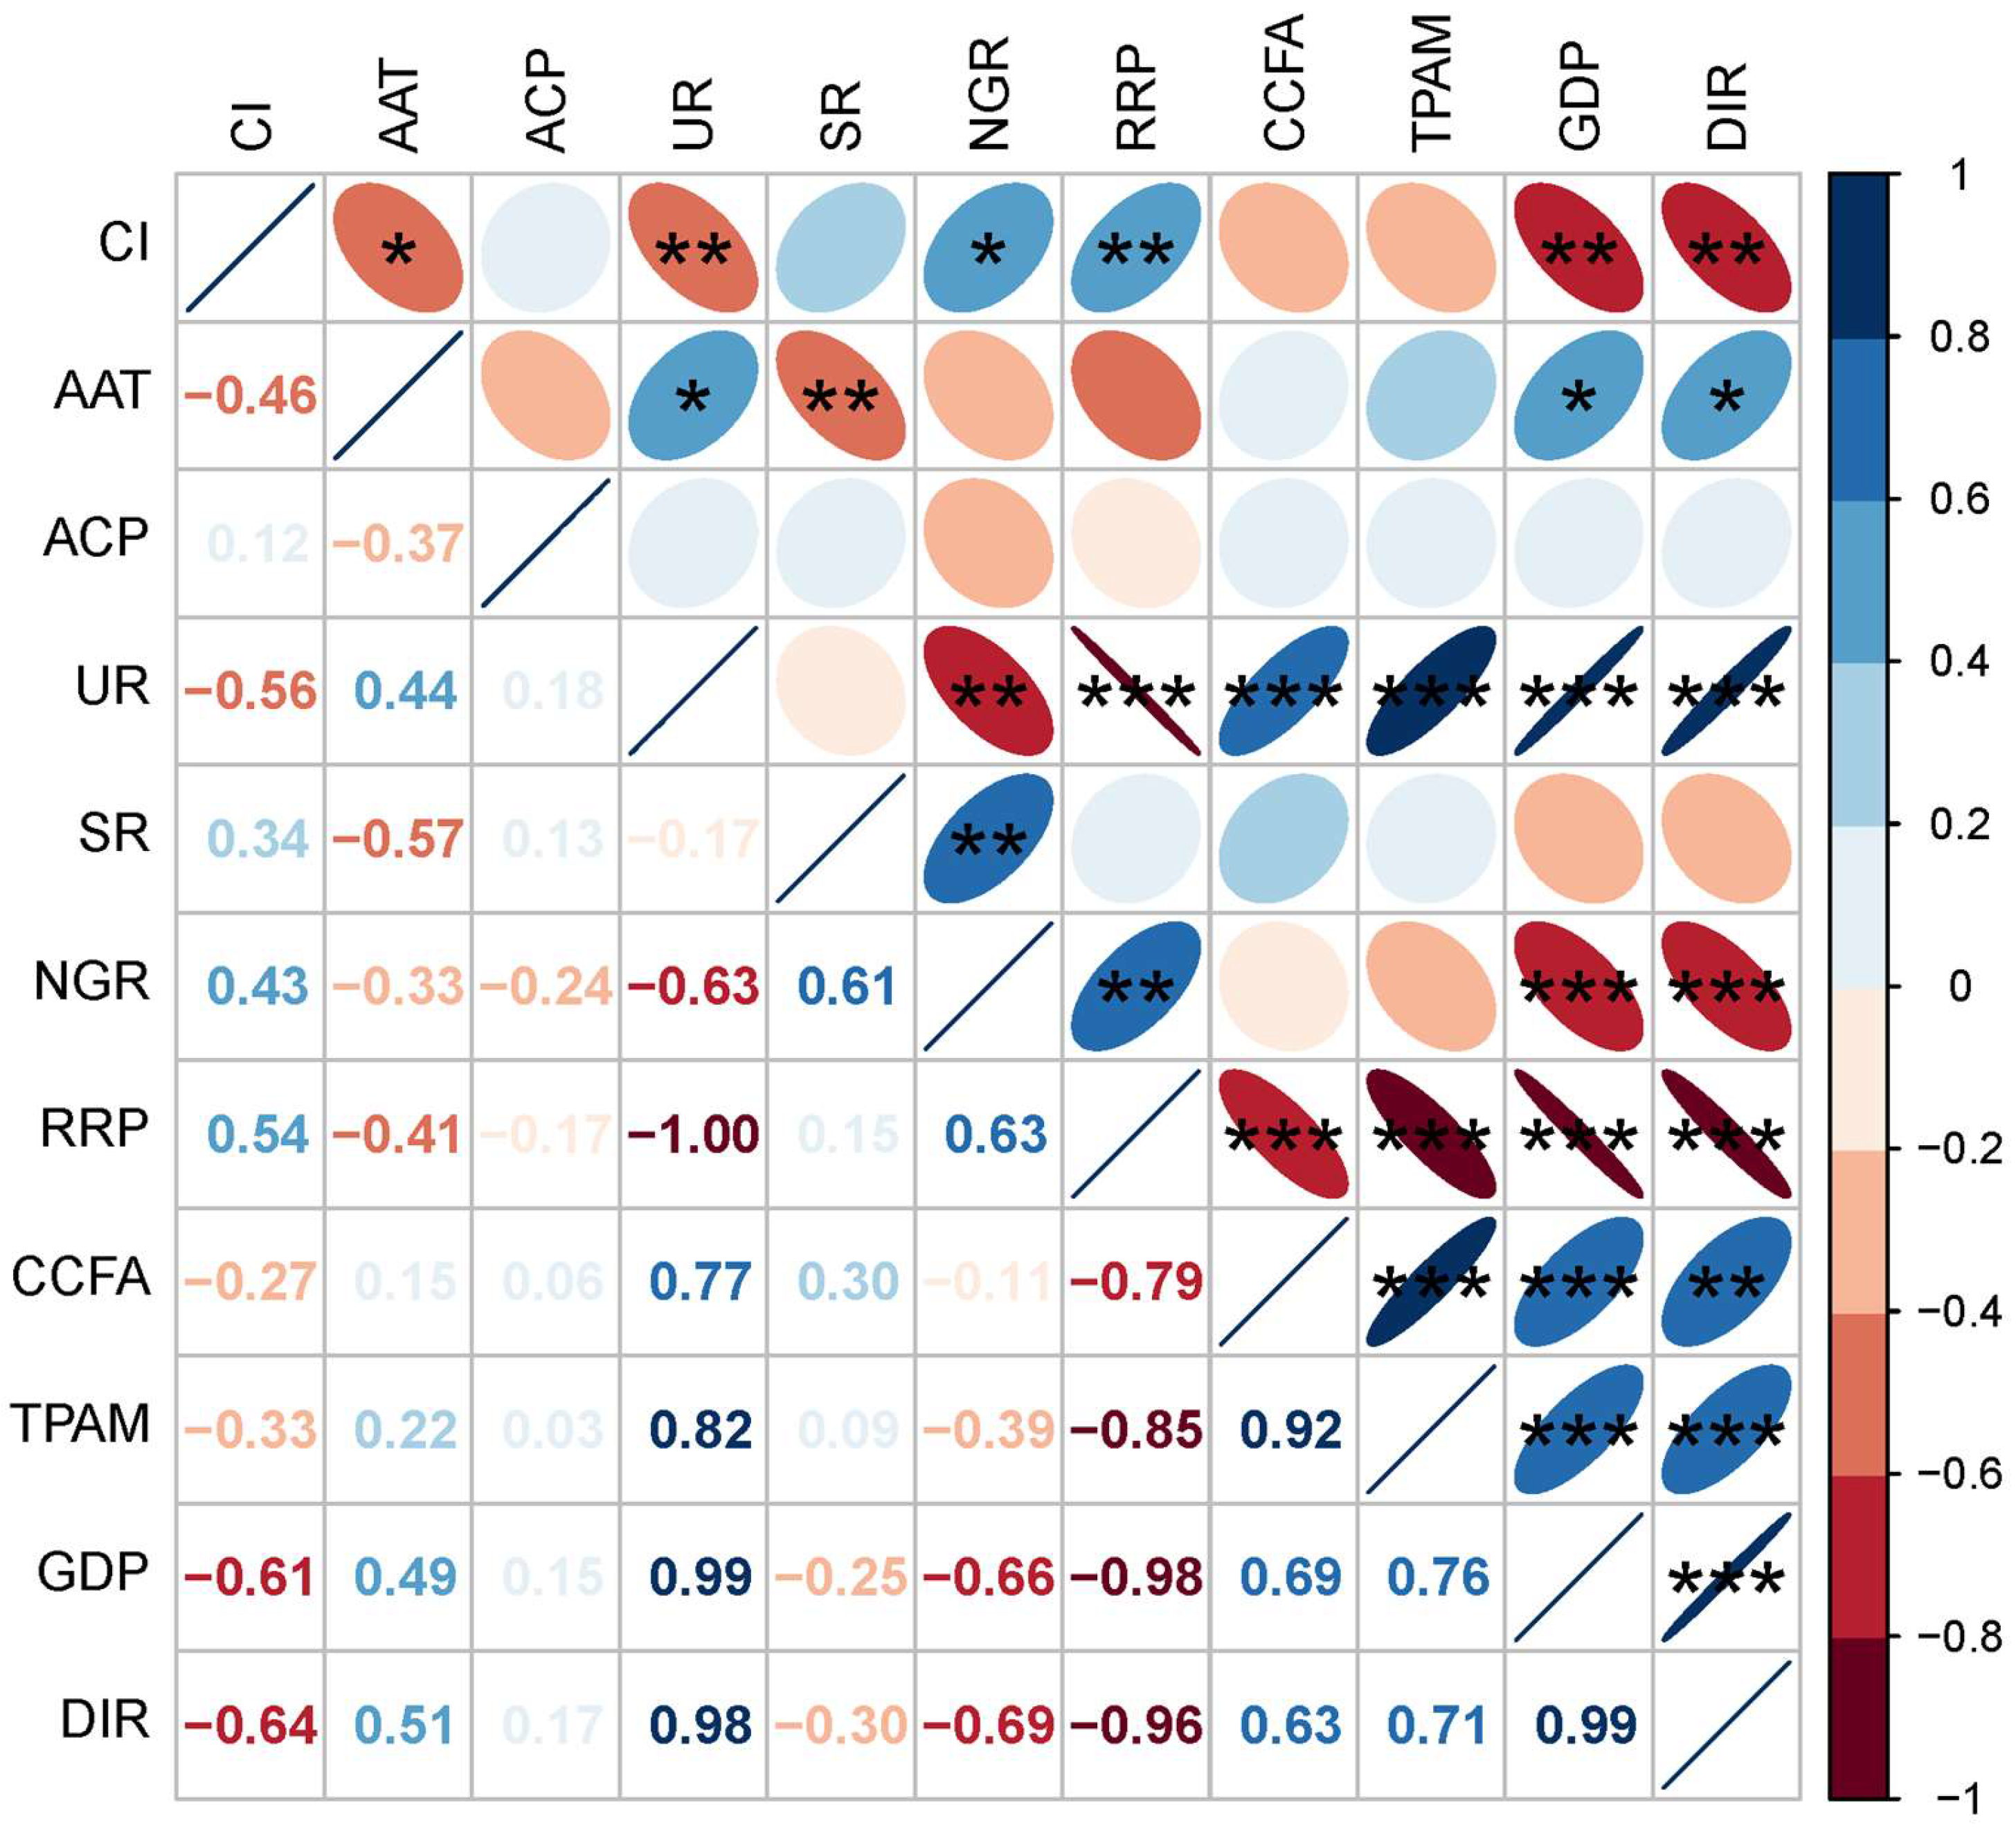
Pearson’s correlation coefficient was conducted between the cropping index and 10 factors, as shown in Figure 9. Among the natural factors, the cultivation index (CI) showed different correlations with annual average temperature (AAT) and annual cumulative precipitation (ACP). Among them, the correlation of CI with annual average temperature showed a negative correlation (−0.46), while it showed a weak positive correlation (0.12) with annual cumulative precipitation. Meanwhile, the mean annual temperature passed a very high level of significance test.
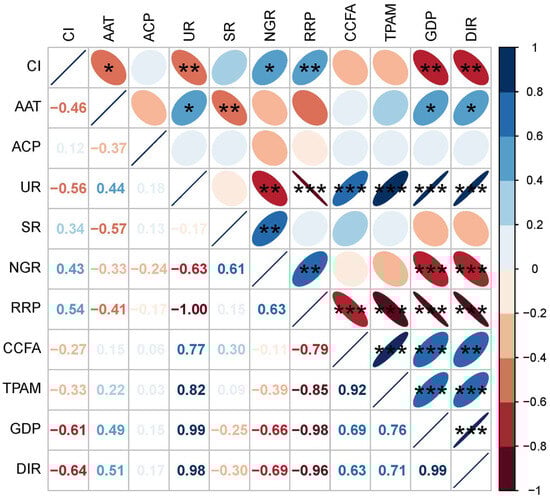
Figure 9.
Pearson’s correlation coefficient of cropping index and 10 driving factors. The color and ellipses of the elliptical glyphs denote the magnitude and the direction of the relationship. The shorter the short axis, the closer the correlation coefficient is to 1 and vice versa. The bluer the color is, the stronger the positive correlation. The asterisk indicates the significance level of the correlation (* p < 0.05; ** p < 0.01; *** p < 0.001). CI, cropping index; AAT, annual average temperature; ACP, annual cumulative precipitation; UR, urbanization rate; SR, sex ratio; NGR, natural growth rate; RRP, resident rural population; CCF, consumption of chemical fertilizers; TPAM, total power of agricultural machinery; GDP, gross domestic product; DIR, disposable income of rural residents.
The social factors include demographic and economic factors, where the sex ratio (SR), natural growth rate (NGR), and resident rural population (RRP) showed positive correlations with the replanting index, while those that showed negative correlations were urbanization rate (UR), gross domestic product (GDP), and disposable rural income (DIR). The drivers that are positively correlated are all closely related to the main rural labor force because the main population in agricultural production is adult males. The drivers related to the urbanization rate, on the other hand, show a negative correlation, and along with the increase in the urbanization rate, the replanting index shows a decreasing trend, which is in line with the real situation. In addition, the natural growth rate, resident rural population, gross product, and rural and disposable income reached a very high significance test level.
Agricultural production factors, including consumption of chemical fertilizers (CCFs) and total power of agricultural machinery (TPAM), showed moderate negative correlations, with correlation coefficients of −0.27 and −0.33, respectively, and both of them exhibited moderate test levels. The results indicated that the reduction in total mechanized power and agricultural fertilizer use was accompanied by an increase in the replanting index, indicating that farmers had to improve their personal income through their labor.
4. Discussion
4.1. Evolution Trend Test and Driver Analysis at the Sub-Pixel Scale
Trend analysis and driver analysis at the sub-pixel scale crop planting structure are the main highlights of this study. Firstly, compared to the narrow swath and low temporal resolution of high spatial resolution images and the severe mixed-pixel problem of low-spatial-resolution images, MODIS balances the spatial and temporal resolution well, making it widely used for large-area crop planting structure extraction [36]. Secondly, mixed pixels are prevalent in remotely sensed imagery, affecting the accuracy of crop planting structure extraction [37]. The overall accuracy of MODIS mixed-pixel decomposition methods using a linear mixture model exceeds 85%, which is higher than that achieved by the MODIS decision tree method [28]. Additionally, China’s agricultural model is predominantly smallholder family farming characterized by a small scale, complex cropping structures, and high subjectivity in planting decisions [38,39]. This increases the difficulty of extracting cropping structures. Therefore, using a mixed-pixel decomposition method enables the simultaneous extraction of crop structure information over large areas. Furthermore, the differences and separability in the NDVI time series of different crops help to improve the accuracy of crop structure extraction [40,41].
4.2. Driving Factors’ Selection and Changes in Crop Planting Structure
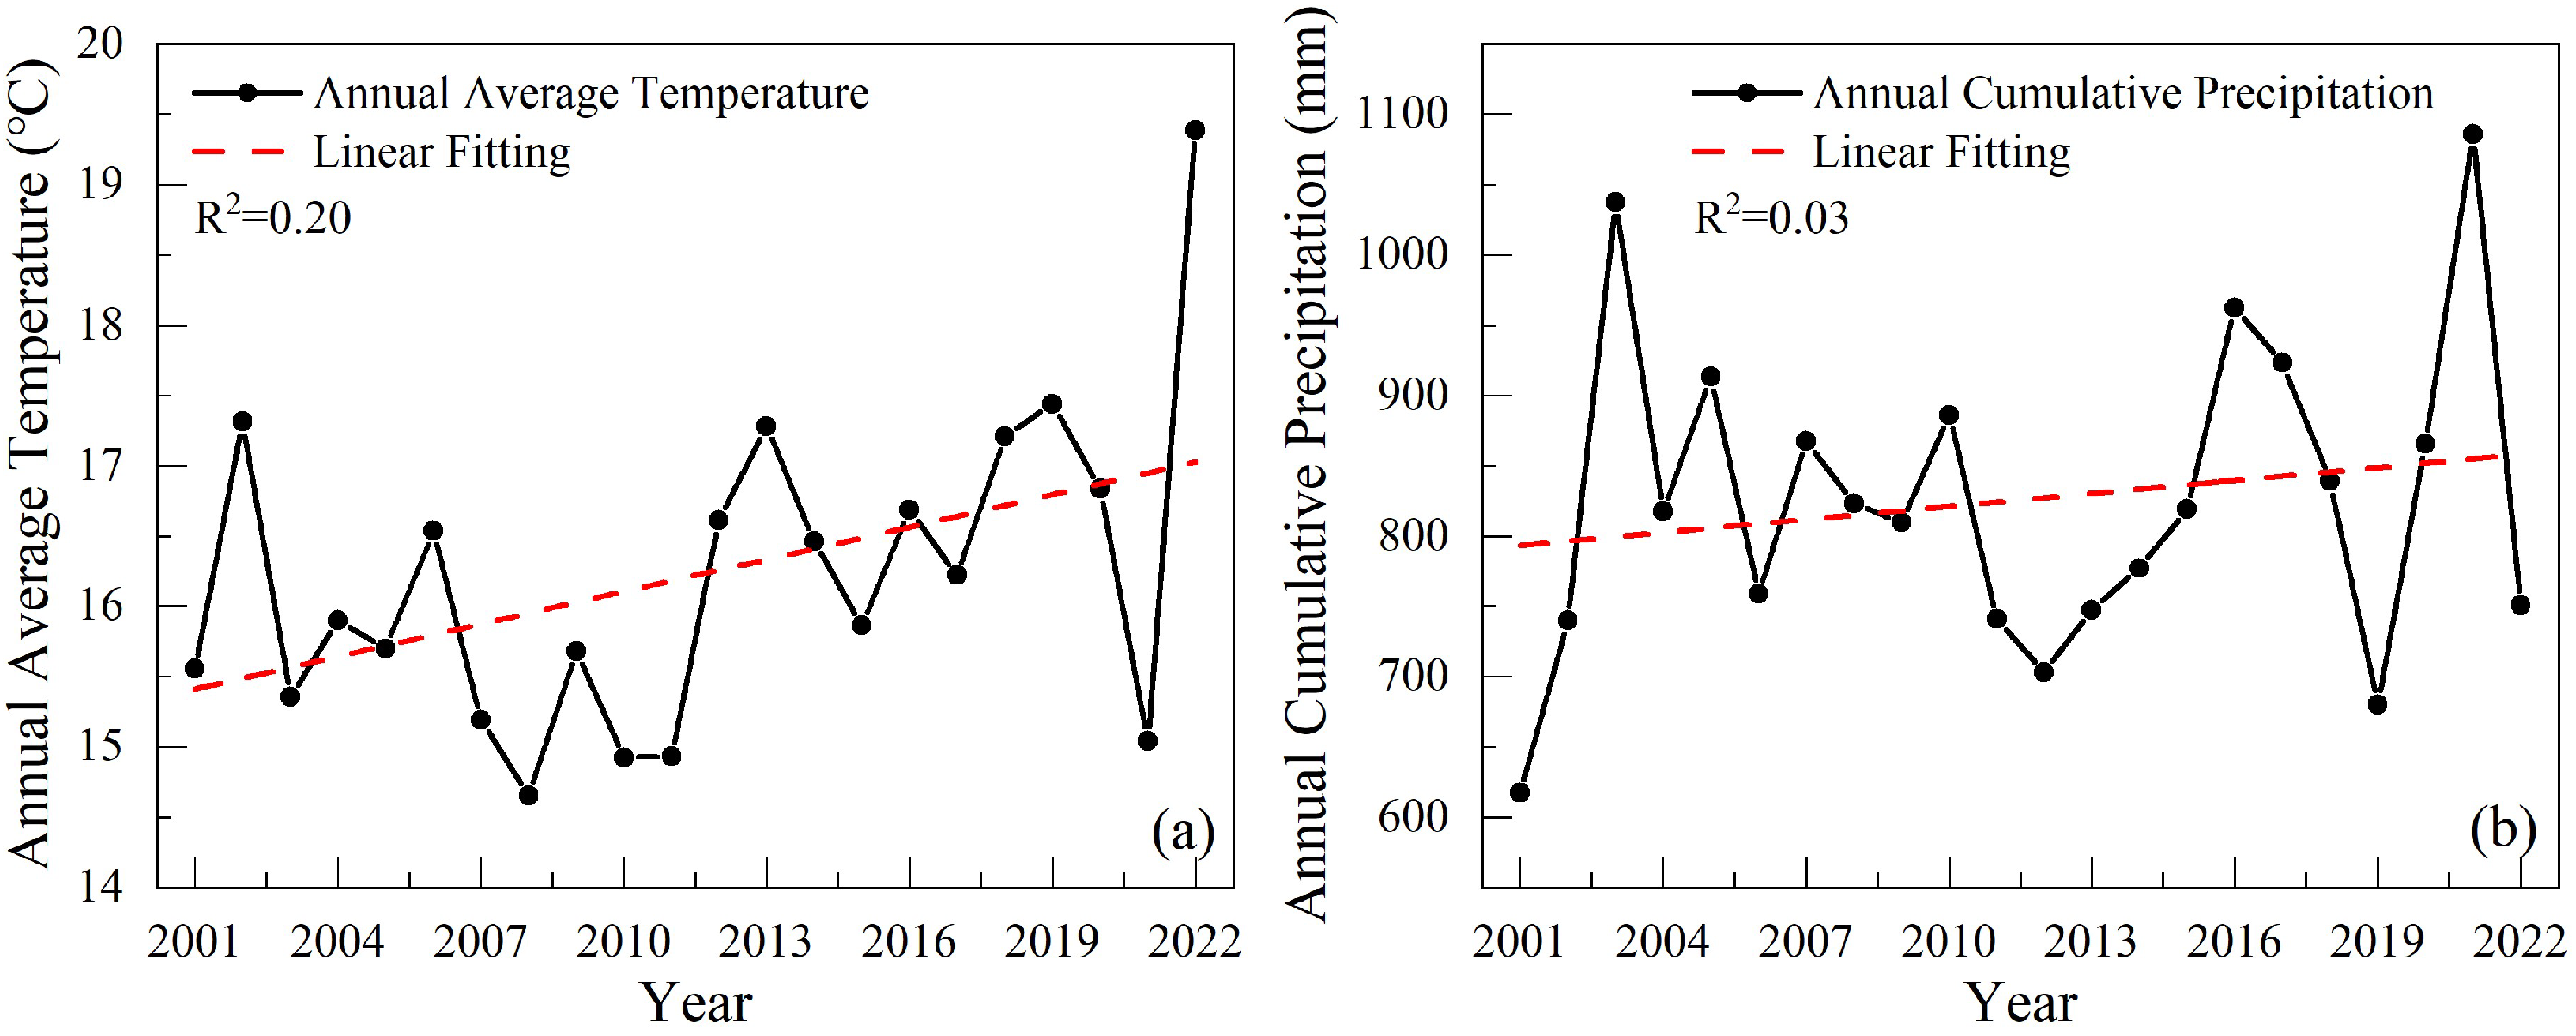
Several factors influence crop planting patterns, including natural resources, meteorological conditions, farming practices, and socio-economic factors [42,43]. Figure 10 shows the natural driving factors in Henan Province over 22 years, including the annual mean temperature and annual cumulative precipitation. These data were primarily derived from remotely sensed imagery and were subjected to linear fitting analysis. Due to varying meteorological conditions across different years, Henan Province’s annual mean temperature and annual cumulative precipitation data exhibit fluctuations. The annual mean temperature ranges between 14 °C and 20 °C. Specifically, the lowest annual mean temperature was 14.65 °C in 2008, while it exceeded 19 °C in 2022. The annual cumulative precipitation shows an upward trend with the linear fitting analysis, fluctuating between 600 mm and 1100 mm. The minimum and maximum precipitation values were recorded in 2001 and 2021, respectively. Studies have suggested that global warming impacts crop planting structure changes, constituting a new challenge for the agricultural sector [42].
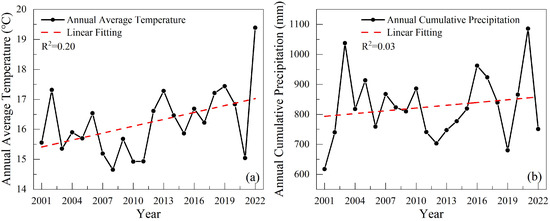
Figure 10.
Natural driving factors from 2001 to 2022. (a) Annual average temperature. (b) Annual cumulative precipitation.
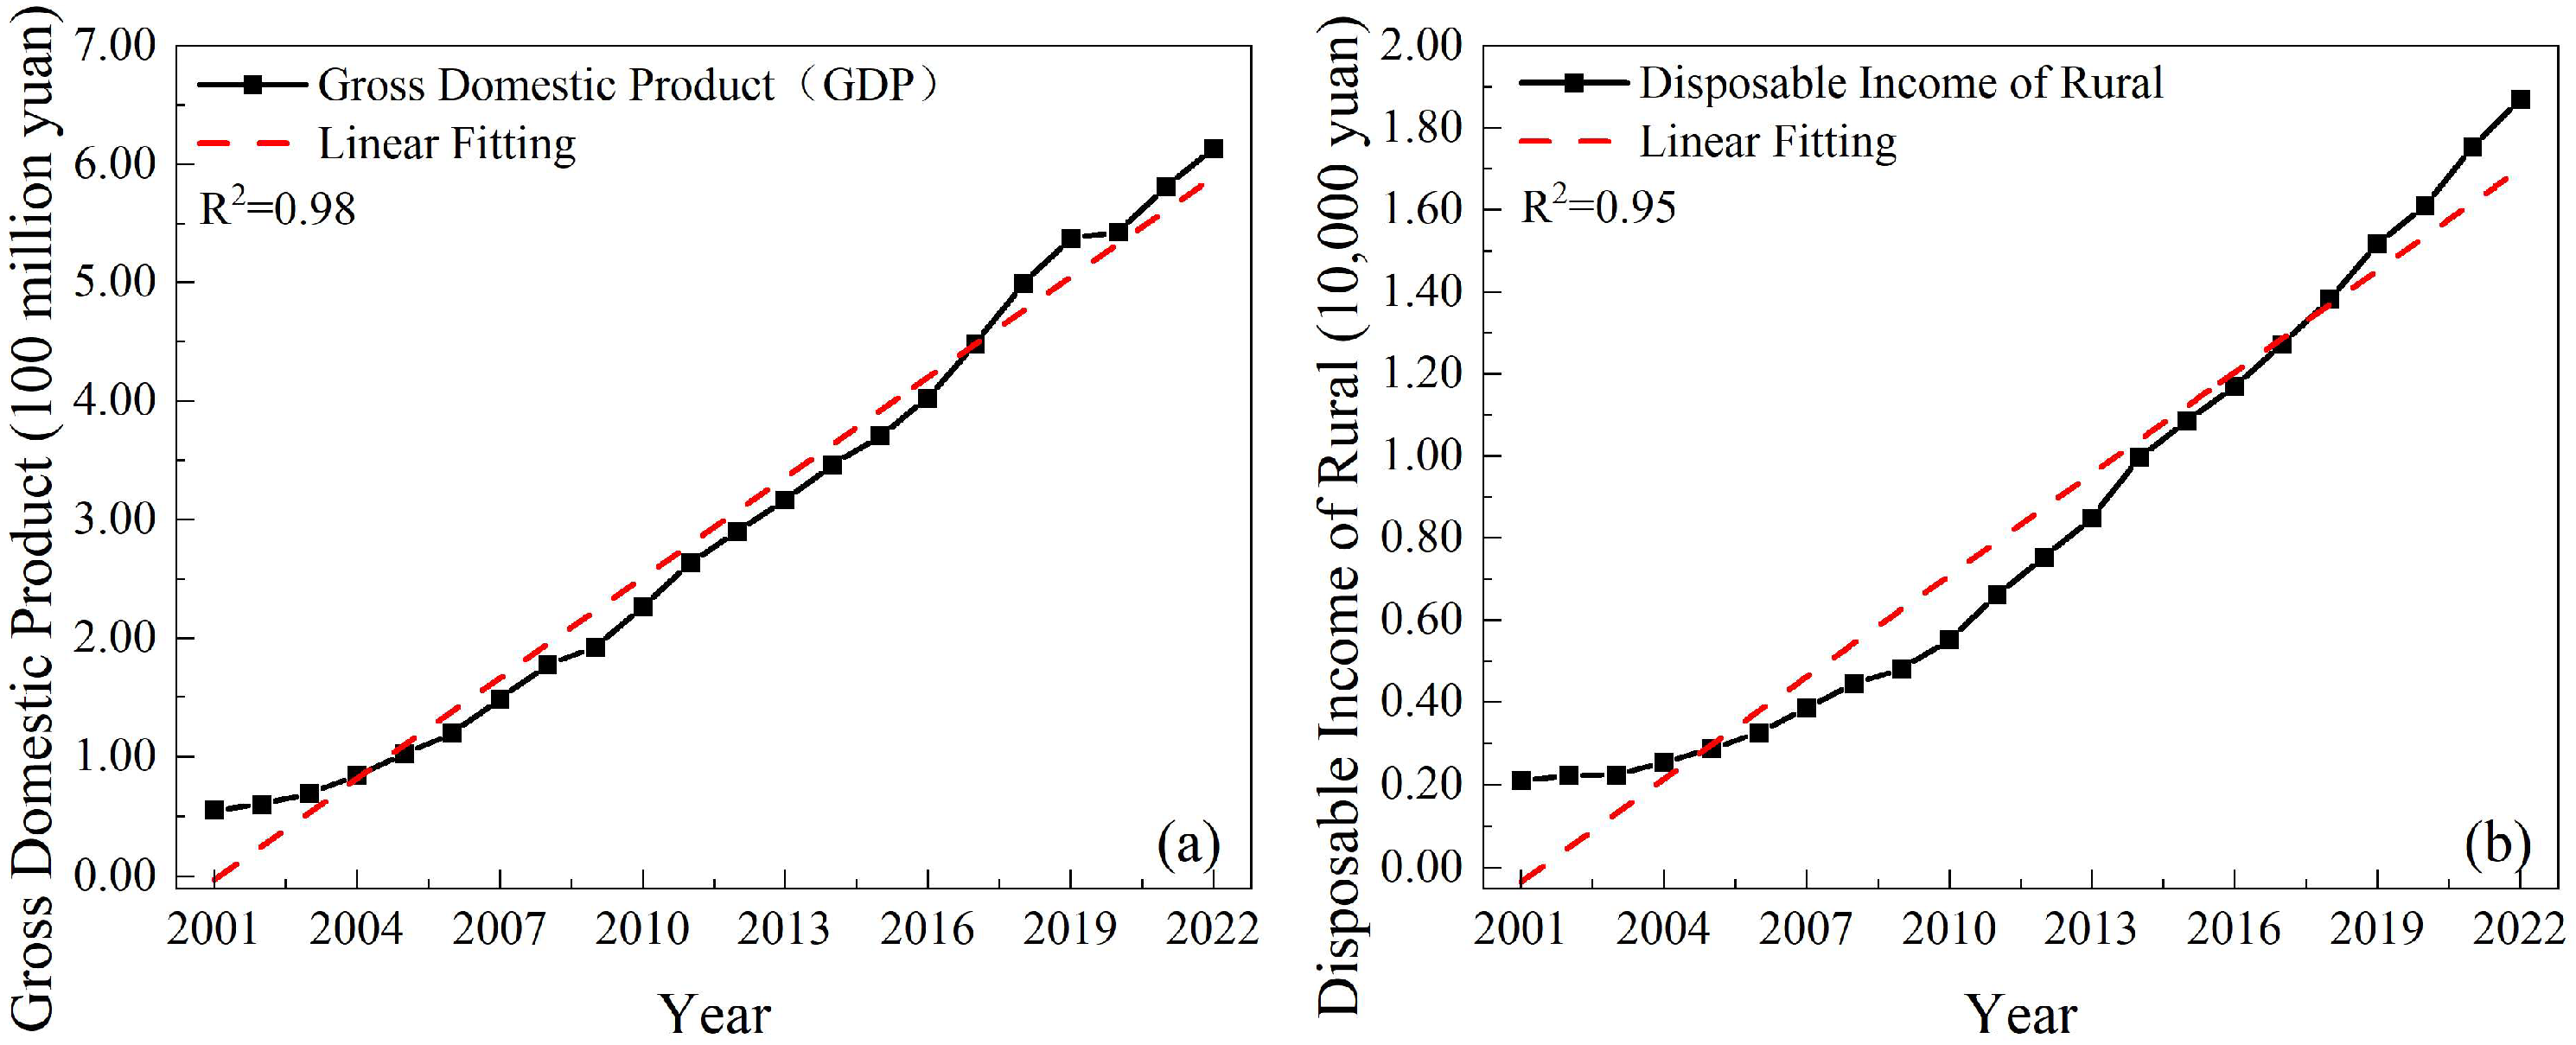
The level of regional economic development and farmers’ incomes can influence changes in the crop planting structure [12]. Figure 11 shows the economic driving factors. Both the gross domestic product and rural disposable income show a significant upward trend. The gross domestic product of Henan Province increased from CNY 553.301 billion to CNY 6134.505 billion, more than tenfold, from 2001 to 2022, indicating rapid economic development. Rural disposable income also increased rapidly, rising from an average of CNY 2000 per capita to CNY 18,697 over 22 years, nearly a tenfold increase in income.
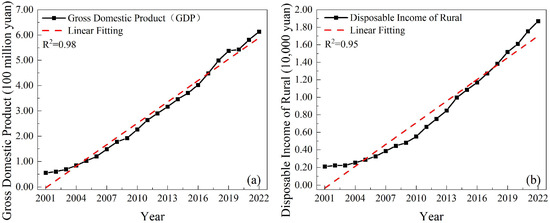
Figure 11.
Economic driving factors from 2001 to 2022. (a) Gross domestic product. (b) Disposable income of rural residents.
With the continuous advancement in urbanization, the continuous improvement in economic development levels, and the increase in the floating population, the permanent rural population has decreased year by year. Thus, population change is one of the drivers of crop planting structure [44]. Figure 12 shows population-related driving factors. With the rapid economic development of China and the influence of social and governmental policies, the results of the linear fitting curves indicate that the urbanization rate in Henan Province has shown a significant upward trend, while the sex ratio and natural growth rate have generally shown a downward trend in the linear fitting. From 2001 to 2022, the urbanization rate increased from 24.43% to 57.07%, indicating a clear progression in urbanization. Due to the influence of social and cultural factors and agricultural production capacity, there is a gender imbalance in China, with the sex ratio indicating a slight male predominance in Henan Province; however, this trend is declining. Particularly in 2022, the gender ratio plummeted, with the sex ratio at 100.77 (female = 100). As birth rates decline, healthcare improves, and the population ages, the natural growth rate has shown a noticeable decline, especially since 2016. By 2022, the natural growth rate was −0.08, marking the beginning of an era of negative population growth in Henan Province.
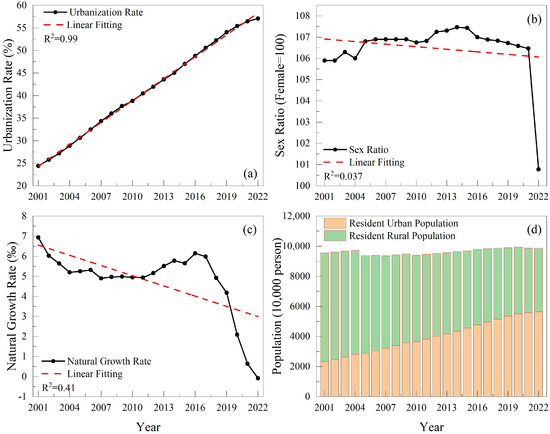
Figure 12.
Population driving factors from 2001 to 2022. (a) Urbanization rate. (b) Sex ratio. (c) Natural growth rate. (d) Population.
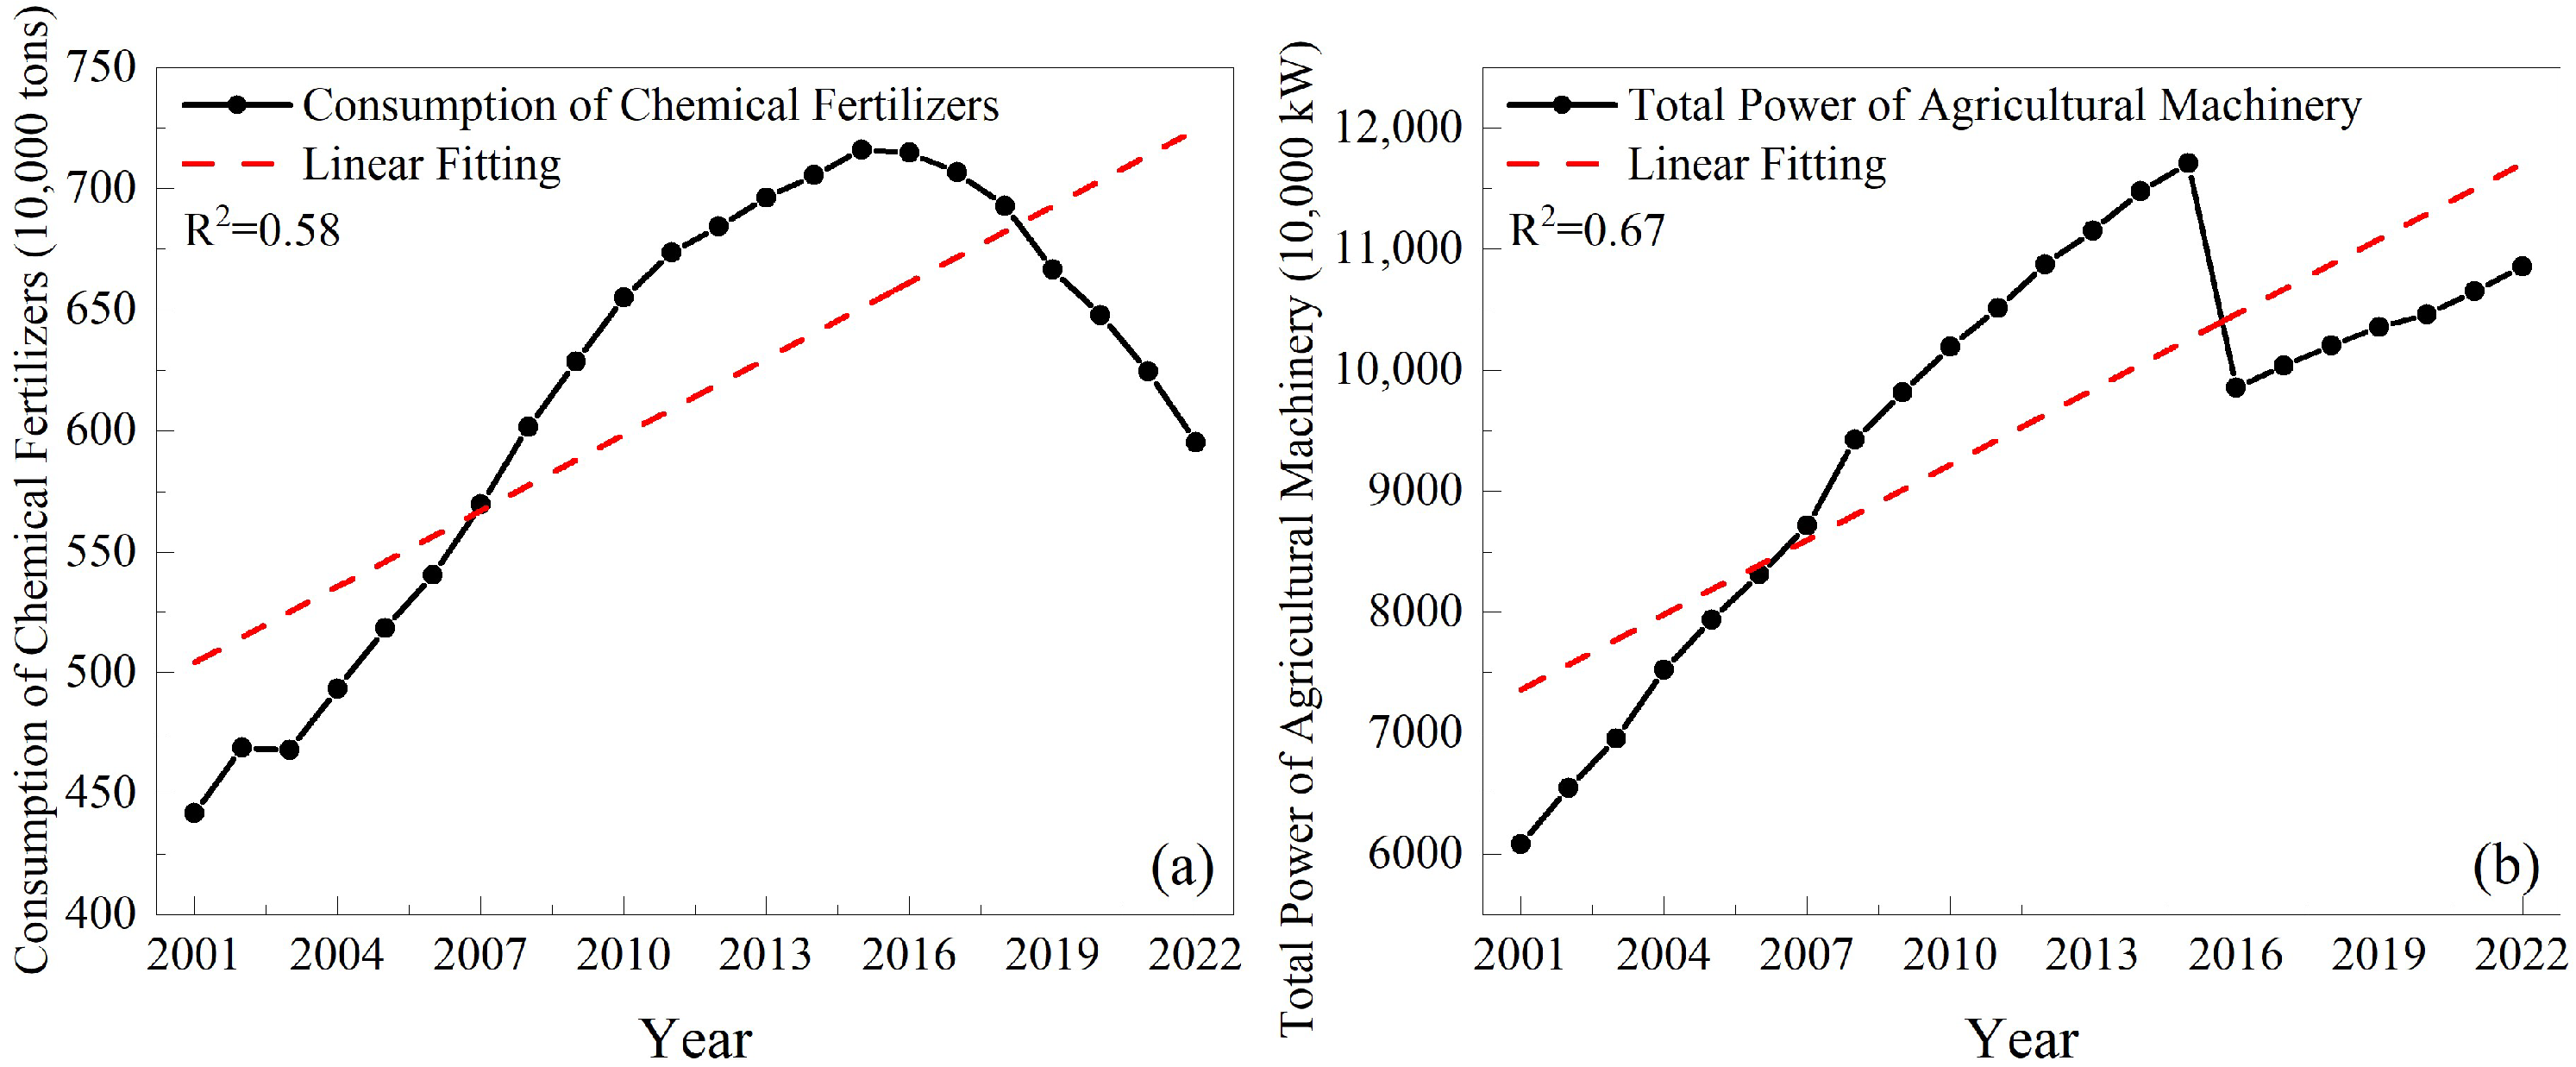
Pesticides, fertilizers, and mechanical appliances required in the agricultural production process may affect crop planting structure [45,46]. Figure 13 shows the agricultural driving factors, including the consumption of chemical fertilizers and the total power of agricultural machinery. The consumption of chemical fertilizers follows an initial increase and then a decline, while the total power of agricultural machinery exhibits a phased development pattern characterized by a sudden increase, followed by a decrease, and then another increase. The minimum consumption of chemical fertilizers was 4.4173 million tons in 2001, peaking at 7.16 million tons in 2015. This subsequent decline is attributed to the implementation of the “Zero Growth Action Plan for Fertilizer Use by 2020” and the “Zero Growth Action Plan for Pesticide Use by 2020” by the Ministry of Agriculture and Rural Affairs of the People’s Republic of China starting in 2015. With the advancement and widespread adoption of agricultural machinery technology in China, the total power of agricultural machinery has continuously increased since 2001, reaching a peak of 117.1008 million kilowatts in 2015. Despite a significant decline in 2016, the total power has continued to increase thereafter. Some studies have shown that the total power of agricultural machinery and pesticide use are the main factors affecting the pattern of grain production in counties in Henan Province [47].
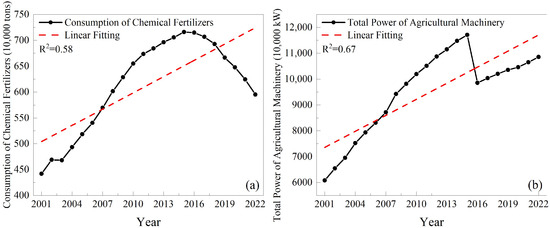
Figure 13.
Agricultural production process driving factors from 2001 to 2022. (a) Consumption of chemical fertilizers. (b) Total power of agricultural machinery.
4.3. Uncertainty and Limitations
Although this study provided an analysis of evolutionary trends and drivers of planting structure information at the sub-image metric scale, there may still be some uncertainties and limitations. Changes in planting structure are the result of a combination of multiple driving factors, including policy, technological advancements, social demand, economic efficiency, and natural conditions [48]. Although this study selected ten driving factors, the selection is limited, and some factors interact with each other. Therefore, more drivers should be considered in further research, for example, irrigation water consumption, and effective irrigation areas. Policy and unexpected natural disasters are also important factors in adjusting planting structure, and these factors are difficult to quantify. However, in this study, we conducted linear autocorrelation analysis on different driving factors, which to some extent reflects the impact of government policy adjustments on planting structure. For example, the minimum amount of agricultural fertilizer was 4.41 million tons in 2001, reaching a peak of 7.16 million tons in 2015. Because the Ministry of Agriculture and Rural Affairs of the People’s Republic of China promulgated the “Zero Growth Action Plan for Fertilizer Use by 2020” in 2015 [49,50], the amount of agricultural fertilizer began to decline. Although this study achieved good overall accuracy in extracting the spatial distribution of cropping patterns at the sub-pixel scale in Henan province, future advancements in high-resolution remote sensing technology will improve the accuracy of extracting cropping pattern information over large areas, enabling more accurate analysis of evolution trends and driving factors. Furthermore, given that the linear mixing model is a mathematical framework, it inherently lacks the capability to precisely characterize the abundance values associated with diverse crop planting patterns. In subsequent research, we aim to further employ deep learning methodologies for the sub-pixel extraction of crop planting structures, including but not limited to GACNet (generate adversarial-driven cross-aware network) [51], CVANet (cascaded visual attention network) [52], and CATNet (cascaded attention transformer network) [53].
5. Conclusions
This study proposed the mixed-pixel decomposition method to extract spatial distribution information of planting structure at sub-pixel scales from 2001 to 2022, exploring the dynamic evolution of cropping patterns in Henan Province and analyzing the correlation between multiple cropping index and 10 driving factors. The main conclusions are as follows: (1) the cropping index of the planting structure in Henan Province shows an overall increasing trend, with a slight increase of nearly 60%. With the urbanization process, the areas with a decreased cropping index in planting structure are mainly distributed around urban areas. (2) The centroid of cropping patterns in various regions gradually migrates to the main production areas with local characteristics, where spatial aggregation was obvious. (3) Among the driving factors affecting the cropping index, natural growth rate and the resident rural population show a significant positive correlation, while urbanization rate, gross domestic product, and disposable income of rural residents show a significant negative correlation. This study has important guiding significance for adjusting the planting structure at national and local levels, and it helps dynamically analyze food security and predict the impact of global uncertainties on food security.
Author Contributions
Conceptualization, K.H. and J.Y.; methodology, J.Y. and C.L.; software, J.Y.; validation, K.H., J.Y. and C.L.; formal analysis, J.Y.; investigation, J.Y.; resources, K.H. and J.Y.; data curation, J.Y.; writing—original draft preparation, J.Y.; writing—review and editing, K.H., J.Y. and C.L.; visualization, J.Y.; supervision, K.H.; project administration, K.H.; funding acquisition, C.L. All authors have read and agreed to the published version of the manuscript.
Funding
This research was supported by the Scientific Research Foundation for High-level Talents of Anhui University of Science and Technology grant number 2024yjrc192 and by Anhui Provincial Natural Science Foundation grant number 2408085MD100.
Institutional Review Board Statement
Not applicable.
Informed Consent Statement
Not applicable.
Data Availability Statement
The data that support the findings of this study are available from the corresponding author upon reasonable request.
Conflicts of Interest
The authors declare no conflicts of interest.
References
- Luo, J.; Zhang, H.; Qi, Y.; Pei, H.; Shen, Y. Balancing water and food by optimizing the planting structure in the Beijing–Tianjin–Hebei region, China. Agric. Water Manag. 2022, 262, 107326. [Google Scholar] [CrossRef]
- Bégué, A.; Arvor, D.; Bellon, B.; Betbeder, J.; de Abelleyra, D.; Ferraz, R.P.D.; Lebourgeois, V.; Lelong, C.; Simões, M.; R. Verón, S. Remote Sensing and Cropping Practices: A Review. Remote Sens. 2018, 10, 99. [Google Scholar] [CrossRef]
- Weiss, M.; Jacob, F.; Duveiller, G. Remote sensing for agricultural applications: A meta-review. Remote Sens. Environ. 2020, 236, 111402. [Google Scholar] [CrossRef]
- Yang, Z.; Wu, W.; Di, L.; Üstündağ, B. Remote sensing for agricultural applications. J. Integr. Agric. 2017, 16, 239–241. [Google Scholar] [CrossRef]
- Hu, Y.; Liu, X.; Liang, J.; Zhou, C.; Lei, B.; Luo, Y.; Feng, S. Spatial and Temporal Evolution of Crop Planting Structure in Guangdong-Hong Kong-Macao Greater Bay Area from 1990 to 2020. Guangdong Agric. Sci. 2023, 50, 13–27. [Google Scholar] [CrossRef]
- Jiang, Y.; Wang, X.; Huo, M.; Chen, F.; He, X. Changes of cropping structure lead diversity decline in China during 1985-2015. J. Environ. Manag. 2023, 346, 119051. [Google Scholar] [CrossRef] [PubMed]
- Deng, Z.; Feng, Y.; Zhang, J.; Wang, J. Analysis on the Characteristics and Tendency of Grain Production’s Spatial Distribution in China. Econ. Geogr. 2013, 33, 117–123. [Google Scholar] [CrossRef]
- Li, Y.; Li, X.; Tan, M.; Wang, X.; Xin, L. The impact of cultivated land spatial shift on food crop production in China, 1990–2010. Land Degrad. Dev. 2018, 29, 1652–1659. [Google Scholar] [CrossRef]
- Atzberger, C. Advances in Remote Sensing of Agriculture: Context Description, Existing Operational Monitoring Systems and Major Information Needs. Remote Sens. 2013, 5, 949–981. [Google Scholar] [CrossRef]
- Li, J.; Lei, H. Tracking the spatio-temporal change of planting area of winter wheat-summer maize cropping system in the North China Plain during 2001–2018. Comput. Electron. Agric. 2021, 187, 106222. [Google Scholar] [CrossRef]
- Chen, X.; Huang, Q.; Xiong, Y.; Yang, Q.; Li, H.; Hou, Z.; Huang, G. Tracking the spatio-temporal change of the main food crop planting structure in the Yellow River Basin over 2001–2020. Comput. Electron. Agric. 2023, 212, 108102. [Google Scholar] [CrossRef]
- Guo, W.; Huang, Y.; Huang, Y.; Li, Y.; Song, X.; Shen, J.; Qi, X.; Zhang, B.; Zhu, Z.; Peng, S.; et al. Develop agricultural planting structure prediction model based on machine learning: The aging of the population has prompted a shift in the planting structure toward food crops. Comput. Electron. Agric. 2024, 221, 108941. [Google Scholar] [CrossRef]
- Defries, R.S.; Belward, A.S. Global and regional land cover characterization from satellite data: An introduction to the Special Issue. Int. J. Remote Sens. 2000, 21, 1083–1092. [Google Scholar] [CrossRef]
- Yang, Y.; Wu, T.; Wang, S.; Li, H. Fractional evergreen forest cover mapping by MODIS time-series FEVC-CV methods at sub-pixel scales. ISPRS-J. Photogramm. Remote Sens. 2020, 163, 272–283. [Google Scholar] [CrossRef]
- Foody, G.M.; Cox, D.P. Sub-pixel land cover composition estimation using a linear mixture model and fuzzy membership functions. Int. J. Remote Sens. 2007, 15, 619–631. [Google Scholar] [CrossRef]
- Gillespie, A.R. Spectral mixture analysis of multispectral thermal infrared images. Remote Sens. Environ. 1992, 42, 137–145. [Google Scholar] [CrossRef]
- Wei, Z.; Ji, D.; Yang, L. Comprehensive evaluation of water resources carrying capacity in Henan Province based on entropy weight TOPSIS—coupling coordination—obstacle model. Environ. Sci. Pollut. Res. 2023, 30, 115820–115838. [Google Scholar] [CrossRef] [PubMed]
- Zhang, X.; Yin, S.; Lu, X.; Liu, Y.; Wang, T.; Zhang, B.; Li, Z.; Wang, W.; Kong, M.; Chen, K. Establish of air pollutants and greenhouse gases emission inventory and co-benefits of their reduction of transportation sector in Central China. J. Environ. Sci. 2025, 150, 604–621. [Google Scholar] [CrossRef] [PubMed]
- Zhu, L.; Tian, G.; Wu, H.; Ding, M.; Zhu, A.X.; Ma, T. Regional Assessment of Soil Moisture Active Passive Enhanced L3 Soil Moisture Product and Its Application in Agriculture. Remote Sens. 2024, 16, 1225. [Google Scholar] [CrossRef]
- Climate in Henan. Available online: www.henan.gov.cn (accessed on 25 July 2024).
- Feng, X.; Li, Y.; Zhao, Y.; Chen, J. Spatial Variability Analysis of Wheat Nitrogen Yield Response: A Case Study of Henan Province, China. Agronomy 2023, 13, 1796. [Google Scholar] [CrossRef]
- Xiao, J.; Qiao, J.; Han, D.; Ma, Y.; Zhu, Q.; Wang, W. Spatial distribution and transformation mechanism of specialized villages in typical agricultural areas: Case study of Henan province, China. Habitat Int. 2024, 146, 103034. [Google Scholar] [CrossRef]
- Zhang, L.; Wu, Z.; Sun, X.; Yan, J.; Sun, Y.; Chen, J. Mapping topsoil pH using different predictive models and covariate sets in Henan Province, Central China. Ecol. Inform. 2023, 78, 102290. [Google Scholar] [CrossRef]
- Funk, C.; Peterson, P.; Landsfeld, M.; Pedreros, D.; Verdin, J.; Shukla, S.; Husak, G.; Rowland, J.; Harrison, L.; Hoell, A.; et al. The climate hazards infrared precipitation with stations--a new environmental record for monitoring extremes. Sci. Data 2015, 2, 150066. [Google Scholar] [CrossRef]
- Winter, M.E. N-FINDR: An algorithm for fast autonomous spectral end-member determination in hyperspectral data. In Proceedings of the Imaging Spectrometry V, Denver, CO, USA, 18–23 July 1999; pp. 266–275. [Google Scholar]
- Heinz, D.C.; Chang, C.-I. Fully constrained least squares linear spectral mixture analysis method for material quantification in hyperspectral Imagery. IEEE Trans. Geosci. Remote Sens. 2001, 39, 529–545. [Google Scholar] [CrossRef]
- Savitzky, A.; Golay, M.J.E. Smoothing and Differentiation of Data by Simplified Least Squares Procedures. Anal. Chem. 1964, 36, 1627–1639. [Google Scholar] [CrossRef]
- Yang, J.; Wu, T.; Wang, S.; Zhao, X.; Xiong, H. Extraction of multiple cropping information at the Sub-pixel scale based on phenology and MODIS NDVI time-series: A case study in Henan Province, China. Geocarto Int. 2022, 37, 15999–16019. [Google Scholar] [CrossRef]
- Smith, M.O.; Johnson, P.E.; Adams, J.B. Quantitative determination of mineral types and abundances from reflectance spectra using principal components analysis. J. Geophys. Res. 1985, 90, 797–804. [Google Scholar] [CrossRef]
- Zhan, J.; Zhang, T.; Jin, Q.; Lin, Y.; Shi, Q. A centroid movement analysis of land uses in the North China Plain during 1988-2020. J. Food Agric. Environ. 2012, 10, 802–807. [Google Scholar]
- Liu, C.; Zhang, H.; Zhai, G.; Liao, B.; Wu, L.; Zhang, P. Landscape Pattern Changes in Xianghai Wetland in Recent 40 Years. In Proceedings of the IGARSS 2023—2023 IEEE International Geoscience and Remote Sensing Symposium, Pasadena, CA, USA, 16–21 July 2023; pp. 3005–3008. [Google Scholar]
- Sen, P.K. Estimates of the Regression Coefficient Based on Kendall’s Tau. J. Am. Stat. Assoc. 1968, 63, 1379–1389. [Google Scholar] [CrossRef]
- Liu, S.; Li, W.; Qiao, W.; Wang, Q.; Hu, Y.; Wang, Z. Effect of natural conditions and mining activities on vegetation variations in arid and semiarid mining regions. Ecol. Indic. 2019, 103, 331–345. [Google Scholar] [CrossRef]
- Liu, B.; Peng, W.; Zhang, Y. Disparities between climate change facts and farmer’s awareness and perception in an arid region: A case study of the middle and lower reaches of the Heihe River Basin in northwest China. Clim. Risk Manag. 2024, 43, 100588. [Google Scholar] [CrossRef]
- Xu, C.; Liu, W. The spatiotemporal assessments for tidal flat erosion associated with urban expansion in the conterminous coastal United States from 1985 to 2015. Sci. Total Environ. 2023, 899, 165660. [Google Scholar] [CrossRef] [PubMed]
- Kibret, K.S.; Marohn, C.; Cadisch, G. Use of MODIS EVI to map crop phenology, identify cropping systems, detect land use change and drought risk in Ethiopia—An application of Google Earth Engine. Eur. J. Remote Sens. 2020, 53, 176–191. [Google Scholar] [CrossRef]
- Zhao, X.; Wu, T.; Wang, S.; Liu, K.; Yang, J. Cropland abandonment mapping at sub-pixel scales using crop phenological information and MODIS time-series images. Comput. Electron. Agric. 2023, 208, 107763. [Google Scholar] [CrossRef]
- Liu, W.; Dong, J.; Xiang, K.; Wang, S.; Han, W.; Yuan, W. A sub-pixel method for estimating planting fraction of paddy rice in Northeast China. Remote Sens. Environ. 2018, 205, 305–314. [Google Scholar] [CrossRef]
- Du, Z.; Yang, J.; Ou, C.; Zhang, T. Smallholder Crop Area Mapped with a Semantic Segmentation Deep Learning Method. Remote Sens. 2019, 11, 888. [Google Scholar] [CrossRef]
- Wu, T.; Zhao, X.; Wang, S.; Zhang, X.; Liu, K.; Yang, J. Phenology-based cropland retirement remote sensing model: A case study in Yan’an, Loess Plateau, China. GISci Remote Sens. 2022, 59, 1103–1120. [Google Scholar] [CrossRef]
- Zhang, C.; Zhang, H.; Tian, S. Phenology-assisted supervised paddy rice mapping with the Landsat imagery on Google Earth Engine: Experiments in Heilongjiang Province of China from 1990 to 2020. Comput. Electron. Agric. 2023, 212, 108105. [Google Scholar] [CrossRef]
- Bhatt, R.; Kukal, S.S.; Busari, M.A.; Arora, S.; Yadav, M. Sustainability issues on rice–wheat cropping system. Int. Soil Water Conserv. Res. 2016, 4, 64–74. [Google Scholar] [CrossRef]
- Li, M.; Fu, Q.; Singh, V.P.; Liu, D.; Li, T.; Li, J. Sustainable management of land, water, and fertilizer for rice production considering footprint family assessment in a random environment. J. Clean Prod. 2020, 258, 120785. [Google Scholar] [CrossRef]
- Xiao, X.; Liu, J.; Zhuang, D.; Frolking, S.; Boles, S.; Xu, B.; Liu, M.; Salas, W.; Moore, B.; Li, C. Uncertainties in estimates of cropland area in China: A comparison between an AVHRR-derived dataset and a Landsat TM-derived dataset. Glob. Planet. Change 2003, 37, 297–306. [Google Scholar] [CrossRef]
- Fan, L.; Liang, S.; Chen, H.; Hu, Y.; Zhang, X.; Liu, Z.; Wu, W.; Yang, P. Spatio-temporal analysis of the geographical centroids for three major crops in China from 1949 to 2014. J. Geogr. Sci. 2018, 28, 1672–1684. [Google Scholar] [CrossRef]
- Yang, S.; Wang, H.; Tong, J.; Bai, Y.; Alatalo, J.M.; Liu, G.; Fang, Z.; Zhang, F. Impacts of environment and human activity on grid-scale land cropping suitability and optimization of planting structure, measured based on the MaxEnt model. Sci. Total Environ. 2022, 836, 155356. [Google Scholar] [CrossRef]
- Qu, Y.; Li, E.; Fan, H. The pattern evolution and influencing factors of the county-level grain production in Henan Province. Areal Res. Dev. 2017, 36, 148–153. [Google Scholar]
- Liu, Z.; Yang, P.; Wu, W.; Li, Z.; You, L. Spatio-temporal changes in Chinese crop patterns over the past three decades. Acta Geogr. Sin. 2016, 71, 840–851. [Google Scholar] [CrossRef]
- Zhang, C.; Lin, Y.; Hu, R.; Shi, G.; Xin, J.; Chen, K.; Meng, Y. Heterogeneous effects of information provision on fertilizer use in China’s rice production. Environ. Dev. Sustain. 2023, 26, 9045–9068. [Google Scholar] [CrossRef]
- Zhang, Z.; Hou, L.; Qian, Y.; Wan, X. Effect of Zero Growth of Fertilizer Action on Ecological Efficiency of Grain Production in China under the Background of Carbon Emission Reduction. Sustainability 2022, 14, 15362. [Google Scholar] [CrossRef]
- Zhang, W.; Li, Z.; Li, G.; Zhuang, P.; Hou, G.; Zhang, Q.; Li, C. GACNet: Generate Adversarial-Driven Cross-Aware Network for Hyperspectral Wheat Variety Identification. IEEE Trans. Geosci. Remote Sens. 2024, 62, 5503314. [Google Scholar] [CrossRef]
- Zhang, W.; Zhao, W.; Li, J.; Zhuang, P.; Sun, H.; Xu, Y.; Li, C. CVANet: Cascaded visual attention network for single image super-resolution. Neural Netw. 2024, 170, 622–634. [Google Scholar] [CrossRef]
- Zhang, W.; Chen, G.; Zhuang, P.; Zhao, W.; Zhou, L. CATNet: Cascaded attention transformer network for marine species image classification. Expert Syst. Appl. 2024, 256, 124932. [Google Scholar] [CrossRef]


Disclaimer/Publisher’s Note: The statements, opinions and data contained in all publications are solely those of the individual author(s) and contributor(s) and not of MDPI and/or the editor(s). MDPI and/or the editor(s) disclaim responsibility for any injury to people or property resulting from any ideas, methods, instructions or products referred to in the content. |
© 2025 by the authors. Licensee MDPI, Basel, Switzerland. This article is an open access article distributed under the terms and conditions of the Creative Commons Attribution (CC BY) license (https://creativecommons.org/licenses/by/4.0/).