Abstract
The rapid urban growth and proliferation of private vehicles in Pakistan have intensified challenges, such as traffic congestion, longer travel times, environmental harm, road safety risks, and adverse public health outcomes. Despite global emphasis on sustainable modes of transportation, these options remain underutilized and receive limited policy attention in Pakistan. This study investigates the barriers hindering the adoption of active and public transport in Islamabad and Rawalpindi and evaluates the role of technological factors in influencing commuters’ willingness to use public transit. Data were collected through a structured questionnaire survey and analyzed using descriptive statistics, exploratory and confirmatory factor analyses, and structural equation modeling. The findings reveal varying commuter preferences across different modes and demonstrate a higher willingness to use active modes of travel when favorable conditions are available. The dominant barriers to active travel include long travel distances and durations, insufficient infrastructure, social stigma, and a lack of cycle storage facilities. For public transport, the major obstacles identified are overcrowding during peak hours, poor accessibility, excessive travel times, and a lack of comfort and convenience. The study also highlights the potential technological interventions, such as real-time travel planning apps, secure parking space provision, and smart ticketing systems, to improve the attractiveness and usability of public transport. Overall, the study provides valuable insights for policymakers seeking to develop evidence-based strategies that encourage the use of sustainable transport options. By addressing both infrastructural and perceptual barriers, such interventions can foster a transition towards more sustainable urban mobility systems in Pakistan.
    1. Introduction
The expansion of urban areas and the rapid growth of private vehicle ownership have led to numerous challenges, including traffic congestion, increased travel delays, environmental degradation, road safety hazards, global warming, and various public health issues [,]. Environmental degradation is primarily caused by air pollutants such as lead particles, particulate matter (PM2.5 and PM10), non-methane hydrocarbons, aldehydes, ketones, nitrogen oxides (NO, NO2), ozone (O3), and carbon monoxide (CO) []. Elevated concentrations of these pollutants are linked to numerous health problems, including dust allergy, cough, lung cancer, respiratory disease, bronchiolitis, and nervous system disorders []. The primary contributor of these toxic emissions is the increasing number of vehicles []. Thus, promoting sustainable modes of transport is not only essential for environmental preservation but also vital for improving public health [].
In addition to air pollution, urban traffic noise and micromobility are important considerations for sustainable transport. Traffic noise, which varies with vehicle type, speed, acceleration, and traffic flow, often peaks at intersections and during stop-and-go conditions, adversely affecting residents’ health through sleep disturbance, hypertension, and cardiovascular risks []. Effective traffic management and sustainable travel modes can help mitigate these impacts. The adoption of sustainable transport modes, including walking, cycling, and micromobility options such as e-bikes and kick-scooters, can substantially reduce noise pollution by limiting reliance on motorized vehicles. However, the effectiveness of micromobility depends on safe, comfortable infrastructure, as pavement conditions directly influence rider comfort and health []. Micromobility also serves as an effective first- and last-mile solution that complements public transport and enhances overall accessibility. These considerations underscore the importance of integrating noise mitigation, micromobility infrastructure, and the promotion of active travel into sustainable transport strategies tailored to the urban context of Islamabad and Rawalpindi.
The importance of sustainable modes of transport is further reinforced by the United Nations (UN) Sustainable Development Goals (SDGs), which offer a comprehensive framework for addressing global development challenges. Specifically, SDG 7 emphasizes improving energy efficiency, adopting renewable energy sources, and promoting vehicle electrification to reduce carbon emissions from the transport sector []. SDG 11 targets inclusive and sustainable urban developments by ensuring equitable access to public transport (PT) and essential services, thereby enhancing the livability of inner-city areas [,]. Additionally, SDG 13 focuses on combating climate change by mitigating greenhouse gas (GHG) emissions []. This study aligns with these goals by examining sustainable development strategies that reduce GHG emissions, promote energy-efficient travel, and enhance urban livability in the context of Pakistan.
In the twin cities of Rawalpindi and Islamabad, the transportation system is predominantly motorized, with very little reliance on active travel (AT) such as walking and cycling. This overdependence on private vehicles has contributed to environmental pollution and urban traffic congestion. Studies have shown that the concentration of PM2.5 in Islamabad regularly exceeds the limits set by the National Environmental Quality Standards (NEQS), particularly during peak traffic hours [,]. Similarly, levels of NO2 and CO2 have also been found to exceed WHO and PAK NEQS limits, largely due to vehicular emissions and industrial emissions [,,]. These trends underline the urgent need to promote sustainable transport alternatives to mitigate environmental and public health risks.
Existing studies in Pakistan [,] have primarily focused on conventional congestion-reduction strategies, including the construction of flyovers and underpasses, road widening, development of parking plazas, enforcement of traffic regulations, and restrictions on unregistered vehicles. However, research indicates that the infrastructure expansion alone may not resolve congestion; instead, it can lead to induced demand, whereby increased road capacity encourages more vehicle use []. This indicates a growing need to investigate sustainable alternatives, particularly the promotion of AT and PT, as more viable long-term solutions. Although some research has explored the barriers to adopting AT and PT, much of it comes from settings with vastly different socioeconomic and urban dynamics. Previous research has shown that strategies successful in one context may not necessarily work in another, making it essential to conduct research tailored to local conditions [].
Despite extensive global research on the factors influencing AT and PT adoption, such as socioeconomic characteristics, built environment attributes, service quality, and travel behavior, there remains a paucity of context-specific evidence from developing countries, particularly Pakistan. Most prior studies have been conducted in high-income regions where urban design, income distribution, and infrastructure conditions differ significantly. Moreover, limited attention has been given to integrating technological enablers such as real-time travel planning, transit priority signals, and park-and-ride facilities in shaping modal choice. This study contributes to bridging these gaps by providing empirical evidence from the twin cities of Islamabad and Rawalpindi, incorporating both behavioral and technological dimensions within a developing-country context.
This study aims to investigate the current travel patterns of commuters in Islamabad and Rawalpindi. It identifies key barriers encountered in the use of active and public transportation and examines technological and policy factors that could encourage greater adoption of sustainable modes. The research provides evidence-based insights to transport engineers, urban planners, and policymakers in designing strategies that enhance sustainable mobility and reduce environmental impacts, contributing to the broader objectives of SDG 11 and other related global goals.
2. Literature Review
Sustainable transportation can be defined as follows: a transportation system that meets the needs of the present transportation and mobility without compromising its availability for future generations []. Black [] further argues that sustainable transport includes public transportation, walking, cycling, fuel-efficient vehicles, and electric vehicles. The main goal of sustainable transport is to reduce GHG emissions by promoting zero-emission transportation alternatives, making inner cities more livable.
2.1. Barriers to the Use of Active Transportation
The higher reliance on motorized modes of transport in developing countries contributes significantly to traffic congestion and air pollution []. The transport sector accounts for 15% of the global GHG emissions [], whereas in developing countries, it is responsible for approximately 80% of air pollution []. Hence, promoting sustainable modes of transport through a series of interventions is essential, particularly by addressing the barriers to AT.
Economic factors influencing the adoption of AT include car ownership and cost. According to Ghimire and Bardaka [], an increase in the cost of motorized transport and fuel prices compels low-income commuters to adopt walking and cycling as their primary mode of travel. Furthermore, car ownership negatively impacts the usage of active modes of transportation [,,,].
The infrastructural factor also influences commuter preference regarding active transport. The unavailability of footpaths and cycle lanes exposes commuters to traffic accidents, leading to feelings of insecurity and discouraging the use of AT [,,,]. The need to change clothes also moderately affects one’s decision to choose AT [], particularly in hot climates where sweating can damage clothing. Recreational commuters’ preferences are influenced by the availability of street amenities, especially when they are unfamiliar with the area []. Additionally, the lack of safety signage and secure bike storage further deters commuters from using AT []. Obstacles on the footpaths, such as utility poles, also hinder commuters’ intentions to walk [].
Environmental and geographic factors further influence AT use. Shorter distances between origin/destination and PT station [,,,], as well as terrain characteristics such as hills [], play a paramount role in shaping travel mode choice. It has been observed that when destinations are within 1 km, commuters tend to walk []. Extreme weather conditions are another significant deterrent to AT [,,,]. Providing facilities such as a rain shelter may help to mitigate weather-related barriers []. The risk of traffic accidents [,], particularly in high traffic areas [], also discourages AT adoption. Moreover, a polluted environment is another reason commuters abandon active modes of travel [].
Social and cultural norms significantly hinder the adoption of AT []. For example, in some contexts, men may avoid walking or cycling due to perceptions that such behaviors are inconsistent with their social status []. Similarly, women may experience discomfort or face societal constraints when walking/cycling [], particularly in undeveloped societies [].
2.2. Factors Affecting the Use of Public Transport
The quality of service significantly affects the rideability of PT. Punctuality and waiting time have a strong impact on PT rideability, as indicated by several researchers [,,,]. Reliability and frequency are the paramount factors affecting user satisfaction and the adoption of PT []. Furthermore, when PT is available within close proximity, it improves user satisfaction [,]. In contrast, longer travel time [] and information delays [] are negatively associated with commuters’ satisfaction. Safety is the most important factor in developing countries influencing mode choice []. Safety from crimes, particularly important for women and children, can be enhanced by introducing CCTV cameras and deploying police security at metro stations [].
The environmental factor also substantially influences PT ridership. Adverse weather conditions deter commuters from using PT [,,]. Noise and air pollution caused by buses have also been reported to hinder PT usage [,]. The presence of green space and an esthetically pleasing environment near the PT stations increases ridership [].
Comfort factors play a paramount role in encouraging occasional commuters to use PT more frequently. Although vehicle crowding is not as critical as attributes such as frequency and reliability, it becomes a major concern when crowding reaches excessive levels []. Smooth driving enhances commuter satisfaction [] and can be ensured by hiring an experienced driver. Satisfaction with the metro services is also significantly influenced by cleanliness [,,]. Improving the vehicle’s internal environment by providing an air conditioner in summer and heating in winter, further enhance commuter comfort [].
Low satisfaction levels have been reported with facility design attributes, including bus stop infrastructure, sidewalk, and lighting []. To make PT more accessible for older adults and persons with disabilities, it is essential to incorporate features such as kneeling buses, ramps, wheelchairs, low floors, and handrails [].
2.3. Technological Factors
Technological factors play a critical role in promoting PT. The transit signal priority (TSP) technique enhances commuter satisfaction by reducing travel time delays and improving service reliability []. The real-time information (RTI) system provides essential data such as the expected arrival and departure times, current transit location, trip planning, and vehicle occupancy []. The use of RTI enhances user satisfaction by reducing perceived and actual waiting time, thereby improving overall rideability []. A multi-modal trip planning application enables users to plan their journey across multiple modes of transport and helps address the last-mile connectivity issues. Attitude and social influence have been identified as key factors affecting the adoption of such a trip planning app []. Moreover, automatic fare collection can be implemented through transit smart cards or online mobile applications, improving efficiency and convenience for commuters [].
3. Methodology
This study employed a quantitative data analysis technique to investigate the main barriers to AT (walking/cycling) and PT through a case study of the twin cities, Pakistan. The quantitative research method is preferred over the qualitative research method due to its ability to collect data from a large number of respondents, minimize research bias, and allow application of statistical methods to measure the relationship between variables [].
3.1. Questionnaire Design
The questionnaire was carefully developed to align with research objectives, which focus on identifying the barriers to the use of AT and PT, as well as technological factors encouraging the use of PT. Furthermore, its design was guided by existing literature, previously validated instruments, and contextual needs of the study area.
The first part of the questionnaire consists of the socioeconomic demographics (SEDs) of the respondents, including gender, age, physical disability, education, employment status, family income, and ownership of motorcycles and cars. Respondents under 18 years of age were not included in the survey because they are not independent decision makers; their decision to travel is mostly influenced by their parents or guardians. The respondent’s household income levels were categorized with reference to the average household quintile income reported in the Government of Pakistan’s Economic Survey []. The 5th quintile income in urban areas is approximately PKR 64,681. However, for analysis purposes, income categories were defined based on the actual distribution of respondents, as presented in Table 1.
       
    
    Table 1.
    Socio-economic demographics (SEDs) characteristics of the respondents.
  
The second part of the questionnaire includes questions about the travel-related information of the respondents, such as primary mode of transport when traveling to the workplace/university/school, head of family, current travel satisfaction, and willingness to use an active mode of travel when safe and well-maintained walking paths are available.
The third and fourth parts of the questionnaire include questions related to the barriers hindering the use of active AT and PT. Respondents were asked to rate these barriers on a five-point Likert scale as follows: (1) Strongly Disagree; (2) Disagree; (3) Neutral; (4) Agree; (5) Strongly Agree. The barriers to active modes of transport were identified from studying the previous literature studies [,,,]. Similarly, barriers to the use of PT are adapted from the previous literature that examined the most prevalent challenges to use PT [,].
In the fifth part of the questionnaire, respondents were asked to rate the importance of various technological factors, such as travel planning apps, automatic crowd management systems, dedicated bus lanes, and provision of park-and-ride services. Notably, previous studies rarely examined how the availability of such technological features could influence people’s behavior regarding the adoption of PT.
3.2. Study Area
The study was conducted in Islamabad and Rawalpindi, located in the northern region of Pakistan. Over the past few decades, both cities have experienced rapid population growth, contributing to urban sprawl and an increase in transportation demand. According to the Pakistan Bureau of Statistics survey [], the populations of Rawalpindi and Islamabad were 3.3 million and 1.1 million, respectively. Furthermore, Rawalpindi has recorded an average annual growth rate of 8%, the highest among all cities in Pakistan [].
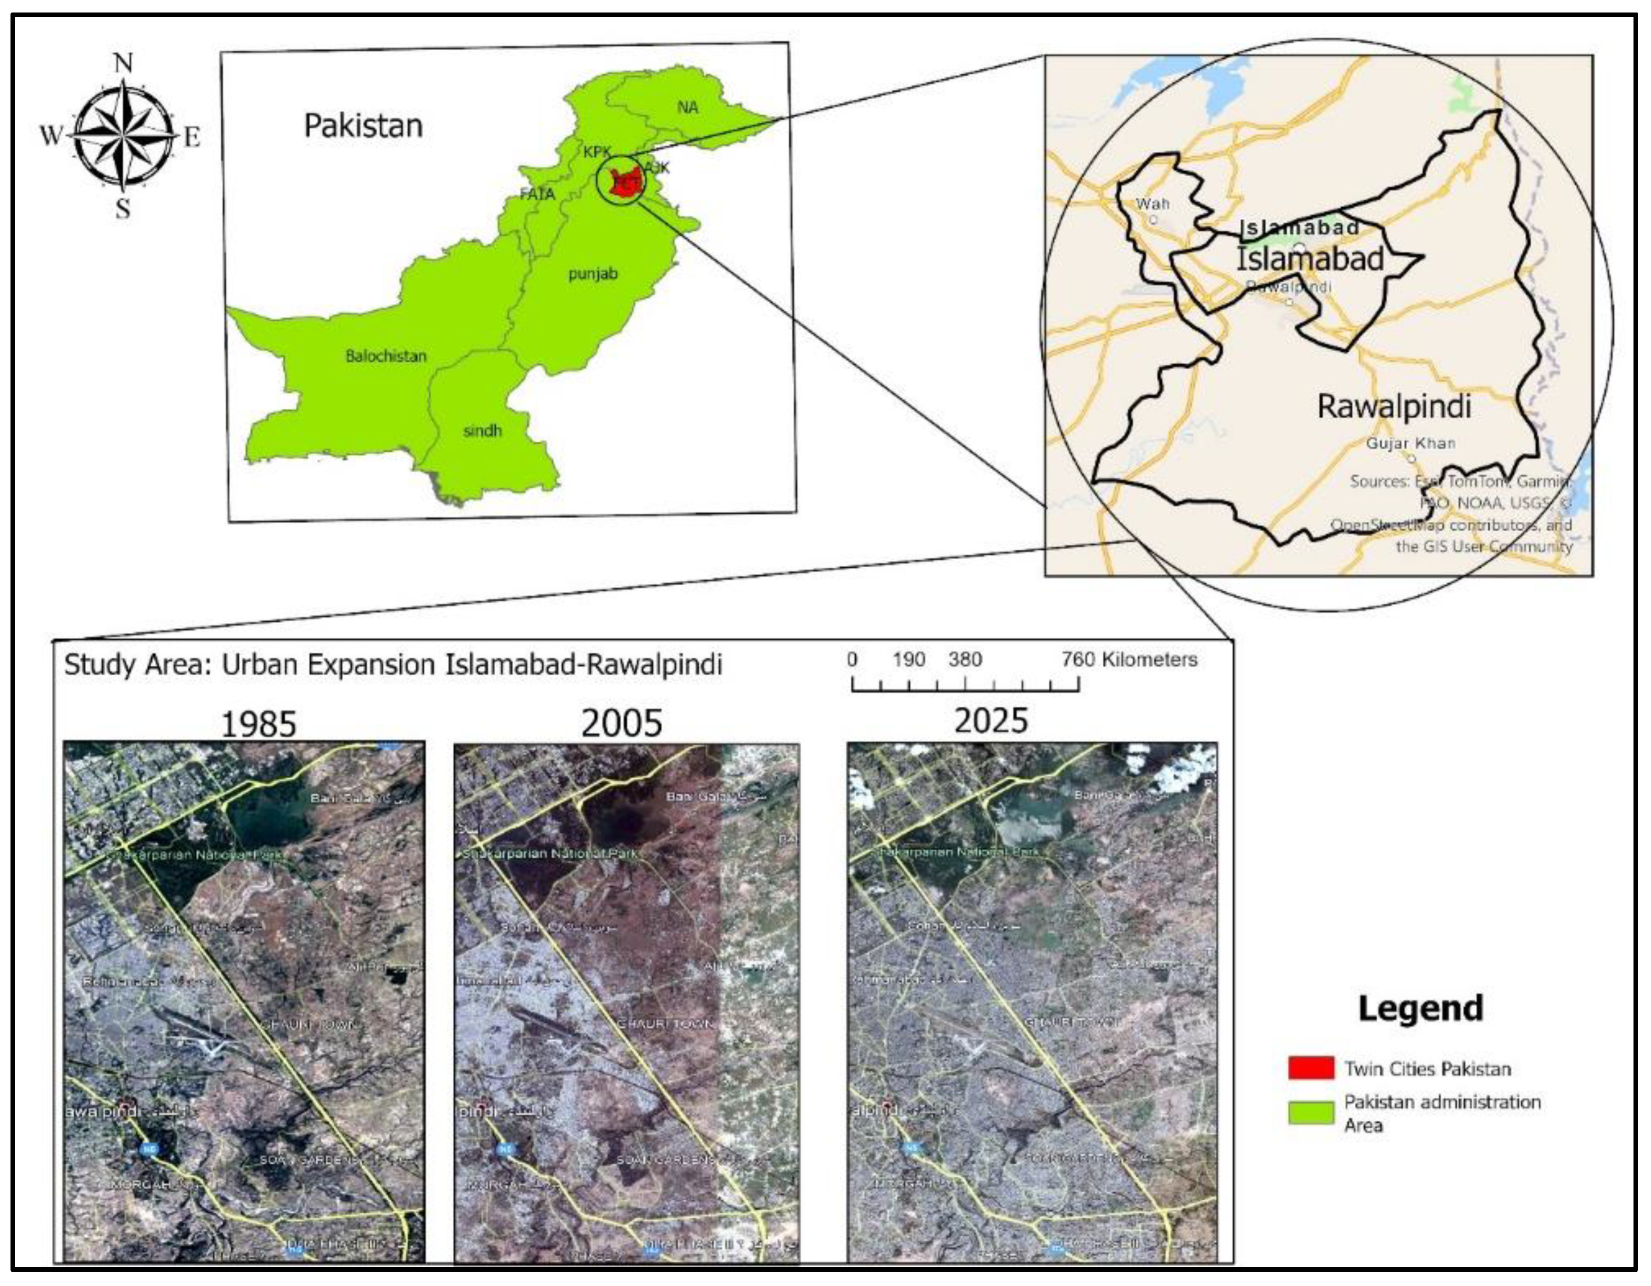
The growth can be largely attributed to the fact that these cities serve as the industrial and economic hub, offering superior educational, health, and employment opportunities. As a result, they attract individuals from less developed regions, many of whom ultimately choose to settle there. All of these issues make Islamabad and Rawalpindi highly relevant locations for this case study. Figure 1 illustrates the spatial and temporal patterns of urban expansion in the twin cities over the years 1985, 2005, and 2025, based on satellite imagery obtained from Google Earth and processed using ArcGIS Pro 3.1.
      
    
    Figure 1.
      Temporal changes in urban growth within the Islamabad–Rawalpindi metropolitan region (twin cities), Pakistan.
  
3.3. Data Collection and Sample Size
A pilot survey with 13 respondents was conducted to assess the clarity and reliability of the questionnaire prior to full data collection. Based on feedback, ambiguous statements were revised for better comprehension. For example, “unreliable service” was changed to “I don’t know when I would reach the office if I travel using PT,” and the statement on safe parking was rephrased to specify “park and ride service.” Explanations for terms like “dedicated bus lanes” and “travel planning app” were also added in parentheses.
The primary data were collected using a self-administered digitalized questionnaire designed on the Google Forms platform. The online survey link was disseminated through various social digital platforms such as WhatsApp groups, emails, and LinkedIn groups to maximize reach across various sociodemographic groups. The sample size was determined based on the minimum sample size required for performing multivariate analysis. Since this study employs structural equation modeling (SEM) analysis, a common rule of thumb is to collect data from at least 5 to 10 respondents per variable in the questionnaire [,,].
Moreover, collecting an adequate sample size is essential to minimize research biases and ensure the credibility of the research findings. A total of 343 responses were received by the end of the survey. After initial data screening, 6 questionnaires were excluded, resulting in a final sample of 337 valid responses. The data collection period spanned from December 2024 to February 2025.
3.4. Data Analysis
The data analysis methods consist of (I) descriptive statistics and (II) inferential statistical analysis. The SEDs characteristics of the respondents were analyzed using descriptive statistics, including a frequency table, stacked bar charts, and a radar chart. Descriptive statistics of the data were conducted using IBM SPSS (version 27) and MS Excel software. In addition to the descriptive statistics, several inferential statistics methods were employed to explore the interrelationship among different variables.
Exploratory factor analysis (EFA) was performed on the barriers to the use of AT and PT, as well as on technological factors encouraging the use of PT. EFA was applied to reduce the observed variables (barriers to the AT and PT) into a smaller set of latent variables based on the similarity of their correlation pattern [,]. The constructs obtained from EFA were then validated through measurement models. These models confirmed that a significant correlation exists between the latent variable and their corresponding observed variables.
Subsequently, structural models for SEM were developed based on the measurement models. SEM is a widely used multivariate analysis technique, extensively used by numerous researchers in the transportation engineering discipline for examining travel behavior patterns [,]. IBM Amos software (version 23) was used to construct both the measurement and structural models. The reliability of these models was evaluated using goodness-of-fit indices. Most researchers recommend that model fit indices, such as Goodness-of-Fit Index (GFI), Adjusted Goodness-of-Fit Index (AGFI), and comparative fit index (CFI), should exceed the threshold of 0.9; the chi-square to degree of freedom ratio (CMIN/DF) value should fall between 2 and 5, while the root mean squared error of approximation (RMSEA) value should be below 0.08 [,,].
4. Analysis and Results
4.1. Descriptive Statistics of Data
Table 1 presents the descriptive statistics pertaining to the SEDs of the respondents. The frequency distribution of the male respondents is significantly higher than the female commuters; the low percentage of female respondents aligns with findings from previous studies in Pakistan [,]. More than 50% of the respondents were in the age group of 18–30 and held at least a bachelor’s degree. Additionally, the frequency of disabled commuters is higher among older adults. About 35% of the respondents are students, while 23% were employed in the private sector. Nearly 40% of the respondents reported a family income between 100,000 and 150,000 PKR. Furthermore, approximately half of the respondents owned a motorbike, and more than 60% owned a car.
4.2. Primary Mode of Traveling
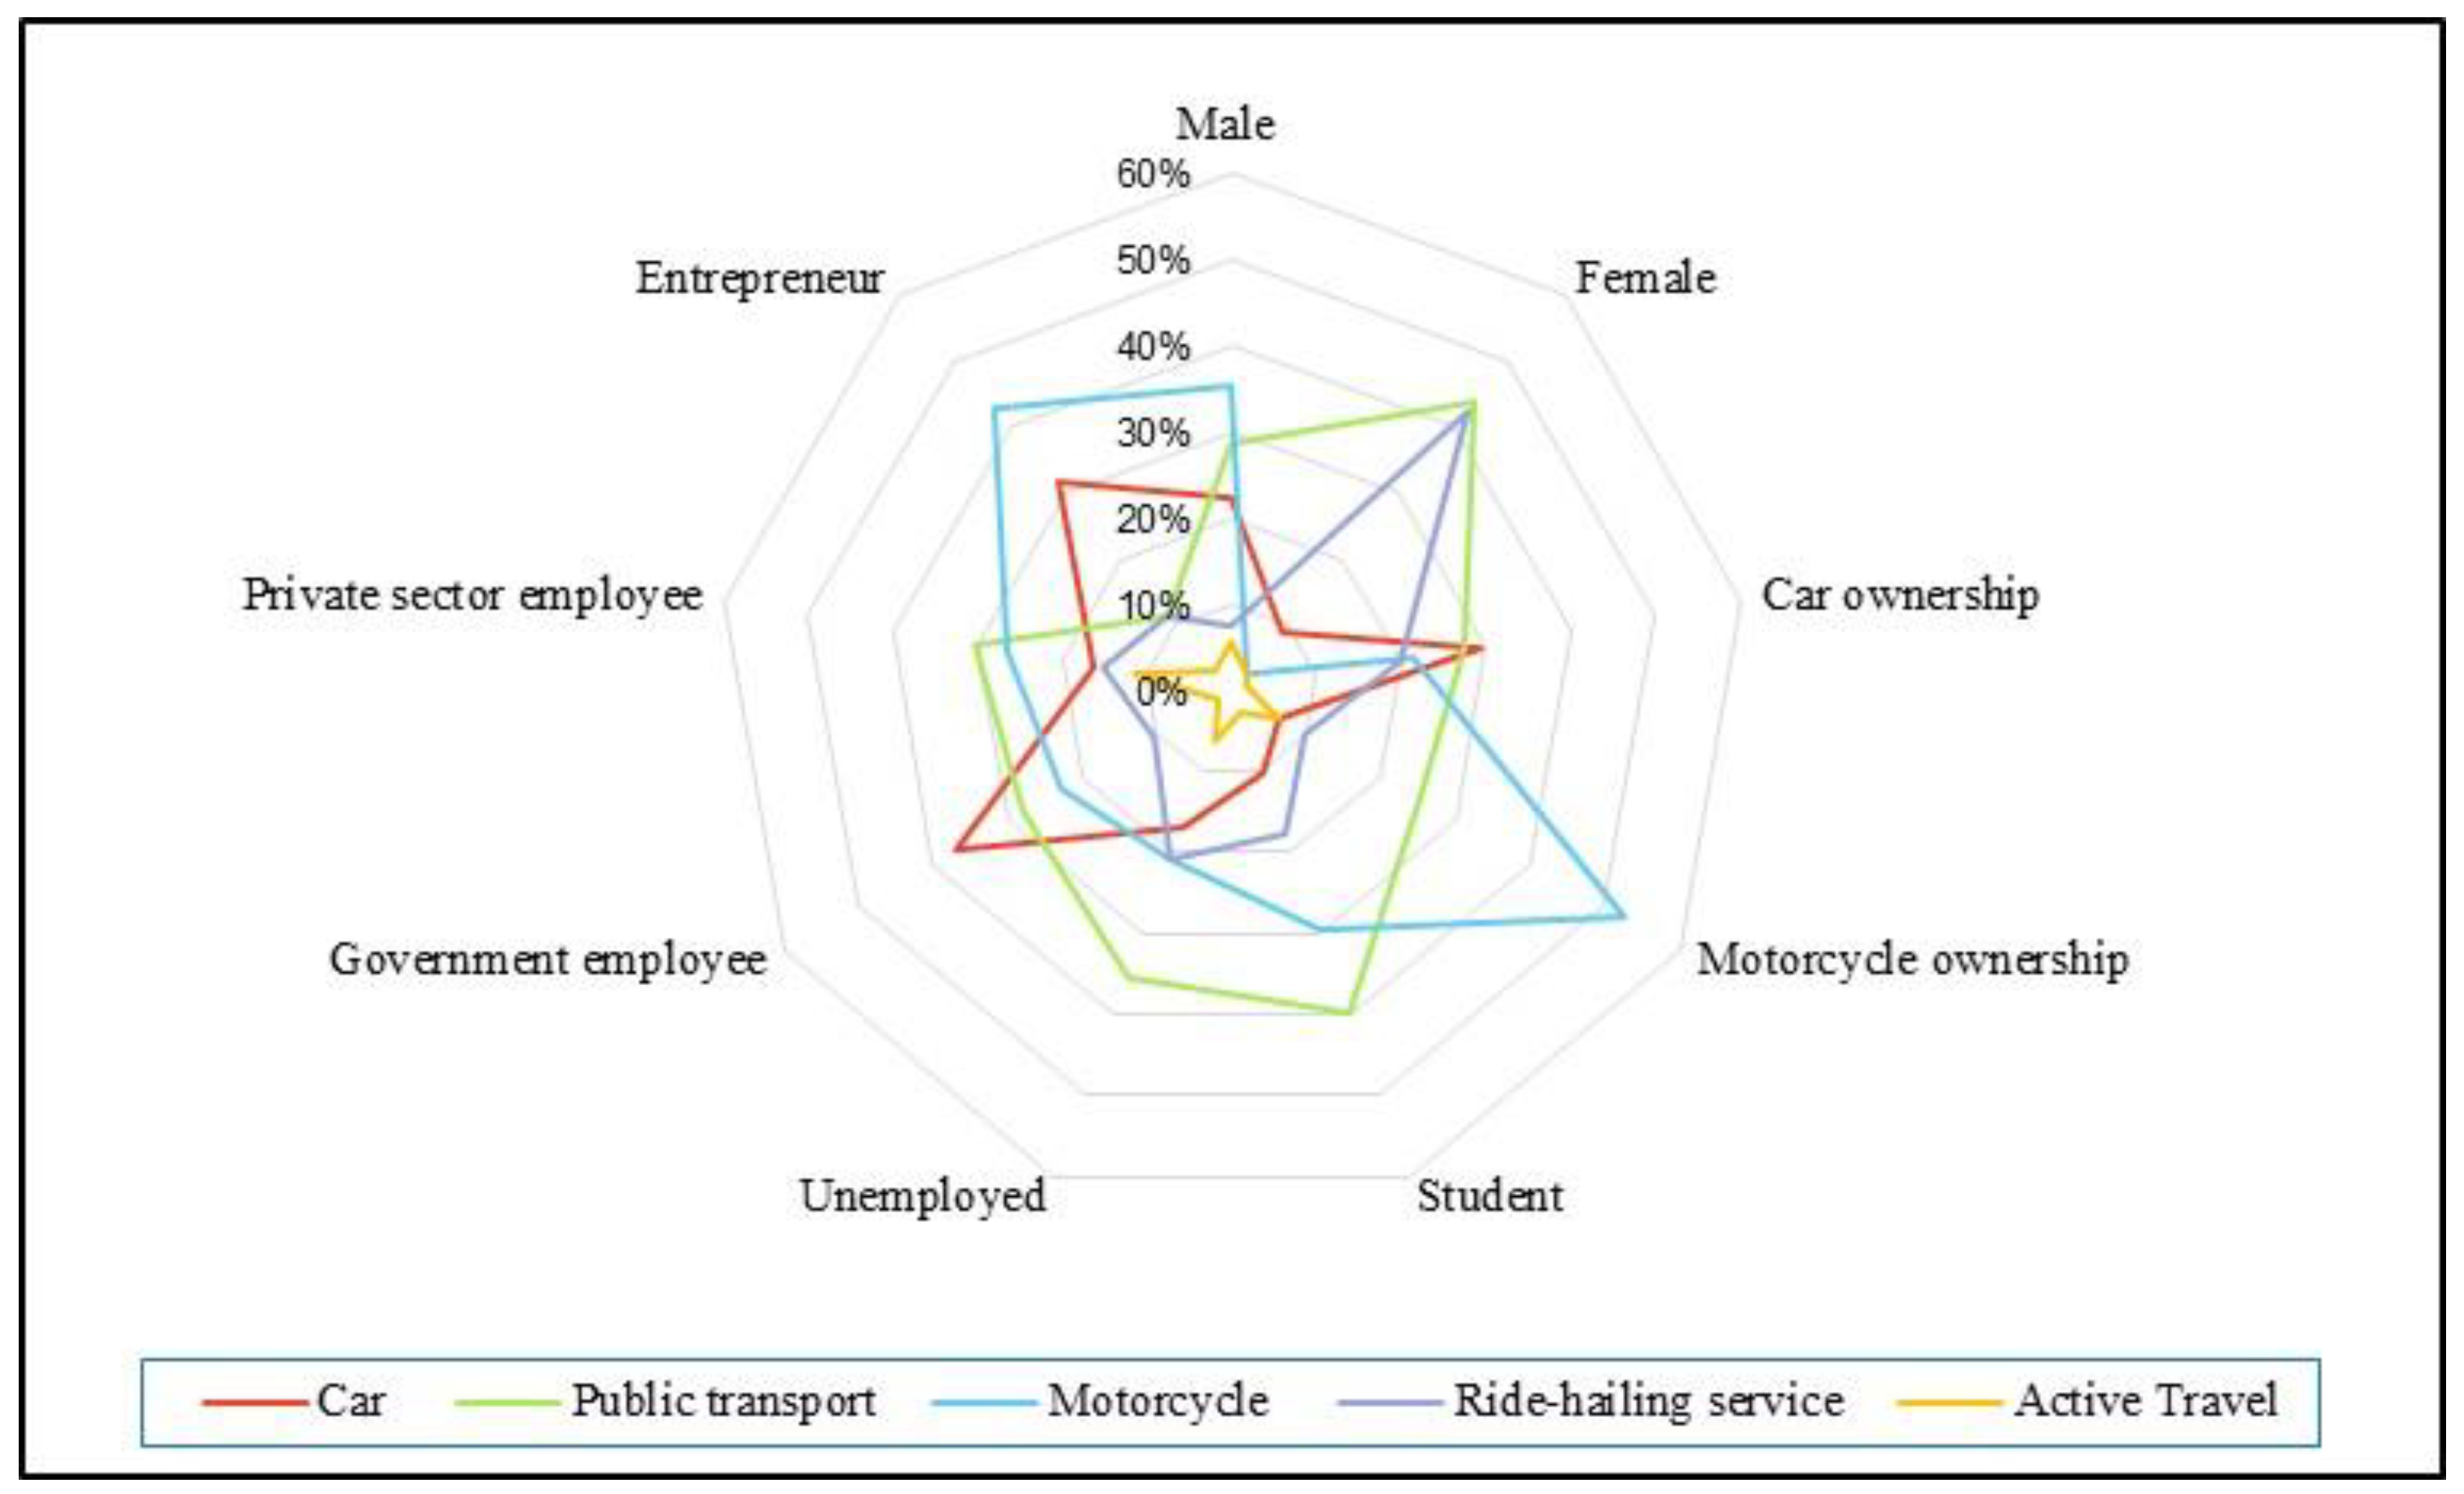
Figure 2 shows the travel preference of the commuter across various categories of gender and employment status. The radar chart indicates that commuters who own a car and work as government employees exhibit a high percentage of private car use. Public transport is popular among females, students, private sector employees, and unemployed commuters. Motorcycles are a common mode of transport among commuters among motorbike owners, entrepreneurs, and private sector employees. Furthermore, ride-hailing services (Uber/Careem) are mostly preferred by females and commuters who own a car. However, only a smaller percentage of commuters prefer AT when commuting to the workplace/school.
      
    
    Figure 2.
      Primary mode of traveling among commuters across various categories.
  
4.3. Satisfaction with Current Travel Patterns and Willingness to Use Active Travel
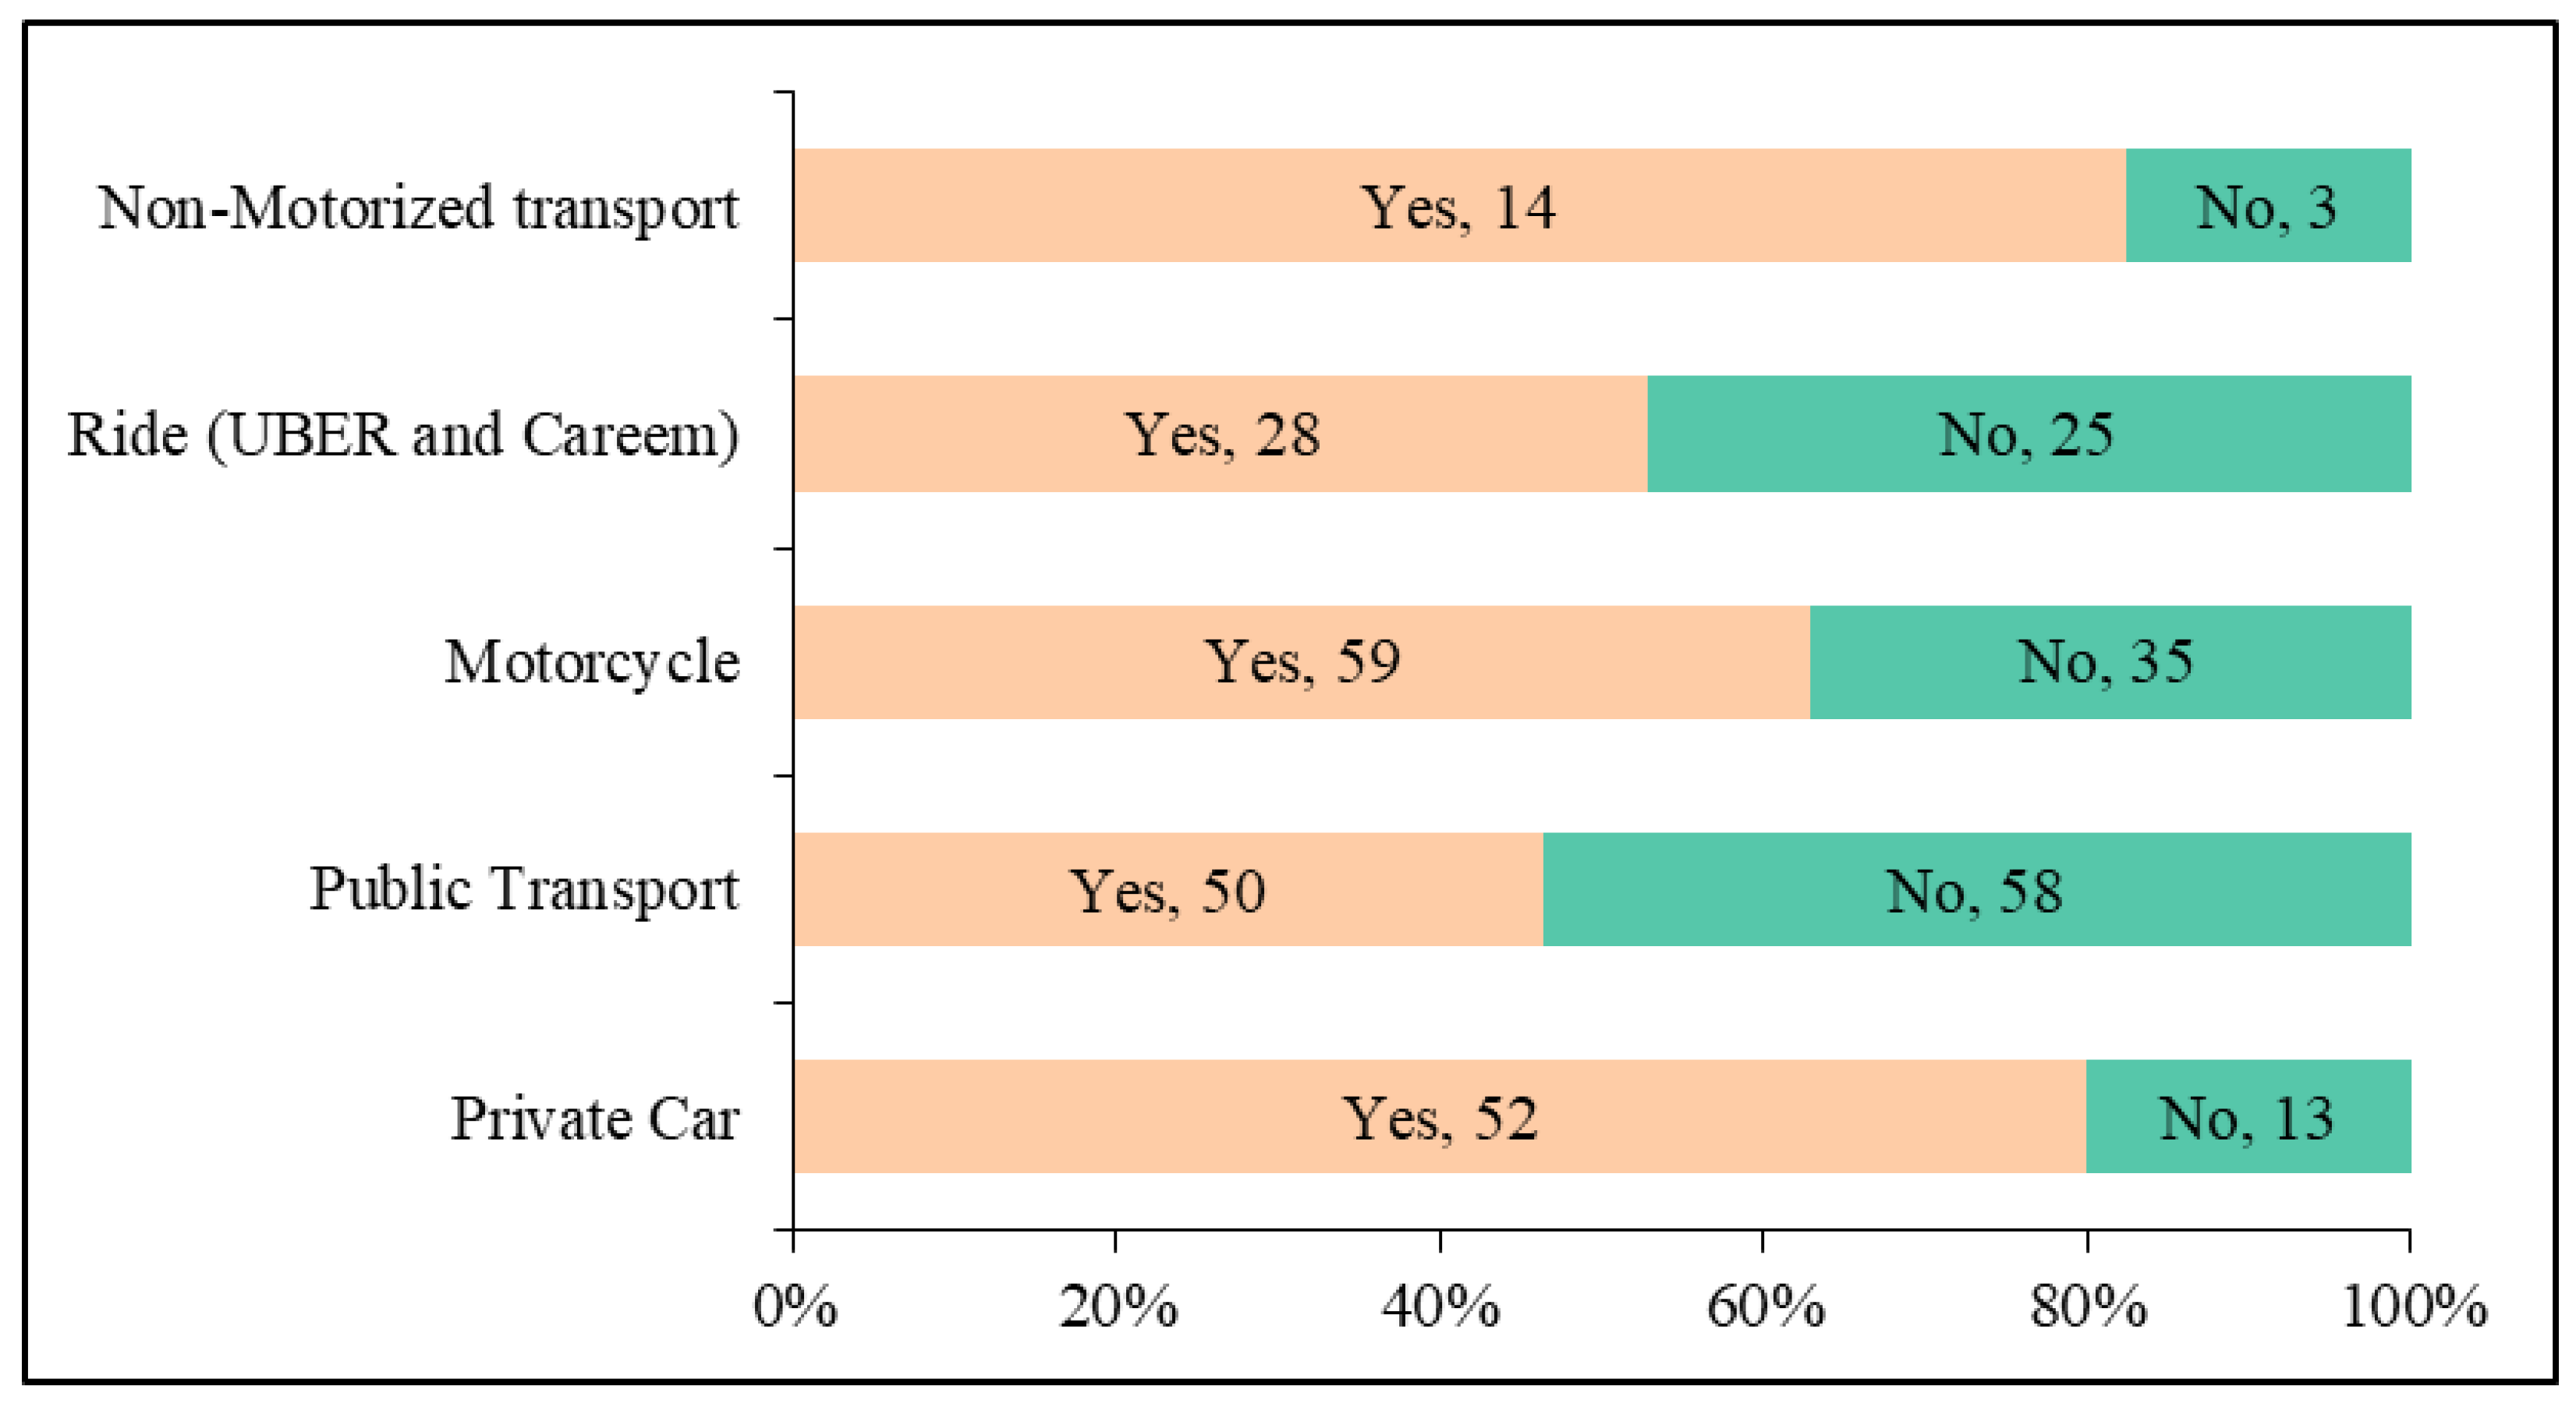
Figure 3 shows commuter satisfaction with their current mode choices. Commuters using an active mode of transport report the highest level of satisfaction (91.67%) with their choice. A possible reason for high satisfaction is that they are voluntarily choosing walking as their preferred mode of travel. The private car user also shows high satisfaction (80.30%) with their mode choice due to comfort, convenience, and flexibility. Motorcycle commuters show a moderate level of satisfaction (62.77%), while ride-hailing service users report 52.83% satisfaction with their mode choice. PT users show relatively low satisfaction (46.43%) with their choice; possibly, many of them are captive users of it.
      
    
    Figure 3.
      Commuters’ satisfaction with their current mode of transportation.
  
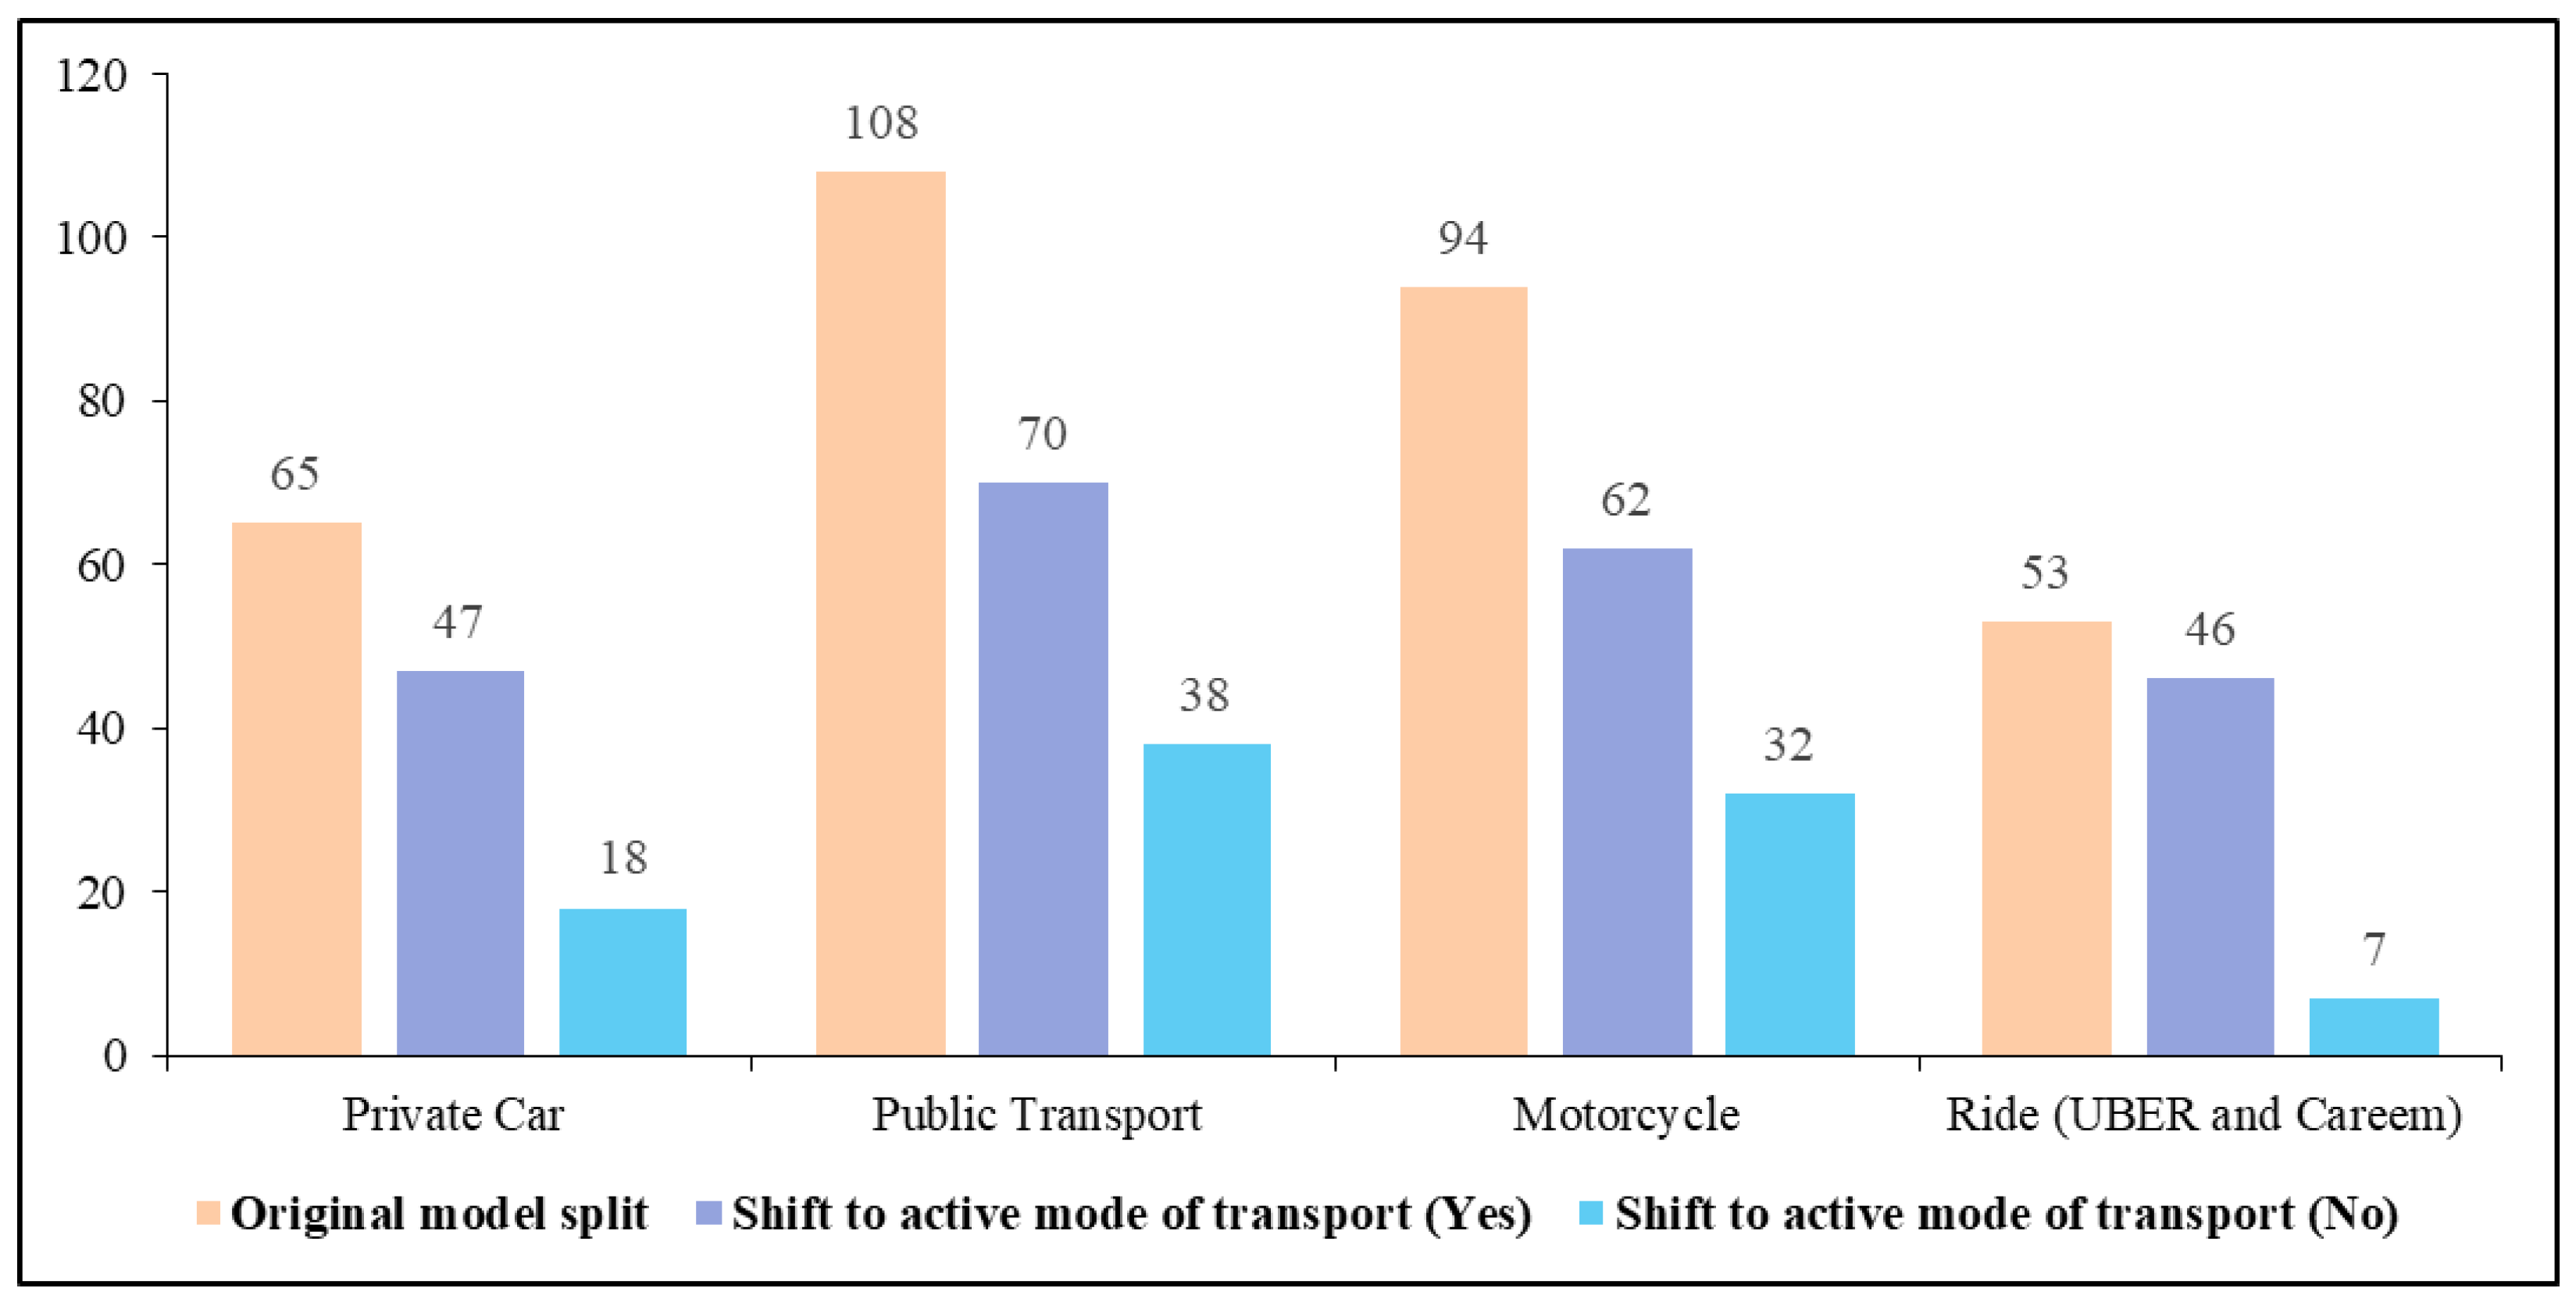
Figure 4 shows the original travel model split and the willingness to use active modes of transport when safe and well-maintained walking paths were available. The ride-hailing service (Uber/Careem) users, in particular, expressed a positive attitude towards using active modes of transportation.
      
    
    Figure 4.
      Original model split and shifted to active transport.
  
4.4. Barriers to the Active Modes of Transport
Figure 5 shows commuters’ perceived barriers to active modes of transportation, such as walking and cycling. Travel distance and travel time are the most significant barriers. A lack of infrastructure, along with stigma associated with AT, represents the second most significant barrier. The absence of safe cycle storage facilities at PT stations and safety concerns (e.g., the risk of being looted) are the third most important barriers. Traffic safety issues, such as the risk of accidents due to heavy traffic, and the need to carry goods, are also the fourth important major barriers.
      
    
    Figure 5.
      Distributions of respondents’ level of agreement with barriers to the active modes.
  
Furthermore, factors like higher income are also considered minor barriers to AT. Additionally, commuters show a lower level of agreement with other potential barriers, such as owning a car, air pollution, weather conditions, the need to change clothes, a lack of changing facilities at the workplace, and a lack of support from family.
4.5. Barriers to the Use of Public Transport
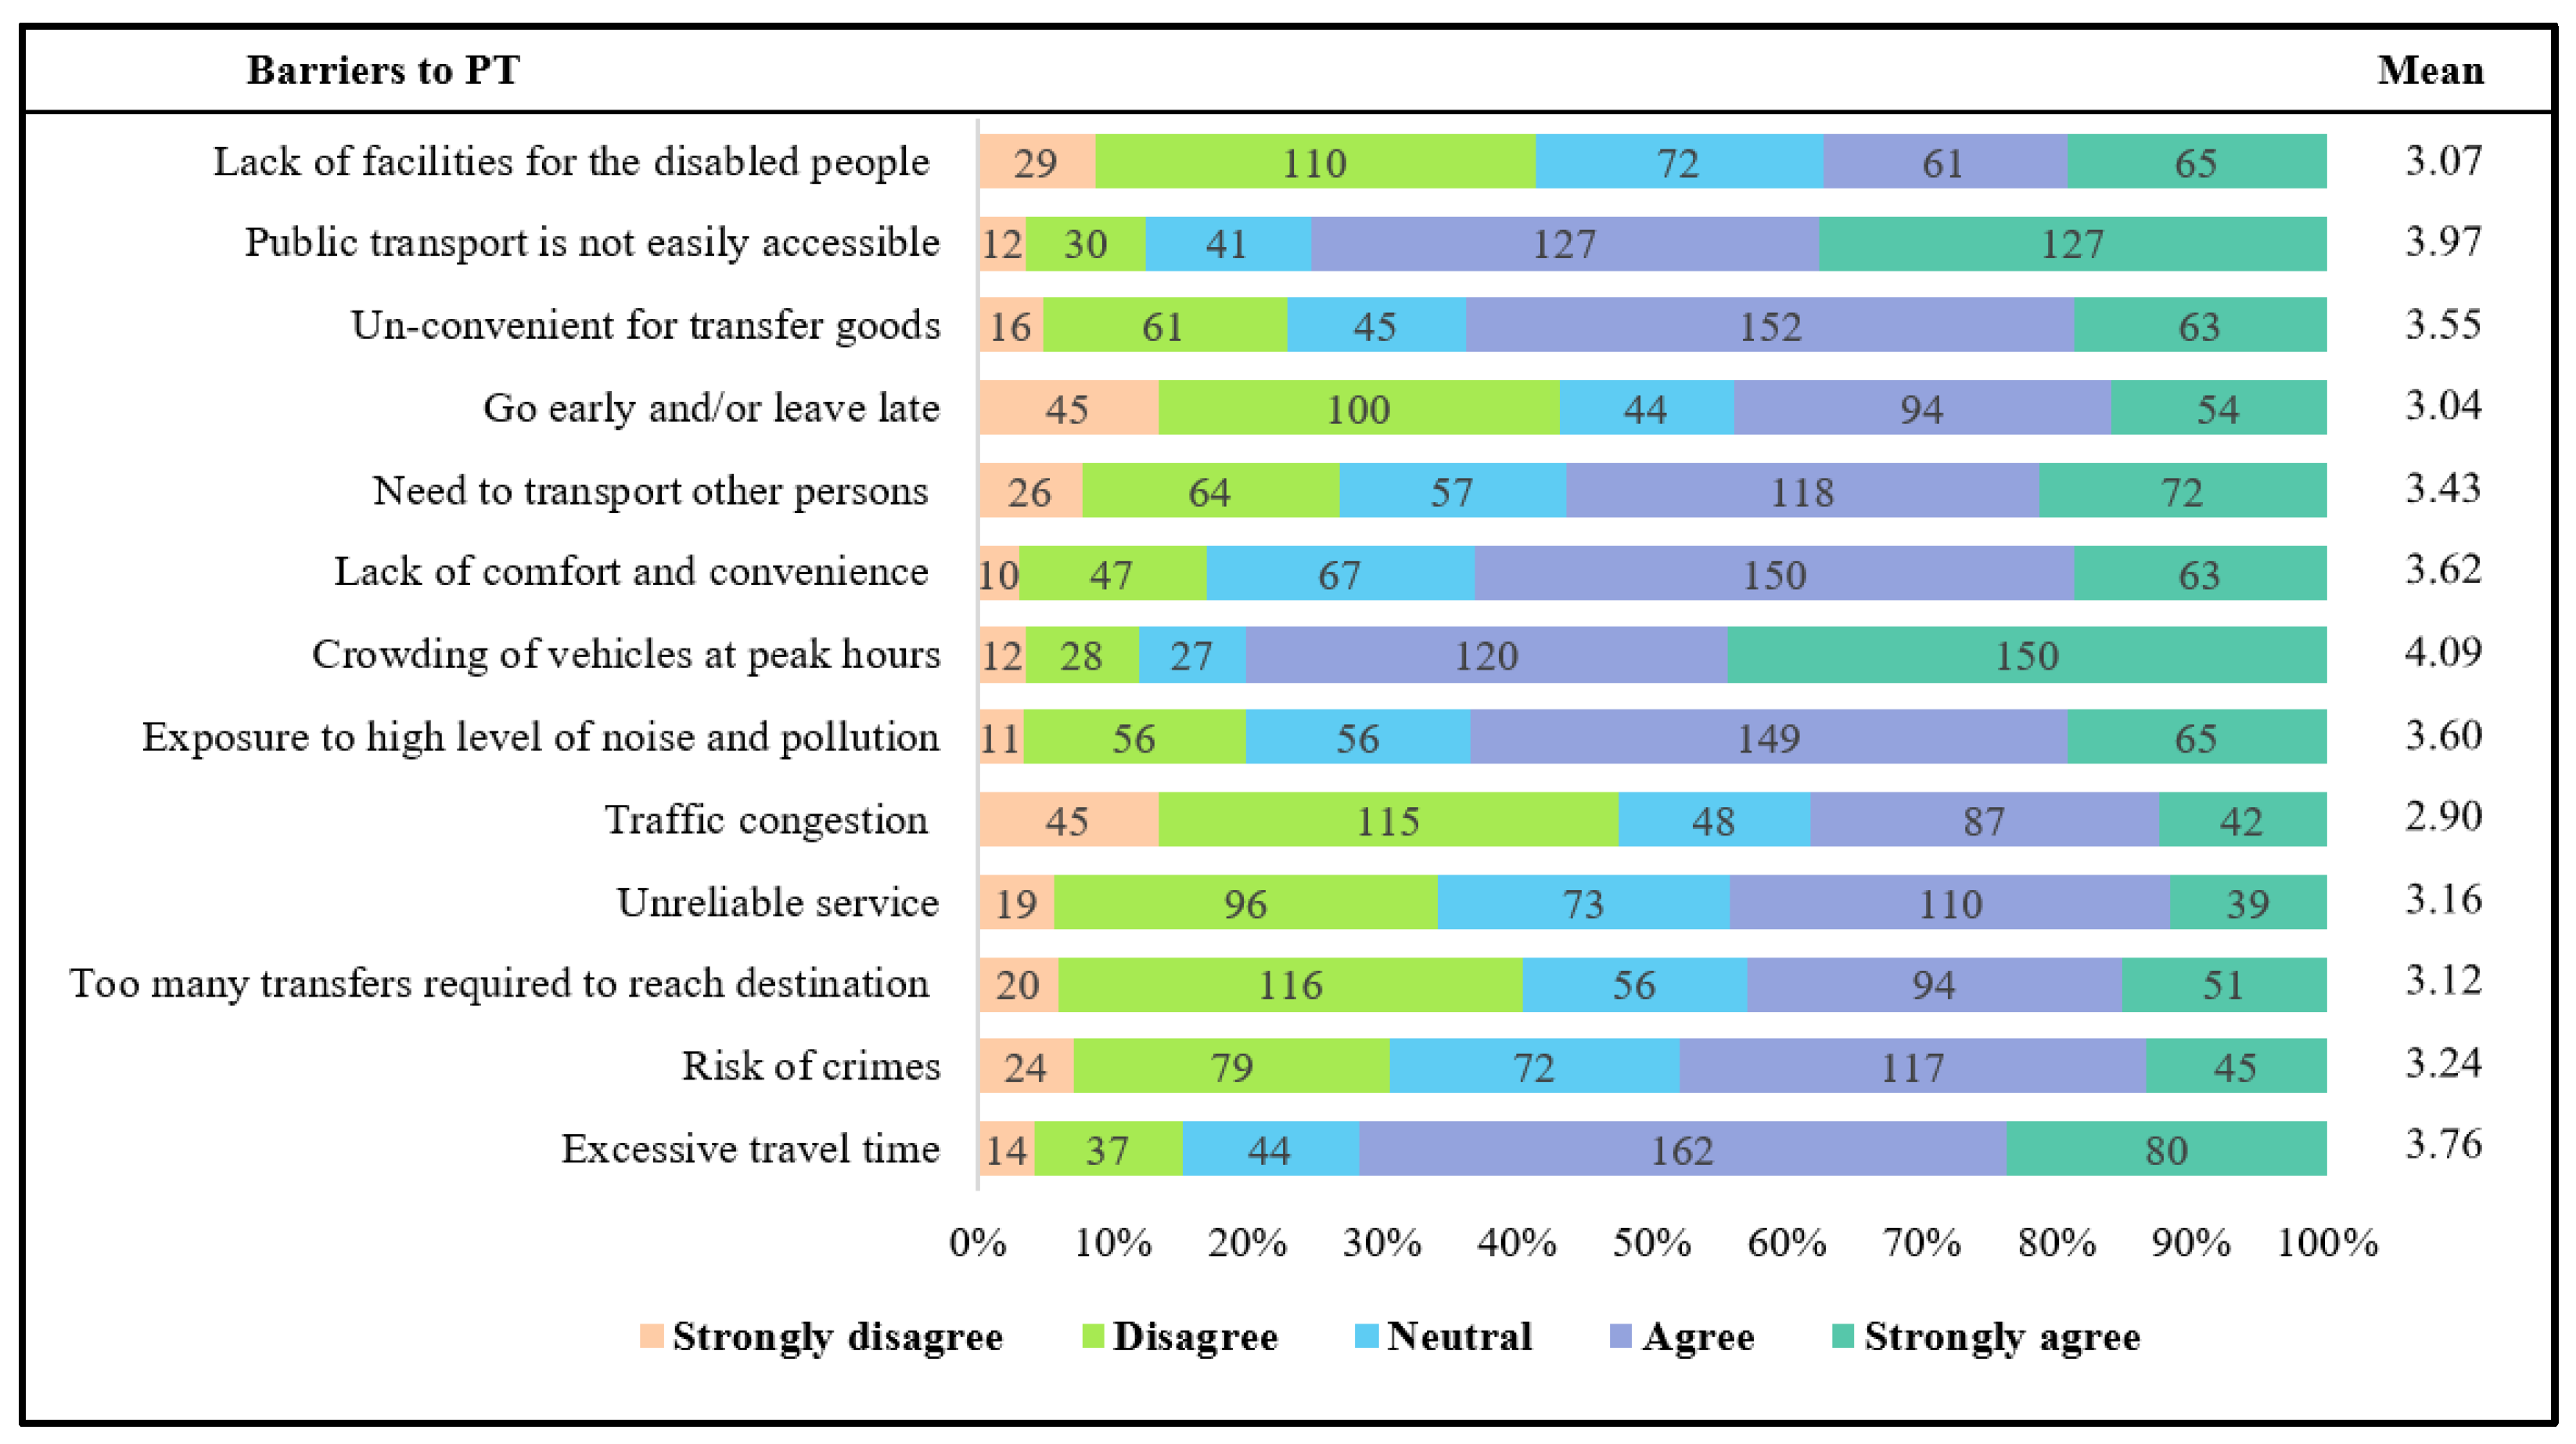
Figure 6 shows respondents’ level of agreement with various barriers to PT. Crowding of vehicles during peak hours and accessibility issues are identified as the most significant barriers. Following these, excessive travel time, lack of comfort and convenience are considered the second most important barriers. Exposure to noise and pollution, along with inconvenience in transferring goods, are regarded as the third most significant barriers.
      
    
    Figure 6.
      Distribution of respondents’ level of agreement with barriers to public transport.
  
Furthermore, factors such as the need to transport other people (e.g., provide pick-and-drop) and the risk of crime are considered slightly important barriers to PT. In addition, other factors, such as too many transfers, unreliable service, traffic congestion, the need to leave early or return late, and inadequate facilities for disabled individuals, receive lower scores and are not considered highly significant barriers overall. However, the lack of facilities for disabled people is particularly important for commuters facing any kind of disability and those aged over 60.
4.6. Importance of Different Technological Factors Encouraging the Use of Public Transport
Figure 7 shows the commuters’ perceived level of importance regarding various technological factors. Overall, most commuters assign a high level of importance to all the factors that could encourage the use of PT. The statement that attracted the most importance was ‘I intend to use PT if it takes less time to reach the destination’.
      
    
    Figure 7.
      Importance of different technological factors in encouraging PT use among commuters.
  
In addition, access to real-time travel planning was also rated highly, emphasizing the importance of timely travel information for commuters. Furthermore, other technological factors, such as access to safe and secure parking spaces near PT stations, mobile ticketing apps, crowd management sensors on buses, and dedicated bus lanes, are also considered important in encouraging the adoption of PT.
5. Factor Analysis and Structural Equation Modeling
5.1. EFA for Barriers to the Active Modes of Transportation
Exploratory factor analysis was performed to extract different component factors for the barriers to the active modes of transportation by using the principal component method and varimax rotation. After conducting EFA, a total of three components were extracted. These factor components were named as: Personal and Environmental Barriers to Active Travel (PEBAT), Infrastructural and Social Barriers to Active Travel (ISBAT), and Affluence-Related Barriers to Active Travel (ARBAT), as shown in Table 2.
       
    
    Table 2.
    Results of EFA for barriers to active modes of transportation.
  
The factor PEBAT includes variables related to personal hygiene practices, environmental conditions, and perceived safety. In general, most of the commuters show disagreement with the PEBAT factors. The ISBAT factor includes observed variables related to perceived behavioral and infrastructure characteristics. Most of the commuters show a high level of agreement with the ISBAT factors; therefore, improving these factors is essential to promote AT patterns. The ARBAT factor includes variables related to the higher wealth status of the commuters.
Factors with factor loadings values less than the cut-off value of 0.5 [,] were excluded from the analysis. The Kaiser-Meyer-Olkin (KMO) test for sampling adequacy yielded a value of 0.797, which is approximately equal to the recommended value of 0.8 []. Bartlett’s Test of Sphericity was highly significant (χ2(105) = 1189.032, p < 0.001) [], indicating that the correlation among variables was sufficient for factor analysis. Furthermore, Cronbach’s alpha values for all the extracted factors were above 0.65, indicating an adequate level of internal consistency [].
In addition to EFA, Confirmatory factor analysis (CFA) was conducted to examine the factorial structure of barriers to the use of AT. One observed factor (ISBAT3) from the ISBAT component had a standardized factor loading value of less than 0.4, so it was also removed during the CFA. The model showed a satisfactory fit, with CMIN/DF = 2.267, CFI = 0.925, GFI = 0.946, AGFI = 0.917, and RMSEA = 0.06, all of which met acceptable thresholds.
5.2. EFA for Barriers to the Use of Public Transport
The second EFA was conducted on commuters’ perceived barriers related to the use of PT. Three component factors were extracted after performing EFA, named as: Service Quality Barriers to Public Transport (SQPBT), Operational and Accessibility Barriers to Public Transport (OABPT), and Environmental and Safety Barriers to Public Transport (ESBPT), as shown in Table 3. Factors such as lack of comfort and convenience and inconvenience in the transfer of goods had factor loading values below 0.5 [,], and were therefore excluded from further analysis.
       
    
    Table 3.
    Results of exploratory factor analysis for barriers to public transport.
  
Most of the commuters show a high agreement level with the SQBPT factors. However, they did not report a high level of agreement with the OABPT factor, indicating OABPT is not as critical as the SQBPT in improving the rideability of PT. Commuters showed moderate agreement with the ESBPT factors, with their perceived importance falling between SQBPT and OABPT.
The percentage of variance explained by factors SQBPT, OABPT, and ESBPT is 16.676, 16.025, and 14.678, respectively. The value of the KMO test for barriers related to PT is found to be 0.838, which exceeds the recommended threshold of 0.8, indicating adequate sample adequacy []. Bartlett’s Test of Sphericity was also significant at less than 1% level (χ2(78) = 769, p < 0.001), confirming that sufficient correlation existed among variables [].
Furthermore, Cronbach’ alpha value for all extracted factors was above 0.59, indicating a satisfactory value of reliability and internal consistency in the collected data []. Additionally, CFA results (CMIN/DF = 1.385, GFI = 0.970, AGFI = 0.952, CFI = 0.971, RMSEA = 0.034) confirm a satisfactory model fit and convergence of the extracted factorial structure.
5.3. EFA for Technological Factors Encourages the Use of Public Transport
The third EFA was conducted on commuters’ perceived level of importance regarding various technological factors that encourage the adoption of PT, as shown in Table 4. EFA extracts only one factor for technological variables promoting PT adoption. The average value and factor loading indicate a high level of importance for mobile ticketing apps, park-and-ride services, automatic crowd management systems, dedicated bus lanes, travel time, and travel planning apps in encouraging PT use.
       
    
    Table 4.
    Results of EFA for technological factors encourage the use of public transport.
  
The extracted factor explains more than 50% of the variance. The KMO test value was found to be 0.825, indicating that the collected data were adequate []. Bartlett’s Test of Sphericity was found to be significant at the 1% level (χ2(15) = 619.33, p < 0.001), indicating that sufficient correlation exists among the variables. Furthermore, Cronbach’s alpha value was found to be 0.851, indicating a fairly high reliability in the collected data [].
5.4. Structural Equation Modeling
Two separate structural models were built to understand the association among extracted latent factors on each other, on the use of PT, and AT. The normality of the data was verified using skewness and kurtosis values, as covariance-based (CB) SEM analysis requires normally distributed data. The minimum and maximum skewness values for the dataset were −1.258 and 0.332, respectively, which fall within the acceptable criteria of −3 and +3 for SEM []. The kurtosis values ranged from −1.373 to 1.091, also falling within the acceptable range of −10 and +10 [].
When the data are normally distributed, CB SEM analysis is preferred. For non-normal data, partial least squares structural equation modeling (PLS-SEM) is recommended. As the data in this study follow a normal distribution, CB SEM analysis was performed using IBM SPSS AMOS 27.0 software with the maximum likelihood estimation method.
Structural model for barriers and intention to use PT:
The first structural model was developed to study the relationships among latent variables related to barriers to AT and PT, their association with intentions to use PT, and interrelationships among the latent constructs. This associational model was developed using the following hypothesis:
H1.  
The PEBAT is associated with commuters’ intentions to use PT.
H2.  
The ISBAT is associated with commuters’ intentions to use PT.
H3.  
The ARBAT is associated with commuters’ intentions to use PT.
H4.  
The SQBPT is associated with commuters’ intentions to use PT.
H5.  
The OABPT is associated with commuters’ intentions to use PT.
H6.  
The ESBPT is associated with commuters’ intentions to use PT.
H7.  
PEBAT has a significant relationship with ISBAT.
H8.  
ARBAT has a significant relationship with ISBAT.
H9.  
SQBPT has a significant relationship with OABPT.
H10.  
ESBPT has a significant relationship with OABPT.
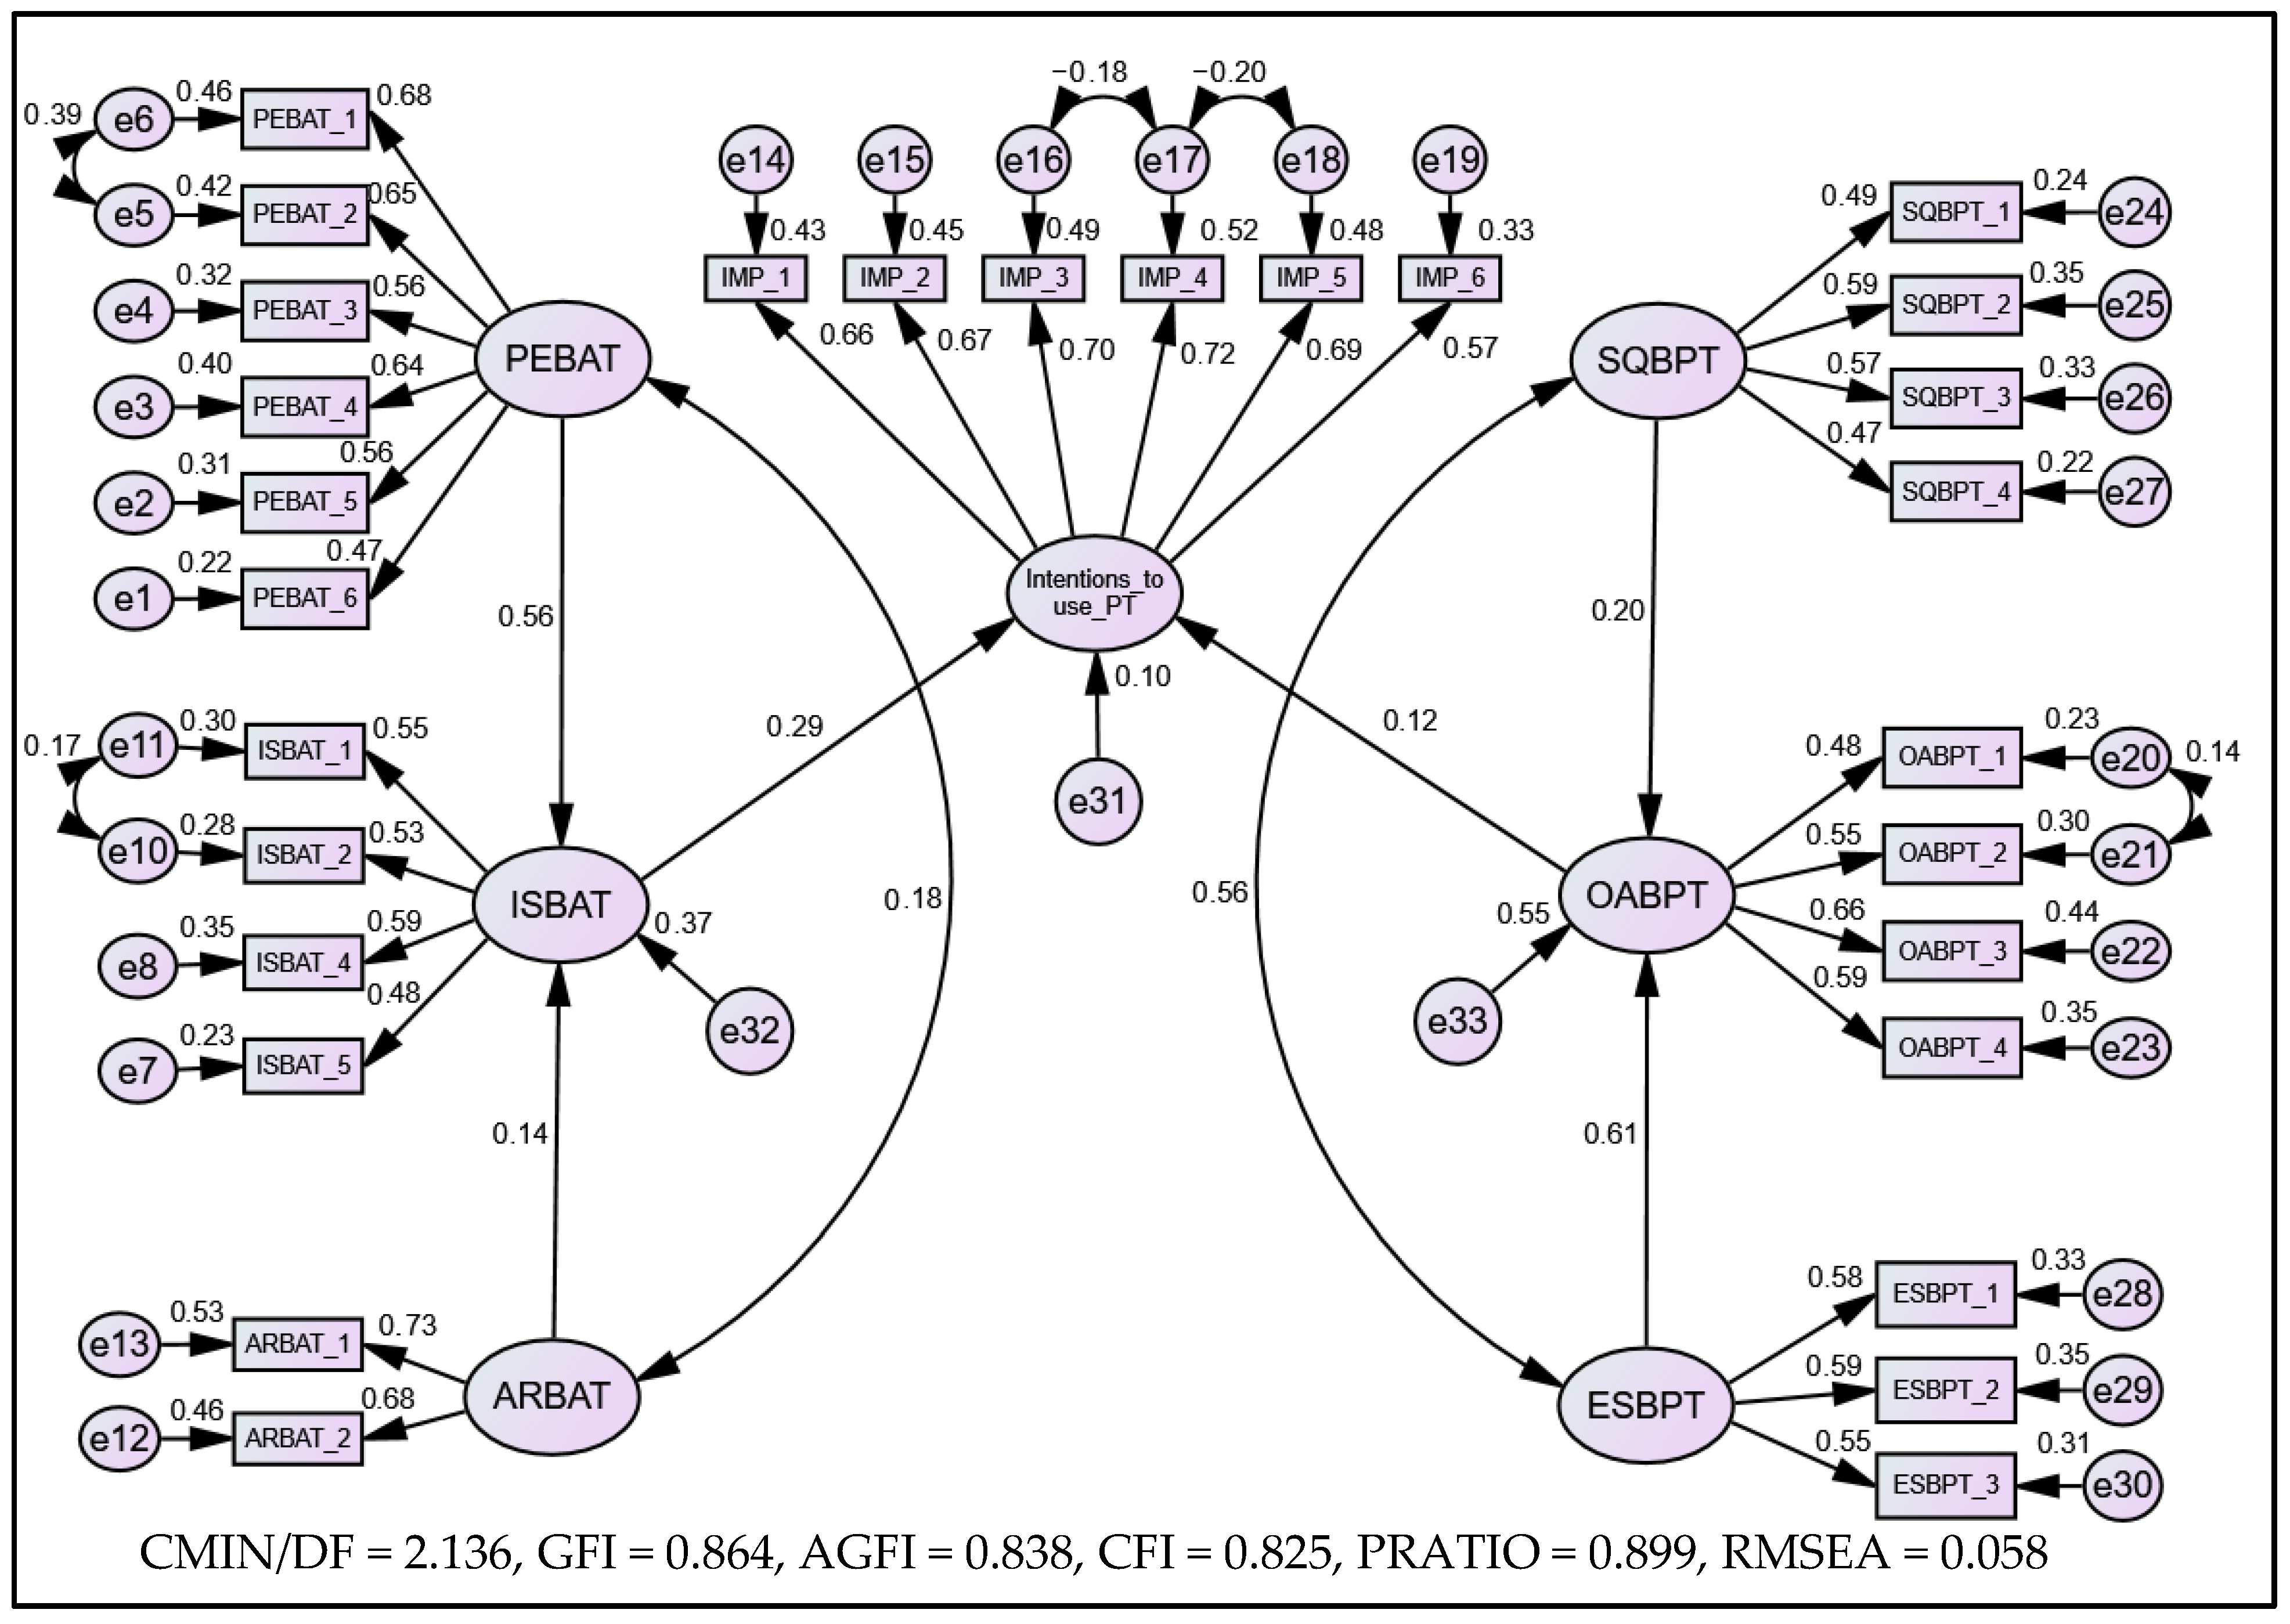
Figure 8 presents the path diagram of the developed structural model. All the measurement equations for latent variables were found to be significant at the 1% level of significance. The standardized loadings for the measurement model equations related to the intentions to use PT are found to be higher than 0.65, indicating that commuters place high importance on technological factors when considering the use of PT.
      
    
    Figure 8.
      Structural model for barriers and intention to use PT.
  
Within the PEBAT measurement model, three standardized loading values were above 0.64, while the rest were below 0.60. This indicates that factors such as perceived difficulty in taking a shower, changing clothes, and the risk of an accident while walking/cycling are the primary elements defining the PEBAT latent variable. The standardized loading for the ARBAT measurement model was approximately 0.7, suggesting that car ownership and higher income levels strongly influence the ARBAT construct. In the ISBAT measurement model, standardized loading for all observed variables was around 0.50, indicating that each observed variable contributes equally to the definition of ISBAT.
The ISBAT latent variable demonstrated a significant and positive structural relationship with the intention to use PT (β = 0.29, p < 0.01). This suggests that even with increased infrastructural and social barriers to active transport (PEBAT), commuters still show a moderately positive attitude towards using PT services, likely due to technological improvements. Addressing PEBAT-related barriers, such as reducing walking distance and time, providing secure bike parking, and reducing social stigma through awareness campaigns, could further enhance commuters’ attitudes towards using PT.
The variable OABPT also exhibits a significant, though weaker, positive relationship with the use of PT (β = 0.12, p < 0.073). This indicates that even in the presence of operational and accessibility barriers, commuters may still exhibit a mild inclination towards PT when technological improvements are made. Addressing OABPT issues, such as traffic congestion, facilities for people with disabilities, and minimizing excessive transfers, could improve the perceived usability of PT services.
Additionally, PEBAT showed a strong positive structural relationship with ISBAT (β = 0.56, p < 0.01), suggesting that an increase in personal and environmental barriers also contributes to an increase in infrastructural and social barriers to AT. Similarly, ARBAT exhibits a significant but weaker positive relationship with the ISBAT (β = 0.14, p < 0.078), implying that affluence-related factors may indirectly influence infrastructural and social barriers.
The variable SQBPT also showed a significant and positive association with OABPT (β = 0.20, p < 0.084), suggesting that a decline in service quality could lead to a perceived increase in operational and accessibility issues. Furthermore, ESBPT demonstrated a strong, significant, and positive relationship with OABPT barriers (β = 0.61, p < 0.01), indicating that environmental and safety concerns directly contribute to operational and accessibility problems.
Model fit statistics were within acceptable limits: the values χ2/DF and RMSEA indicated a good model fit. Although the values of GFI and CFI were slightly below the ideal threshold of 0.9, they remained within the acceptable range (above 0.8), as supported by previous literature [,,].
Evidence supports hypotheses H2, H5, H7, H8, H9, and H10, as statistically significant relationships were found for these structural paths. These findings suggest that improvements in infrastructural and social conditions can encourage commuters to use PT. Operational and accessibility barriers also play a direct role in shaping the intention to use PT. Furthermore, various types of barriers, such as personal, environmental, infrastructural, social, and affluence-related, are interconnected. When one type of barrier increases or decreases, it can influence the others.
However, hypotheses H1, H3, H4, and H6 were not supported, as the corresponding relationships were found to be statistically insignificant.
Structural model for barriers and intentions to use AT:
The second structural model was developed to examine the associations between barriers to AT and PT on commuter attitudes toward using active modes of travel. The following hypotheses were formulated to establish a causal structural equation model.
H11.  
PEBAT is associated with commuters’ attitudes towards using active modes.
H12.  
ISBAT is associated with commuters’ attitudes towards using active modes.
H13.  
ARBAT is associated with commuters’ attitudes towards using active modes.
H14.  
SQBPT is associated with commuters’ attitudes towards using active modes.
H15.  
OABPT is associated with commuters’ attitudes towards using active modes.
H16.  
ESBPT is associated with commuters’ attitudes towards using active modes.
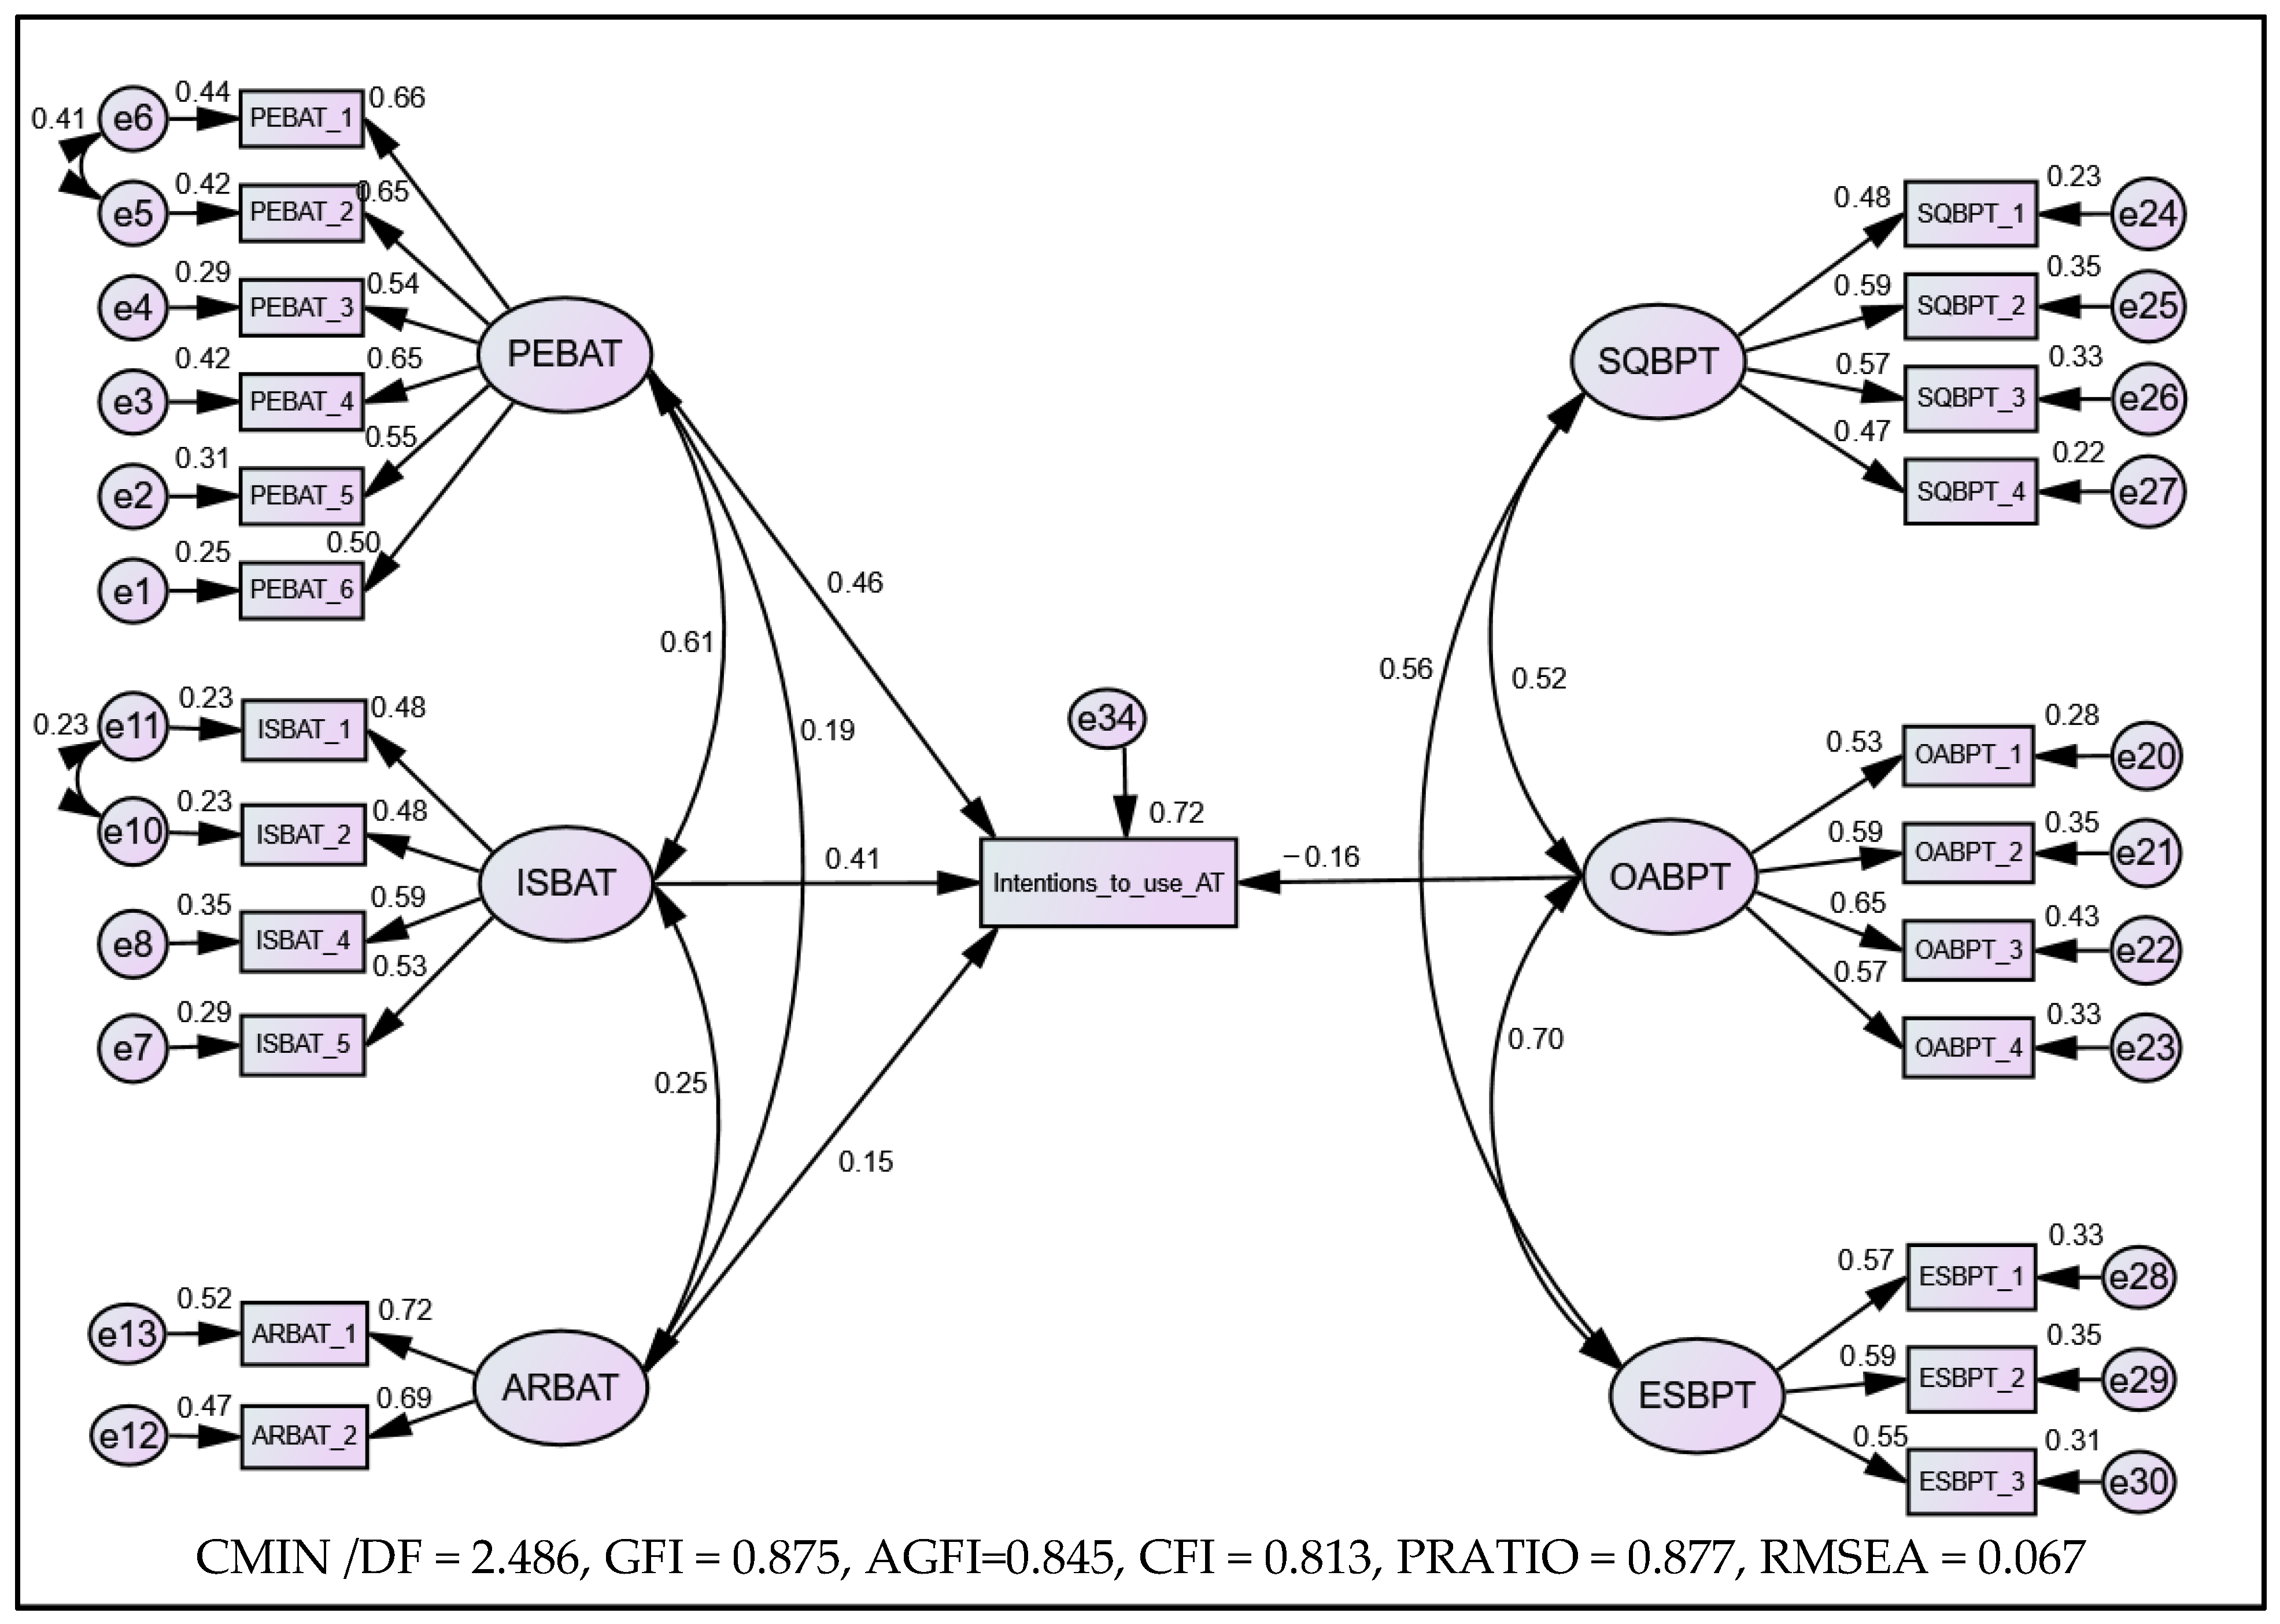
Figure 9 shows the corresponding path model. The latent variable PEBAT exhibits a significant and positive structural relationship with the intention to use active modes of transport (β = 0.46, p < 0.01), suggesting that even in the presence of personal and environmental barriers, commuters still maintain a positive attitude towards using AT when safe and well-maintained walking paths are available. This implies that addressing PEBAT barriers, such as the need for showers, concerns about clothing, and accident risks, could further enhance commuter willingness to use AT modes.
      
    
    Figure 9.
      Structural model for barriers and intentions to use AT.
  
Similarly, the latent variable ISBAT also demonstrates a positive and significant relationship to use AT (β = 0.41, p < 0.01), indicating that improving infrastructural and social aspects, such as safe bike lanes, pedestrian paths, and social acceptance, can positively influence commuter attitudes.
The latent variable ARBAT shows a weak but statistically significant positive relationship with attitude towards using AT (β = 0.15, p < 0.01). This suggests that even when affluence-related barriers (e.g., car ownership and high income) are present, commuters may still consider active modes if quality infrastructure exists.
The structural estimate for the latent variables SQBPT and ESBPT was found to be insignificant, so both measurements were excluded from the Path diagram. However, the structural estimate for OABPT was significant and negatively related to attitude towards using active modes (β = −0.16, p < 0.01). This indicates that an increase in operational and accessibility barriers to PT may discourage commuters from adopting active modes, possibly due to an overall negative perception of sustainable transport systems.
In conclusion, hypotheses H11, H12, H13, and H15 are supported, as the corresponding latent variables (PEBAT, ISBAT, ARBAT, and OABPT) show significant association with attitude towards AT use. Conversely, hypotheses H14 and H16 are rejected due to the insignificant effects of SQBPT and ESBPT. This suggests that service quality, environmental, and safety issues in PT do not directly affect commuter preference for AT modes.
6. Discussion and Policy Implications
The survey results show that commuters in Islamabad and Rawalpindi use a diverse mix of transportation modes, with public transport (PT) being the predominant mode, followed by motorbikes and private cars. The dominance of PT among students is consistent with previous research []. Motorcycles are frequently used by entrepreneurs and private sector employees, reflecting a preference for flexibility and time efficiency. In contrast, private car use is more common among government employees, likely due to higher incomes and greater vehicle ownership. Female commuters often prefer ride-hailing services due to the convenience of doorstep pick-up, which better meets their mobility needs.
Despite the well-established health and environmental benefits of active transport (AT), a relatively small proportion of commuters choose it, consistent with trends in developing countries [,]. Notably, both private car users and AT users report higher satisfaction with their current modes, suggesting that satisfaction is not solely linked to cost but also to perceived convenience, comfort, and control over travel. Many commuters demonstrated a positive intention to adopt active modes, with ride-hailing users showing the highest willingness, particularly when supported by good-quality infrastructure.
Building on these mode choice patterns, it is essential to examine the underlying factors limiting AT adoption. The primary barriers are travel time and distance, corroborating earlier research [,,,]. In the twin cities, urban sprawl and dispersed land-use patterns increase average trip lengths, making AT practical mainly for short distances. Minimizing distances to PT stations and workplaces could enhance AT adoption. In addition, infrastructural gaps, such as the absence of pedestrian signals, sidewalk availability, and cycle lanes, combined with social stigma associated with AT, further restrict AT adoption [,,,]. Enhancing AT mobility requires universal accessibility for people with disabilities, older adults, and children, who are often overlooked in planning. A lack of secure cycle storage at PT stations, safety concerns, and the risk of traffic accidents also deter potential users [,,,]. Addressing these issues would require infrastructure upgrades and public awareness efforts.
To contextualize these findings within the broader literature, Table 5 compares AT barriers across developed and developing settings. Comparative evidence shows that barriers in the twin cities align more closely with developing regions, where long travel distances, poor infrastructure, safety risks, and social stigma are prevalent. In contrast, developed contexts mainly face physical and design-related barriers such as distance and walkway quality. These findings highlight that improving infrastructure and reshaping public perceptions are both essential to promote AT adoption.
       
    
    Table 5.
    Comparative overview of studies on barriers to active modes of transportation.
  
These results are consistent with the theory of planned behavior [], which posits that behavioral intention is shaped by subjective norms and perceived behavioral control. In this context, subjective norms (like social stigma towards walking), especially among higher-income groups, discourage individuals from choosing AT, while perceived behavioral control factors (like poor infrastructure and long travel distances) also reduce perceived control over AT use. Tackling both social and infrastructural barriers is therefore essential to promote AT.
While these factors explain the limited use of active modes, similar structural and perceptual issues also affect the adoption of PT in the twin cities. For PT, crowding during peak hours and limited accessibility are significant deterrents, as documented in earlier studies [,,,]. Crowding can be mitigated through an automatic passenger flow management system. Accessibility improvements such as park-and-ride facilities, feeder buses, and micro-mobility options like e-scooters and bike-sharing could enhance first- and last-mile connectivity. Travel time, comfort, and convenience remain critical drivers of PT choice [,,,], and these issues can be mitigated by providing dedicated bus lanes, transit priority signals, and seamless intermodal integration. In particular, the inconvenience of transferring goods is a more prominent concern for male commuters, especially those serving as heads of the family. Safety concerns, including crime risk, noise, and pollution, also reduce PT appeal [,,,]. Measures such as lighting, security cameras, and visible staff presence can enhance public confidence in PT.
Table 6 further illustrates how the PT barriers identified in this study correspond with patterns observed internationally. The results indicate that PT barriers in the twin cities resemble those in other developing areas, including overcrowding, poor accessibility, long travel times, and insufficient comfort. In contrast, developed contexts mainly face service-related issues such as scheduling, travel time, and transfer delays. These findings highlight that PT challenges here reflect broader structural issues in rapidly urbanizing regions, emphasizing the need for coordinated infrastructure, service improvements, and technology-based solutions.
       
    
    Table 6.
    Comparative overview of studies on barriers to public transport.
  
In addressing these challenges, technological solutions can play a transformative role. Key enablers identified in this study include a real-time travel planning app, access to safe and secure parking spaces near PT stations, a mobile ticketing app, crowd management sensors, and provision of dedicated bus lanes. The use of a travel planning app would reduce route ambiguity for visitors who are unfamiliar with the city’s layout and transit system. Likewise, mobile ticketing can streamline fare payments, reduce cash handling, and speed up boarding times, thereby improving user experience. Moreover, a crowd management system helps to regulate passenger density, reducing overcrowding during peak hours. Collectively, these technological advancements are expected to enhance the functionality and reliability of the PT system. Finally, these innovations would significantly promote the adoption of PT and contribute to overall transportation sustainability as per the SDGs.
Based on these findings, several policy actions are proposed to support the transition toward more sustainable and equitable urban mobility. The following policy recommendations are essential for improving travel sustainability and equitable access to transport in alignment with the SDGs:
Rebalance urban infrastructure—Shift from car-centric infrastructure developments (e.g., signal-free corridors) toward inclusive urban designs that support pedestrian and cyclist movement.
Improve pedestrian accessibility—Install pedestrian signals, maintain continuous sidewalks, and ensure PT stations are within walking distance of residential and commercial areas.
Promote cycling—Develop a connected network of safe cycling lanes and provide secure, free bicycle parking at PT stations.
Incentivize Public Transport use—Introduce measures such as app-based loyalty rewards or tax rebates to encourage greater PT adoption.
Leverage technology—Deploy real-time travel planning apps, mobile ticketing systems, and automatic crowd management tools to enhance convenience and reduce peak-hour congestion.
Target awareness campaigns—Launch awareness campaigns to highlight the environmental, health, and financial benefits of AT and PT, specifically targeting groups with low current usage, such as high-income professionals and suburban residents, to broaden adoption.
7. Conclusions
The use of active modes of transportation in the twin cities of Pakistan remains highly underutilized, despite their well-recognized health and environmental benefits. This study offers valuable insights into commuter travel patterns, barriers to active travel (AT) and public transport (PT), and the role of technological factors in enhancing PT adoption. Commuters who travel by private car or use active modes report the highest level of travel satisfaction, followed by motorbike users. Additionally, ride-hailing service users exhibit a higher intention to shift towards AT when safe and well-maintained walking paths are available.
Key deterrents to AT include excessive travel time and distance, inadequate infrastructure, social stigma, limited cycle storage at transit stations, safety concerns, heavy traffic, the need to carry goods, and higher household income. For PT, the most prominent barriers are overcrowding during peak hours, limited accessibility, prolonged travel time, low comfort, exposure to noise and pollution, and safety concerns.
Technological interventions such as real-time travel planning applications, secure parking near transit stations, mobile ticketing systems, automatic crowd management, and dedicated bus lanes are not merely supportive enhancements but strategic tools capable of addressing service quality gaps in existing PT systems. Their adoption can reduce travel uncertainty, improve reliability, and enhance passenger comfort, making PT a competitive alternative to private vehicles.
The findings are based on data from a single winter season (December 2024 to February 2025), when relatively cooler temperatures and shorter daylight hours may influence commuters’ willingness to use active and public transport. Travel preferences and mode choices may vary under different climatic or temporal conditions, particularly during the hot summer months when walking and cycling become less favorable. While the results are context-specific, the identified challenges and strategies are transferable to other urban areas with similar socioeconomic and infrastructural contexts. Given that peak-hour overcrowding emerged as a critical issue, further studies should incorporate traffic count data at PT stations and analyze it with transport planning software such as PTV Visum to quantify peak-hour demand accurately. Furthermore, spatial accessibility challenges within the twin cities should be examined using geographic information system (GIS) tools like ArcGIS to identify underserved neighborhoods. Future research should incorporate multi-season or year-round data collection to better capture seasonal variations in travel behavior and transport mode preferences.
It is also acknowledged that the cross-sectional nature of this study limits the ability to draw causal inferences from the SEM results. The estimated paths represent statistical associations among latent constructs, and alternative causal directions may exist, whereby commuters’ attitudes and perceived barriers could influence each other simultaneously. These insights are crucial for policymakers aiming to address existing barriers and develop an effective Sustainable Urban Mobility Plan (SUMP) aligned with the UN SDGs.
Author Contributions
Conceptualization, Q.T. and M.A.J.; methodology, Q.T., M.A.K. and M.S.R.; software, Q.T.; validation, M.A.K., M.S.R. and M.A.J.; formal analysis, Q.T.; investigation, Q.T.; resources, M.A.K. and M.S.R.; data curation, Q.T. and M.S.R.; writing—original draft preparation, Q.T. and M.A.J.; writing—review and editing, M.A.K., M.S.R. and M.A.J.; visualization, Q.T.; supervision, M.A.K., M.S.R. and M.A.J.; project administration, M.S.R. and M.A.K.; funding acquisition, M.A.K. All authors have read and agreed to the published version of the manuscript.
Funding
This work was supported and funded by the Deanship of Scientific Research at Imam Mohammad Ibn Saud Islamic University (IMSIU) (grant number IMSIU-DDRSP2502).
Institutional Review Board Statement
The study was conducted in accordance with the Declaration of Helsinki and approved by the Institutional Review Board (106/Civil/Eth, date of approval 2 October 2024).
Informed Consent Statement
Informed consent was obtained from all subjects involved in the study.
Data Availability Statement
The data that support the findings of this study are available from the corresponding author upon reasonable request.
Acknowledgments
The authors wish to express their gratitude to the Civil Engineering Department at the National University of Technology (NUTECH) and Imam Mohammad Ibn Saud Islamic University for their invaluable support, which played a vital role in the successful completion of this research.
Conflicts of Interest
The authors declare that they have no conflicts of interest.
Abbreviations
The following abbreviations are used in this manuscript:
      
| AGFI | Adjusted Goodness-of-Fit Index | 
| ARBAT | Affluence-Related Barriers to Active Travel | 
| AT | Active Travel | 
| CB | Covariance-Based | 
| CFA | Confirmatory factor analysis | 
| CFI | Comparative Fit Index | 
| CMIN/DF | Chi-square to degree of freedom ratio | 
| EFA | Exploratory factor analysis | 
| ESBPT | Environmental and Safety Barriers to Public Transport | 
| GFI | Goodness-of-Fit Index | 
| GHG | Greenhouse Gas | 
| ISBAT | Infrastructural and Social Barriers to Active Travel | 
| KMO | Kaiser-Meyer-Olkin | 
| NEQS | National Environmental Quality Standards | 
| OABPT | Operational and Accessibility Barriers to Public Transport | 
| PEBAT | Personal and Environmental Barriers to Active Travel | 
| PLS-SEM | Partial Least Squares Structural Equation Modeling | 
| PT | Public Transport | 
| RMSEA | Root mean squared error of approximation | 
| RTI | Real Time Information | 
| SDGs | Sustainable Development Goals | 
| SEDs | Socioeconomic Demographics | 
| SEM | Structural Equation model | 
| SQBPT | Service Quality Barriers to Public Transport | 
| SUMP | Sustainable Urban Mobility Plan | 
| TSP | Transit Signal Priority | 
| UN | United Nation | 
References
- Armah, F.A.; Yawson, D.O.; Pappoe, A.A. A systems dynamics approach to explore traffic congestion and air pollution link in the city of Accra, Ghana. Sustainability 2010, 2, 252–265. [Google Scholar] [CrossRef]
 - Kahn, M.E. Green Cities: Urban Growth and the Environment; Rowman & Littlefield: Lanham, MD, USA, 2007. [Google Scholar]
 - Vallero, D. Chapter 29—Air Pollutant Emissions. In Fundamentals of Air Pollution, 5th ed.; Vallero, D., Ed.; Academic Press: Boston, MA, USA, 2014; pp. 787–827. [Google Scholar]
 - Manisalidis, I.; Stavropoulou, E.; Stavropoulos, A.; Bezirtzoglou, E. Environmental and health impacts of air pollution: A review. Front. Public Health 2020, 8, 14. [Google Scholar] [CrossRef]
 - Ali, M.; Macioszek, E.; Ali, N. Travel Mode Choice Prediction to Pursue Sustainable Transportation and Enhance Health Parameters Using R. Sustainability 2024, 16, 5908. [Google Scholar] [CrossRef]
 - Danilevičius, A.; Karpenko, M.; Křivánek, V. Research on the Noise Pollution from Different Vehicle Categories in the Urban Area. Transport 2023, 38, 1–11. [Google Scholar] [CrossRef]
 - Karpenko, M.; Prentkovskis, O.; Skačkauskas, P. Analysing the impact of electric kick-scooters on drivers: Vibration and frequency transmission during the ride on different types of urban pavements. Eksploat. I Niezawodn.–Maint. Reliab. 2025, 27, 199893. [Google Scholar] [CrossRef]
 - Department of Economic and Social Affairs. Progress Towards the Sustainable Development Goals_Report of the Secretary-General 2024; Department of Economic and Social Affairs: New York, NY, USA, 2024. [Google Scholar]
 - United Nations, New York. Independent Group of Scientists Appointed by the Secretary-General, Global Sustainable Development Report 2023: Times of Crisis, Times of Change: Science for Accelerating Transformations to Sustainable Development; United Nations: New York, NY, USA, 2023. [Google Scholar]
 - Rasheed, A.; Aneja, V.P.; Aiyyer, A.; Rafique, U. Measurements and analysis of air quality in Islamabad, Pakistan. Earth’s Future 2014, 2, 303–314. [Google Scholar] [CrossRef]
 - Shahid, I.; Chishtie, F.; Bulbul, G.; Shahid, M.Z.; Shafique, S.; Lodhi, A. State of air quality in twin cities of Pakistan: Islamabad and Rawalpindi. Atmósfera 2019, 32, 71–84. [Google Scholar] [CrossRef]
 - Khokhar, M.F.; Mehdi, H.; Abbas, Z.; Javed, Z. Temporal Assessment of NO2 Pollution Levels in Urban Centers of Pakistan by Employing Ground-Based and Satellite Observations. Aerosol Air Qual. Res. 2016, 16, 1854–1867. [Google Scholar] [CrossRef]
 - Sánchez-Triana, E.; Enriquez, S.; Afzal, J.; Nakagawa, A.; Shuja Khan, A. Cleaning Pakistan’s Air: Policy Options to Address the Cost of Outdoor Air Pollution; World Bank: Washington, DC, USA, 2014. [Google Scholar]
 - Neelum, S.; Panezai, S.; E Saqib, S. Exploring cause, Effects and possible solutions of traffic congestion in Pakistan: The case study of Quetta Metropolitan city. Jilin Daxue Xuebao (Gongxueban)/J. Jilin Univ. (Eng. Technol. Ed.) 2023, 42, 354–379. [Google Scholar] [CrossRef]
 - Raza, A.; Ali, M.U.; Ullah, U.; Fayaz, M.; Alvi, M.J.; Kallu, K.D.; Zafar, A.; Nengroo, S.H. Evaluation of a Sustainable Urban Transportation System in Terms of Traffic Congestion—A Case Study in Taxila, Pakistan. Sustainability 2022, 14, 12325. [Google Scholar] [CrossRef]
 - Cheng, Y.; Watkins, S.J.; Anciaes, P. Chapter Six—What interventions are effective in reducing congestion? In Advances in Transport Policy and Planning; Mindell, J.S., Watkins, S.J., Eds.; Academic Press: Boston, MA, USA, 2024; Volume 13, pp. 201–229. [Google Scholar]
 - van Mil, J.F.P.; Leferink, T.S.; Annema, J.A.; van Oort, N. Insights into factors affecting the combined bicycle-transit mode. Public Transp. 2020, 13, 649–673. [Google Scholar] [CrossRef]
 - Black, W.R. Sustainable Transportation Problems and Solutions; Guilford Press: New York, NY, USA, 2010. [Google Scholar]
 - Mehdizadeh, M.; Nordfjaern, T.; Mamdoohi, A. Environmental norms and sustainable transport mode choice on children’s school travels: The norm-activation theory. Int. J. Sustain. Transp. 2019, 14, 137–149. [Google Scholar] [CrossRef]
 - IPCC. Emissions Trends and Drivers. In IPCC, 2022: Climate Change 2022: Mitigation of Climate Change. Contribution of Working Group III to the Sixth Assessment Report of the Intergovernmental Panel on Climate Change; Cambridge University Press: Cambridge, UK; New York, NY, USA, 2022. [Google Scholar]
 - Samaras, Z.; Vouitsis, I. 3.13—Transportation and Energy. In Climate Vulnerability; Pielke, R.A., Ed.; Academic Press: Oxford, UK, 2013; pp. 183–205. [Google Scholar]
 - Ghimire, S.; Bardaka, E. Active travel among carless and car-owning low-income populations in the United States. Transp. Res. Part D Transp. Environ. 2023, 117, 103627. [Google Scholar] [CrossRef]
 - Ribeiro, P.; Fonseca, F.; Meireles, T. Sustainable mobility patterns to university campuses: Evaluation and constraints. Case Stud. Transp. Policy 2020, 8, 639–647. [Google Scholar] [CrossRef]
 - Stein, P.P.; Rodrigues da Silva, A.N. Barriers, motivators and strategies for sustainable mobility at the USP campus in São Carlos, Brazil. Case Stud. Transp. Policy 2018, 6, 329–335. [Google Scholar] [CrossRef]
 - Yanar, T. Understanding the choice for sustainable modes of transport in commuting trips with a comparative case study. Case Stud. Transp. Policy 2023, 11, 100964. [Google Scholar] [CrossRef]
 - Bruner, B.; Rickwood, G.; Shwed, A.; Karvinen, K.; Levesque, L.; Mantha, S.; Raymer, G. Child and parent perspectives on active school transportation: Barriers and facilitators in a northern environment. J. Transp. Health 2023, 33, 101708. [Google Scholar] [CrossRef]
 - Tatah, L.; Obonyo, C.; Wasnyo, Y.; Pearce, M.; Mbanya, J.C.; Oni, T.; Foley, L.; Woodcock, J.; Assah, F. Travel Behaviour and Barriers to Active Travel among Adults in Yaoundé, Cameroon. Sustainability 2022, 14, 9092. [Google Scholar] [CrossRef]
 - Fondzenyuy, S.K.; Jackai, I.N.; Feudjio, S.L.T.; Usami, D.S.; Gonzalez-Hernández, B.; Wounba, J.F.; Elambo, N.G.; Persia, L. Assessment of Sustainable Mobility Patterns of University Students: Case of Cameroon. Sustainability 2024, 16, 4591. [Google Scholar] [CrossRef]
 - Sultan, B.; Katar, I.M.; Al-Atroush, M.E. Towards sustainable pedestrian mobility in Riyadh city, Saudi Arabia: A case study. Sustain. Cities Soc. 2021, 69, 102831. [Google Scholar] [CrossRef]
 - Kim, S.; Park, S.; Lee, J.S. Meso- or micro-scale? Environmental factors influencing pedestrian satisfaction. Transp. Res. Part D Transp. Environ. 2014, 30, 10–20. [Google Scholar] [CrossRef]
 - Abdulsamad, Q.; Mohammed, J.; Abdullah, P. Evaluation of the Existing Sidewalks in Duhok City. J. Univ. Duhok 2019, 22, 58–74. [Google Scholar] [CrossRef]
 - Matias, I.; Santos, B.; Virtudes, A. Making Cycling Spaces in Hilly Cities. KnE Eng. 2020, 5, 152–165. [Google Scholar] [CrossRef]
 - Koh, P.P.; Wong, Y.D. Comparing pedestrians’ needs and behaviours in different land use environments. J. Transp. Geogr. 2013, 26, 43–50. [Google Scholar] [CrossRef]
 - Wex, I.; Geserick, M.; Leibert, T.; Igel, U.; Sobek, C.; Meigen, C.; Kiess, W.; Vogel, M. Active school transport in an urban environment:prevalence and perceived barriers. BMC Public Health 2023, 23, 557. [Google Scholar] [CrossRef] [PubMed]
 - Zhao, P.; Li, S.; Li, P.; Liu, J.; Long, K. How does air pollution influence cycling behaviour? Evidence from Beijing. Transp. Res. Part D Transp. Environ. 2018, 63, 826–838. [Google Scholar] [CrossRef]
 - Masoumi, H.E. A discrete choice analysis of transport mode choice causality and perceived barriers of sustainable mobility in the MENA region. Transp. Policy 2019, 79, 37–53. [Google Scholar] [CrossRef]
 - Hasan, R.A.; Abbas, A.H.; Kwayu, K.M.; Oh, J.-S. Role of social dimensions on active transportation and environmental protection: A survey at the University of Samarra, Iraq. J. Transp. Health 2019, 14, 100564. [Google Scholar] [CrossRef]
 - Baig, M.H.; Rana, I.A.; Waheed, A. An index-based approach for understanding gender preferences in active commuting: A case study of Islamabad, Pakistan. Case Stud. Transp. Policy 2021, 9, 600–607. [Google Scholar] [CrossRef]
 - Anwar, A.H.M.M.; Toasin Oakil, A.; Muhsen, A.; Arora, A. What would it take for the people of Riyadh city to shift from their cars to the proposed metro? Case Stud. Transp. Policy 2023, 12, 101008. [Google Scholar] [CrossRef]
 - Ismael, K.; Duleba, S. An Integrated Ordered Probit Model for Evaluating University Commuters’ Satisfaction with Public Transport. Urban Sci. 2023, 7, 83. [Google Scholar] [CrossRef]
 - Ruiz-Padillo, A.; de Ona, J. Analysis of the relationships among infrastructure, operation, safety, and environment aspects that influence public transport users: Case study of university small and medium sized cities in Brazil. Transp. Res. Part A Policy Pract. 2024, 185, 104115. [Google Scholar] [CrossRef]
 - Börjesson, M.; Rubensson, I. Satisfaction with crowding and other attributes in public transport. Transp. Policy 2019, 79, 213–222. [Google Scholar] [CrossRef]
 - Mayo, F.L.; Taboada, E.B. Ranking factors affecting public transport mode choice of commuters in an urban city of a developing country using analytic hierarchy process: The case of Metro Cebu, Philippines. Transp. Res. Interdiscip. Perspect. 2020, 4, 100078. [Google Scholar] [CrossRef]
 - Yavuz, N.; Welch, E.W. Addressing fear of crime in public space: Gender differences in reaction to safety measures in train transit. Urban Stud. 2010, 47, 2491–2515. [Google Scholar] [CrossRef] [PubMed]
 - Tavares, V.B.; Lucchesi, S.T.; Larranaga, A.M.; Cybis, H.B.B. Influence of public transport quality attributes on user satisfaction of different age cohorts. Case Stud. Transp. Policy 2021, 9, 1042–1050. [Google Scholar] [CrossRef]
 - van Lierop, D.; El-Geneidy, A. Enjoying loyalty: The relationship between service quality, customer satisfaction, and behavioral intentions in public transit. Res. Transp. Econ. 2016, 59, 50–59. [Google Scholar] [CrossRef]
 - Shrestha, B.P.; McDonald, M.; Millonig, A.; Hounsell, N.B. Review of Public Transport Needs of Older People in European Context. J. Popul. Ageing 2017, 10, 343–361. [Google Scholar] [CrossRef]
 - Ghanim, M.S.; Abu-Lebdeh, G. Real-Time Dynamic Transit Signal Priority Optimization for Coordinated Traffic Networks Using Genetic Algorithms and Artificial Neural Networks. J. Intell. Transp. Syst. 2015, 19, 327–338. [Google Scholar] [CrossRef]
 - Macedo, E.; Teixeira, J.; Sampaio, C.; Silva, N.; Coelho, M.C.; Glinos, M.; Bandeira, J.M. Real-time information systems for public transport: User perspective. Transp. Res. Procedia 2021, 52, 732–739. [Google Scholar] [CrossRef]
 - Watkins, K.E.; Ferris, B.; Borning, A.; Rutherford, G.S.; Layton, D. Where Is My Bus? Impact of mobile real-time information on the perceived and actual wait time of transit riders. Transp. Res. Part A Policy Pract. 2011, 45, 839–848. [Google Scholar] [CrossRef]
 - Altay, B.C.; Okumuş, A. User adoption of integrated mobility technologies: The case of multimodal trip-planning apps in Turkey. Res. Transp. Bus. Manag. 2022, 43, 100706. [Google Scholar] [CrossRef]
 - Bieler, M.; Skretting, A.; Budinger, P.; Gronli, T.-M. Survey of Automated Fare Collection Solutions in Public Transportation. IEEE Trans. Intell. Transp. Syst. 2022, 23, 14248–14266. [Google Scholar] [CrossRef]
 - Little, T.D.; Stickley, Z.L.; Rioux, C.; Wu, W. Quantitative research methods. In Encyclopedia of Adolescence, 2nd ed.; Troop-Gordon, W., Neblett, E.W., Eds.; Academic Press: Oxford, UK, 2024; pp. 403–417. [Google Scholar]
 - GOP. Household Integrated Economic Survey (HIES) 2018-19; GOP: San Antonio, TX, USA, 2019. [Google Scholar]
 - Pakistan Bureau of Statistics. 7th Population and Housing Census-2023 (The First-Ever Digital Census of Pakistan); Pakistan Bureau of Statistics: Islamabad, Pakistan, 2023. [Google Scholar]
 - Bentler, P.M.; Chou, C.-P. Practical Issues in Structural Modeling. Sociol. Methods Res. 1987, 16, 78–117. [Google Scholar] [CrossRef]
 - Kline, R.B. Principles and Practice of Structural Equation Modeling; Guilford Publications: New York, NY, USA, 2023. [Google Scholar]
 - Hair, J.; Black, W.; Babin, B.; Anderson, R. Multivariate Data Analysis: A Global Perspective, 7th ed.; Pearson Prentice Hall: Hoboken, NJ, USA, 2010. [Google Scholar]
 - Lawley, D.N.; Maxwell, A.E. Factor Analysis as a Statistical Method, 2nd ed.; Butterworths London: London, UK, 1963; Volume 18. [Google Scholar]
 - Goldberg, L.R.; Velicer, W.F. Principles of exploratory factor analysis. Differ. Norm. Abnorm. Personal. 2006, 2, 209–337. [Google Scholar]
 - Rahman, F.; Das, T.; Hadiuzzaman, M.; Hossain, S. Perceived service quality of paratransit in developing countries: A structural equation approach. Transp. Res. Part A Policy Pract. 2016, 93, 23–38. [Google Scholar] [CrossRef]
 - Hooper, D.; Coughlan, J.; Mullen, M.R. Structural Equation Modelling Guidelines for determining model fit. Electron. J. Bus. Res. Methods 2008, 6, 53–60. [Google Scholar] [CrossRef]
 - Sahoo, M. Structural Equation Modeling: Threshold Criteria for Assessing Model Fit. In Methodological Issues in Management Research: Advances, Challenges, and the Way Ahead; Subudhi, R.N., Mishra, S., Eds.; Emerald Publishing Limited: Cambridge, MA, USA, 2019; pp. 269–276. [Google Scholar] [CrossRef]
 - Farooq, A.S.; Javid, M.A.; Hassan, M.K.; Anwer, I. Evaluating the carpooling potential among travelers in the suburbs of Islamabad considering carpooling clubs, monetary incentives, and digital apps. Res. Transp. Bus. Manag. 2025, 60, 101363. [Google Scholar] [CrossRef]
 - Javid, M.A.; Tahir, Q.; Khan, B.A.; Ammar, M.M.; Mehdi, Y.; Ali, N. Customers’ Satisfaction and Intentions with Public Transportation in Faisalabad, Pakistan: Implications for a Bus Rapid Transit Service. Trans. Transp. Sci. 2024, 15, 28–39. [Google Scholar] [CrossRef]
 - Field, A. Discovering Statistics Using SPSS, 4th ed.; Sage Publications Limited: London, UK, 2013. [Google Scholar]
 - Shrestha, N. Factor analysis as a tool for survey analysis. Am. J. Appl. Math. Stat. 2021, 9, 4–11. [Google Scholar] [CrossRef]
 - Taber, K.S. The Use of Cronbach’s Alpha When Developing and Reporting Research Instruments in Science Education. Res. Sci. Educ. 2018, 48, 1273–1296. [Google Scholar] [CrossRef]
 - Brown, T.A. Confirmatory Factor Analysis for Applied Research; The Guilford Press: New York, NY, USA, 2006. [Google Scholar]
 - Doll, W.J.; Xia, W.; Torkzadeh, G. A Confirmatory Factor Analysis of the End-User Computing Satisfaction Instrument. MIS Q. 1994, 18, 453–461. [Google Scholar] [CrossRef]
 - Hu, L.-T.; Bentler, P.M. Evaluating Model Fit; Sage Publications, Inc.: Thousand Oaks, CA, USA, 1995. [Google Scholar]
 - Baumgartner, H.; Homburg, C. Applications of structural equation modeling in marketing and consumer research: A review. Int. J. Res. Mark. 1996, 13, 139–161. [Google Scholar] [CrossRef]
 - Adriana, M.C.; Situmorang, R.; Aji, B.J. Exploring the transport mode choice of University students in Jakarta: A case study of Universitas Trisakti. Spatium 2023, 49, 20–29. [Google Scholar] [CrossRef]
 - Ek, K.; Wårell, L.; Andersson, L. Motives for walking and cycling when commuting—Differences in local contexts and attitudes. Eur. Transp. Res. Rev. 2021, 13, 46. [Google Scholar] [CrossRef] [PubMed]
 - Kajosaari, A.; Ramezani, S.; Rinne, T. Built environment and seasonal variation in active transportation: A longitudinal, mixed-method study in the Helsinki Metropolitan Area. J. Transp. Health 2022, 27, 101511. [Google Scholar] [CrossRef]
 - Ajzen, I. The Theory of Planned Behavior. Organ. Behav. Hum. Decis. Process. 1991, 50, 179–211. [Google Scholar] [CrossRef]
 - Hasan, U.; Whyte, A.; Al Jassmi, H. Public bus transport service satisfaction: Understanding its value to urban passengers towards improved uptake. Trans. Transp. Sci. 2021, 12, 25–37. [Google Scholar] [CrossRef]
 - Li, L.; Gao, T.; Yu, L.; Zhang, Y. Applying an integrated approach to metro station satisfaction evaluation: A case study in Shanghai, China. Int. J. Transp. Sci. Technol. 2022, 11, 780–789. [Google Scholar] [CrossRef]
 - Lunke, E.B. Commuters’ satisfaction with public transport. J. Transp. Health 2020, 16, 100842. [Google Scholar] [CrossRef]
 
Disclaimer/Publisher’s Note: The statements, opinions and data contained in all publications are solely those of the individual author(s) and contributor(s) and not of MDPI and/or the editor(s). MDPI and/or the editor(s) disclaim responsibility for any injury to people or property resulting from any ideas, methods, instructions or products referred to in the content.  | 
© 2025 by the authors. Licensee MDPI, Basel, Switzerland. This article is an open access article distributed under the terms and conditions of the Creative Commons Attribution (CC BY) license (https://creativecommons.org/licenses/by/4.0/).