Abstract
Recent research has increasingly emphasized the synergies between Supply Chain Management Practices (SCMPs) and Quality Management Principles (QMPs), particularly through the emerging concept of Supply Chain Quality Management (SCQM). Despite this recognition, empirical evidence on how these practices interact to influence performance remains very limited, especially in the context of developing countries. This study addresses the gap by interviewing 70 Tunisian agri-food companies to investigate the relationships between five dimensions of SCMP, strategic supplier partnerships, customer relationship, information sharing, information quality and postponement, and the seven principles of ISO9001 QMP: leadership, engagement of people, improvement, customer focus, process approach, evidence-based decision making, and relationship management. Using factor analysis and structural equation modelling, the study explores the mediating role of competitive advantage (CA): price/cost, product quality, product innovation, delivery dependability and time-to-market—on operational performance. The findings indicate that analyzing SCMP, QMP, and CA as aggregated blocks does not produce significant explanatory correlations. Instead, judiciously reorganizing their sub-constructs into five integrated groups provides a more effective model: (1) information and decision capacity, (2) customer-centric innovation, (3) process management and agility, (4) supplier and network management, and (5) leadership and workforce engagement. This integrated classification offers managers a coherent framework for implementing SCMP and QMP to enhance competitiveness results.
1. Introduction
1.1. Background and Research Motivation
The integration of Supply Chain Management (SCM) and Quality Management (QM) is critical for firms, particularly those operating within global, multi-organizational networks. While SCM provides the structural framework for flows, the ultimate performance of the network is shaped by the underlying quality culture of each participating entity. In such global supply chains, final quality emerges as the result of synergy—or, conversely, systemic entropy, arising from the degree of alignment among the individual Quality Management Systems (QMS) of the actors. Consequently, SCM and QM constitute two fundamental strategic approaches in business and industrial management, both widely acknowledged as essential prerequisites for organizational success and the attainment of competitive advantage (CA). Although they address different dimensions of management, the two approaches converge on shared objectives, most notably the enhancement of organizational performance and the fulfillment of stakeholder expectations [1].
The concepts of SCM and QM have been widely discussed in the literature, either independently or, more recently, in an integrated manner commonly under the concept of Supply Chain Quality Management (SCQM) as a strategic approach that helps a company coordinate its operations with suppliers and customers to improve overall quality [1,2].
Using data from 164 plants in the machinery, electronics, and transportation component industries across the USA, Germany, Italy, Japan, and England, Flynn and Flynn [3] examined how the simultaneous pursuit of supply chain and quality objectives fosters the development of cumulative capabilities. Their study explored the link between QM practices and supply chain performance, with particular attention to a specific set of practices known as co-makership and their impact on performance outcomes.
Based on 81 managers of the survey of Taiwan’s top 500 corporations, Kuei et al. [4] reports the perception of managers about the association between supply chain quality factors and organizational performance. Statistical tests show that perceived improvements in organizational performance are associated with improvements in SCQM practices.
Robinson and Malhotra [5] provide a thematic overview of research on quality and SCM. They classify the SCQM literature into two categories: (1) intra-organizational coordination, focusing on traditional QM within the internal supply chain, and (2) inter-organizational integration, linking quality practices with supply chain processes in an external context. Similarly, Foster [6] completes a literature review to characterize SCQM and to identify that the key QM content variables identified in SCQM are customer focus, quality practices, supplier relations, leadership, human resources practices, business results, and safety.
Sampaio et al. [7] developed a research model examining how SCQM practices influence firm performance. Drawing from an extensive literature review, they identified four key SCQM dimensions: upstream (supplier assessment and QM, downstream (customer focus), internal processes (design, process management and logistics), and support practices (leadership, human resources, and integration). Firm performance was evaluated in three areas: operational efficiency, customer satisfaction, and financial results.
Soares et al. [8], through a web-based survey of 325 UK manufacturing companies, provided statistical evidence of the overall positive influence of SCQM practices on quality, although the effectiveness of individual practices differed, with the focus of the customer exerting the greatest impact. Bastas and Liyanage [9] examined the state-of-the-art literature on the integration of QM (with its intra-organizational orientation), SCM (with its inter-organizational perspective), and sustainability practices. Similarly, Vanichchinchai [10] conducted an extensive review and categorized the SCM and QM frameworks into four types—Qualifier, Improver, Extender, and Winner—according to their level of generality (specific or generic) and scope (narrow or broad). Zhou and Li [11] examined the impact of SCQM practices on firm competitiveness, focusing on the role of supply chain capabilities.
In more recent studies, alternative forms of SCQM have been explored. Some authors incorporate additional concepts alongside SCMP and QMP, such as Industry 4.0 such as in [12,13,14,15], and [16], Digital Intelligence [17]. Other researchers integrate additional performance indicators, such as sustainability measures such as in [18,19], and [20], or green SCM practices such as in [21] to evaluate the synergies between SCMP and QMP and their impact on operational and organizational performance.
The previous comprehensive review of the literature shows that numerous studies have investigated the impact of the SCQM concept and practices—together with its key components, SCM and QM—on operational and organizational performance and CA. Most of these studies propose or adopt specific models, as developing a single, universal theoretical framework that links SCM, QM, CA and related concepts remains a complex challenge. This complexity arises because the interrelationships among these concepts are strongly influenced by the structure of the supply chain and the characteristics of the industry being studied.
In the context of food supply chains and from a theoretical development perspective, Burgess et al. [19] conducted a comprehensive systematic review of the literature of 78 studies, identifying 103 SCQM practices and analyzing their relevance in terms of (a) location, production and producer characteristics, and (b) their link to (bio)processes. Similarly, Al-Husain et al. [20] addressed a research gap by investigating how QM practices in food supply chains can be integrated with digital technologies to improve sustainable performance in the Egyptian hospitality and tourism sector. From an empirical point of view, Kuwornu et al. [18], through a survey of 126 food companies in Bangkok, showed that both internal and external sustainable SCMP positively affect the financial, environmental, and social performance of the companies, while these sustainability dimensions also contribute to improved quality assurance.
1.2. Tunisian Agri-Food Industry
The agri-food supply chain faces several critical challenges [22], particularly in developing countries such as Tunisia, because limited infrastructure, low technological adoption, weak institutional support, and financial constraints significantly hinder efficiency, coordination, and competitiveness [23]. On the contrary, Tunisia’s agro-food industry is a key sector of the national economy, covering both agro-food and food manufacturing activities. It includes a diverse range of companies, from small enterprises to large corporations, producing beverages, dairy products, baked goods, processed foods, and more. The agri-food industry in Tunisia can be classified into six main subcategories: (1) Beverages—Beer, soft drinks, juices, etc. (2) Dairy products—Milk, cheese, yoghurt, etc., (3) Baked goods and confectionery—Bread, pastries, cakes, etc., (4), Oils and fats—Olive oil, vegetable oils, etc. (5) Processed foods—canned foods, sauces, ready-to-eat meals, etc., (6) Retail and distribution—supermarkets and hypermarkets
Tunisia has reformulated its regulations and established food safety control systems to improve food quality. Major national initiatives include the National Quality Promotion and the National Upgrading Programme. The private sector has increasingly adopted the ISO 9001 [24] and ISO 22000 [25] standards to meet international safety demands, especially for exports. The National Codex Alimentarius Committee, created in 2000, monitors and implements food standards to protect consumer health. It also assesses the impact of international standards on production, environment and trade while supporting industry compliance [26].
The literature offers limited research on Tunisian agri-food companies and the Tunisian agri-food supply chain. For example, Haj and Dhiaf [27] examines the significant impact of the use of information and communication technologies on the overall performance of the supply chain in the Tunisian agri-food sector. Ghariani et al. [28] shows that digitalization and integration of the supply chain significantly influence the financial performance of agricultural and industrial organizations in Tunisia. Turki et al. [29] evaluated the environmental performance of Tunisian food companies by analyzing operational and management indicators under ISO 14001 [30], highlighting key success factors and barriers. No research has addressed the integration of SCMP and QMP in Tunisia, even in the specific context of agri-food companies.
1.3. Objective and Contributions of the Study
Tunisian agri-food companies, similar to firms in other developing countries, tend to pursue certification primarily as a strategic or tactical objective, often with the aim of increasing market share and facilitating export growth. However, certification should be regarded as an outcome rather than an end in itself. The priority of firms should be to implement the relevant requirements and management principles that structure operations and enhance processes, which in turn naturally lead to certification. Despite this, many managers struggle with these challenges: While some attempt to understand the necessary principles and practices, a large number remain uncertain about where to begin, how these practices connect with broader management principles, and what their impact on organizational performance might be.
This study seeks to address these gaps by examining the joint impact of SCMP and QMP on key dimensions of CA. In particular, it focusses on SCQM practices and their mutual reinforcement to improve supply chain quality, while investigating the extent to which these practices influence performance results. Understanding these interrelationships is critical, as it provides more nuanced insights into how SCMP and QMP jointly contribute to operational performance through the mediating mechanisms of CA, namely price/cost efficiency, product quality, innovation, delivery dependability, and time-to-market. Beyond its theoretical contribution to the literature on SCQM, the study also offers practical value by contextualizing these dynamics within the Tunisian agri-food supply chain, a sector that faces increasing global competition, resource constraints, and increased customer expectations. The findings serve not only to extend existing SCQM but also to refine them by demonstrating how integrated practices can be reorganized into coherent groups, thereby offering managers actionable guidance for implementation. In this way, research advances knowledge by bridging the gap between theory and practice, positioning SCQM as both a conceptual framework and a practical roadmap to improve competitiveness and performance in developing country contexts and potentially across other industries.
2. Literature Review and Research Framework
2.1. Supply Chain Management Practices (SCMPs)
SCMPs are commonly defined as a set of coordinated activities implemented within an organization to enhance the efficiency, integration, and overall effectiveness of its supply chain [31]. These practices not only aim to optimize operational processes but also to strengthen strategic relationships across the supply chain, thus contributing to improved organizational performance.
Building on this conceptual foundation, Truong et al. [32], through an extensive literature review, identified four critical SCMPs: process control and improvement, top management support, customer focus, and supplier management, which were used to construct a conceptual model exploring their effects on operational performance. Their findings, based on structured interviews with SCM experts, reveal that customer focus and supplier management exert direct and indirect impacts on operational outcomes, highlighting the importance of collaboration and external alignment. In contrast, top-management support and process control/improvement primarily influence performance through indirect and direct pathways, respectively, highlighting the role of leadership commitment and internal process optimization.
To further support these insights, Gera et al. [33], in a synthesis of 43 empirical studies conducted between 2018 and 2022, concluded that there is no universally applicable model linking SCMP to operational performance. Instead, the effects of SCMP are context-dependent and shaped by environmental conditions such as regulatory frameworks, supplier behavior, and customer expectations. This reinforces the view that the effectiveness of SCM practices is dependent on the specific context in which they are implemented and that a one-size-fits-all approach is unlikely to capture the complexity of their impact.
In light of these findings, the present study adopts a comprehensive set of SCM practices proposed by Li et al. [31], which have been widely recognized and validated in the literature. As summarized in Table 1, the measurement framework is structured around five key sub dimensions: Strategic Supplier Partnership (SSP), Customer Relationship (CR), Level of Information Sharing (IS), Level of Information Quality (IQ), and Postponement (POS), each representing a critical component of SCMP.

Table 1.
List of sub-constructs for SCMP.
2.2. Quality Management Principles (QMP)
Quality Management (QM) is defined as a systematic approach to guide and controlling an organization with respect to quality. It encompasses policies, processes, and procedures designed to ensure that products and services consistently meet customer requirements and regulatory standards, while driving continuous improvement in performance and efficiency. According to ISO 9001:2015 [24], QM is based on the implementation of a Quality Management System (QMS), which provides a structured framework for aligning operations with customer needs, improving satisfaction, and promoting ongoing improvement. As a result, QM significantly influences organizational performance, customer satisfaction, and expectations of other stakeholders.
Drawing on an extensive review of the literature and frequency analysis, Ebrahimi and Sadeghi [34] examined the impact of QM on firm performance and identified seven key QM practices—among more than 220 identified practices—that closely align with QMPs. These include human resource management, customer focus and satisfaction, and top management commitment and leadership, which were found to be particularly influential.
Similarly, Sanchez-Lizarraga et al. [35] conducted a comprehensive review to identify the critical success factors for effective QMS implementation. Their findings show that these factors correspond directly to the seven QMPs outlined in ISO 9001:2015: Leadership (LID), People Engagement (EP), Improvement (IMP), Customer Focus (CF), Process Approach (PA), Evidence-Based Decision Making (EDM), and Relationship Management (RM). These seven principles, which are adopted in the present study, are defined in Table 2.
Table 2.
List of sub-constructs for QMP.
2.3. Competitive Advantage (CA)
Competitive advantage (CA) is a central concept in strategic management, referring to a company’s ability to achieve superior performance compared to its competitors by delivering greater value to customers [36]. This advantage may stem from cost leadership, differentiation, or a combination of both, enabling firms to maintain their market position and improve long-term profitability. Within the context of SCM, CA is closely related to the firm’s ability to efficiently manage resources, processes, and relationships to meet customer expectations while adapting to dynamic market conditions. In other words, CA reflects the degree to which an organization can create a defensible position over its competitors through capabilities that allow differentiation, operational excellence, and responsiveness—outcomes shaped by critical managerial decisions [37]. Emir and Sulistyowati [38] empirically validated that the joint implementation of SCMP and QMP can improve CA, which in turn contributes to improved operational performance.
The dimensions of CA can be systematically classified into five key areas: price/cost, quality, delivery dependability, product innovation and time to market. This classification captures both cost-related and differentiation-related sources of CA. Price/cost reflects efficiency and cost control mechanisms that allow competitive pricing or higher margins. Quality represents the ability to consistently meet or exceed customer expectations, building loyalty, and reducing operational risks. Delivery dependability ensures that products are reliably delivered on time and in the right condition, enhancing trust and customer retention. Product innovation enables differentiation and market leadership by introducing new or improved offerings, while time to market emphasizes responsiveness to emerging opportunities and changing market demands. The definitions of all sub-constructs for CA are listed in Table 3.
Table 3.
List of sub-constructs for CA.
CA is a key driver linking operational performance to overall organizational performance. Superior operational capabilities, such as efficiency, quality, and responsiveness, enable firms to deliver greater value and differentiate themselves, which enhances CA and, in turn, boosts financial and strategic outcomes [36]. Thus, operational excellence acts as a crucial mechanism through which CA translates into sustained organizational success [11].
3. Method
The selection of measurement sub-constructs for this study prioritizes empirical validation and widely recognized standards. Recognizing the diversity and lack of a single universally accepted model for SCMP [32,33] and another for CA [36,37,38], we adopt the comprehensive framework of Li et al. [31]. This model provides five validated dimensions for SCMP and five key areas for CA, providing a robust foundation for analysis. Furthermore, our approach to QMP is grounded in established consensus: various independent research efforts [34,35] consistently identify core QMP that align precisely with the seven definitive principles outlined in the ISO 9001 standard [24]. Therefore, these seven principles constitute the QMP sub-constructs in our research.
The following section is dedicated to fully detailing the research design, including sampling and data collection methods, general research approaches, and the three logic hypotheses linking SCMP, QMP, and CA.
3.1. Sampling and Data Collection
The survey comprises four sections, as mentioned in Appendix A. The first section of the survey consisted of 7 identification items (company name, subcategory, address, contact name, telephone number, number of employees, managerial ratio). The second section of the survey lists 25 items of SCMP: Variables SSP and IS have six items each, while CR and IQ comprise five items each, and variable POS with three items. The third section of the survey lists 25 items of ISO 9001 QMP: The variables LID, CF, PA, and EDM have four items each, while EP, IMP, and RM comprise three items each. The fourth and last section lists the 10 CA items: all variable PC, QL, PI, DD, and TM have 2 items each. Except the questions of Section 1, all other questions of the three other sections of the survey must be answered with a five-point Likert scale (1: never, 2: rarely, 3: regularly, 4: almost always, 5: always). The survey is aimed at companies within agri-food manufacturing organizations that have or have previously held ISO 9001 certification. The survey is primarily aimed at both supply chain and quality managers or manufacturing managers; however, general and top managers are also considered part of the target population.
The survey was conducted during the period of May and June 2025, in both electronic and paper formats: The electronic version was distributed via email, while the paper version was administered through face-to-face interviews. The sample was randomly selected from the published list of the agri-food manufacturing industry developed by the Ministry of Industry, Energy and Mines of Tunisia “https://www.tunisieindustrie.nat.tn/en/dbi.asp (accessed on 04 May 2025)”. Out of 220 questionnaires sent, 76 responses were received. However, only 70 of these were completed fully and correctly, providing the necessary information for the statistical analysis required for the validation process.
3.2. Research Methodology
Based on the literature review presented in Section 2, SCMP and QMP are hypothesized to have a reciprocal relationship with each other. To investigate the connections among these concepts, the study will independently employ two distinct methodological approaches: The Block-Based Modelling Approach (BBMA) and the Grouped Criteria Selection Approach (GCSA).
3.2.1. Block-Based Modelling Approach (BBMA)
As mentioned in Figure 1, the first approach treats SCMP and QMP as two separate blocks (or latent constructs) and examines their combined effects on a global block of CA. It assumes that the entire set of supply chain and quality practices influences performance as unified systems.
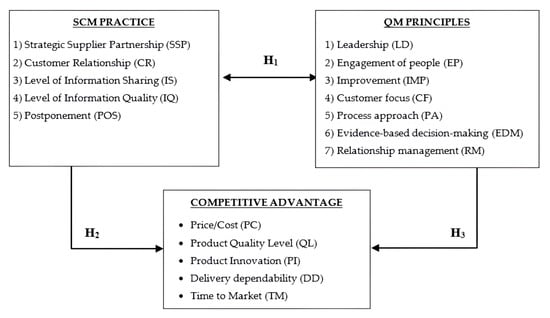
Figure 1.
Conceptual research according to BBMA.
According to this approach, three hypotheses are formulated to be tested:
Hypothesis 1.
There is a significant reciprocal relationship between SCMP and QMP, such that improvements in one positively influence the other and vice versa.
Hypothesis 2.
Firms with high levels of SCMP will have high levels of CA.
Hypothesis 3.
Firms with high levels of QMP will have high levels of CA.
Indeed, previous published studies indicate that integrating QMP into SCMP improves organizational performance by improving supply chain coordination, operational efficiency, and strategic alignment, while simultaneously strengthening quality outcomes across the chain [17]. Similarly, research on the joint implementation of SCMP and QM, such as in [19,37], demonstrates that these practices reinforce each other, creating a mutually beneficial effect that improves CA. These findings suggest that SCMP and QMP are not isolated functions, but interdependent systems, where progress in one domain positively reinforces the other, validating the rationale for the reciprocal relationship.
Likewise, firms that effectively implement SCMP can optimize resource utilization, improve coordination with partners, and enhance responsiveness to market demands, all of which contribute to a stronger competitive position [39]. Similarly, the adoption of robust QMP enables companies to deliver superior products and services, increase customer satisfaction, and differentiate themselves from competitors, thereby strengthening their CA [40].
3.2.2. Grouped Criteria Selection Approach (GCSA)
The GCSA which is presented in Figure 2, focusses on identifying specific clusters that integrate selected SCMP and QMP principles based on their thematic coherence or functional complementarity, and then evaluating their targeted effects on distinct dimensions of CA. By doing so, it enables a more nuanced and fine-grained analysis of how particular combinations of practices influence defined performance outcomes, rather than treating SCMP and QMP as monolithic constructs. In other words, significant relationships may emerge between two or more sub constructs—whether originating from the same domain or from different domains—which can be interrelated and simultaneously associated with certain aspects of CA. This remains possible even when no significant direct relationship is observed at the aggregated level between the overall SCMP, QMP, and CA constructs, thus highlighting the importance of exploring interactions at a more detailed sub construct level.
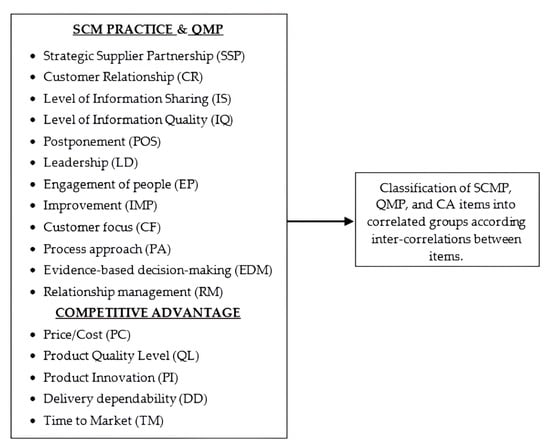
Figure 2.
Conceptual research according to GCSA.
4. Results of the Measurement Models
In this study, comprehensive statistical analyses were applied using SPSS version 23. Specifically, descriptive statistical analysis was performed to summarize the fundamental characteristics of the data. Additionally, reliability analysis was conducted to assess the internal consistency and stability of the measurement instruments, followed by a three-factor analysis to explore the underlying data structures and validate the constructs. Appendix A presents the multiple items representing each of the constructs. The following section will discuss the statistical analysis used to determine the reliability, validity, and factor analysis of each construct.
4.1. Reliability Analysis
The reliabilities of SCMP, QMP and CA were assessed with Cronbach’s Alpha. Table 4 report means, standard deviations and reliability values for each of the constructs. Reliability values for all constructs are greater than 0.70, which are considered acceptable [41].
Table 4.
Descriptive statistics and reliability analysis.
4.2. Results of the Factor Analysis
4.2.1. Exploring Supply Chain Management Practices (SCMPs)
A first factor analysis was performed on the 25 items that measure the five dimensions of the SCMP. The Kaiser-Meyer-Olkin measure of sampling adequacy was 0.748, indicating acceptable sample suitability for factor analysis. The Bartlett test of sphericity (0.00) was significant (p < 0.05), confirming sufficient correlations between variables. All communalities exceeded 0.4, showing a good representation of the variables by the extracted factors. To simplify interpretation, only factor loadings greater than 0.45 are reported. As shown in Table 5, all items were loaded onto their intended factors, with most loadings exceeding 0.70. The number of extracted factors is based on the eigenvalue when it is greater than 1. The five factors together explain 76.49% of the total variance. However, the first four factors explain a high percentage of variance 71.81% which is greater than 70% [39], suggesting that IS and IQ belong to the same factor (factor 1). Therefore, there is no need to consider a fifth factors, four factor are enough to analyses SCMP.
Table 5.
Factor analysis result for SCMP.
4.2.2. Exploring Quality Management Principles (QMPs)
A second factor analysis was performed on the 25 items that measure the seven dimensions of the QMP. The Kaiser-Meyer-Olkin measure of sampling adequacy was 0.738, demonstrating an acceptable level of sample suitability for factor analysis. The Bartlett test for sphericity was highly significant (p < 0.05), confirming adequate correlations between variables. Furthermore, all communalities were above 0.4, indicating that the variables were well represented by the extracted factors. To simplify interpretation, only factor loadings greater than 0.45 are reported. As shown in Table 6, all items were loaded onto their intended factors, with most loadings exceeding 0.70. The number of extracted factors is based on the eigenvalue when it is greater than 1. Consequently, only five factors are extracted.
Table 6.
Factor analysis result for QMP.
According to these results, the grouping behavior of the variables is notably structured by their own approach. For example, items belonging to Improvement (IMP) and Process Approach (PA) showed significant factor loadings on the same constructs. Consequently, these two QMPs were considered to be a factor. In fact, several studies in the field of QM, particularly within the ISO 9001 framework, have highlighted a strong correlation between the principles of improvement (IMP) and Process Approach (PA) especially agri-food companies, where process control and continuous enhancement are essential for maintaining quality, safety, and efficiency. The results are also previously founded in Okpala and Korzeniowska [42], Saida Taibi [43] and Singh [44]. These findings support the view that well-defined and controlled processes are the foundation upon which continuous improvement efforts can be effectively implemented, making the two principles highly interdependent in practice.
Similarly, the items related to Leadership (LID) and Engagement of people (EP) loaded together on the same construct. Hence, these two QMPs were also grouped together as a single factor. In fact, effective leadership creates a clear vision, sets direction, and fosters a supportive environment that motivates individuals to contribute actively. Without leadership commitment, employee engagement tends to be weak and unstructured. According to Oakland [45], leadership is essential to build a quality-focused culture where people feel empowered and involved.
Likewise, Zehir et al. [46] demonstrated that strong transformational leadership significantly improves employee engagement, leading to improved organizational performance. These findings underline that engaged people are the result of purposeful and supportive leadership, making the LID and EP principles fundamentally interconnected.
4.2.3. Joint Exploring of SCMP, QMP, and CA
A third factor analysis was conducted on all the 60 study items, including 25 items measuring the five SCMP dimensions, 25 items assessing the seven QMP dimensions, and 10 items evaluating the five CA dimensions. The Kaiser-Meyer-Olkin (KMO) measure of sampling adequacy was 0.328, indicating weak suitability for factor analysis, which is reasonable given that the items originate from different but complementary constructs. However, Bartlett’s test of sphericity (p < 0.05) was significant, confirming sufficient correlations among variables. Consistent with the previous factor analyses, all communalities exceeded 0.4, demonstrating good representation of variables by the extracted factors. For clarity, only factor loadings above 0.45 are reported. As shown in Table 7, all items loaded onto their intended factors, with most loadings above 0.6. The number of extracted factors was determined based on achieving a cumulative variance greater than 70%, with the five factors together explaining 73.61% of the total variance.
Table 7.
Integrated factor analysis including SCMP, QMP, and CA items.
Based on the results of a field survey conducted among agri-food companies, five coherent groups were identified, combining the five SCMP items and the seven QMP items. This empirical classification reflects how companies operate these SCMP and QMP to achieve CA.
Group 1: Information and Decision Capacity (IDC): This group integrates information sharing (IS), information quality (IQ), and evidence-based decision making (EDM), forming the foundation for informed and reliable operations. In the food sector, where traceability, product safety, and timely actions are critical, accurate and high-quality information allows firms to reduce uncertainty and make proactive decisions. This directly supports product quality (QL) by ensuring compliance and safety, and enhances delivery dependability (DD) through better planning and coordination.
Group 2: Customer-centric innovation (CCI): Combining customer relationship (CR) and customer focus (CF), this group reflects the company’s orientation toward market responsiveness and adaptability. Understanding and anticipating customer needs allows companies to innovate faster and tailor offerings more effectively. This responsiveness is particularly valuable in agri-food markets, where consumer preferences and health concerns evolve rapidly. As a result, this group enhances product innovation (PI) and reduces Time to market (TM) by enabling quicker adaptation and product development aligned with demand.
Group 3: Process Management and Agility (PMA): This group includes the process approach (PA), improvement (IMP), and postponement (POS), emphasizing operational efficiency and flexibility. Standardized and continuously improved processes allow companies to control quality and costs, while postponement strategies enable late stage customization and faster response to market changes. As such, this group enhances time-to-market (TM) by shortening lead times, and improves delivery dependability (DD) via more adaptable and responsive supply chain execution.
Group 4: Supplier and Network Management (SNM): This group focusses on strategic supplier partnership (SSP) and relationship management (RM), which are essential to build resilient and cost-effective supply chains. In the agri-food industries, strong supplier relationships ensure consistent quality of raw materials and reduce risks related to seasonality and perishability. These collaborative ties generate price/cost (PC) advantages through better negotiation and reduced transaction costs, and also reinforce delivery dependability (DD) by improving supply consistency.
Group 5: Leadership and workforce engagement (LWE): Leadership (LID) and people engagement (EP) form the cultural and managerial core that supports quality-driven strategies. Strong leadership provides vision and alignment, while engaged employees actively contribute to continuous improvement and operational excellence. This group is directly linked to product quality (QL), through consistent execution and adherence to standards, and also contributes to price/cost (PC) performance by promoting efficiency, reducing waste, and encouraging initiative at all organizational levels.
4.3. Structural Model Selection
Structural Equation Modeling (SEM) is a comprehensive statistical framework that combines factor analysis and multiple regression to examine complex relationships between observed and latent variables. Within SEM, first-order confirmation factor analysis (CFA) focuses exclusively on the measurement model by validating how observed indicators represent their respective latent constructs without specifying causal relationships between the constructs themselves. In contrast, SEM expands beyond measurement by incorporating structural paths that model hypothesized causal or predictive relationships among latent variables. In this investigation, the Amos version 26 software was used to test and select the most suitable measurement model.
As shown in Table 8, four analytical models are applied to validate the relationships between SCMP, QMP and CA, sharing a common focus on latent constructs while differing in methodology, model type, measurement level, and treatment of endogenous variables. Model 1 employs a BBMA using a CFA framework with correlated constructs, focusing solely on first-order latent variables without endogenous variables. Model 2 also uses an BBMA within a SEM framework, incorporating direct effects on CA treated as a single construct and combining first-order latent variables with structural paths.
Table 8.
Comparison of tested models according to their structural aspects.
Models 3 and 4 further extend this approach into a full multidimensional SEM, examining the effects of five latent constructs from the proposed classification (IDC, SNM, CCI, LWE, PMA) on the multiple dimensions of CA, while using only first-order latent variables.
4.3.1. Measurement Model 1
Model 1 is an example of a CFA model with correlated constructs. In this study, it belongs to the BBMA. As mentioned in Figure 3, model 1 assumes that SCMP and QMP directly influence CA, while SCMP and QMP are also correlated.
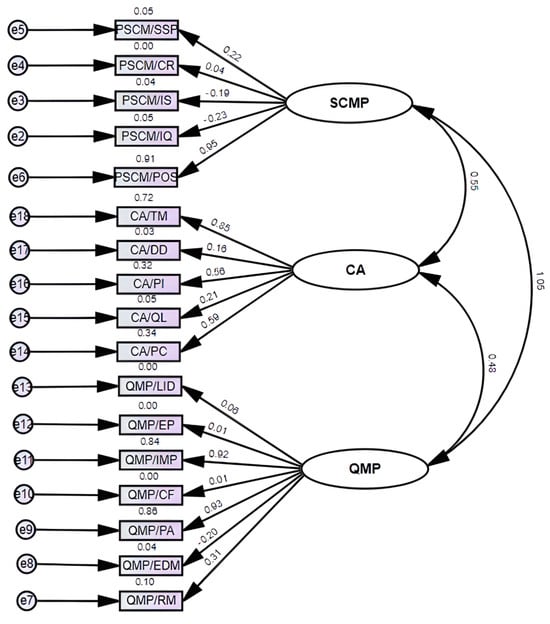
Figure 3.
Measurement Model 1 for SCMP, QMP, and CA.
After standardized estimations (Figure 3), the coefficients obtained in the first model are problematic, with many indicator loadings very low (0.00 or near zero), indicating poor representation by their latent constructs. Some negative loadings are also observed. Critically, the correlation between SCMP and QMP is impossible 1.05, and SCMP and CA correlate very strongly at 0.95, suggesting a lack of discriminant validity. These issues strongly indicate that the model is not adequate. Hence, as mentioned in Table 9, model 1 shows very poor fit (χ2/df = 9.933, CFI = 0.231, TLI = 0.107, RMSEA = 0.360). These values are far from acceptable thresholds, which indicates that the hypothesized structure does not correspond to the reality of agi-food companies in Tunisia. According to Model 1, all the three Hypotheses H1, H2, and H3 are not significant.
Table 9.
Comparison results of the four tested models.
4.3.2. Measurement Model 2
As mentioned in Figure 4, model 2 maintains the same three latent variables of model 1 but adjusts the causal relationships slightly. It can be considered as a SEM with direct effects on CA.
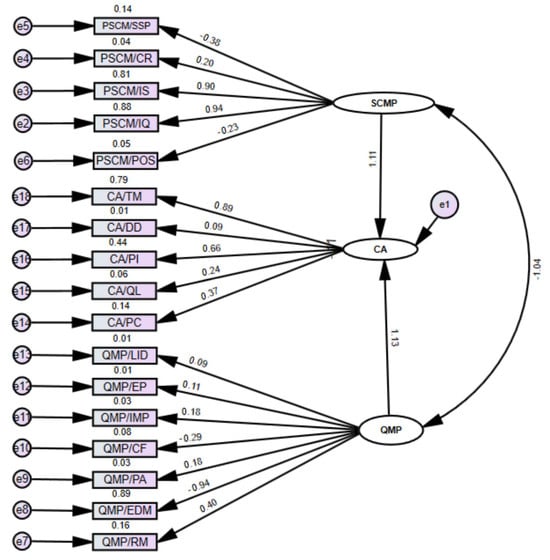
Figure 4.
Measurement Model 2 for SCMP, QMP, and CA.
In model 2, SCMP and QMP appear to both contribute to CA. However, the second model (Figure 4) exhibits numerous weak and problematic coefficients: Many indicator loadings are extremely low (e.g., 0.00, 0.01, 0.03), signifying poor measurement. The correlation between SCMP and CA is an impossible 1.11, and the SCMP-QMP correlation is −1.04, both exceeding acceptable bounds and indicating severe model misspecification or estimation problems. In fact, as mentioned in Table 9, the model fit indices remain very poor as in model 1 (χ2/df = 9.996, CFI = 0.226, TLI = 0.100, RMSEA = 0.361).
All three hypotheses, H1, H2, and H3 (Figure 1), were found to be not significant, suggesting that they may not have been adequately defined. This result indicates that conceptualizing SCMP, QMP, and CA as aggregated blocks does not provide meaningful explanatory power. Instead, a more granular approach is required, one that emphasizes inter-block relationships by examining how specific dimensions of SCMP interact with particular QMPs and how these interactions subsequently shape selected dimensions of CA.
Technically, to improve both Model 1 and Model 2, a delicate process is usually applied that includes the following [47]: (1) identify weak items by checking standardized factor loadings, (2) remove indicators with loadings less than 0.50 one at a time. (3) using modification indices to suggest theoretically justified co-variances between error terms of items within the same construct, (4) reviewing standardized residual co-variances to identify and remove items with values greater than two, which can indicate differences between proposed and observed co-variances, while maintaining sufficient items per construct. However, this process reduces the number of SCMP and QMP items, and consequently the models obtained models would not be realistic according to the three proposed hypotheses H1, H2, and H3.
4.3.3. Measurement Model 3
Model 3 is considered as full multidimensional SEM for the drivers of CA. it refines the relationships, possibly by modifying measurement or error specifications, leading to improved fit. It belongs to the proposed GCSA.
This model shown in Figure 5 generally demonstrates much stronger and more theoretically sound relationships compared to previous models 1 and 2. The loadings of observed variables onto their respective latent constructs (IDC, SNW, CCI, LWE, and PMA) are consistently high, mostly ranging from 0.80 to 0.99, indicating excellent convergent validity and that the indicators effectively measure their intended constructs. Similarly, the path coefficients from the independent latent variables (IDC, SNW, CCI, LWE, PMA) to the dependent latent indicators (CA/PC, CA/QL, CA/PI, CA/DD, CA/TM) are largely substantial and positive, suggesting significant and positive influences. For instance, CCI shows a strong 0.91 path to CA/PI, and LWE has a notable 0.99 path to an unobserved variable. Although there are some lower path coefficients (for example, LWE to CA/DD at 0.44), the overall pattern suggests a well-defined and robust measurement and structural model.
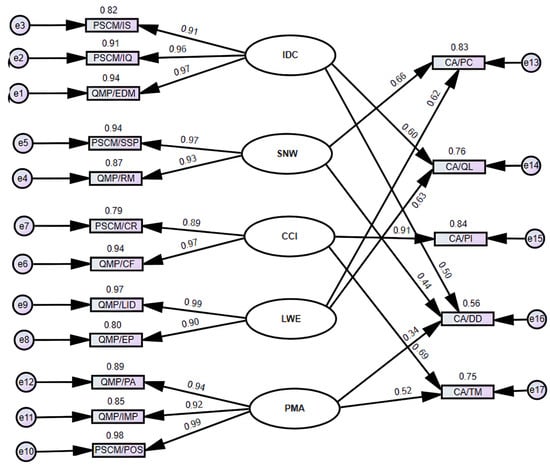
Figure 5.
Measurement Model 3 for SCMP, QMP, and CA.
In MES, the Amos software provides modification indices (MI) for fixed parameters and equality constraints. An MI estimates the potential reduction in the discrepancy function if a specific constraint on a parameter were removed. The actual reduction, however, could be substantially larger. Amos also calculates MIs for absent paths, indicating the approximate discrepancy function decrease upon their inclusion. As illustrated in Figure 6, an analysis of the MIs for model 3 revealed significant values (generally larger than 10 [47]) for the CCI/LWE (11.229) and ISC/SNF (9.681) relationships.
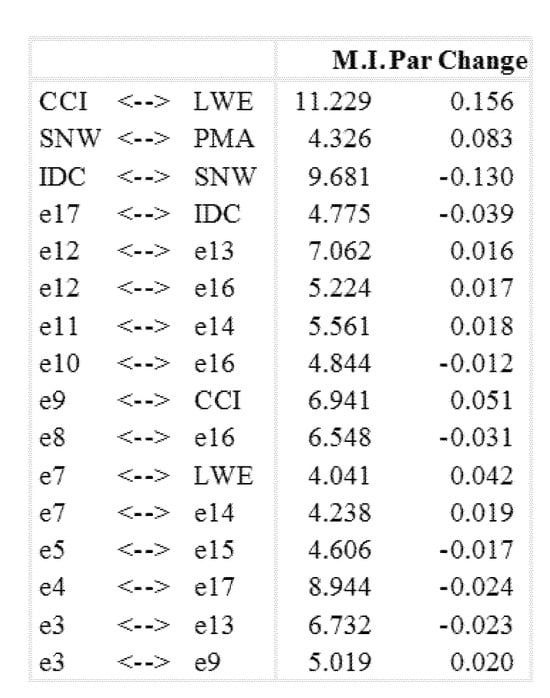
Figure 6.
Modification indices (MIs) list according to measurement model 3.
Adding covariance links between latent variables (e.g., e1, e2) solely to improve model fit may compromise theoretical validity and lead to overfitting. Therefore, such modifications should be theoretically justified rather than used as post hoc adjustments. In this study, no co-variances were added between unobservable variables, even when high MIs were observed. To further improve the fit of the model, covariance links were subsequently introduced between only CCI/LWE and ISC/SNF relationships, a modification implemented in model 4.
4.3.4. Measurement Model 4
As shown in Figure 7, measurement model 4 maintains an identical structural framework to measurement model 3, with the sole distinction being the addition of two covariance links: one between the elements of the CCI/LWE pair and another between the elements of the ISC/SNW pair.
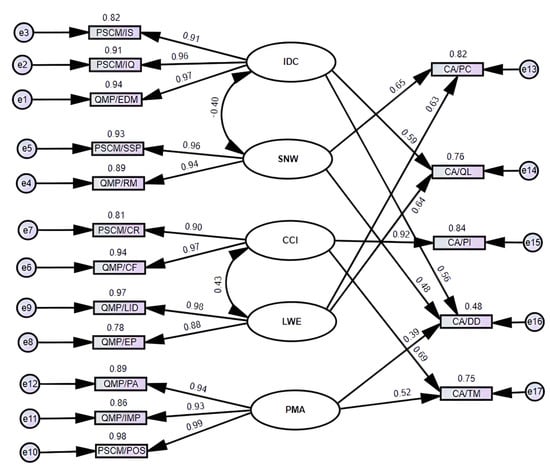
Figure 7.
Measurement Model 4 for SCMP, QMP, and CA.
Compared to Model 3, this updated version Model 4 introduces two key differences: the addition of covariance links. Specifically, there is a negative covariance of −0.40 between IDC and SNW, and a positive covariance of 0.43 between CCI and LWE. These additions suggest that the previous model’s fit issues, likely indicated by high modification indices for these pairs, have been addressed by allowing these latent constructs to co-exist directly, rather than assuming their relationship is fully mediated through other paths or being entirely uncorrelated beyond their specified structural relationships. The factor loadings and structural path coefficients to the dependent variables appear largely consistent, but the inclusion of these co-variances indicates a refinement of the measurement or endogenous relationships between the independent latent constructs. Hence, as indicated in Table 9, the best results are obtained (χ2/df = 1.708, CFI = 0.942, TLI = 0.929) for model 4.
Both models 1 and 2 fail to meet basic fit requirements. While they provide different emphases (SCMP is stronger in Model 1; QMP is slightly stronger in Model 2), their statistical inadequacy makes them unreliable. Models 1 and 2 should be rejected due to very poor fit. Model 3 shows substantial improvement. Both SCMP and QMP are positively related to CA. This resonates with the dependence of the Tunisian agri-food sector on quality for competitiveness, especially in export markets. Model 4 provides the best statistical fit and the most coherent theoretical explanation. The strong correlation between SCMP and QMP in all models suggests that firms often integrate supply chain efficiency with quality assurance, which is consistent with the high dependency on both product freshness and safety standards. Thus, Model 4 should be retained as the final validated model to explain the drivers of CA in Tunisian agri-food firms. Model 3 and Model 4 are good, despite their large RMSEA values and their low p-CLOSE. Indeed, as noted by Kenny et al. [48], RMSEA is not always a reliable measure on its own when cutoff values are applied to evaluate the fit of correctly specified models with low degrees of freedom and small sample sizes, and RMSEA often inaccurately suggests poor model fit. Therefore, it is recommended to avoid calculating RMSEA for models with low degrees of freedom, particularly those based on small samples.
5. Discussion
The proposed classification of SCMP and QMP into five groups as mentioned in Table 10—IDC, CC, PMA, SNM, and LWE—provides a structured framework reflecting the practical operationalization of SCQM in the case of Tunisian agri-food companies.
Table 10.
The proposed five-group classification of SCMP and QMP in Tunisian agri-food industry.
Group 1, Information and Decision Capability (IDC), brings together IS, IQ, and EDM as essential drivers of informed and reliable operations. In the agri-food sector, where traceability, safety and timeliness are critical, accurate, high-quality information reduces uncertainty and enables proactive decision making, directly supporting product quality (QL) through compliance and safety, and improving delivery dependability (DD) via better planning and coordination. For real example, implement a mobile application for field inspectors to immediately record the quality metrics of incoming raw materials (e.g., pH level of tomatoes, Brix value of citrus). These real-time data automatically update inventory and production planning systems, allowing managers to instantly halt processing lines if noncompliant material arrives, thereby preventing waste and ensuring product quality before delivery.
Numerous studies have confirmed the importance of integrating IS, IQ, and EDM; for example, Alduais et al. [49] show that IS significantly improves EDM, with IQ serving as a key mediator. The precision, relevance and timeliness of shared information improve decision precision, enabling organizations to make more effective, evidence-informed decisions, particularly in complex data-intensive environments.
Group 2, Customer-Centric Innovation (CCI), integrates CR and CF, highlighting a firm’s ability to respond to market changes and adapt to evolving consumer needs. By anticipating these needs, companies can accelerate innovation and tailor products effectively, enhancing PI and reducing TM, particularly in agri-food markets. For practical example, following feedback from a key European distributor (a manifestation of CR), the company identifies a growing demand for gluten-free product (such as couscous). The management team immediately allocates R&D resources to source specialized grains and test production on a dedicated line, achieving a fast time-to-market (TM) and launching a profitable product innovation (PI) that meets the specified consumer need (Customer Focus).
To support these empirical results of Group 2, Baldi et al. [50] conducted a systematic review of 174 studies on consumer-centric SCM, highlighting the critical roles of CR and CF in shaping key factors, outcomes, and retail structures, and proposing a framework to help firms align SCM with changing consumer demands. Furthermore, Chavez et al. [51] show that customer-centric green supply chain management (GSCM), driven by customer pressure, improves operational performance in flexibility, delivery, quality, and cost. Improvements in product quality and delivery especially increase customer satisfaction.
Group 3, Process Management and Agility (PMA), integrates PA, IMP, and POS, highlighting efficiency, flexibility, and responsiveness. Standardized and continuously improved processes improve quality control and cost management, while POS enables late-stage product customization. Consequently, PMA shortens TM and strengthens DD through more agile supply chain execution. For real-world example, a date exporter standardizes the initial washing, sorting, and chilling processes (according to their process approach). However, they delay the final packaging step—labelling and boxing—until the customer’s specific order is received (e.g., French language labels vs. German language labels, or 250 g boxes vs. 500 g trays). This postponement strategy drastically improves time-to-market by maximizing inventory flexibility.
To support group 3, previous literature has been examined; for example, Alfalla-Luque et al. [52] conducted a meta-analysis of 56 studies to assess how supply chain agility affects organizational performance, identifying process flexibility and continuous improvement as key drivers. Their findings indicate that these factors significantly enhance operational performance in dynamic environments. Although POS is not explicitly addressed, the principles of process standardization, continuous improvement, and flexible product differentiation can be applied to implement POS strategies, allowing late-stage customization and greater responsiveness of the supply chain.
Group 4, Supplier and Network Management (SNM), integrates SSP and RM to develop resilient and cost-effective supply chains. Close collaboration with suppliers ensures consistency in raw materials and mitigates risks related to seasonality and perishability. This cooperation drives PC advantages through improved negotiation and reduced transaction costs, while enhancing DD by ensuring a more reliable supply. For example, an industrial processing company forms a strategic supplier partnership (SSP) with its key spice farmer. The company provides the farmer with training and certified seeds to guarantee product consistency, and in return, the farmer commits to a stable volume and preferential pricing. This collaboration ensures superior raw material quality and reduces the dependence on volatile spot markets, generating a competitive and stable price advantage.
These findings are supported by recent literature; for example, Zhao [53] demonstrates that strategic supplier relationship management strengthens supply chain resilience by emphasizing coordination, transparency, and long-term collaboration. The study highlights the importance of SSP and RM in maintaining raw material consistency, managing risks, improving PC, and improving DD.
Group 5, Leadership and Workforce Engagement (LWE), integrates LID and EP, providing the cultural and managerial foundation for quality-driven strategies. Effective leadership ensures strategic alignment, while engaged employees drive continuous improvement and operational excellence. LWE directly enhances QL through consistent performance and adherence to standards, and contributes to PC by increasing efficiency and reducing waste. This grouping is well supported in the literature; for example, Bashir et al. [54] examine how LID affects employee performance, highlighting EP as a key mediating factor. Their study shows that change-orientated leadership fosters employee engagement, which in turn improves performance outcomes, reinforcing the critical role of LID and EP in promoting continuous improvement, operational excellence, and quality-focused strategies. For real example, the CEO and plant manager (leadership) delegate authority to production teams to stop the line immediately if a quality issue arises (people engagement). Furthermore, they implement a suggestion program that rewards employees for identifying process flaws that reduce energy consumption or material scrap. This active engagement reinforces product quality and directly contributes to a lower operating cost.
The proposed empirical classification can be meaningfully compared with the main SCQM frameworks in the literature. Flynn and Flynn [3] distinguish internal practices, co-maker-ship initiatives, and performance measures; the Tunisian groups align closely, with IDC representing internal practices emphasizing reliable decision-making, SNM reflecting collaborative supplier partnerships, and LWE capturing leadership support, but the empirical model consolidates these into integrated actionable groups explicitly linked to CA. Sampaio et al. [7] categorize SCQM into upstream (supplier-focused), downstream (customer-orientated), internal processes and support practices; similarly, CCI corresponds to downstream customer-centric practices, IDC to support, PMA to internal process improvements, LWE to top management and HR support, and SNM to upstream supplier activities, while the empirical framework emphasizes practical integration and clear impact on product quality, delivery dependability, and cost efficiency. Bastas and Liyanage [9] consider SCQM through intra-organizational QM, inter-organizational SCM, and sustainability; the five-group model mirrors these perspectives, with IDC and PMA covering internal QM, SNM encompassing inter-organizational SCM, CCI including market responsiveness and innovation, and LWE supporting both dimensions. Vanichchinchai [10] classifies practices as Qualifier, Improver, Extender, and Winner; the Tunisian groups map onto these categories, with IDC and PMA establishing fundamental operational control, CCI and SNM extending capabilities and delivering CA, and LWE spanning all categories to amplify the effectiveness of the other groups. Finally, Soares et al. [8] emphasize customer orientation, supplier collaboration, leadership, process management, and continuous improvement; Based on this, the five-group empirical model of five groups incorporates evidence-based decision making, links customer focus with innovation and rapid market adaptation, and highlights agility, strategic supplier partnerships, and workforce engagement as key enablers. Together, these refinements provide a comprehensive context-sensitive framework that explains how SCQM and QMP practices jointly enhance product quality, delivery reliability, cost efficiency, and overall CA in the Tunisian agri-food sector.
Although this research offers a novel empirical classification of SCQM, its findings should be interpreted within the context of several methodological constraints. First, the sample size and its singular focus exclusively on the Tunisian agri-food sector limit the generalizability of the findings. Although the five operational groups (IDC, CCI, PMA, SNM, LWE) are empirically derived from this context, their external validity requires confirmation across different geographical regions and industrial sectors. Second, the reliance on self-reported survey data introduces the potential for common-method bias and may social desirability bias. Although statistical controls were implemented, the perceptual nature of the data means that the strength of the correlations between the SCMP, QMP and CA constructs may be partially influenced by the subjective views rather than purely objective organizational performance.
6. Conclusions
This study investigates the interrelationship between Supply Chain Management Practices (SCMPs) and Quality Management Practices (QMPs) and their collective impact on improving supply chain quality. Additionally, it examines the link between Supply Chain Quality Management (SCQM) practices and Competitive Advantage (CA). Unlike previous research that treats SCMP and QMP as aggregated constructs, the findings reveal that such intra-module conceptualizations do not yield significant explanatory power. Instead, this study demonstrates the need to adopt a disaggregated approach that identifies and analyses specific linkages between individual practices and principles. This theoretical refinement advances SCQM scholarship by emphasizing the relational mechanisms that underlie performance outcomes, thereby moving beyond traditional block-level analysis.
Consequently, the results indicate that reorganizing SCMP and QMP into five integrated constructs is a more effective analytical approach: (1) Information and Decision Capability (IDC), (2) Customer-Centric Innovation (CCI), (3) Process Management and Agility (PMA), (4) Supplier and Network Management (SNM), and (5) Leadership and Workforce Engagement (LWE). This refined classification enriches the theoretical understanding of how quality and supply chain practices co-evolve to generate sustainable competitive advantage and offers a robust framework to assist managers in the Tunisian agri-food industry, and potentially other sectors, in achieving more effective implementation of both SCMP and QMP, ultimately leading to improved performance outcomes.
The results presented in this study seem to be very significant, as they reflect the perceptions of practicing managers of Tunisian agri-food companies. For example, these perceptions should be considered when designing a supply chain system to ensure the effective transition from ISO 9001 to total quality management programs. It is important to note that perceptions are not an exact representation of reality; however, they offer valuable information to guide managerial decision making. In addition, improving information quality and evidence-based decision making can directly strengthen product quality and delivery dependability, while fostering customer-centric innovation can accelerate time-to-market. Similarly, integrating supplier partnerships with effective relationship management can improve cost efficiency and reliability. By following this integrated perspective, managers can prioritize interventions that yield the greatest strategic benefits, allocate resources more effectively, and design quality and supply chain initiatives that are context-sensitive and performance-driven. In doing so, the study serves as a practical roadmap for taking advantage of SCQM practices to enhance competitiveness and operational excellence.
This study provides valuable information on the current impact of SCQM, and its key components five SCMP and seven QMP, on operational performance mediated by five CA; however, several avenues for future research can be identified. First, this study does not consider variables such as firm size, managerial ratio, or specific subcategories of the agri-food industry (e.g., beverages, dairy products, baked goods and confectionery, bread, etc.), which may influence the selection of significant sub-constructs of SCMP and QMP. Furthermore, the sample size is limited, suggesting that repeating the analysis with a larger and more diverse sample would strengthen the findings. Furthermore, research should adopt a mixed method approach by triangulating the self-reported SCQM data with objective operational metrics, such as real-world defect rates, customer return volumes, or verifiable financial performance indicators, to provide a more robust assessment of the SCQM-CA link. Extensive research to account for these variables represents a primary direction for future research.
Beyond the scope of a singular standard such as ISO 9001 [24], organizations commonly implement Integrated Management Systems (IMS) to unify multiple domain-specific standards, such as ISO 14001 [30] (environmental), ISO 45001 [55] (health and safety), and ISO 22000 [25] (food safety), into a cohesive organizational framework. Fundamentally, all management systems within all organizations are, to a greater or lesser degree, Integrated Management Systems, regardless of formal certification or managerial recognition; they inevitably incorporate elements of quality, environment, safety, risk, energy efficiency, and social responsibility. This inherent integration introduces a methodological challenge: while all surveyed companies in the present study hold ISO 9001 certification, the variance in additional certifications (e.g., some are certified to ISO 22000 [25] or are actively pursuing it) may affect the accuracy of results concerning the impact of SCMP and QMP on CA, and thus complicate the proposed five-group SCQM classification. Consequently, incorporating IMS practices, certifications, and related performance measures, including food safety, sustainability, and risk management, represents a crucial and important second avenue for future research.
Finally, this study is based exclusively on Tunisian food companies. Investigating the synergies between SCMP and QMP in other key economic sectors, such as textiles and apparel, or materials and construction, would broaden the understanding of the impact across diverse industrial contexts. This would allow for a definitive test of the stability and external validity of the five SCQM operational groups.
Author Contributions
Conceptualization, A.A., S.S. and W.H.; methodology, A.A., S.S. and W.H.; software, A.A. and W.H.; validation, A.A., S.S. and A.M.A.; formal analysis, A.A. and S.S.; investigation, A.A.; resources, A.A. and W.H.; data curation, A.A. and S.S.; writing—original draft preparation, A.A., S.S., W.H. and A.M.A.; writing—review and editing, W.H. and A.M.A.; visualization, A.A. and A.M.A.; supervision, S.S., W.H. and A.M.A.; project administration, S.S. and A.M.A.; funding acquisition, A.M.A. All authors have read and agreed to the published version of the manuscript.
Funding
This research was funded by Taif University, Saudi Arabia, Project No. (TU-DSPP-2024-240).
Institutional Review Board Statement
Ethical review and approval were waived for this study, as it did not involve sensitive or personally identifiable information. Only managerial practices and decision-making logics of firm managers were investigated.
Informed Consent Statement
Informed consent was obtained from all participants, who were informed of the academic purpose and voluntary nature of the study. Responses were kept strictly confidential, with no disclosure of information that could identify firms or managers.
Data Availability Statement
The original contributions presented in this study are included in the article. Further inquiries can be directed to the corresponding author.
Acknowledgments
First, all authors extend their appreciation to Taif University and its Deanship of Scientific Research in Saudi Arabia for providing funding and support for this research under project number (TU-DSPP-2024-240). Second, we are grateful to the company managers whose timely and thorough responses to the survey were essential for this research. Finally, we extend our thanks to the editor and the three anonymous reviewers for their valuable comments and constructive suggestions, which improved the quality of the initial submitted manuscript.
Conflicts of Interest
The authors declare no conflicts of interest.
Abbreviations
The following abbreviations are used in this manuscript:
| Linguistic Terms | |
| CA | Competitive Advantage |
| CCI | Customer-Centric Innovation |
| CF | Customer Focus |
| CR | Customer Relationship |
| DD | Delivery Dependability |
| EDM | Evidence-based Decision Making |
| EP | Engagement of People |
| IDC | Information and Decision Capability |
| IMSs | Integrated Management Systems |
| IMP | improvement |
| IQ | Information Quality |
| IS | Information Sharing |
| LID | leadership |
| LWE | Leadership and Workforce Engagement |
| PA | Process Approach |
| PC | Price/Cost |
| PI | Product Innovation |
| PMA | Process management and agility |
| POS | Postponement |
| QL | product quality |
| QM | Quality Management |
| QMPs | Quality Management Principles |
| QMS | Quality Management System |
| R&D | Research and Development |
| RM | Relationship Management |
| SCMP | Supply Chain Management |
| SCQM | Supply Chain Quality Management |
| SNM | Supplier and network management |
| SSPs | Strategic Supplier Partnerships |
| TM | Time to Market |
| Methodological and Technical Terms | |
| BBMA | Block-Based Modelling Approach |
| χ2/df | Chi-square divided by df |
| CFA | Confirmation Factor Analysis |
| CFI | Comparative Fit Index |
| df | Degree of freedom |
| GCSA | Grouped Criteria Selection Approach |
| GFI | Goodness-of-Fit Index |
| MI | Modification Indices |
| p-CLOSE | Probability of Close Fit |
| RMSEA | Root Mean Square Error of Approximation |
| SEM | Structural Equation Modeling |
| TLI | Tucker–Lewis Index |
Appendix A
Questionnaire: For each question below (Section 2, Section 3 and Section 4), rate the importance of each issue in your firm’s efforts on a 5-point scale: 1 = Never, 2 = Rarely, 3 = Sometimes, 4 = Almost Always, 5 = Always.
Section 1. Company Identification (Anonymous and Never to Be Disclosed or Shared)
- 1.1. Contact name (Interviewee)
- 1.2. Company name
- 1.3. Address
- 1.4. Telephone numbers
- 1.5. Number of employees (Company size)
- 1.6. Managerial ratio
Section 2. Supply Chain Management Practices (SCMP)
- 2.1. Strategic Supplier Partnership (SSP)
- SCMP/SSP1 We consider quality as our number one criterion in selecting suppliers.
- SCMP/SSP2 We regularly solve problems jointly with our suppliers.
- SCMP/SSP3 We have helped our suppliers to improve their product quality.
- SCMP/SSP4 We have continuous improvement programs that include our key suppliers.
- SCMP/SSP5 We include our key suppliers in our planning and goal-setting activities.
- SCMP/SSP6 We actively involve our key suppliers in new product development processes.
- 2.2. Customer Relationship (CR)
- SCMP/CR1 We frequently interact with customers to set reliability, responsiveness, and other standards for us.
- SCMP/CR2 We frequently measure and evaluate customer satisfaction.
- SCMP/CR3 We frequently determine future customer expectations.
- SCMP/CR4 We facilitate customers’ ability to seek assistance from us.
- SCMP/CR5 We periodically evaluate the importance of our relationship with our customers.
- 2.3. Level of Information Sharing (IS)
- SCMP/IS1 We inform trading partners in advance of changing needs.
- SCMP/IS2 Our trading partners share proprietary information with us.
- SCMP/IS3 Our trading partners keep us fully informed about issues that affect our business.
- SCMP/IS4 Our trading partners share business knowledge of core business processes with us.
- SCMP/IS5 We and our trading partners exchange information that helps establishment of business planning.
- SCMP/IS6 We and our trading partners keep each other informed about events or changes that may affect the other partners.
- 2.4. Level of information quality (IQ)
- SCMP/IQ1 Information exchange between our trading partners and us is timely.
- SCMP/IQ2 Information exchange between our trading partners and us is accurate.
- SCMP/IQ3 Information exchange between our trading partners and us is complete.
- SCMP/IQ4 Information exchange between our trading partners and us is adequate.
- SCMP/IQ5 Information exchange between our trading partners and us is reliable.
- 2.5. Postponement (POS)
- SCMP/POS1 Our products are designed for modular assembly.
- SCMP/POS2 We delay final product assembly activities until customer orders have actually been received.
- SCMP/POS3 We delay final product assembly activities until the last possible position (or nearest to customers) in the supply chain.
Section 3. The Quality Management Principles (QMP)
- 3.1. Leadership (LID)
- QMP/LID1: Management conducts regular inspections of quality performance on products and/or services.
- QMP/LID2: Internal quality audits verify quality system effectiveness.
- QMP/LID3: Management shares information and promotes collaboration among departments.
- QMP/LID4: Staff is trained in ISO 9001 requirements.
- 3.2. Engagement of people (EP)
- QMP/EP1: Recognition/rewards programs yield good results in terms of staff performance.
- QMP/EP2: Employees are encouraged to develop new ways to do their job better.
- QMP/EP3: Staff receives adequate training.
- 3.3. Improvement (IMP)
- QMP/IMP1: The organization has clearly established quality goals.
- QMP/IMP2: The planning process includes continuous quality improvement.
- QMP/IMP3: All staff in all areas is focused on making continuous improvement efforts.
- 3.4. Customer Focus (CF)
- QMP/CF1: Product quality is measured by customer satisfaction.
- QMP/CF2: Causes of customer attrition are identified.
- QMP/CF3: There is a systematic process for handling customer complaints.
- QMP/CF4: The company collects information on customer perceptions of product requirements, expectations, and needs.
- 3.5. Process Approach (PA)
- QMP/PA1: There is a strong emphasis on internal customer/supplier relationships.
- QMP/PA2: Error prevention is a part of the company’s work culture
- QMP/PA3: Error correction is always considered in daily operations.
- QMP/PA4: Defective products are handled separately to prevent misuse or delivery.
- 3.6. Evidence-Based Decision Making (EDM)
- QMP/EDM1: Information on quality issues is always timely reported.
- QMP/EDM2: Data collected from measurements are analyzed.
- QMP/EDM3: Quality issues are top priority as criteria when making decisions.
- QMP/EDM4: Project teams take part in the decision making process.
- 3.7. Relationship Management (RM)
- QMP/RM1: Company criteria for supplier selection and evaluation are determined.
- QMP/RM2: Quality is the main criterion for choosing suppliers.
- QMP/RM3: The company seeks to have long-term stable relationships with its suppliers.
Section 4. Competitive Advantage (CA)
- 4.1. Price/Cost (PC)
- CA/PC1 You offer competitive prices
- CA/PC2 You are able to offer prices as low or low as your competitors
- 4.2. Product Quality (QL)
- CA/QL1 Can you compete based on quality?
- CA/QL2 Do you offer products that are highly reliable?
- 4.3. Product innovation (PI)
- CA/PI 1 You provide customized products
- CA/PI 2 You change your product offerings to meet the needs of your customers
- 4.4. Delivery dependability (DD)
- CA/DD1We deliver the kind of products needed.
- CA/DD2 We deliver customer orders on time.
- 4.5. Time to Market (TM)
- CA/TM1We deliver products to market quickly.
- CA/TM2 We are first in the market in introducing new products
References
- Fernandes, A.C.; Sampaio, P.; Sameiro, M.; Truong, H.Q. Supply chain management and quality management integration: A conceptual model proposal. Int. J. Qual. Reliab. Manag. 2017, 34, 53–67. [Google Scholar] [CrossRef]
- Cogollo-Flórez, J.M.; Correa-Espinal, A.A. Analytical modeling of supply chain quality management coordination and integration: A literature review. Qual. Manag. J. 2019, 26, 72–83. [Google Scholar] [CrossRef]
- Flynn, B.B.; Flynn, E.J. Synergies between supply chain management and quality management: Emerging implications. Int. J. Prod. Res. 2005, 43, 3421–3436. [Google Scholar] [CrossRef]
- Kuei, C.H.; Madu, C.N.; Lin, C. The relationship between supply chain quality management practices and organizational performance. Int. J. Qual. Reliab. Manag. 2001, 18, 864–872. [Google Scholar] [CrossRef]
- Robinson, C.J.; Malhotra, M.K. Defining the concept of supply chain quality management and its relevance to academic and industrial practice. Int. J. Prod. Econ. 2005, 96, 315–337. [Google Scholar] [CrossRef]
- Foster, S.T. Towards an understanding of supply chain quality management. J. Oper. Manag. 2008, 26, 461–467. [Google Scholar] [CrossRef]
- Sampaio, P.; Carvalho, M.S.; Fernandes, A.C.; Thi Binh An, D.; Vilhenac, E. An extensive structural model of supply chain quality management and firm performance. Int. J. Qual. Reliab. Manag. 2016, 33, 444–464. [Google Scholar] [CrossRef]
- Soares, A.; Soltani, E.; Liao, Y.Y. The influence of supply chain quality management practices on quality performance: An empirical investigation. Supply Chain. Manag. Int. J. 2017, 22, 122–144. [Google Scholar] [CrossRef]
- Bastas, A.; Liyanage, K. Sustainable supply chain quality management: A systematic review. J. Clean. Prod. 2018, 181, 726–744. [Google Scholar] [CrossRef]
- Vanichchinchai, A. A categorization of quality management and supply chain management frameworks. Cogent Bus. Manag. 2019, 6, 164759. [Google Scholar] [CrossRef]
- Zhou, H.; Li, L. The impact of supply chain practices and quality management on firm performance: Evidence from China’s small and medium manufacturing enterprises. Int. J. Prod. Econ. 2020, 230, 107816. [Google Scholar] [CrossRef]
- Zimon, D.; Urbaniak, M.; Madzík, P.; Prokopiuk, I. Supply chain quality management (SCQM) literature review and model proposal in the era of Industry 4.0. Int. J. Qual. Res. 2022, 16, 1283–1296. [Google Scholar] [CrossRef]
- Nguyen, K.; Akbari, M.; Quang, H.T.; McDonald, S.; Hoang, T.-H.; Yap, T.L.; George, M. Navigating Environmental Challenges through Supply Chain Quality Management 4.0 in Circular Economy: A Comprehensive Review. Sustainability 2023, 15, 16720. [Google Scholar] [CrossRef]
- Van Nguyen, T.; Pham, H.T.; Ha, H.M.; Tran, T.T.T. An integrated model of supply chain quality management, Industry 3.5 and innovation to improve manufacturers’ performance–a case study of Vietnam. Int. J. Logist. Res. Appl. 2024, 27, 261–283. [Google Scholar] [CrossRef]
- Duong Thi Binh, A.; Akbari, M.; Le Thi Cam, H.; Nguyen Canh, L.; Truong Quang, H. Forging Pathways to Circular Economy Excellence: Integrating Industry 4.0 with Quality Management. Sustainability 2024, 16, 3053. [Google Scholar] [CrossRef]
- Bui, L.T.C.; Carvalho, M.; Pham, H.T.; Nguyen, T.T.B.; Duong, A.T.B.; Quang, H.T. Supply chain quality management 4.0: Conceptual and maturity frameworks. Int. J. Qual. Reliab. Manag. 2025, 42, 785–808. [Google Scholar] [CrossRef]
- Liu, Y.; Jiang, Y. The Impact of Supply Chain Quality Management on Firm Performance in Manufacturing Business: The Moderating Role of Digital Intelligence. Sustainability 2025, 17, 4165. [Google Scholar] [CrossRef]
- Kuwornu, J.K.M.; Khaipetch, J.; Gunawan, E.; Bannor, R.K.; Ho, T.D.N. The adoption of sustainable supply chain management practices on performance and quality assurance of food companies. Sustain. Futures 2023, 5, 100103. [Google Scholar] [CrossRef]
- Burgess, P.R.; Sunmola, F.T.; Wertheim-Heck, S. A review of supply chain quality management practices in sustainable food networks. Heliyon 2023, 9, e21179. [Google Scholar] [CrossRef]
- Al-Husain, R.A.; Elshaer, A.M.; Alzuman, A.; Albadry, O.M.; Sheikhelsouk, S.; Al-Monawer, N.S.; Alsetoohy, O. Toward Sustainable Performance in the Hotel Food Supply Chain: Influences of Quality Management Practices and Digital Integration. Adm. Sci. 2024, 14, 314. [Google Scholar] [CrossRef]
- Alkandi, I.; Alhajri, N.; Alnajim, A. Green Supply Chain Management, Business Performance, and Future Challenges: Evidence from Emerging Industrial Sector. Sustainability 2025, 17, 29. [Google Scholar] [CrossRef]
- Plakantara, S.P.; Karakitsiou, A. Transforming Agrifood Supply Chains with Digital Technologies: A Systematic Review of Safety and Quality Risk Management. Oper. Res. Forum 2025, 6, 113. [Google Scholar] [CrossRef]
- FAO. The State of Food and Agriculture, 2023, Revealing the True Cost of Food to Transform Agrifood Systems; Food and Agriculture Organization of the United Nations: Rome, Italy, 2023. [Google Scholar] [CrossRef]
- ISO 9001:2015; Quality Management Systems—Requirements. International Organization for Standardization: Geneva, Switzerland, 2015.
- ISO 22000:2018; Food Safety Management Systems—Requirements for any Organization in the Food Chain. International Organization for Standardization: Geneva, Switzerland, 2018.
- Zaibet, L.; Bachta, M.S.; Lajimi, A.; Abbassi, M. Consumers’ Perception of Food Product Quality in Tunisia. J. Int. Food Agribus. Mark. 2004, 16, 165–178. [Google Scholar] [CrossRef]
- Haj, K.A.; Dhiaf, M.M. Do information and communication technologies affect the performance of a supply chain? Pieces of evidence from the Tunisian food sector. Yugosl. J. Oper. Res. 2019, 29, 539–552. [Google Scholar] [CrossRef]
- Ghariani, R.; Soltane, G.; Boujelbene, Y. Digitalization, supply chain integration, and financial performance: Evidence from Tunisia’s agro-industrial sector. Uncertain Supply Chain Manag. 2026, 14. Available online: https://www.growingscience.com/uscm/online/uscm_2025_17.pdf (accessed on 25 September 2025).
- Turki, M.; Medhioub, E.; Kallel, M. Evaluation of a national food industry based on environmental performance and condition indicators: Critical success and barriers of EMS implementation in Tunisia. Environ. Syst. Decis. 2017, 37, 423–434. [Google Scholar] [CrossRef]
- ISO 14001:2015; Environmental Management Systems—Requirements with Guidance for Use. International Organization for Standardization: Geneva, Switzerland, 2015.
- Li, S.; Ragu-Nathan, B.; Ragu-Nathan, T.S.; Rao, S. The impact of supply chain management practices on competitive advantage and organizational performance. Omega 2006, 34, 107–124. [Google Scholar] [CrossRef]
- Truong, H.Q.; Sameiro, M.; Fernandes, A.C.; Sampaio, P.; Duong Thi Binh, A.; Duong, H.H.; Vilhenac, V. Supply chain management practices and firms’ operational performance. Int. J. Qual. Reliab. Manag. 2017, 34, 176–193. [Google Scholar] [CrossRef]
- Gera, R.; Yadav, R.; Khera, G.S.; Saxena, S.; Chadha, P.; Dixit, S.; Sergeevna, L.Y. A systematic literature review of supply chain management practices and performance. Mater. Today Proc. 2022, 69, 624–632. [Google Scholar] [CrossRef]
- Ebrahimi, M.; Sadeghi, M. Quality management and performance: An annotated review. Int. J. Prod. Res. 2013, 51, 5625–5643. [Google Scholar] [CrossRef]
- Sanchez-Lizarraga, M.A.; Limon-Romero, J.; Tlapa, D.; Baez-Lopez, Y.; Puente, C.; Puerta-Sierra, L. ISO 9001 Standard: Developing and Validating a Survey Instrument. IEEE Access 2020, 8, 190677–190688. [Google Scholar] [CrossRef]
- Porter, M.E. The Competitive Advantage: Creating and Sustaining Superior Performance; Free Press: New York, NY, USA, 1985. [Google Scholar]
- McGinnis, M.A.; Vallopra, R.M. Purchasing and supplier involvement in process improvement: A source of competitive advantage. J. Supply Chain Ma Nagement 1999, 35, 42–50. [Google Scholar] [CrossRef]
- Emir, S.; Sulistyowati, N. The Effect of Supply Chain Management and Total Quality Management on Operational Performance through Competitive Advantage. Int. J. Res. Bus. Soc. Sci. 2024, 13, 27–37. [Google Scholar] [CrossRef]
- Gawankar, S.A.; Kamble, S.S.; Raut, R.D. An investigation of the relationship between supply chain management practices (SCMP) on supply chain performance measurement (SCPM) of Indian retail chain using SEM. Int. J. Supply Chain Manag. 2018, 7, 1–10. [Google Scholar] [CrossRef]
- Vanichchinchai, A.; Igel, B. The impact of total quality management on supply chain management and firm’s supply performance. Int. J. Prod. Res. 2011, 49, 3405–3424. [Google Scholar] [CrossRef]
- Nunnally, J.C. Psychometric Theory; McGraw-Hill: New York, NY, USA, 1978. [Google Scholar]
- Okpala, C.O.R.; Korzeniowska, M. Understanding the Relevance of Quality Management in Food Product Industry: From Ethical Considerations to Assuring Food Hygiene Quality Safety Standards and Its Associated Processes. Food Rev. Int. 2021, 39, 1879–1952. [Google Scholar] [CrossRef]
- Saida, E.; Taibi, N. ISO 9001 Quality Approach and Performance Literature Review. Eur. Sci. J. 2021, 17, 128. [Google Scholar] [CrossRef]
- Singh, P.J. Empirical assessment of ISO 9000 related management practices and performance relationships. Int. J. Prod. Econ. 2008, 113, 40–59. [Google Scholar] [CrossRef]
- Oakland, J.S. Total Quality Management and Operational Excellence, 4th ed.; Routledge: Oxfordshire, UK, 2014. [Google Scholar] [CrossRef]
- Zehir, C.; Ertosun, Ö.G.; Zehir, S.; Müceldili, B. Total Quality Management and Performance: The Role of Organizational Culture. J. Bus. Econ. Manag. 2012, 13, 606–620. [Google Scholar]
- Zhu, X.; Raquel, M.; Aryadoust, V. Chapter 5: Structural Equation Modeling to Predict Performance en English Proficiency Tests in Quantitative Data Analysis for Language Assessment Volume II: Advanced Methods, 1st ed.; Aryadoust, V., Raquel, M., Eds.; Routledge: Oxfordshire, UK, 2019. [Google Scholar]
- Kenny, D.A.; Kaniskan, B.; McCoach, D.B. The Performance of RMSEA in Models with Small Degrees of Freedom. Sociol. Methods Res. 2014, 44, 486–507. [Google Scholar] [CrossRef]
- Alduais, F.; Raoush, A.; Samara, A.; Sartawi, K. The impact of information sharing on the quality of decision-making: From the point of view of employees in Jordanian private hospitals. Cogent Bus. Manag. 2023, 10, 2195028. [Google Scholar] [CrossRef]
- Baldi, B.; Confente, I.; Russo, I.; Gaudenzi, B. Consumer-Centric Supply Chain Management: A Literature Review, Framework, and Research Agenda. J. Bus. Logist. 2024, 45, e12399. [Google Scholar] [CrossRef]
- Chavez, R.; Yu, W.; Feng, M.; Wiengarten, F. The Effect of Customer-Centric Green Supply Chain Management on Operational Performance and Customer Satisfaction. Bus. Strategy Environ. 2016, 25, 205–220. [Google Scholar] [CrossRef]
- Alfalla-Luque, R.; García, D.E.L.; Marin-Garcia, J.A. Supply chain agility and performance: Evidence from a meta-analysis. Int. J. Oper. Prod. Manag. 2023, 43, 1587–1633. [Google Scholar] [CrossRef]
- Zhao, Q. Enhancing Supply Chain Resilience Through Strategic Supplier Relationship Management. Advances in Economics. Manag. Political Sci. 2025, 203, 1–10. [Google Scholar] [CrossRef]
- Bashir, M.; Saleem, S.; Ain, Q.T.; Bari, M.W. The Impact of Change-Oriented Leadership on Employees’ Performance: Mediating Role of Employees’ Engagement. Int. J. Innov. Creat. Change 2021, 15, 559–574. Available online: https://www.ijicc.net/images/Vol_15/Iss_8/15840_Bari_2021_E_R1.pdf (accessed on 25 September 2025).
- ISO 45001:2018; Occupational Health and Safety Management Systems—Requirements with Guidance for Use. International Organization for Standardization: Geneva, Switzerland, 2018.


Disclaimer/Publisher’s Note: The statements, opinions and data contained in all publications are solely those of the individual author(s) and contributor(s) and not of MDPI and/or the editor(s). MDPI and/or the editor(s) disclaim responsibility for any injury to people or property resulting from any ideas, methods, instructions or products referred to in the content. |
© 2025 by the authors. Licensee MDPI, Basel, Switzerland. This article is an open access article distributed under the terms and conditions of the Creative Commons Attribution (CC BY) license (https://creativecommons.org/licenses/by/4.0/).