The authors would like to make the following corrections about the published paper [1]. The changes are as follows:
- (1)
- Replacing the following text in Section 3.3. “Geostatistical analysis of DR and ESAI”, first paragraph:
The best geostatistical range was determined for DR, with the current sampling density yielding a range value of 145 m. This indicates that desertification risk levels within this range are spatially dependent. Specifically, the DR of two sites less than 145 m apart is identical, while samples taken from greater distances are independent.
With
The best geostatistical range was determined for ESAI, with the current sampling density yielding a range value of 85 m. This indicates that ESAI within this range is spatially dependent. Specifically, the ESAI of two sites less than 85 m apart is identical, while samples taken from greater distances are independent.
- (2)
- Replacing the following text in Section 4.2. “Spatial Patterns and Dependency in DR and ESAI”, first paragraph, second sentence:
The results showed that the DR (42.74%) has moderate spatial dependence, while the ESAI (0.31%) has significant spatial dependence (see Table 5), which is consistent with the categories suggested by [78].
With
The results showed that the DR (55.80%) has moderate spatial dependence, while the ESAI (0.29%) has strong spatial dependence (see Table 5), which is consistent with the categories suggested by [78].
- (3)
- Replacing the following sentence in Section 4.2. “Spatial Patterns and Dependency in DR and ESAI”, third paragraph, first sentence:
The semivariogram analysis showed that the maximum effect distance, or geostatistical range (A), for the ESAI, is 39 m, whereas the DR reaches a range of 145 m (Table 5).
With
The semivariogram analysis showed that the maximum effect distance, or geostatistical range (A), for the ESAI, is 85 m, whereas the DR reaches a range of 74 m (Table 5).
- (4)
- Replacing the following paragraph in Section 4.3. “Mapping of DR and ESAI”, second paragraph:
The DR values in the study area range from 4.42 to 5.08. The highest-risk zones, marked in green, are primarily located in the northern and northeastern regions, while the lower-risk areas, indicated in light blue, are primarily found in the southern and southwestern sections (Figure 3). This distribution highlights the complex interaction between natural factors, such as soil type and climate, and human activities, including land use and deforestation changes. Together, these factors influence the region’s vulnerability to desertification. The northern and northeastern regions, exhibiting DR values over 5.08, signify zones with considerable vulnerability to desertification. These regions display delicate soil compositions, limited water-retention abilities, and minimal vegetation cover, consistent with the observations of Berrahmouni et al. [114], who indicate that these traits are prevalent in places at significant risk of desertification. The susceptibility of these regions to wind and water erosion intensifies soil deterioration and jeopardizes ecosystem resilience, a trend similarly noted in other Mediterranean climates marked by semi-arid conditions.
With
The DR values in the study area range from 3.24 to 5.57 (Figure 3). The highest-risk zones, marked in green, are primarily located in the northern and northeastern regions, while the lower-risk areas, indicated in light blue, are primarily found in the southern and southwestern sections (Figure 3). This distribution highlights the complex interaction between natural factors, such as soil type and climate, and human activities, including land use and deforestation changes. Together, these factors influence the region’s vulnerability to desertification. The northern and northeastern regions, exhibiting DR values over 5.08, signify zones with considerable vulnerability to desertification. These regions display delicate soil compositions, limited water-retention abilities, and minimal vegetation cover, consistent with the observations of Berrahmouni et al. [114], who indicate that these traits are prevalent in places at significant risk of desertification. The susceptibility of these regions to wind and water erosion intensifies soil deterioration and jeopardizes ecosystem resilience, a trend similarly noted in other Mediterranean climates marked by semi-arid conditions.
- (5)
- Replacing the following sentence in Section 4.3. “Mapping of DR and ESAI”, fourth paragraph, first sentence:
The southern and southwestern areas, exhibiting DR values ranging from 4.42 to 4.58, denote moderate-risk areas.
With
The southern and southwestern areas, exhibiting DR values ranging from 3.24 to 4.40, denote moderate-risk areas.
- (6)
- Due to an oversight, the old versions of Figures 2–4 were included in the published article. The semivariograms presented in Figure 2 (Figure 2a,c in the main text) were reconstructed due to an error in the UTM coordinate data entry into the GS+ Package program. The semivariogram analyses were repeated, and the four data points (four extreme values belonging to coordinates approximately 50–60 km from the study area) were excluded from the spatial analysis. Removing these four values has also changed the number of lag classes used in the analysis. By reconstructing the semivariogram, there was a change in the cross-validation results, that is, the scatter plot of the data (Figure 2b,d in the main text). The maps obtained (Figures 3 and 4), contingent on the semivariograms and cross-validation outcomes, have changed. Authors would like to make these changes in Figures 2–4. The correct Figure 2, Figure 3 and Figure 4 are as follows.

Figure 2.
Isotropic variograms and correlation analyses for Degradation Risk (DR) and Environmental Sensitivity Area Index (ESAI). Panels (a) and (c) show isotropic variograms of DR and ESAI, respectively, illustrating the spatial structure and semivariance of each parameter over separation distances. Panels (b) and (d) present scatter plots (cross validation) comparing actual versus estimated values of DR and ESAI, respectively, with correlation coefficients of r = 0.71 and r = 0.75. These correlations indicate a strong predictive relationship between estimated and actual values for both DR and ESAI, supporting the robustness of the estimation model.
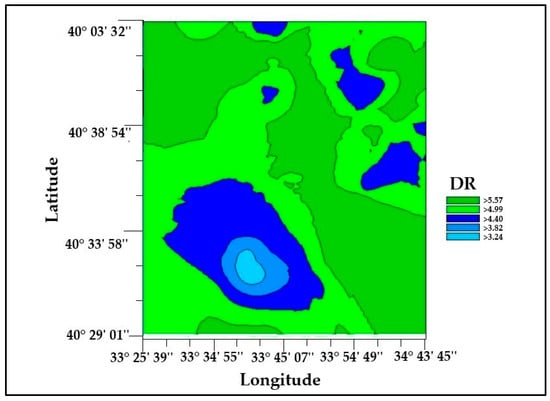
Figure 3.
The spatial pattern of interpolated-kriging values of the study area’s Desertification Risk (DR).

Figure 4.
The spatial pattern of interpolated-kriging values of the study area’s Environmental Sensitivity Area Index (ESAI).
- (7)
- The changes in the semivariogram model have caused some changes in the semivariogram parameters of DR and ESAI, as shown in Table 5. As such, we need to replace the original Table 5 in Section 3.3. Geostatistical analysis of DR and ESAI. The correct Table 5 is as follows.

Table 5.
Isotropic variogram parameters for DR and ESAI in the study area.
Table 5.
Isotropic variogram parameters for DR and ESAI in the study area.
| Variables | Model | Co (Nugget) | Cs (Sill) | Co/Cs × 100 | A (m) | RSS | Spatial Dependency | R2 | r |
|---|---|---|---|---|---|---|---|---|---|
| DR | exponential | 0.895 | 1.595 | 55.80 | 74.00 | 2.463 × 10⁻³ | moderate | 0.870 | 0.71 |
| ESAI | exponential | 0.001 | 0.343 | 0.29 | 85.00 | 3.128 × 10⁻⁶ | strong | 0.690 | 0.75 |
Note. Cs: Sill. Co: Nugget variance. A: Geostatistical Range. RSS: Residual Sum of Squares. R2 = Coefficient of Determination. r: Correlation Coefficient for Cross Validation. DR: Desertification Risk. ESAI: Environmental Sensitivity Area Index.
The authors state that the scientific conclusions are unaffected. This correction was approved by the Academic Editor. The original publication has also been updated.
Reference
- Gül, E.; Esen, S. High Desertification Susceptibility in Forest Ecosystems Revealed by the Environmental Sensitivity Area Index (ESAI). Sustainability 2024, 16, 10409. [Google Scholar] [CrossRef]
Disclaimer/Publisher’s Note: The statements, opinions and data contained in all publications are solely those of the individual author(s) and contributor(s) and not of MDPI and/or the editor(s). MDPI and/or the editor(s) disclaim responsibility for any injury to people or property resulting from any ideas, methods, instructions or products referred to in the content. |
© 2025 by the authors. Licensee MDPI, Basel, Switzerland. This article is an open access article distributed under the terms and conditions of the Creative Commons Attribution (CC BY) license (https://creativecommons.org/licenses/by/4.0/).