Abstract
The aim of this study is to explore the spatiotemporal variation and the transfer of ecosystem service value (ESV) in Jiuquan City from 2005 to 2020 to help ecological development. Based on the equivalent factor method and the grid analysis, employed to analyze the spatial and temporal changes in ecosystem service values in Jiuquan City, the fracture point model and the field strength model were applied to calculate the transfer of ecosystem service value in seven districts and counties of Jiuquan City. The ESV of Jiuquan City showed an overall increasing trend, and all individual ESVs showed increasing trends, except for water supply, with the ESV of regulating services showing the most significant growth from 2005 to 2020. The top three secondary ESVs were hydrological regulation, climate regulation, and environmental purification, with regulatory services accounting for the largest proportion, followed by support services, supply services, and cultural services. From 2005 to 2020, the distribution of high and low ESV zones in Jiuquan City did not change significantly, with the high-value zones being mainly located in Suzhou District, south of Subei County and Yumen City, and the low-value zones being concentrated in Dunhuang City, Guazhou County, north of Suebei County, and Jinta County. The ESVs transfers from each district in the study area, in descending order, were Guazhou County, Subei County, Yumen City, Dunhuang City, Aksai County, Jinta County, and Suzhou District. Guazhou and Subei were the main ESV exporters. Areas with high ESV exports tended to have high ESV values. Hydrologic regulation is the service type with the largest transfer volume, accounting for 19.00% of the total ESV transfer in Jiuquan. Jiuquan possesses the highest ecosystem service value in the Gansu Province, China, indicating a superior ecological status.
1. Introduction
The evolution of land use has profoundly altered the structure and function of the Earth’s surface, influencing the distribution patterns of landscapes, and is closely related to ecosystem service functions, becoming a primary driver of changes in the value of ecosystem services [1]. Ecosystem services encompass provisioning, regulating, cultural, and supporting services, forming a crucial link between natural ecosystems and human society. They play a pivotal role in maintaining ecological balance and promoting sustainable development [2,3]. The scientific estimation of ecosystem service value (ESV) not only enhances awareness of ecological conservation but has also become an indispensable tool for ecological protection and development in any region [4,5]. Understanding the spatiotemporal dynamics of ESV provides a mirror, reflecting the health status of ecosystems and the trajectory of environmental changes, offering a multidimensional perspective to observe the interactions between ecosystems and human society, which is essential for advancing sustainable development initiatives.
In China, Jiuquan City, as the largest city in Gansu Province and situated at the core of the Hexi Corridor, is not only a key national ecological function area but also a restricted development zone within the province. The fragile ecological environment of Jiuquan City, susceptible to human activities, holds critical value for regional and national ecological security, economic development, and social stability. A systematic study of ESV and its spatial changes and inter-regional transfers across the seven districts and counties of Jiuquan City aids in the conservation and utilization of biodiversity, enhances water resource management capabilities, and ensures water source security in the Yellow River Basin. Furthermore, the research outcomes contribute to alleviating regional water scarcity, promoting coordinated agricultural development and providing a scientific basis for global desertification control, thereby effectively protecting valuable arable land resources, maintaining ecological balance, and preserving biodiversity, offering a solid guarantee for the healthy development of global agriculture.
Globally, the assessment of ecosystem services value (ESV) has emerged as a significant branch within ecological economics. Since the concept of “existence value” was first introduced by Krutilla in 1967 [6], the field has witnessed remarkable growth. Costanza and colleagues have constructed an ESV assessment system that has garnered international acclaim and widespread application [7]. International research on ESV has primarily focused on theoretical frameworks, quantitative analysis, evaluation, and forecasting [8,9]. In China, the renowned ecologist Xie Gaodi has made significant contributions to the field of ESV assessment. Building upon Costanza’s research, Xie developed a theoretical framework for ESV assessment tailored to China’s specific national conditions and unique geographical characteristics, clarifying the content, methods, and indicator systems that have been extensively applied in regional ecological studies in China [10,11]. Currently, there are two main methods for ESV accounting: the functional value method and the equivalent factor method. Zhang and his colleagues compared these two methods and found that the equivalent factor method, which uses the ecosystem as the standard functional unit for providing ecological service products, simplifies the calculation process and facilitates widespread promotion and application [12,13]. By integrating Xie’s ecosystem service value equivalent factor system, it was found that the equivalent factor method is more operationally convenient [14]. Therefore, this study employs the equivalent factor method and grid analysis to investigate the spatiotemporal changes in ESV in Jiuquan City and its seven districts from 2005 to 2020. This standardization is crucial for regional and global comparisons and for policy decisions affecting land use and conservation planning. The breakpoint model and field strength model were applied to calculate the ESV transfer volumes in the seven districts of Jiuquan City. This model is essential for understanding the flow of ecosystem services between different regions, which is vital for effective management and ensuring the sustainable supply of ecosystem services. This research not only aids in the protection and utilization of the biodiversity and improved water resource management in Jiuquan City but also holds significant scientific importance for alleviating regional water shortages, promoting coordinated agricultural development, and preventing desertification. It provides a scientific basis for ecological protection and regional sustainable development.
The ESV research in Jiuquan City is not only relevant to local and regional planning but also contributes to the global discourse on ecosystem service assessment and sustainable development. As the impacts of climate change, urbanization, and land use changes continue to reshape global ecosystems, the demand for robust methods to assess and manage ESV becomes increasingly urgent. This study aims to fill a gap in the literature by providing a detailed analysis of ESV changes and transfers in a critical ecological region of China, offering insights for multi-level policy and management decisions.
In summary, this introduction lays the groundwork for a comprehensive analysis of ESV in Jiuquan City, emphasizing the importance of understanding the value of ecosystem services in the context of global environmental change and sustainable development. The findings of this study will aid in guiding conservation efforts, planning land use, and promoting the sustainable management of ecosystems in Jiuquan City and other regions.
2. Materials and Methods
2.1. Introduction to the Study Area
Jiuquan City is located in the northwest of Gansu Province, at the western end of the Hexi Corridor, and is a national transportation hub and strategic location. As shown in Figure 1, Jiuquan has a vast municipal area, accounting for 42% of the area of Gansu Province, and the terrain is high in the south and low in the north, with an overall inclination from southwest to northeast. The city is dominated by a cold temperate arid climate, with the western edge region belonging to a warm temperate arid climate, and the southern Qilian Mountains being a cold alpine semi-arid to semi-humid climate, with significant vertical climatic differences. In addition, Jiuquan City has a large temperature difference between day and night and rich heat resources, which provide strong support for local agricultural development. However, the rainfall is small, with an average annual value of 81.8 mm, making it the region with the least rainfall in Gansu Province. The rainfall decreases from south to north, with a difference of up to 4.2 times between north and south. As of 2023, Jiuquan City governs one district, two cities, and four counties, namely Suzhou District, Yumen City, Dunhuang City, Jinta County, Guazhou County, Subei Mongolian Autonomous County (referred to as Subei County), and Akesai Kazakh Autonomous County (referred to as Akesai County).
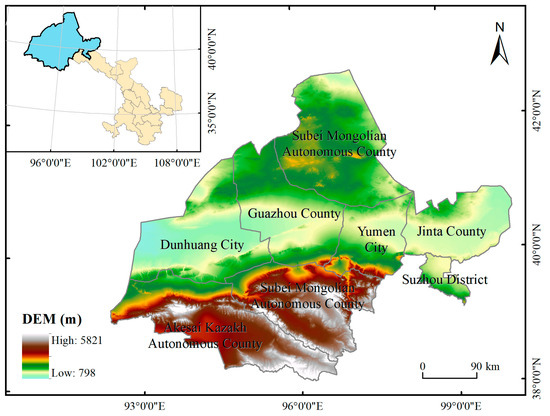
Figure 1.
Location and scope of Jiuquan City.
2.2. Data Sources
Socioeconomic data such as grain yield, sown area, and grain prices come from the “Jiuquan Yearbook” [15], “Gansu Development Yearbook” [16], “National Agricultural Product Cost-Benefit Data Compilation”, and “China Statistical Yearbook” [17]. The four-period land use remote sensing data of Jiuquan City from 2005 to 2020 come from the annual China Land Cover Dataset (CLCD) from Landsat released by Yang Jie et al. [18] on the GEE platform, with a spatial resolution of 30 m × 30 m. It is combined with ArcGIS10.8 for reclassification to obtain the six categories required for this paper: cultivated land, forest land, grassland, water area, construction land, and unused land.
2.3. Research Methods
2.3.1. Value of Ecosystem Services
The economic value of grain crops per unit area of farmland was corrected according to the basic equivalence table of ecosystem service value per unit area in the latest research results of Xie [14], as well as the price of grain crops in Jiuquan City from 2005 to 2020, and the output of grain crops per unit area. The final result is 1/7 of the average market value of grain crops per unit area output per year, and the revision method is as follows [19]:
where is the annual market value of food crops per unit area of farmland in the study area (CNY/hm2); is the annual yield of food crops per unit area (kg/hm2); and . is the national average price of food crops (CNY/kg).
After the revision, the ESV was calculated based on the annual area values of Jiuquan City and seven districts and counties, calculated by Acigis 10.8, to further investigate the spatial and temporal evolution of ecosystem service value in Jiuquan City. Yi’s analysis of the spatiotemporal changes in ecosystem services within ecologically fragile areas of Jilin Province, China [20], along with Zheng’s research on the spatiotemporal evolution of land use in Shandong Province, have provided insights for the present study [21]. The calculation formula is as follows:
where is the coefficient of ecosystem service value; is the value of equivalent ecosystem service value per unit area given by Xie Gao Di in 2010; ESV is the total amount of ecosystem service value; and is the area of the ith class of land-use type (hm2).
2.3.2. Value Transfer of Ecosystem Service Functions
The amount of ecosystem service function value transfer decreases with the increase in spatial distance between regions [22,23]. The transfer of ecosystem service function between regions also follows the same law [24]. On the basis of calculating the value of ecosystem services obtained, the value transfer of ecosystem service functions was further calculated to quantitatively reflect the health status and change trend of ecosystems in seven districts and counties of Jiuquan City. The spatial scope of ecosystem service value that can be affected by the transferring land in the seven districts and counties was determined via the fracture point model, and the intensity of ecosystem service value transferred from the transferring land to the transferring land per unit area was determined via the field strength model.
The formula for calculating the boundary range of ecological service function effects is as follows [24]:
where is the maximum radius of action of the ecosystem service value of the transfer site i on its surrounding area; is the distance between the geometric centroid of the ecosystem service value of the transfer site and the transfer site; Vi is the value of the ecosystem service of the transfer site; Vj is the value of the ecosystem service of the transfer site; i denotes the transfer site; and j denotes the transfer site. According to Equation (4), the boundaries and extent of the actual affected area can be calculated, and the area of ecosystem service transfer can be estimated by using ArcGIS buffer analysis.
The formula for the transfer intensity of ecosystem service values is as follows [24]:
where Sij is the average transfer intensity of ecosystem service value from the export region i to the import region j; Vi is the ESV of the export region; and Dij is the distance between the geometric center points of the export region and the import region.
After determining the maximum radius of action of the ecosystem service value of the transfer site to its surrounding area and the average transfer intensity of the ecosystem service value from the transfer site to the transfer site, the total ecosystem service value transferred from the transfer site to the transfer site in the seven districts and counties was further calculated to better assess the ecological health of the seven districts and counties in Jiuquan City.
The formula for ecosystem service value transfer volume is as follows [25]:
where Vij is the total amount of ecosystem service value transferred from region i to region j; Kij is the natural transfer experience coefficient of ecosystem service value from region i to region j, with a value range of [0, 1], which is positively correlated with the frequency and scale of the medium of transmission (such as water, wind, and biology) of ecological service, and is affected by natural factors; and A is the area where the region intersected with the ecological radiation buffer zone within the radiation radius of the export region.
We take the geometric center of Jiuquan City as the center of the circle, combined with the maximum radius of the ecosystem service value of the role of the buffer analysis to obtain the required ecological radiation buffer, and intersect the transfer site with the ecological radiation buffer to obtain the ecological radiation impacts of the affected area. According to the corresponding formula of previous researchers, the k value is mainly determined via the spatial transfer medium of ecological service function [25,26], and combined with the actual situation of Jiuquan City districts and counties, we set the k value of ecological service function as a medium of the river to be 0.8, the k value of ecological service function as a medium of the atmosphere to be 0.6, and the k value of ecological service function as a medium of the soil and organisms to be 0.5, and if the medium of the soil and organisms is 2 and more, then the k value is taken as the average value. If the medium is 2 or more, the k-value is taken as the average value.
3. Results
3.1. Estimation and Analysis of Ecosystem Service Value
3.1.1. Evaluation Model Indicator Revision
Based on the sown area, yield, and average purchase price of the main grain crops in the research area, the average economic value of unit area grain crops in the research area from 2005 to 2020 is calculated to be CNY 8148.74, and the data of the ecosystem service value equivalent factor table based on the unit area ecosystem service value constructed by Xie Gaodi in 2010 are revised. Based on the grain production data of Jiuquan City, the ESV conversion table of Jiuquan City is estimated, as shown in Table 1, and the evaluation model is constructed.

Table 1.
Modified ecosystem service value equivalents for different land use types in Jiuquan City.
3.1.2. Total Ecosystem Service Value
Using Arcgis10.8 to draw the land use type distribution map of Jiuquan City from 2005 to 2020, it can be seen that the land use types in the research area have not changed significantly during this period, as shown in Figure 2. However, by further calculating the ESV of the research area, it is found that the research area’s ESV shows a state of rising first and then falling, and the overall trend is rising, with the ESV increasing from CNY 503,634,431,000 to CNY 542,196,411,000, as shown in Figure 3a. The change rate of ESV from 2015 to 2020 is the lowest, while the change rate from 2005 to 2010 is the highest, as shown in Figure 3b. From 2005 to 2015, the ESV of the research area showed an upward trend, increasing from CNY 503,634,431,000 to CNY 567,395,617,000. During this period, the ESV of the five land use types all increased. From 2015 to 2020, the ESV of the research area showed a downward trend, decreasing from CNY 567,395,617,000 to CNY 542,196,411,000. During this period, the ESV of the five land use types all decreased to a certain extent, with the ESV of forest land changing the least, as shown in Table 2 and Figure 3.
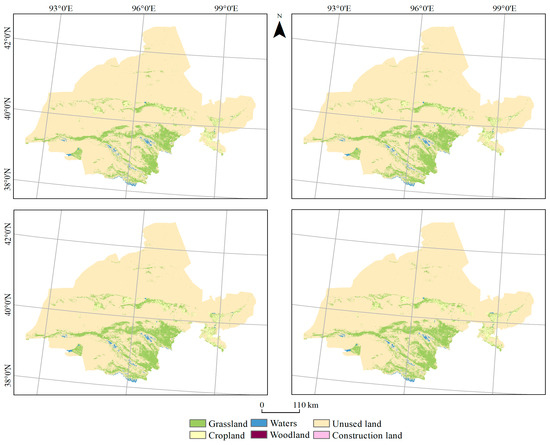
Figure 2.
Comparison of land use types in Jiuquan City from 2005 to 2020.
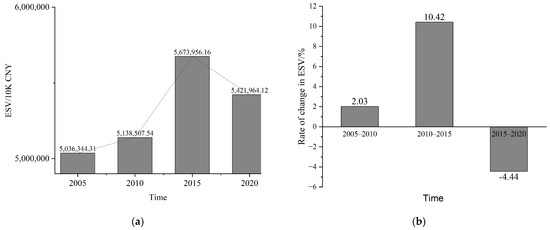
Figure 3.
The total value of ecosystem services and its rate of change in Jiuquan City from 2005 to 2020: (a) total annual value of ecosystem services in Jiuquan; (b) rate of change in the value of ecosystem services in Jiuquan, 2005–2020.
Table 2.
Total amount of ESV in Jiuquan from 2005 to 2020 (unit: CNY 104).
3.1.3. Single Ecosystem Service Values
From 2005 to 2020, the composition structure of the individual ecosystem service values (ESVs) in Jiuquan City remained relatively stable with minimal fluctuations, as shown in Table 3. The average values of regulating services, supporting services, provisioning services, and cultural services from 2005 to 2020 were CNY 3,605,979.67 million, CNY 1,124,149.07 million, CNY 347,977.86 million, and CNY 56,567.93 million, respectively. Regulating services had the largest share, with an average proportion of 63.89% over the years, while provisioning services had the smallest share, with an average proportion of 6.17% over the years. The large share of regulating service value indicates that Jiuquan City’s ecosystem is dominated by natural ecosystems.
Table 3.
Proportion of individual ESV and function in Jiuquan City from 2005 to 2020.
Looking at individual ESVs from 2005 to 2020, all ESVs, except for water resource supply within provisioning services, showed an upward trend. From 2005 to 2020, provisioning services experienced the largest change, with a total decrease of 0.55%, while regulating services decreased by 0.31%, supporting services increased by 0.36%, and cultural services increased by 0.02%. The changes in individual ESVs during the study period were closely related to the changes in cultivated land, forest land, grassland, and water area.
Through the analysis of secondary ecosystem service values, it was found that hydrological regulation and climate regulation services within regulating services accounted for the largest proportion. The secondary ecosystem service values, in descending order, are hydrological regulation, climate regulation, purification of the environment, soil conservation, biodiversity, gas regulation, aesthetic landscape, raw material production, food production, water supply, and maintenance of nutrient cycles. As shown in Table 3, among the secondary ecosystem service values, hydrological regulation had the largest proportion, with an average proportion of 27.66% over the years; climate regulation followed, with an average proportion of 18.07% over the years; and the maintenance of nutrient cycle service function had the lowest average proportion over the years, with a value of 0.86%. The dominance of hydrological regulation is due to the fact that there are many important rivers and irrigation districts within Jiuquan City, and Jiuquan City has an arid climate, with low average annual rainfall and high evaporation, so superior hydrological regulation technology has become crucial, reflecting the ESV response to land use structure during the study period.
3.2. Patterns of Distribution of Changes in the Value of Ecosystem Services
3.2.1. Patterns of Value Distribution of Ecosystem Services at the Grid Scale
Based on the grid scale, spatial autocorrelation analysis was used to explore the spatial distribution characteristics and variation patterns of ESV in Jiuquan City. Using ArcGIS10.8 software to create a fishnet and zoning statistics tool, due to the large area of Jiuquan City, the spatial region of the research area was divided into 10 km × 10 km pixel units, and divided into low-value areas (CNY 0–800 million), lower-value areas (CNY 800–2500 million), medium-value areas (CNY 2500–8000 million), higher-value areas (CNY 8000–25,000 million), and high-value areas (>CNY 25,000 million) to obtain the spatial distribution maps of ecosystem service values in Jiuquan City from 2005 to 2020, as shown in Figure 4.
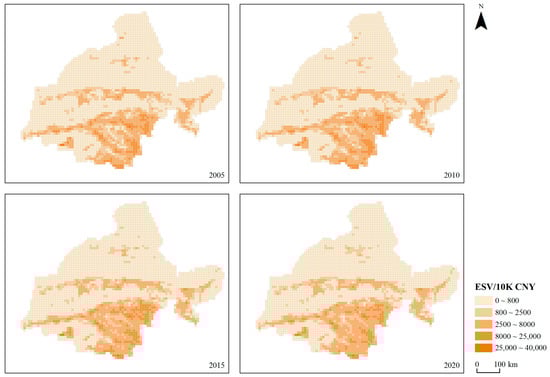
Figure 4.
Spatial distribution pattern of ESVs in Jiuquan City from 2005 to 2020.
Overall, there are significant differences in the spatial distribution of ESV in each district of Jiuquan City. From 2005 to 2020, the area of high ESV in Jiuquan City has decreased, and low-value areas are mainly distributed in Jinta County, the central part of Akesai County, Dunhuang City, Guazhou County, and the northern part of Subei County. In 2000, medium-value areas were mainly distributed in Subei County, Suzhou District, and the eastern part of Akesai County. From 2005 to 2020, there was no significant change in the overall high and low ESV areas in Jiuquan City.
3.2.2. Patterns of Change in the Value of Ecosystem Services at the Grid Scale
Using the GIS grid scale method to divide 10 km × 10 km grids for ESV spatial pattern visualization, the ESV change spatial distribution of the seven districts and counties in Jiuquan City was obtained, as shown in Figure 5. Overall, more than 30% of the areas in the seven districts and counties of Jiuquan City from 2005 to 2020 all showed a significant downward trend. Between 2005 and 2010, ESV positive growth areas were concentrated in Subei Mongolian Autonomous County (south), Akesai County, Yumen City, and Suzhou District, among which the increment in Yanshan District was the most significant. Between 2010 and 2015, a large number of ESV increases were observed in all seven districts and counties of Jiuquan City. Dunhuang City and the northern part of Subei County had a significant increase in ESV compared to previous years, mainly distributed in the central part of Dunhuang City and the southwestern part of the northern part of Subei County, and the central part of Yumen City and the northwestern part of Akesai County also had a significant increase in ESV. Between 2015 and 2020, the ESV in the seven districts and counties of Jiuquan City changed significantly. Except for Akesai County and Jinta County, the ESV in the other five districts and counties all showed a trend of large-scale reduction.
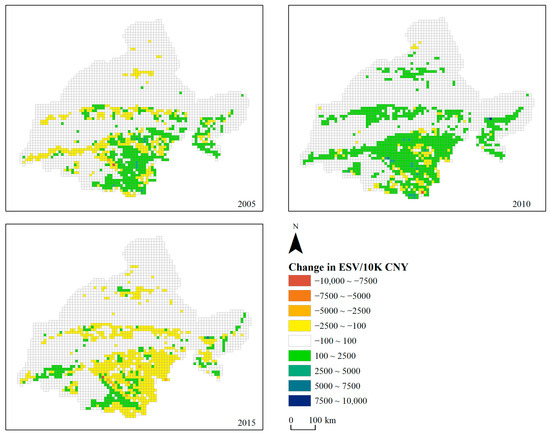
Figure 5.
Spatiotemporal changes of ESV in Jiuquan City in years.
3.3. Transfers of Ecosystem Service Values
3.3.1. Value of Ecosystem Services in 2020
Since the city developed rapidly in 2020 and the ESV change was the most significant during this period, 2020 was selected as the period for studying the ESV transfer changes in Jiuquan City, which can also provide a reference for the future urban development of Jiuquan City. The ESV of Jiuquan City and the ESV of each district and county in Jiuquan City were obtained by the equivalent factor method, as shown in Table 4 and Table 5.
Table 4.
ESV of Jiuquan City in 2020 (unit: CNY 104).
Table 5.
ESV of districts and counties in Jiuquan City in 2020 (unit: CNY 104).
In 2020, the ESV of Jiuquan City was CNY 12,042,500,870. Grassland accounted for the absolute leading position in the entire research area, with a share of 59.85%, which was significantly higher than other land use types, indicating that grassland plays a crucial role in maintaining the ecological environment of Jiuquan City, while the ESV contributed by forest land accounted for only 0.01%.
In 2020, the ESV of Jiuquan City districts and counties, in descending order, were Subei County, Akse County, Guazhou County, Yumen City, Dunhuang City, Jinta County, and Suzhou District, whose ESV was CNY 5,860,760.09 million, CNY 3,350,761.44 million, CNY 1,040,259.92 million, CNY 933,994.65 million, CNY 902,105.91 million, CNY 756,023.58 million, and CNY 469,557.25 million, respectively. The single ecosystem service functions of Jiuquan City districts and counties were dominated by hydrological regulation, climate regulation, and purification, with Akse and Jinta Counties accounting for the largest proportion of hydrological regulation, with 33.87% and 28.37%, respectively; Subei County and Yumen City accounting for the largest proportion of climate regulation, with 20.46% and 20.02%, respectively; and Dunhuang and Guazhou counties accounting for the largest proportion of purification, with 22.35% and 17.59%, respectively, as shown in Figure 6.
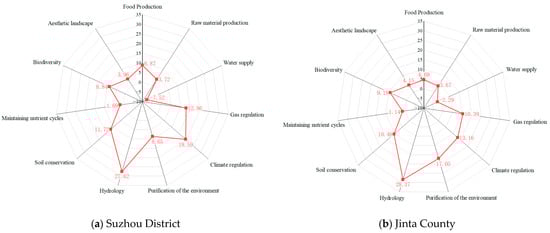
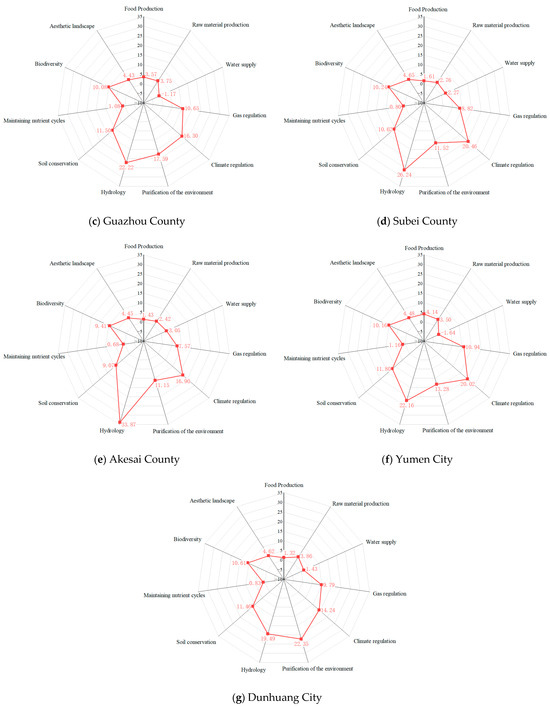
Figure 6.
Proportion of individual ecological service functions in each district and county of Jiuquan City (%): (a) proportion of individual ecological service functions in Suzhou District; (b) proportion of individual ecological service functions in Jinta County; (c) proportion of individual ecological service functions in Guazhou County; (d) proportion of individual ecological service functions in Subei County; (e) proportion of individual ecological service functions in Akesai County; (f) proportion of individual ecological service functions in Yumen City; (g) proportion of individual ecological service functions in Dunhuang City.
3.3.2. Value Transfer of Ecosystem Services in 2020
This research selected six service functions with the largest proportion in the research area: hydrological regulation, climate regulation, environmental purification, soil conservation, maintenance of biodiversity, and gas regulation. The geometric center points of each district and county in Jiuquan City were used as ecological impact centers, and the impact boundaries of six ecological functions of each district and county in Jiuquan City were obtained according to the breakpoint model.
Research on ecosystem service functions shows that due to significant differences in the generating body and function of different ecological service functions, their transfer characteristics also show diversity. By synthesizing the research results of scholars at home and abroad [27,28], the benefit transfer model designed by Barton for the study of the willingness to pay for improving coastal water quality in the Pacific coastal towns of Costa Rica, and the radiation range and characteristics of different ecological services in the study on the ecological service functions and radiation effects of the wetland ecosystems in the Taihu Lake area, downstream of the Wuzhong District in China by Chen, the general law of spatial transfer of ecosystem service functions can be obtained, as shown in Table 6. According to formula (5), the ecological service transfer intensity was obtained, and the ESV transfer volume was obtained using formula (6), as shown in Table 7.
Table 6.
Spatial transfer of ecosystem services.
Table 7.
Value transfer of ecosystem services in districts and counties of Jiuquan City in 2020 (unit: CNY 108).
The total 2020 ESV transfer for the study area, which is the sum of the seven inter-district transfers, is CNY 523.08 billion. Among the six service types in the research area, the ESV transfer volume of hydrological regulation was the largest, reaching CNY 994.08 billion, accounting for 19.00% of the total ESV transfer volume in the research area; soil conservation accounted for 13.57% of the total ESV transfer volume in the research area, with the smallest transfer volume. Guazhou County transferred the largest ESV outward, with a value of CNY 1226.57 billion; Subei County transferred CNY 1207.03 billion outward; Yumen City, Dunhuang City, Akesai County, and Jinta County transferred less ESV outward, with values of CNY 874.36 billion, CNY 684.20 billion, CNY 448.78 billion, and CNY 414.64 billion, respectively; and Suzhou District transferred the least ESV outward, with a value of CNY 37.516 billion.
4. Discussion
4.1. Analysis of Ecosystem Service Values in Jiuquan City and Its Seven Districts and Counties, China
The total ecosystem service value (ESV) of the study area from 2005 to 2020 initially increased and then decreased, but overall, it showed an upward trend. The total ESV rose from 50.3634 billion yuan to 54.2196 billion yuan, indicating that the ecological health of Jiuquan City is in good condition, which is consistent with previous research findings [29]. Xu’s study on ecological compensation in Gansu Province revealed that Jiuquan City ranks first in the net value of ecosystem services in the province. The ESV of Jiuquan City increased from 2005 to 2015 and then decreased from 2015 to 2020, reaching its peak in 2015 before declining. During 2005–2020, the secondary ESVs, particularly hydrological regulation and climate regulation, showed an increasing trend, which aligns with previous research outcomes. In Liang’s study on the spatiotemporal changes of ESV in Gansu Province from 2000 to 2020, the results for Jiuquan City in this study are in line with the overall development trend of Gansu Province [30]. The ecological service value of Jiuquan City mainly depends on grasslands and unused land, which, together, contribute nearly 82% of the region’s ecological service value and play a major role in key ecological services such as climate regulation, hydrological regulation, and soil conservation. The secondary ESVs, in descending order, are hydrological regulation, climate regulation, environmental purification, soil conservation, biodiversity, gas regulation, aesthetic landscape, raw material production, food production, water supply, and nutrient cycling. The regulatory services value has the largest proportion, with hydrological regulation being the most prominent, related to the abundance of mountains, rivers, and glaciers in Jiuquan City. This indicates that Jiuquan City’s ecosystem is primarily composed of natural ecosystems, which is in accordance with Mi’s study on ecological restoration zoning in Gansu Province, where Jiuquan City has a high vegetation coverage and is less disturbed by human activities [31].
Among the single ESVs of the seven districts and counties in Jiuquan City, all items except water supply showed an upward trend during the study period. The supply services, which include three types of secondary service functions, have a significant impact on the regional ecological environment, and the changes in each single ESV during the study period are closely related to the changes in grasslands, cultivated land, forest land, and water areas. The overall value of supply and regulatory services provided by the districts and counties of Jiuquan City tends to decrease, while the value of supporting and cultural services tends to increase. The high-value areas of ESV in Jiuquan City are mainly distributed in Suzhou District, southern Subei County, and Yumen City, while the low-value areas are concentrated in Dunhuang City, Guazhou County, northern Subei County, Jinta County, and the central part of Aksai County. The spatial distribution of ESV in Jiuquan City shows significant changes, with more than 30% of the regions in the seven districts and counties showing a clear downward trend in ESV from 2005 to 2020. From 2005 to 2015, the ecological condition of Jiuquan City was continuously improving, but from 2015 to 2020, there was a large area of negative growth in ESV in Jiuquan City.
4.2. Analysis of Ecosystem Service Value Transfers Among the Seven Districts and Counties of Jiuquan City, China
The total ESV transfer value in Jiuquan City reached 523.075 billion yuan. Within the study area, the ESV transferred outwards from each district, in descending order, is as follows: Guazhou County, Subei County, Yumen City, Dunhuang City, Akesai County, Jinta County, and Suzhou District. Notably, Guazhou County, as the primary exporter of ecosystem service value, transferred the largest amount of ecosystem service value to other regions, amounting to 122.657 billion yuan, which accounts for 23.45% of the total ESV transfer. Hydrological regulation within the study area is the service type with the largest transfer volume, constituting 19.00% of the total ESV transfer in the study area. The main factors influencing the transfer of ecosystem service value between regions include the quantity of ecosystem service value in each region and the distance between regions. Specifically, the transfer volume is positively correlated with the ecosystem service value of the region and negatively correlated with the distance between regions. In this study, Guazhou City, with its high ecosystem service value, also has a significant ESV transfer to surrounding areas. This is consistent with previous research findings, such as those of Chen, who studied the spatial flow of ecosystem services in Nanjing, China, and found that Jiangning District, with the highest ecosystem service value, also had the greatest ecological radiating power to surrounding areas [32]. Similarly, in Shen’s evaluation of ecosystem service value and spatial transfer in the Yangtze River Basin, it is pointed out that Sichuan Province, with the largest ecosystem service value, ranked first in the transfer of ecosystem services [33].
4.3. Exploration of ESV Estimation and Transfer Quantification Methods in Jiuquan City, China
In this study, the employed equivalence factor method significantly reduced the data requirements and simplified the calculation process compared to other methods. However, the determination of the equivalence factor table involves a certain degree of subjectivity, which may lead to an overestimation of the final calculated results. There are also several limitations within this research. First, the ESV assessment model established is not perfect. The structure and form of ecosystems are constantly changing due to environmental variations; hence, the services and values of ecosystems are a dynamically changing process. Furthermore, when calculating the transfer of ecological service values, due to the inherent uncertainties in the assessment of ecosystem service values, the applicability of the model requires further refinement and enhancement, especially in more complex scenarios.
5. Conclusions
Research indicates that from 2005 to 2020, the overall trend of ecosystem service value (ESV) in Jiuquan City, China, showed an upward trajectory, with the most significant increase observed in hydrological regulation among all individual ESV components. Notably, from 2015 to 2020, more than 30% of the areas across the seven districts and counties in Jiuquan City exhibited a clear decreasing trend in ESV spatial distribution, with high-value areas primarily located in Suzhou District, Subei County (south), and Yumen City, while low-value areas were concentrated in Dunhuang City, Guazhou County, Subei County (north), Jinta County, and the central part of Aksai County. The total ESV transfer across the seven districts and counties of Jiuquan City from 2005 to 2020 reached 523.075 billion yuan, with larger ESV districts transferring more ESV outwards. Hydrological regulation in the study area was the service type with the largest transfer volume, accounting for 19.00% of the total ESV transfer in the study area. Overall, the ESV of Jiuquan City in China is developing positively, but issues still persist. We should promote afforestation efforts, reduce the area of unused land, strengthen integrated water and fertilizer management, improve the utilization rate of water resources, and ensure that ecological security is effectively safeguarded.
Author Contributions
Conceptualization, Z.Y. and W.L.; methodology, W.L. and Z.Y.; software, W.Z.; validation, S.S.; formal analysis, S.S.; investigation, S.S.; resources, S.S.; data curation, S.S.; writing—original draft preparation, S.S.; writing—review and editing, S.S.; visualization, W.Z.; supervision, Z.Y.; project administration, W.L.; funding acquisition, W.L. All authors have read and agreed to the published version of the manuscript.
Funding
Special Soft Science Program of Gansu Provincial Science and Technology Program: 23JRZA450; Gansu Provincial University Teachers’ Innovation Fund: 2023B-081.
Informed Consent Statement
Not applicable.
Data Availability Statement
The original data presented in the study are openly available in [Zenodo] at [https://zenodo.org/records/12779975].
Conflicts of Interest
The authors declare no conflict of interest.
References
- Wei, L.; Liu, J.; Zheng, Z.; Ding, X.; Xie, D. Spatio-temporal change of land use and ecosystem service value in Shandong Province. J. Xi’an Univ. Technol. 2024, 1–15. [Google Scholar]
- Zhang, L.; Qu, W.; Li, X.; Du, H. Effect of Land Use and Land Cover Change on Ecosystem Service Value of Northeast Sandy Land in China. Sustainability 2025, 17, 167. [Google Scholar] [CrossRef]
- John Cairns, J. Protecting the Delivery of Ecosystem Services. Ecosyst. Health 1997, 3, 185–194. [Google Scholar] [CrossRef]
- Pan, D.; Yan, H.; Han, T.; Sun, B.; Jiang, J.; Liu, X.; Li, X.; Wang, H. Evaluation of the service function value of grassland ecosystems in Gansu Province using the equivalence factor method. Pratacultural Sci. 2021, 38, 1860–1868. [Google Scholar] [CrossRef]
- Liu, H.; Cao, X.; Zhang, C. Research Progress of Ecosystem Service Valuation. J. Green Sci. Technol. 2024, 26, 273–280. [Google Scholar] [CrossRef]
- Krutilla, J.V. Conservation Reconsidered. Am. Econ. Rev. 1967, 57, 777–786. [Google Scholar]
- Costanza, R.; de Groot, R.; Farber, S.; Grasso, M.; Hannon, B.; Limburg, K.; Naeem, S.; Paruelo, J.; Raskin, R.G.; Sutton, P.; et al. The Value of the World’s Ecosystem Services and Natural Capital. Ecol. Econ. 1997, 25, 3–15. [Google Scholar] [CrossRef]
- Bolund, P.; Hunhammar, S. Ecosystem services in urban areas. Ecol. Econ. 1999, 29, 293–301. [Google Scholar] [CrossRef]
- Kozak, J.; Lant, C.; Shaikh, S.; Wang, G. The geography of ecosystem service value: The case of the Des Plaines and Cache River wetlands, Illinois. Appl. Geogr. 2011, 31, 303–311. [Google Scholar] [CrossRef]
- Xie, G.; Xiao, Y.; Lu, C. Study on Ecosystemservices: Progress Limitation and Basic Paradigm. Chin. J. Plant Ecol. 2006, 30, 191–199. [Google Scholar]
- Xie, G.; Zhen, L.; Lu, C.; Xiao, Y.; Chen, C. Expert Knowledge Based Valuation Method of Ecosystem Services in China. J. Nat. Resour. 2008, 23, 911–919. [Google Scholar]
- Zhang, J.; Zhou, Y.; Yuan, Y.; Zhou, J. Comparative study of methods for accounting for the value of ecosystem services. Environ. Sustain. Dev. 2023, 48, 110–118. [Google Scholar] [CrossRef]
- Shao, W.; Chen, M.; Liu, H. Comparison of the Functional Value Approach and the Equivalent Factor Approach to Ecological Value Accounting. Agric. Technol. 2021, 41, 105–107. [Google Scholar] [CrossRef]
- Xie, G.; Zhang, C.; Zhang, L.; Chen, W.; Li, S. Improvement of the Evaluation Method for Ecosystem Service Value Based on Per UnitArea. J. Nat. Resour. 2015, 30, 1243–1254. [Google Scholar] [CrossRef]
- Jiuquan Local History Office. Jiuquan Yearbook; Dunhuang Literary Publishing House: Lanzhou, China, 2021. [Google Scholar]
- Gansu Province Bureau of Statistics. Gansu Statistical Yearbook; China Statistics Press: Beijing, China, 2021. [Google Scholar]
- National Bureau of Statistics. China Statistical Yearbook; China Statistics Press: Beijing, China, 2021. [Google Scholar]
- Yang, J.; Huang, X. 30 m annual land cover and its dynamics in China from 1990 to 2019. Earth Syst. Sci. Data Discuss. 2021, 2021, 3907–3925. [Google Scholar] [CrossRef]
- Zhao, H. Study on Ecosystem Service Value Accounting and Its Influencing Factors in Anhui Province. Master’s Thesis, Hefei University of Technology, Hefei, China, 2019. [Google Scholar]
- Shang, Y.; Wang, D.; Liu, S.; Li, H. Spatial-Temporal Variation and Mechanisms Causing Spatial Differentiation of Ecosystem Services in Ecologically Fragile Regions Based on Value Evaluation: A Case Study of Western Jilin, China. Land 2022, 11, 629. [Google Scholar] [CrossRef]
- Zheng, H.; Li, H. Spatial–temporal evolution characteristics of land use and habitat quality in Shandong Province, China. Sci. Rep. 2022, 12, 15422. [Google Scholar] [CrossRef]
- de Groot, R.S.; Wilson, M.A.; Boumans, R.M.J. A typology for the classification, description and valuation of ecosystem functions, goods and services. Ecol. Econ. 2002, 41, 393–408. [Google Scholar] [CrossRef]
- Fan, X.; Gao, J.; Wen, W. Exploratory Study on Eco-Assets Transferring and the Valuating Models. Res. Environ. Sci. 2007, 20, 160–164. [Google Scholar] [CrossRef]
- Qiao, X.N.; Yang, Y.J.; Yang, D.G. Assessment of Ecosystem Service Value Transfer in Weigan River Basin, Xinjiang, China. J. Desert Res. 2011, 31, 1008–1014. [Google Scholar]
- Tan, Y.; Jiang, Y.; Zhou, S. Spatio-temporal Evolution of Ecosystem Service Value in Tourist Cities: Taking Guilin City of Guangxi as an Example, in China. J. Guangxi Norm. Univ. (Nat. Sci. Ed.) 2024, 1–19. [Google Scholar] [CrossRef]
- Zhang, Y.; Mao, X.; Wei, X.; Zhang, Z.; Tang, W.; Zhou, H.; Ma, J.; Yin, X.; Tong, L. Wetland value and its radiation pattern of the Huangshui National Wetland Park. Acta Ecol. Sin. 2022, 42, 569–580. [Google Scholar] [CrossRef]
- Barton, D.N. The transferability of benefit transfer: Contingent valuation of water quality improvements in Costa Rica. Ecol. Econ. 2002, 42, 147–164. [Google Scholar] [CrossRef]
- Chen, L.; Mou, Z.; Qin, H.; Su, Q. Study on Ecological Service Function and Its Radiation Effect of Wetland Ecosystem. Environ. Sci. Technol. 2017, 40, 179–186. [Google Scholar]
- Qiyang, X.; Yongyu, W.; Yanyan, Y. Ecological Compensation Standard Calculation Model and Its Application. Stat. Decis. 2023, 39, 11–16. [Google Scholar] [CrossRef]
- Liang, Y. Temporal and Spatial Changes of Ecosystem Service Value in Agro-Pastoral Ecotone of Gansu Province. Master’s Thesis, Gansu Agricultural University, Lanzhou, China, 2023. [Google Scholar]
- Ying, M.; Yanjun, M. Ecological restoration zoning based on ecosystem conservation importance: A case study of Gansu Province. Resour. Environ. Eng. 2024, 38, 744–753. [Google Scholar] [CrossRef]
- Jianglong, C.; Mengyue, X.; Xi, S.; Jinlong, G. Spatial transfer of regional ecosystem service in Nanjing City. Acta Ecol. Sin. 2014, 34, 5087–5095. [Google Scholar] [CrossRef]
- Mengshu, S. Evaluation of Ecosystem Service Value and Spatial Transfer in the Yangtze River Basin. Master’s Thesis, Dongguan University of Technology, Dongguan, China, 2023. [Google Scholar]
Disclaimer/Publisher’s Note: The statements, opinions and data contained in all publications are solely those of the individual author(s) and contributor(s) and not of MDPI and/or the editor(s). MDPI and/or the editor(s) disclaim responsibility for any injury to people or property resulting from any ideas, methods, instructions or products referred to in the content. |
© 2025 by the authors. Licensee MDPI, Basel, Switzerland. This article is an open access article distributed under the terms and conditions of the Creative Commons Attribution (CC BY) license (https://creativecommons.org/licenses/by/4.0/).