Abstract
The construction of resilient cities is the key to guaranteeing the safe and stable development of cities in the face of shocks, and it is affected by various aspects such as ecological construction, economic development, and infrastructure construction conditions. Evaluating urban resilience is of great significance to the sustainable development of cities, as the current urban resilience evaluation system is still inadequate. This paper constructs an urban resilience evaluation system covering ecological, economic, social, infrastructure, and institutional dimensions. Based on the evaluation system, the spatial–temporal evolution characteristics and key influencing factors of urban resilience of 110 prefecture-level cities in the Yangtze River Economic Belt (YREB) were analyzed by methods such as the coefficient of variation, the Hurst exponent, and the obstacle diagnosis model. The results show that from 2002 to 2022, urban resilience in the YREB has significantly improved, and the mean has risen from 0.0429 to 0.1262. The spatial distribution of urban resilience demonstrates a pattern of higher in the east and lower in the west. The average Hurst exponent of urban resilience in the YREB reaches 0.8321, indicating strong sustainability. According to the result of the obstacle diagnosis model, factors in the dimension of economic, infrastructure, and social aspects exert the most significant influence on urban resilience.
1. Introduction
Urban resilience refers to the ability of cities to effectively respond to and quickly adapt to changes [], recover to their initial state [,], and maintain their critical functions when facing impacts from various natural and human-made crises []. Cities are complex social–ecological systems formed by human activities, and they are more susceptible to various emergencies such as natural disasters, extreme weather, and financial crises, which make them more vulnerable []. In the past decades, various crises have always jeopardized the healthy and stable development of cities [], for example, the Asian financial crisis in 1997, the southern China floods in 1998, the Wenchuan earthquake in 2008, as well as water pollution and land desertification, which pose long-term threats to ecological development. Improving urban resilience is not only a key to coping with the negative impacts of rapid urbanization but also an important guarantee for promoting sustainable development []. How to enhance urban resilience to cope with various disaster risks has gradually become the focus of scholars.
Building resilient cities is key to promoting urbanization and maintaining sustainability []. For the study of urban resilience, scholars have put forward different insights and constructed many frameworks based on the different emphases of “resilience” in the fields of disaster science, sociology, and urban planning []. Cutter et al. [] proposed the disaster resilience of place (DROP) model, which focuses on the ongoing impacts of sudden events like natural disasters on resilience. This model takes effectiveness and robustness as the main criteria and incorporates factors in terms of ecology, society, the economy, institutions, infrastructure, and community competence. Norris et al. [] constructed a theoretical framework for community resilience based on the dynamic properties of resources, considering the factors of economic, social, information, and community dimensions. Cutter et al. [] constructed the baseline resilience indicators for communities (BRIC) framework based on six dimensions, social, economic, community, institutional, housing and environmental, and explored the relationship between resilience and vulnerability. According to complex adaptive system theory, the United Nations Environment Programme [] constructed an evaluation framework which integrates three dimensions: resilience, adaptive capacity, and transformability (RATA). It focused on the dynamic change process of the system under disturbances. Scholars have analyzed resilience from different perspectives, laying a solid theoretical foundation for the evaluation and simulation of urban resilience.
In recent years, governments have increasingly emphasized the construction of resilient cities and introduced a series of policy measures []. However, the studies on systematic and quantitative evaluation of urban resilience are relatively limited. Current evaluations of urban resilience are often limited to an individual subsystem, such as the economy [,,], ecology [,,], and infrastructure [,,,]. Additionally, many scholars evaluated urban resilience under the influence of certain natural disasters from the perspective of disaster science, mainly involving floods [,,], heatwaves [,,,], earthquakes [,,], and typhoons [,,]. Meanwhile, there are fewer studies focusing on the sustainability of urban resilience and its influencing factors. Due to the complexity and multidimensional coupling characteristics of urban systems [,], it is insufficient to assess the resilience in a single dimension of the city. A multi-scale and comprehensive analysis of urban resilience is necessary. In this context, selecting a representative region as the case study is crucial.
As one of China’s most economically dynamic and ecologically important regions, the Yangtze River Economic Belt (YREB) is an important development engine that faces multiple challenges, such as rapid urbanization, environmental pressure, and socio-economic transformation []. Specifically, the YREB spans the eastern, central, and western regions of China, linking 11 coastal and inland provinces and municipalities. It has diverse landscapes and well-developed water transportation arteries. In addition, the YREB covers an area of over 2 million square kilometers and accounts for over 40% of the country’s population and GDP. Its unique location and complex urban systems make it an ideal and highly representative case for urban resilience research. Thus, this study takes the YREB as a typical case and systematically evaluates the spatial and temporal evolution characteristics of the urban resilience of 110 prefecture-level cities in the region from 2002 to 2022 from multiple dimensions. It aims to provide scientific references for regional sustainable development and policy formulation. We constructed an urban resilience evaluation system with five dimensions, ecology, the economy, society, infrastructure, and institutional, and analyzed the spatial and temporal evolution characteristics from different dimensions and different basins. Then, the Hurst exponent was used to reveal the development status and future trend of urban resilience. Additionally, the key factors affecting urban resilience were analyzed through the obstacle diagnosis model. Finally, based on the results, we provide suggestions for the future development of the YREB. Through comprehensive assessments, this study reveals the spatio-temporal evolution characteristics and key influencing factors of the YREB and promotes the deepening of theory and practice of urban resilience.
2. Materials and Methods
2.1. Overview of the Research Area
The YREB spans 11 provinces and municipalities across the upper reaches (Sichuan, Chongqing, Yunnan, and Guizhou), middle reaches (Jiangxi, Hubei, and Hunan), and lower reaches (Shanghai, Jiangsu, Zhejiang, and Anhui) of the Yangtze River, encompassing 110 prefecture-level cities (Figure 1). Relying on the “golden waterway” of the Yangtze River, the YREB connects major urban agglomerations such as the Yangtze River Delta, the Middle Reaches of the Yangtze River, and the Chengdu–Chongqing economic circle. It is the core corridor connecting the “ Belt and Road” and China’s “dual circulation” strategy. The YREB spans regions with subtropical monsoon climate and plateau mountainous climate. The middle and lower reaches are primarily composed of plains and hills with relatively flat terrain, which is vulnerable to meteorological hazards such as floods and droughts. The upper reaches is primarily composed of mountainous and plateau with steep terrain, which is prone to geological disasters such as earthquakes and mudslides. As the YREB is important to China’s economic and social development, evaluating and analyzing urban resilience in this region is significant.
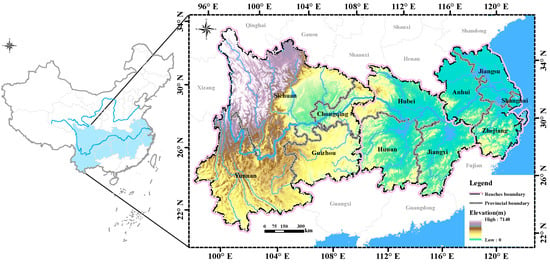
Figure 1.
Location of the Yangtze River Economic Belt (YREB) with topographical and reach information.
2.2. Data Source
The study takes 110 prefecture-level cities in the YREB as the research area, with cities as the research units. The data used in this paper are statistical data, mainly from the China Urban Statistical Yearbook (2003–2023), China’s Urban Construction Statistical Yearbook (2003–2023), statistical yearbooks of each province and city (2003–2023), and the Statistical Bulletins of National Economic and Social Development of each province and city (2003–2023). Data processing and analysis were performed by Python 3.8. Maps were generated by ArcGIS 10.2, and the background map is sourced from the National Geographic Information Public Service Platform https://www.tianditu.gov.cn/ (accessed on 20 January 2025). Statistical charts were created by Origin 2024.
2.3. Research Methods
This study selects indicators from five dimensions (ecological, economic, social, infrastructural, and institutional) to construct the urban resilience evaluation system. Indicators were standardized and weighted using the entropy method to calculate urban resilience scores as well as resilience scores for each sub-dimension. The spatio-temporal evolution characteristics, development trends, and obstacle factors of urban resilience are analyzed by using the coefficient of variation, the Hurst exponent, and the obstacle diagnostic model. The technical workflow of this study is illustrated in Figure 2.
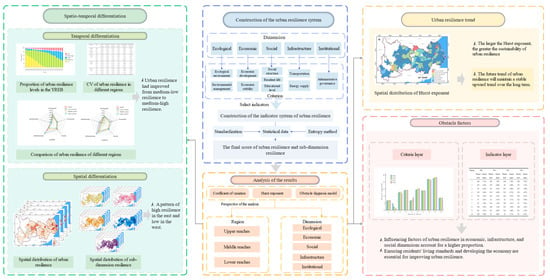
Figure 2.
Technical workflow.
2.3.1. Construction of the Urban Resilience Evaluation System
Urban resilience is a complex system coupled by numerous human and environmental factors, and it is widely regarded as an emergent property of complex socio-ecological-technical systems [,]. Currently widely used urban resilience theoretical frameworks, such as the disaster resilience of place (DROP) model and the baseline resilience indicators for communities (BRIC) framework, indicate that the interaction among ecological, social, economic, and infrastructure subsystems jointly determines the overall disturbance absorption and adaptation capacity of cities [,]. Therefore, based on previous analyses of the mechanisms of urban resilience and the availability of data in the study area, this study constructed an urban resilience indicator system by selecting indicators from five dimensions: ecology, the economy, society, infrastructure, and institutions. It enables a systematic and comprehensive evaluation of urban resilience in the YREB, as shown in Table 1.

Table 1.
Evaluation index system of urban resilience.
Ecological resilience serves as the foundation for urban regions to cope with natural disasters and environmental stress, which is of great significance for sustainable urban development [,]. It reflects the carrying capacity of the urban ecosystem and its ability to self-regulate after experiencing disturbances.
Economic resilience provides the basic material security for the safe and stable development of an urban economy [,]. It reflects the capacity of the urban economic system to reduce losses and achieve industrial transformation and upgrading when facing economic pressures.
Social resilience reflects social stability and the living standard of the population. Enhancing social resilience helps to reduce the impact of sudden crises on the social structure and public service system, thereby maintaining stable social development [].
Infrastructure resilience is directly related to the safety and efficiency of urban operations, and it is the key to ensuring the basic life of residents and the prosperity of the economy []. It reflects the ability of infrastructure such as transportation, water supply, and power supply to guarantee sustained operation and rapid recovery in the event of disasters or emergencies.
Institutional resilience reflects the ability of the urban governance system to respond quickly and manage effectively in the face of sudden events [].
2.3.2. Data Standardization
The selected indicators have large differences in scale and range, so it is necessary to standardize the data of each indicator to ensure their consistency. The data are standardized through the following formula:
Positive indicator:
Negative indicator:
Moderate indicator:
where is the standardized value, is the original value, is the maximum value; is the minimum value, and is the mean.
2.3.3. Entropy Method
The entropy method is an objective weight method based on the information entropy theory. Its principle is to determine the weights according to the discrete degree of each indicator. The calculation steps are as follows []:
Firstly, calculate the entropy value using
where is the proportion of the indicator value and is the entropy value.
Secondly, calculate the weight using
where is the weight.
Finally, calculate urban resilience using
where is urban resilience.
2.3.4. Coefficient of Variation
The coefficient of variation (the magnitude of the data) fluctuates along the mean. The larger the coefficient of variation, the greater the difference among the data []. Its calculation formula is as follows:
where is the coefficient of variation and is the mean.
2.3.5. Hurst Exponent
The Hurst exponent is used to determine whether the current trend is sustainable by quantifying the long-term memory of the time series. Its calculation is primarily based on the rescaled range (R/S) analysis method, which involves the following steps []:
Divide the time series of urban resilience with a length of into equal-length subsequences, each of length . In this study, the time span ranges from 2002 to 2022, so the length of the time series is 21. , . For the subsequence, calculate its mean using
Calculate the cumulative deviation using
where is the cumulative deviation.
Calculate the range and standard deviation of each subsequence as follows:
where is the range of in the subsequence and is the standard deviation of in the subsequence.
Calculate the mean of rescaled range for all subsequences as follows:
Taking the logarithm of Equation (13) results in the following linear relationship:
Using the least-squares method, the coefficient of obtained from the regression is the Hurst exponent. The value of ranged from . When , it indicates that the change in urban resilience is random, and its long-term trend is not affected by historical values. When , it indicates that the trend of urban resilience shows negative sustainability, meaning that the future trend is in the opposite direction of the current trend. When , it indicates a positive sustainability trend in urban resilience, where the future trend is consistent with the current trend.
2.3.6. Obstacle Diagnosis Model
The evaluation and analysis of urban resilience is of great important to the sustainable development of cities. This paper analyzes the obstacle degree of each indicator on urban resilience and identifies the key factors affecting urban resilience through the obstacle diagnostic model. Based on this analysis, targeted risk management strategies are proposed to enhance urban resilience []. The calculation method for the obstacle degree is as follows:
Calculate the deviation using
where is the deviation and is the standardized value.
Calculate the obstacle degree using
where is the obstacle degree and is the weight.
3. Results
3.1. Spatio-Temporal Evolution of Urban Resilience in the YREB
3.1.1. Temporal Evolution of Urban Resilience
In this study, the percentage of the average value of urban resilience in the YREB is used as the classification standard of spatial mapping. The urban resilience is classified into five levels []: low resilience (below 50% of the average), medium-low resilience (50~100% of the average), medium resilience (100~150% of the average), medium-high resilience (100~150% of the average), and high resilience (above 200% of the average), with the breakpoints of 0.0427, 0.0855, 0.1282, and 0.1709, respectively. The classification criteria for the resilience level of each sub-dimension are the same as those for urban resilience. As shown in Table 2, the mean value for urban resilience in the YREB increased from 0.0429 (medium-low resilience) in 2002 to 0.1262 (medium-high resilience) in 2022. It indicates an overall upward trend in urban resilience in the YREB, with cities gradually transitioning from low to high resilience levels. During the study period, Shanghai consistently ranked first in urban resilience as well as across each sub-dimension. Provincial capital cities also maintained leading positions. The rankings of urban resilience fluctuated over time. Cities such as Anshun, Fuyang, Ganzhou, Liupanshui, Suzhou, and Yichun experienced significant improvements in the ranking of urban resilience during the study period, while the rankings of Ezhou, Huaibei, Huainan, Jingdezhen, Lijiang, Lishui, and Suizhou decreased.

Table 2.
The ranking of urban resilience for 2002, 2010, 2015, and 2022 in the YREB.
From Figure 3, it is evident that the resilience levels of cities in the YREB are gradually shifting from low to high. From 2002 to 2013, the urban resilience of most cities was at the low and medium-low levels, with low-resilience cities shifting towards the medium-low-resilience cities. Meanwhile, cities in the medium and medium-high resilience levels showed relatively slow development. After 2014, cities with medium-low and medium resilience levels became the majority, and the cities at medium resilience experience a faster rate of development. The number of cities at the medium resilience level gradually increased. After 2020, more than 50% of the cities in the YREB have achieved medium or higher resilience levels, indicating promising urban development prospects.
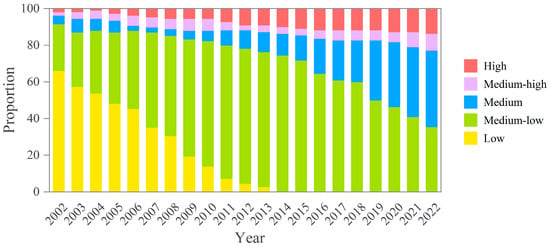
Figure 3.
Proportion of urban resilience at different levels in the YREB from 2002 to 2022.
Figure 4 compares the urban resilience of different dimensions across different regions of the YREB in 2002 and 2022. The result shows that the development of the lower reaches is significantly higher than the average in the YREB, while the upper and middle reaches lag behind. At the beginning of the study period, there were notable differences in resilience across regions and dimensions, particularly in the infrastructure dimension, whereas institutional resilience was generally low with minimal regional variation. However, by 2022, with the social development and the promotion of policies such as civilized city construction, the differences in institutional and economic resilience across regions increased, while the differences in ecological resilience decreased. The upper reaches slightly surpassed the middle reaches in terms of resilience in infrastructure and economic dimensions.
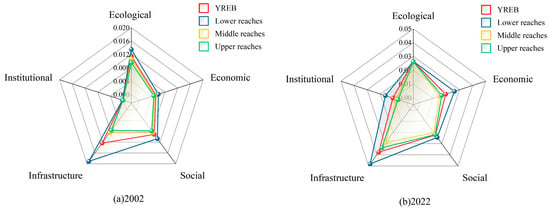
Figure 4.
Resilience comparison between different regions in different dimensions in the YREB in 2002 and 2022.
The change in the coefficient of variation (CV) of urban resilience in the YREB shows that the urban resilience difference in the region increased and then gradually decreased, with 2010 as the cut-off point (Table 3). The CV shows that the difference in urban resilience in the lower reaches has gradually narrowed, while the imbalance in the development of urban resilience in the upper and middle reaches has intensified. From the perspective of resilience in each dimension, the regional difference in ecological resilience is the smallest and has decreased over time, and the ecological priority strategy of the YREB has achieved certain results. Regional differences in institutional resilience are most pronounced. The lower reaches have seen a gradual narrowing of the gap between cities due to policy measures promoting the integration of the YRD, while regional differences in the upper and middle reaches showed a downward trend followed by an upward trend. In terms of economic resilience, the regional difference has expanded, with the most significant increase in the upper reaches, and it may be affected by growth poles such as Shanghai and Chengdu. In terms of social resilience, the regional difference shows an upward and then a downward trend. In terms of infrastructure resilience, the regional difference shows a downward trend in the middle and lower reaches and an upward trend in the upper reaches.

Table 3.
CV of urban resilience in different regions.
3.1.2. Spatial Evolution of Urban Resilience
The spatial distribution of urban resilience in the YREB shows an overall pattern of higher in the east and lower in the west (Figure 5). In 2002, cities with higher urban resilience were mainly distributed in the core region of the Yangtze River Delta in the lower reaches, with the urban resilience of Shanghai, Nanjing, and Hangzhou in the lead. In the upper and middle reaches, apart from provincial capitals and few of its surrounding cities with relatively high resilience, most cities were at a low resilience level. In 2010, urban resilience in the middle reaches had improved, while some edge cities in the upper reaches still exhibited low resilience. In 2015, the core cities in the lower reaches such as Shanghai, Nanjing, Suzhou, Hangzhou, and Hefei, as well as the provincial capitals in the upper and middle reaches such as Wuhan, Changsha, Chongqing, Chengdu, and Kunming, had developed to higher levels of urban resilience. Most of the remaining cities had reached medium-low resilience. In 2022, urban resilience of the cities in the YREB had further improved. The urban resilience of the core cities remained high. The resilience of the surrounding cities of the core cities had developed from medium-low resilience to medium-high resilience. However, the urban resilience of a small number of edge cities still showed slower development and remained at the medium-low level.
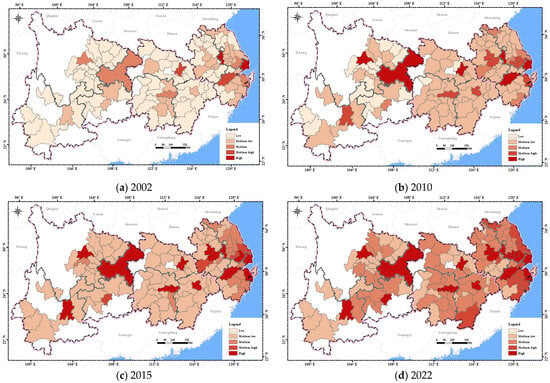
Figure 5.
The spatial distribution of urban resilience in the YREB from 2002 to 2022.
Overall, the spatial evolution conforms to the polarization and diffusion effects. From 2002 to 2010, urban resilience was in the polarization stage, and the areas with higher urban resilience were mainly dominated by cities such as Shanghai, Nanjing, Hangzhou, Chongqing, and Kunming, which comprised the provincial capitals and the developed cities in the lower reaches. From 2010 to 2022, urban resilience entered the diffusion stage. Due to the factors such as population mobility and industrial transformation, resources gradually flowed from the developed cities with higher resilience to the neighboring cities with lower resilience, which facilitated the development of surrounding areas and narrowed the difference in urban resilience among cities.
In the dimension of ecological resilience (Figure 6), the spatial difference in ecological resilience in the YREB has gradually narrowed over time. In 2002, the overall ecological resilience of the YREB was at a low to medium level. The upper reaches had significantly lower ecological resilience due to issues such as soil erosion and ecological degradation. The middle and lower reaches had relatively higher ecological resilience, but due to dense populations and industrial development, they also face environmental pressures such as water pollution and wetland shrinkage. From 2010 to 2015, overall ecological resilience improved significantly due to the Yangtze River Shelterbelt Project and the strategy of prioritizing ecology. From 2015 to 2022, the improvement of ecological resilience slowed down. Chongqing’s ecological resilience is significantly higher than that of other cities. Shanghai, Nanjing, Hangzhou, Wuhan, and Chengdu demonstrated relatively high ecological resilience. The remaining cities formed a contiguous zone with medium ecological resilience.
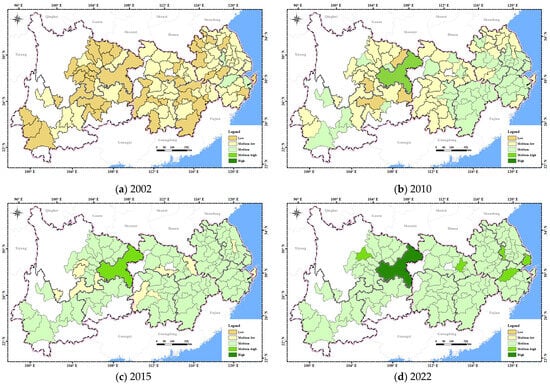
Figure 6.
The spatial distribution of ecological resilience in the YREB from 2002 to 2022.
In the dimension of economic resilience (Figure 7), in 2002, the YREB generally exhibited low economic resilience. The economic resilience of Shanghai was significantly higher than that of other cities, while the middle and upper reaches lagged behind. In 2010, the economic resilience of cities in the middle reaches had generally improved from low economic resilience to medium-low economic resilience. The economic resilience of cities in the lower reaches and provincial capitals in the upper reaches further improved. In 2015, the economic resilience in the lower reaches continued to increase, with most cities developing to medium-high economic resilience. Cities in the middle reaches had all reached medium and higher economic resilience. Economic resilience in the upper reaches remained at low resilience. In 2022, the majority of cities in the YREB had achieved medium or higher economic resilience. Overall, in the lower reaches, the developed economy is inextricably linked to its advantageous geographical location and developed industrial structure. The middle reaches are dominated by traditional manufacturing and agriculture, with a moderate level of economic resilience. The economic foundation of the upper reaches is relatively weak, with a low level of industrial development and insufficient momentum for growth.
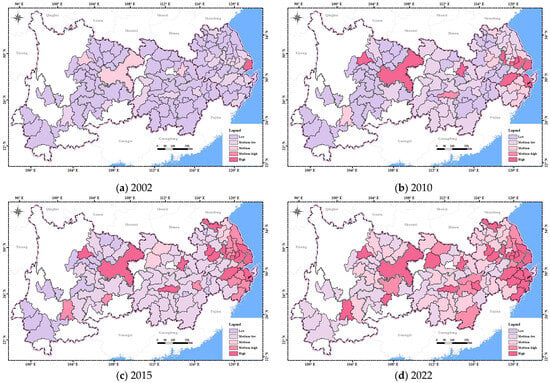
Figure 7.
The spatial distribution of economic resilience in the YREB from 2002 to 2022.
In the dimension of social resilience (Figure 8), the spatial distribution of social resilience in the YREB has remained relatively stable. In 2002, cities with higher social resilience were mainly provincial capitals, while the overall social resilience in the YREB was generally low. In 2010, some cities in the middle and lower reaches had improvements in social resilience. In 2015, the social resilience of cities such as Bijie, Leshan, Yiyang, and Yichun had risen from low to medium-low. In 2022, most cities in the lower reaches had developed to medium-high social resilience. Cities with medium social resilience were mainly located in the middle reaches. Overall, the lower reaches have well-developed public service systems and strong population attraction. The middle reaches lag behind in social development, with significant urban–rural disparities. The upper reaches, especially peripheral cities, suffer from insufficient social resource allocation and weak basic public services.
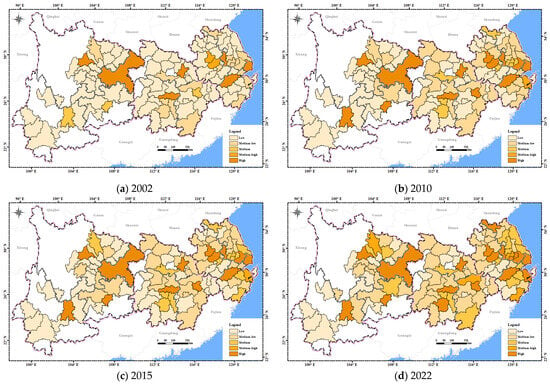
Figure 8.
The spatial distribution of social resilience in the YREB from 2002 to 2022.
In the dimension of infrastructure resilience (Figure 9), in 2002, the infrastructure resilience of Shanghai, Nanjing, Ningbo, and Chongqing had already reached high infrastructure resilience. Cities with relatively high infrastructure resilience were mainly distributed in provincial capitals and the lower reaches, while most remaining cities had low infrastructure resilience, exhibiting a significant spatial difference. In 2010, some cities in the middle and lower reaches had improved from low to medium-low infrastructure resilience. However, the upper reaches generally remained at low infrastructure resilience except for the provincial capitals. In 2015, cities with medium infrastructure resilience further increased in the middle and lower reaches, while the development of infrastructure resilience in the upper reaches was still relatively slow. In 2022, the infrastructure resilience of the YREB had improved significantly. Most cities in the lower reaches had reached high infrastructure resilience. Overall, the lower reaches have well-developed transportation networks with a high density of expressways, ports, and airports. Infrastructure resilience in the middle reaches is gradually improving, but it still lags behind the lower reaches. The upper reaches have complex terrain, making infrastructure construction difficult, with insufficient accessibility and modernization.
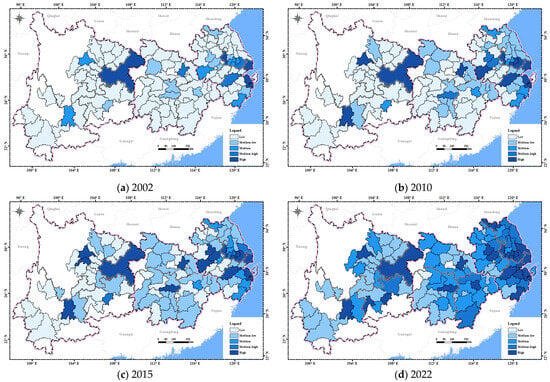
Figure 9.
The spatial distribution of infrastructure resilience in the YREB from 2002 to 2022.
In the dimension of institutional resilience (Figure 10), in 2002, the overall institutional resilience of the YREB was low, except for Shanghai, which had reached high institutional resilience. In 2010, the institutional resilience of Shanghai, Suzhou, Hangzhou, Ningbo, and Chongqing was at the high level, and some cities in the lower reaches reached medium institutional resilience. The remaining cities in the YREB generally shifted from low to medium-low institutional resilience. In 2015, most cities in the lower reaches had reached medium-high institutional resilience. In 2022, cities with medium-high and high institutional resilience gradually diffused from the lower reaches to the upper and middle reaches. A few cities in the upper reaches still maintained medium-low institutional resilience.
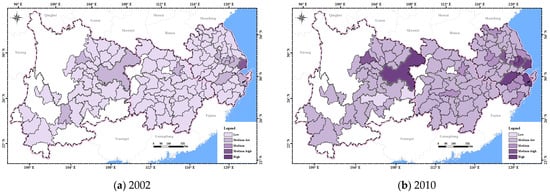
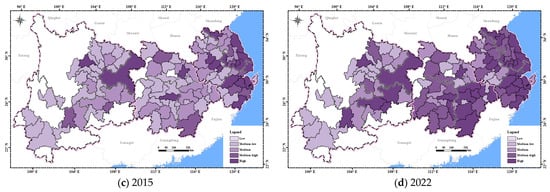
Figure 10.
The spatial distribution of institutional resilience in the YREB from 2002 to 2022.
Overall, among the various dimensions of urban resilience, ecological resilience shows the least spatial differences. The spatial distribution of social resilience is relatively even. Economic, infrastructure, and institutional resilience show significant spatial differences over time, characterized by a clear pattern of high in the east and low in the west.
3.2. The Trend of Urban Resilience
This paper uses the Hurst exponent to analyze the evolutionary trend of urban resilience. When the Hurst exponent is less than 0.5, the trend of urban resilience indicates reverse sustainability, and when the Hurst exponent is greater than 0.5, the trend of urban resilience indicates positive sustainability. The larger the Hurst exponent, the stronger the sustainability of urban resilience. In this paper, the reverse and positive sustainability of urban resilience are divided into five levels from weak to strong, while the result of the Hurst exponent shows that reverse sustainability of urban resilience in the YREB only has two levels: weak and absolutely weak. Figure 11 illustrates the spatial distribution of the Hurst exponent of urban resilience in the YREB, which reveals the sustainability of the evolutionary trend of urban resilience. Only the urban resilience development trend of Ezhou, Kunming, Shiyan, Wuhu, and Huai’an showed very weak reverse sustainability. For the rest of the cities, the Hurst exponent is greater than 0.5, indicating positive sustainability. Yichang and Loudi show absolutely weak sustainability. Most cities in the middle reaches demonstrate moderate and stronger sustainability. More than half of the cities in the lower reaches, as well as most cities in Sichuan, Yunnan, and Guizhou in the upper reaches, show absolutely strong sustainability of urban resilience. The mean of the Hurst exponent of 110 cities in the YREB is 0.8321, and the future trend of urban resilience of most cities is consistent with the current trend and will maintain a stable upward trend over the long term.
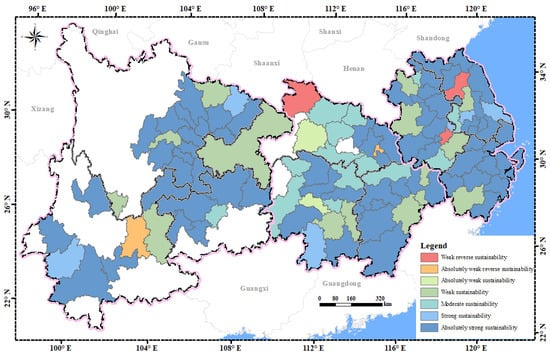
Figure 11.
The distribution of the Hurst exponent. (Red and orange indicate reverse sustainability, while other colors indicate positive sustainability. The darker the color, the stronger the reverse/positive sustainability.)
3.3. Analysis of Obstacle Factors
3.3.1. Obstacle Factors at the Criterion Layer
In this paper, the obstacle diagnosis model is used to evaluate the obstacle degree of each factor affecting urban resilience in the YREB. Figure 12 shows the obstacle degrees of factors at the criterion layer from 2002 to 2022. As illustrated in the figure, energy supply (C9) and transportation (C8) were the biggest obstacles to urban resilience, while environmental governance (C2) was the smallest obstacle to urban resilience and had significantly decreased during the study period. Additionally, the obstacle degree of ecological environment (C1), economic stability (C4), social structure (C5), resident life (C6), and energy supply (C9) had increased over the study period, and the obstacle degree of economic development (C3), education level (C7), and transportation (C8) had remained relatively stable. From 2002 to 2022, resident life (C6) and energy supply (C9) had shown continuous growth in the obstacle degree, with relatively high rates of increase. Therefore, ensuring energy supply, enhancing infrastructure investment, and improving living standards of residents are increasingly becoming critical strategies for boosting urban resilience in the YREB. Moreover, strengthening economic control and administrative governance can further contribute to resilience improvement. Although the obstacle degree of the social structure (C5) is relatively low, it had increased significantly from 2015 to 2022, with an increase of 33.27%. This upward trend may continue in the future, so it also needs to be emphasized.
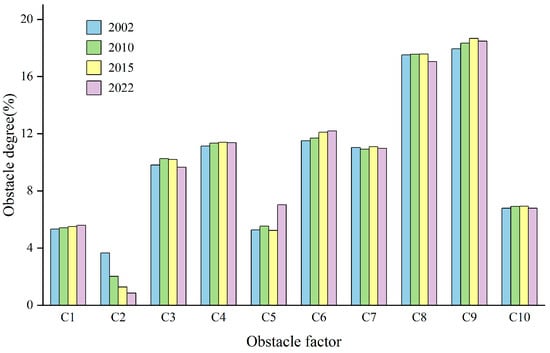
Figure 12.
Obstacle degree at the criterion layer from 2002 to 2022.
3.3.2. Obstacle Factors at the Indicator Layer
Table 4 ranks the obstacle degree of factors at the indicator layer, listing only the top 10 factors due to the large number of indicators. From 2002 to 2022, factors such as local expenditure for science and technology (X30), per capita GDP (X9), the number of buses under operation (X25), and the number of persons joining basic medical care insurance (X19) were the most significant factors influencing the development of urban resilience in the YREB. The obstacle degree of per capita GDP (X9) increased by 12.7% during the study period. Economic development is becoming increasingly important. Meanwhile, the obstacle degree of the sewage treatment rate (X7) decreased significantly from 5.81% to 1.75%, which demonstrated notable progress in sewage treatment. From 2015 to 2022, the obstacle degree of the natural population growth rate (X16) rose sharply by 29.8%, which means that demographic changes and a declining fertility rate have become important challenges for urban development in recent years. Additionally, the obstacle degrees of built-up areas (X2), total water resources (X5), the number of persons joining basic medical care insurance (X19), and the number of buses under operation (X25) had shown an increasing trend over time. Improving environmental construction, as well as ensuring the well-being of residents, is also an important way to enhance the resilience of the YREB. The number of regular higher education institutions (X21) and the number of undergraduates in regular HEIs (X22) had consistently ranked at a relatively high position, underscoring the importance of education. Overall, factors across ecological, economic, social, infrastructure, and institutional dimensions jointly influence urban resilience, with factors in social resilience playing the prominent roles. In future construction of cities in the YREB, enhancing investments in technological innovation and education, improving public transportation and social security systems, and advancing critical infrastructure construction are effective strategies for strengthening urban resilience and ensuring sustainable development.

Table 4.
Ranking of main obstacle factors at the indicator layer.
4. Discussion
4.1. Spatial and Temporal Differentiation of Urban Resilience in the YREB
This study evaluates and analyzes the urban resilience of 110 prefecture-level cities in the YREB, both overall and across various dimensions. The overall urban resilience of the YREB had continuously improved from 2002 to 2022, gradually increasing from medium-low resilience to the medium-high resilience. The result indicates that the ability of the YREB to cope with risks is gradually strengthening. However, significant disparities exist in urban resilience across different regions. The lower reaches, benefiting from its robust economic foundation and regional development strategies [], exhibit significantly higher urban resilience compared to upper and middle reaches, and the development gap among cities in this region is gradually narrowing. The imbalance of urban resilience in the middle reaches has increased, and cities such as Wuhan, Changsha, and Nanchang have developed rapidly, while cities such as Huanggang and Xiaogan remain at lower resilience, possibly due to the siphoning effect of Wuhan []. The overall urban resilience in the upper reaches is relatively low, with significant disparities among cities. In the upper reaches, areas with higher resilience are concentrated in the Chengdu–Chongqing urban agglomeration, while development in Yunnan and Guizhou is lagging behind due to their geographical environment and weak development foundation. This difference leads to an increasing imbalance in urban resilience in the upper reaches over time. This conclusion is consistent with the findings of Ye et al.’s research [], which confirms the core city agglomeration effect and regional development differences in the YREB.
Compared with the findings of studies on other urban agglomerations in China, such as the Beijing–Tianjin–Hebei region and the Pearl River Delta [,], this study emphasizes the more pronounced spatial heterogeneity and polarization characteristics of the YREB in terms of the economy, infrastructure, and society. In contrast, the YREB covers a larger area with diverse topography, economies, and policy types, resulting in significant differences between the upper, middle, and lower reaches, as well as huge resilience gaps between core and peripheral cities. This spatial pattern highlights the necessity for differentiated policy interventions in the YREB, which is often overlooked in studies of homogeneous urban agglomerations. Therefore, this study further enriches the theoretical system of cross-regional resilience governance in China’s complex river basin urban agglomerations.
4.2. Suggestions for Improving Urban Resilience in the YREB
According to the identification of obstacle factors in the YREB, factors in the economic, infrastructure, and social dimensions are gradually becoming key influences on urban resilience. Most of the social dimension indicators have a relatively high obstacle degree, with indicators such as the number of persons joining basic medical care insurance, the number of undergraduates in regular HEIs, and the natural growth rate of population ranking at the top. Therefore, the government should strengthen its investment in education and improve the social security system to further enhance the living standards of residents. Additionally, the obstacle ranking of local expenditure for science and technology, the number of buses under operation, and per capita GDP are significantly higher than other indicators and have been increasing annually, reaching over 7% in 2022. In future construction of cities, emphasis should be placed on investments in scientific and technological innovation and the development of emerging technologies. Cities should strengthen communication and cooperation to improve infrastructure construction, thereby promoting the flow of resources such as populations, goods, and industries, thus promoting coordinated regional development. In addition, the obstacle degree of the domestic sewage treatment rate has declined significantly since 2010, possibly due to the ecological priority development strategy of the YREB, which has achieved certain results in ecological governance. However, water scarcity still threatens ecological development. For river sections involving ecologically sensitive areas, ecological water levels should be strictly controlled to ensure the ecological water volume of rivers and lakes and enhance water circulation.
According to the analysis of temporal and spatial evolution, the spatial evolution of urban resilience in the YREB shows a clear polarization–diffusion effect, with a huge resilience gap between core cities and peripheral cities. High-resilience cities such as Shanghai, Wuhan, and Chongqing should play a radiating role to drive the development of surrounding cities through industrial transfer, technological overflow, and co-built parks. Low-resilience cities should seize the resources brought by nearby high-resilience cities, combining regional advantages to improve their weak aspects of resilience.
There are obvious differences in urban resilience among different reaches, so governments in different regions should propose targeted policy measures based on regional characteristics. The upper reaches should focus on economic and infrastructure shortcomings, accelerate the modernization of basic public services, and strengthen coordination and resource sharing with the Chengdu–Chongqing urban agglomeration so as to improve overall resilience. The middle reaches should improve cooperation between cities and establish incentive mechanisms for the cross-regional flow of resources to help weak cities such as Huanggang and Xiaogan share the spillover effects brought by growth poles such as Wuhan. The lower reaches should improve resilience through continuous innovation-driven development and institutional advantages, further enhance their capacity for investment in science and technology, and strengthen the integrated construction of infrastructure such as transportation.
4.3. Limitations
Due to the limitation of data, the indicators of some dimensions may not be comprehensive, and it is necessary to further optimize the indicator system of urban resilience in future research. Additionally, we will use the latest data in future studies and focus on the impact of the COVID-19 pandemic and the recovery of resilience after the COVID-19 pandemic. In this paper, the influencing factors of urban resilience are analyzed, but the excavation of the intrinsic driving mechanism of urban resilience is still insufficient. Due to the large number of obstacle factors, the presentation of the result on obstacle degrees in this paper may have certain limitations. In subsequent studies, the assessment of complex interactions between different dimensions can be added, and we will focus on the differentiation of obstacle degrees in different spatial types to enhance the depth of spatial insight. Moreover, the assessment of disturbance responses and long-term adaptability can be added to explore the enhancement path of urban resilience in depth.
5. Conclusions
This paper constructs an urban resilience indicator system based on five dimensions, ecological, economic, social, infrastructure, and institutional, and analyzes the spatio-temporal evolution characteristics and key influencing factors of urban resilience in the YREB from 2002 to 2022 by means of the coefficient of variation, the Hurst exponent, and the obstacle diagnosis model. The following conclusions are drawn.
Urban resilience in the YREB had significantly improved during the study period, rising from 0.0429 (medium-low resilience) to 0.1262 (medium-high resilience). The average Hurst index of the YREB region reaches 0.8321, which indicates that urban resilience will maintain an upward trend steadily over the long term in the future. The spatial differences in urban resilience are significant. Urban resilience in the lower reaches is significantly higher than that in the upper and middle reaches. The disparities in urban resilience among cities in the lower reaches had gradually narrowed, while the disparities among cities in the upper and middle reaches had increased. The upper reaches showed an obvious imbalance in urban development.
From the perspective of dimensions, the spatial differences in ecological resilience were small. High-resilience areas in social resilience were mainly distributed in provincial capitals and developed cities in the lower reaches of the Yangtze River. Economic, infrastructure, and institutional resilience exhibited significant spatial heterogeneity, all following a spatial pattern of high in the east and low in the west. Among the key influencing factors of urban resilience, those in economic, infrastructure, and social dimensions account for a higher proportion. Local expenditure for science and technology, per capita GDP, and the number of buses under operation are the most critical factors, whose shares were increasing year by year and reached more than 7% in 2022. Ensuring residents’ living standards and developing the economy are essential for improving urban resilience. In future construction of resilient urban, greater emphasis should be placed on interregional cooperation to promote coordinated regional development, which will enhance urban resilience and improve the balance of regional development in the YREB.
Author Contributions
Conceptualization, J.L. and F.Y.; methodology, J.L. and F.Y.; software, F.Y.; validation, M.C., F.Y. and J.L.; formal analysis, F.Y.; investigation, M.C.; resources, J.L.; data curation, J.L. and F.Y.; writing—original draft preparation, F.Y.; writing—review and editing, M.C., J.L. and F.Y.; visualization, J.L. and F.Y.; supervision, J.L. and Y.W.; project administration, J.L. and M.C.; funding acquisition, M.C. and J.L. All authors have read and agreed to the published version of the manuscript.
Funding
This research was funded by the National Natural Science Foundation of China (Grant numbers 62201295 and 42001239) and the Postgraduate Research and Practice Innovation Program of Jiangsu Province, grant number SJCX24_2011.
Data Availability Statement
The original contributions presented in this study are included in the article. Further inquiries can be directed to the corresponding author(s).
Acknowledgments
The authors would like to thank the editor and the anonymous reviewers for their helpful suggestions and comments.
Conflicts of Interest
The authors declare no conflicts of interest.
References
- Ahern, J. From fail-safe to safe-to-fail: Sustainability and resilience in the new urban world. Landsc. Urban Plan. 2011, 100, 341–343. [Google Scholar] [CrossRef]
- Walker, B.; Holling, C.S.; Carpenter, S.R.; Kinzig, A. Resilience, adaptability and transformability in social–ecological systems. Ecol. Soc. 2004, 9, 5. [Google Scholar] [CrossRef]
- Folke, C.; Biggs, R.; Norström, A.V.; Reyers, B.; Rockström, J. Social-ecological resilience and biosphere-based sustainability science. Ecol. Soc. 2016, 21, 41. [Google Scholar] [CrossRef]
- Meerow, S.; Newell, J.P. Resilience and complexity: A bibliometric review and prospects for industrial ecology. J. Ind. Ecol. 2015, 19, 236–251. [Google Scholar] [CrossRef]
- Shi, Y.; Zhai, G.; Xu, L.; Zhou, S.; Lu, Y.; Liu, H.; Huang, W. Assessment methods of urban system resilience: From the perspective of complex adaptive system theory. Cities 2021, 112, 103141. [Google Scholar] [CrossRef]
- Chen, J.; Guo, X.; Pan, H.; Zhong, S. What determines city’s resilience against epidemic outbreak: Evidence from China’s COVID-19 experience. Sustain. Cities Soc. 2021, 70, 102892. [Google Scholar] [CrossRef] [PubMed]
- Ribeiro, P.J.G.; Gonçalves, L.A.P.J. Urban resilience: A conceptual framework. Sustain. Cities Soc. 2019, 50, 101625. [Google Scholar] [CrossRef]
- Rose, A. Defining and measuring economic resilience to disasters. Disaster Prev. Manag. Int. J. 2004, 13, 307–314. [Google Scholar] [CrossRef]
- Büyüközkan, G.; Ilıcak, Ö.; Feyzioğlu, O. A review of urban resilience literature. Sustain. Cities Soc. 2022, 77, 103579. [Google Scholar] [CrossRef]
- Cutter, S.L.; Barnes, L.; Berry, M.; Burton, C.; Evans, E.; Tate, E.; Webb, J. A place-based model for understanding community resilience to natural disasters. Glob. Environ. Chang. 2008, 18, 598–606. [Google Scholar] [CrossRef]
- Norris, F.H.; Stevens, S.P.; Pfefferbaum, B.; Wyche, K.F.; Pfefferbaum, R.L. Community resilience as a metaphor, theory, set of capacities, and strategy for disaster readiness. Am. J. Community Psychol. 2008, 41, 127–150. [Google Scholar] [CrossRef]
- Cutter, S.L.; Ash, K.D.; Emrich, C.T. The geographies of community disaster resilience. Glob. Environ. Chang. 2014, 29, 65–77. [Google Scholar] [CrossRef]
- O’Connell, D.; Walker, B.; Abel, N.; Grigg, N. The Resilience, Adaptation and Transformation Assessment Framework: From Theory to Application; CSIRO: Camberra, Australia, 2015. [Google Scholar]
- Wu, Q.; Han, J.; Lei, C.; Ding, W.; Li, B.; Zhang, L. The challenges and countermeasures in emergency management after the establishment of the ministry of emergency management of China: A case study. Int. J. Disaster Risk Reduct. 2021, 55, 102075. [Google Scholar] [CrossRef]
- Lu, R.; Yang, Z. Analysis on the structure and economic resilience capacity of China’s regional economic network. Appl. Econ. 2024, 56, 3920–3938. [Google Scholar] [CrossRef]
- Ban, Y.; Wang, Y.; Chen, X.; Wei, L. Synergistic Patterns of Urban Economic Efficiency and the Economic Resilience of the Harbin–Changchun Urban Agglomeration in China. Sustainability 2022, 15, 102. [Google Scholar] [CrossRef]
- Lv, J.; Zeng, H.; Liu, Z. The impact of green innovation capacity on urban economic resilience: Evidence from China’s Yangtze River Delta region. Sustainability 2023, 15, 15235. [Google Scholar] [CrossRef]
- Zhao, R.; Fang, C.; Liu, H.; Liu, X. Evaluating urban ecosystem resilience using the DPSIR framework and the ENA model: A case study of 35 cities in China. Sustain. Cities Soc. 2021, 72, 102997. [Google Scholar] [CrossRef]
- Meng, Z.; He, M.; Li, X.; Li, H.; Tan, Y.; Li, Z.; Wei, Y. Spatio-temporal analysis and driving forces of urban ecosystem resilience based on land use: A case study in the Great Bay Area. Ecol. Indic. 2024, 159, 111769. [Google Scholar] [CrossRef]
- Xu, C.; Huo, X.; Hong, Y.; Yu, C.; de Jong, M.; Cheng, B. How urban greening policy affects urban ecological resilience: Quasi-natural experimental evidence from three megacity clusters in China. J. Clean. Prod. 2024, 452, 142233. [Google Scholar] [CrossRef]
- Chen, M.; Jiang, Y.; Wang, E.; Wang, Y.; Zhang, J. Measuring urban infrastructure resilience via pressure-state-response framework in four Chinese municipalities. Appl. Sci. 2022, 12, 2819. [Google Scholar] [CrossRef]
- Wang, J.; Deng, Y.; Qalati, S.A.; Qureshi, N.A. Urban resilience and transportation infrastructure level in the yangtze river delta. Front. Environ. Sci. 2022, 10, 893964. [Google Scholar] [CrossRef]
- Wang, J.; Deng, Y.; Kumari, S.; Song, Z. Research on the spatial spillover effect of transportation infrastructure on urban resilience in three major urban agglomerations in China. Sustainability 2023, 15, 5543. [Google Scholar] [CrossRef]
- Ye, X.; Du, J.; Han, Y.; Newman, G.; Retchless, D.; Zou, L.; Ham, Y.; Cai, Z. Developing human-centered urban digital twins for community infrastructure resilience: A research agenda. J. Plan. Lit. 2023, 38, 187–199. [Google Scholar] [CrossRef]
- Wang, P.; Li, Y.; Zhang, Y. An urban system perspective on urban flood resilience using SEM: Evidence from Nanjing city, China. Nat. Hazards 2021, 109, 2575–2599. [Google Scholar] [CrossRef]
- Xu, T.; Xie, Z.; Jiang, F.; Yang, S.; Deng, Z.; Zhao, L.; Wen, G.; Du, Q. Urban flooding resilience evaluation with coupled rainfall and flooding models: A small area in Kunming City, China as an example. Water Sci. Technol. 2023, 87, 2820–2839. [Google Scholar] [CrossRef] [PubMed]
- Li, W.; Jiang, R.; Wu, H.; Xie, J.; Zhao, Y.; Song, Y.; Li, F. A system dynamics model of urban rainstorm and flood resilience to achieve the sustainable development goals. Sustain. Cities Soc. 2023, 96, 104631. [Google Scholar] [CrossRef]
- Carvalho, D.; Martins, H.; Marta-Almeida, M.; Rocha, A.; Borrego, C. Urban resilience to future urban heat waves under a climate change scenario: A case study for Porto urban area (Portugal). Urban Clim. 2017, 19, 1–27. [Google Scholar] [CrossRef]
- Xi, Z.; Li, C.; Zhou, L.; Yang, H.; Burghardt, R. Built environment influences on urban climate resilience: Evidence from extreme heat events in Macau. Sci. Total Environ. 2023, 859, 160270. [Google Scholar] [CrossRef]
- Liu, L.; Lei, Y.; Zhuang, M.; Ding, S. The impact of climate change on urban resilience in the Beijing-Tianjin-Hebei region. Sci. Total Environ. 2022, 827, 154157. [Google Scholar] [CrossRef] [PubMed]
- Liu, J.; Wang, J.; Chen, T.; Wang, L. Heat stress resilience assessment of urban form from physical space dimension: A case study of Guangdong-Hong Kong-Macao Greater Bay Area. Urban Clim. 2024, 55, 101905. [Google Scholar] [CrossRef]
- Zhai, C.; Zhao, Y.; Wen, W.P.; Qin, H.; Xie, L. A novel urban seismic resilience assessment method considering the weighting of post-earthquake loss and recovery time. Int. J. Disaster Risk Reduct. 2023, 84, 103453. [Google Scholar] [CrossRef]
- Zhao, T.; Tang, Y.; Li, Q.; Wang, J. Enhancing urban system resilience to earthquake disasters: Impact of interdependence and resource allocation. Int. J. Crit. Infrastruct. Prot. 2024, 45, 100673. [Google Scholar] [CrossRef]
- Gao, L.; Wang, M.; Liu, A.; Gong, H. Comprehensive evaluation of urban road network resilience facing earthquakes. Math. Probl. Eng. 2021, 2021, 6659114. [Google Scholar] [CrossRef]
- Zheng, Y.; Huang, J.; Li, S.; Nie, J.; Chen, H.; Han, G. Socioeconomic impacts on damage risk from typhoons in mega-urban regions in China: A case study using Typhoons Mangkhut and Lekima. Int. J. Disaster Risk Reduct. 2024, 101, 104210. [Google Scholar] [CrossRef]
- Liu, W.Y.; Liu, C.R.; Lin, C.C. Enhancing urban climate resilience: A holistic evaluation of urban forest disservices in the aftermath of typhoons. Urban Clim. 2024, 54, 101857. [Google Scholar] [CrossRef]
- Ding, S.; Xu, L.; Liu, S.; Yang, X.; Wang, L.; Perez-Sindin, X.S.; Prishchepov, A.V. Understanding the spatial disparity in socio-economic recovery of coastal communities following typhoon disasters. Sci. Total Environ. 2024, 919, 170831. [Google Scholar] [CrossRef]
- Godschalk, D.R. Urban hazard mitigation: Creating resilient cities. Nat. Hazards Rev. 2003, 4, 136–143. [Google Scholar] [CrossRef]
- Hernantes, J.; Maraña, P.; Gimenez, R.; Sarriegi, J.M.; Labaka, L. Towards resilient cities: A maturity model for operationalizing resilience. Cities 2019, 84, 96–103. [Google Scholar] [CrossRef]
- Tang, D.; Li, J.; Zhao, Z.; Boamah, V.; Lansana, D.D. The influence of industrial structure transformation on urban resilience based on 110 prefecture-level cities in the Yangtze River. Sustain. Cities Soc. 2023, 96, 104621. [Google Scholar] [CrossRef]
- He, J.; Shi, X.; Fu, Y. Identifying vegetation restoration effectiveness and driving factors on different micro-topographic types of hilly Loess Plateau: From the perspective of ecological resilience. J. Environ. Manag. 2021, 289, 112562. [Google Scholar] [CrossRef]
- Zhang, C.; Zhou, Y.; Yin, S. Interaction mechanisms of urban ecosystem resilience based on pressure-state-response framework: A case study of the Yangtze River Delta. Ecol. Indic. 2024, 166, 112263. [Google Scholar] [CrossRef]
- Feng, Y.; Lee, C.C.; Peng, D. Does regional integration improve economic resilience? Evidence from urban agglomerations in China. Sustain. Cities Soc. 2023, 88, 104273. [Google Scholar] [CrossRef]
- Mehmood, A. Of resilient places: Planning for urban resilience. Eur. Plan. Stud. 2016, 24, 407–419. [Google Scholar] [CrossRef]
- Vallance, S.; Carlton, S. First to respond, last to leave: Communities’ roles and resilience across the ‘4Rs’. Int. J. Disaster Risk Reduct. 2015, 14, 27–36. [Google Scholar] [CrossRef]
- Ouyang, M.; Dueñas-Osorio, L.; Min, X. A three-stage resilience analysis framework for urban infrastructure systems. Struct. Saf. 2012, 36, 23–31. [Google Scholar] [CrossRef]
- Zhao, R.; Fang, C.; Liu, J.; Zhang, L. The evaluation and obstacle analysis of urban resilience from the multidimensional perspective in Chinese cities. Sustain. Cities Soc. 2022, 86, 104160. [Google Scholar] [CrossRef]
- Guo, Z.; Yao, S.; Chen, S.; Wu, W.; Liu, W. Spatial-temporal evolution of the livability levels in the Yangtze River Delta urban agglomerations and its influencing factors. Econ. Geogr. 2020, 40, 79–88. (In Chinese) [Google Scholar]
- Wu, G.; Francey, L.J.; Ruben, M.D.; Hogenesch, J.B. Normalized coefficient of variation (nCV): A method to evaluate circadian clock robustness in population scale data. Bioinformatics 2021, 37, 4581–4583. [Google Scholar] [CrossRef]
- Wu, X.; Huang, X.; Guo, S. The fractal characteristics and risk indicators of urban ecological environment vulnerability evolution. Ecol. Inform. 2025, 86, 103033. [Google Scholar] [CrossRef]
- Chen, Y.; Zhu, M.; Lu, J.; Zhou, Q.; Ma, W. Evaluation of ecological city and analysis of obstacle factors under the background of high-quality development: Taking cities in the Yellow River Basin as examples. Ecol. Indic. 2020, 118, 106771. [Google Scholar] [CrossRef]
- Tan, Y.; Wang, C.; Chen, M.; Hai, X.; Yao, H. Measurement and Spatio-temporal Differentiation of Common Prosperity Level of Chinese Farmers. Econ. Geogr. 2022, 42, 11–21. (In Chinese) [Google Scholar]
- Peng, K.; He, X.; Xu, C. Coupling coordination relationship and dynamic response between urbanization and urban resilience: Case of Yangtze river delta. Sustainability 2023, 15, 2702. [Google Scholar] [CrossRef]
- Li, S.; Su, X.; Fu, A. Impact of Economic Resilience on High-quality Development of Urban Agglomerations in the Middle Reaches of the Yangtze River. Econ. Geogr. 2022, 42, 19–24. (In Chinese) [Google Scholar]
- Ye, C.; Hu, M.; Lu, L.; Dong, Q.; Gu, M. Spatio-temporal evolution and factor explanatory power analysis of urban resilience in the Yangtze River Economic Belt. Geogr. Sustain. 2022, 3, 299–311. [Google Scholar] [CrossRef]
- Sun, J.; Zhai, N.; Mu, H.; Miao, J.; Li, W.; Li, M. Assessment of urban resilience and subsystem coupling coordination in the Beijing-Tianjin-Hebei urban agglomeration. Sustain. Cities Soc. 2024, 100, 105058. [Google Scholar] [CrossRef]
- Xiao, Y.; Rao, X.; Chang, M.; Chen, L.; Huang, H. Assessment of urban flood resilience and obstacle factors identification: A case study of three major urban agglomerations in China. Ecol. Indic. 2025, 176, 113659. [Google Scholar] [CrossRef]
Disclaimer/Publisher’s Note: The statements, opinions and data contained in all publications are solely those of the individual author(s) and contributor(s) and not of MDPI and/or the editor(s). MDPI and/or the editor(s) disclaim responsibility for any injury to people or property resulting from any ideas, methods, instructions or products referred to in the content. |
© 2025 by the authors. Licensee MDPI, Basel, Switzerland. This article is an open access article distributed under the terms and conditions of the Creative Commons Attribution (CC BY) license (https://creativecommons.org/licenses/by/4.0/).