Abstract
The selection of a suitable site for a new university in southern Jordan involves a comprehensive approach to ensure sustainability, accessibility, and community service. This study applies a Geographic Information System (GIS)-based weighted overlay analysis, integrating multiple spatial criteria to identify optimal locations. Key factors include terrain characteristics, such as elevated or moderately sloped areas; proximity to main roads for accessibility; and distance from industrial zones, water bodies, and existing universities to minimize environmental and educational overlap. Additionally, proximity to populated areas, health facilities, and banking services is prioritized to enhance convenience and support for the university community. The criteria were assigned different weights, with population and residential areas receiving the highest priority (30%), followed by terrain, roads, and existing institutions (14% each). The results showed that around 8% of the study area was classified as highly suitable, 22% as moderately suitable, and 70% as unsuitable. The top three locations achieved suitability scores exceeding 85%, being situated near major roads, within 2 km of populated areas, and in terrain with slopes under 15%. The GIS-based model offers a replicable framework for similar projects, facilitating data-driven decision-making in higher education planning.
1. Introduction
The integration of modern technologies such as GIS and remote sensing has revolutionized various fields, including urban planning and educational infrastructure development [1,2]. GIS is particularly suitable for site selection because it enables the systematic integration, analysis, and visualization of diverse spatial datasets to support complex decision-making [3]. Unlike traditional site selection methods which often rely on manual surveys and subjective judgments, GIS provides an objective, data-driven framework that increases accuracy, transparency, and replicability [4].
Site selection methods are generally classified into three main categories: traditional (manual approaches), statistical models, and spatial decision-support systems. Traditional approaches, such as expert-based evaluation, Delphi techniques, and stakeholder consultations, often rely on subjective judgment, which may introduce bias and lack replicability [5]. Statistical and econometric models, including regression analysis and Structural Equation Modeling (SEM), offer valuable empirical insights but are constrained by limited capacity to handle spatial heterogeneity or visualize geospatial relationships [6]. In contrast, GIS provides a spatially explicit, integrative platform for analyzing multiple quantitative and qualitative criteria simultaneously. When combined with Multi-Criteria Decision Analysis (MCDA), GIS enables planners to assess trade-offs among environmental, socio-economic, and infrastructural factors, improving transparency and objectivity in location planning [7]. Modern GIS applications also leverage tools like Model Builder for workflow automation and Kernel Density Estimation (KDE) to map the spatial concentration of population and services, which is particularly useful for identifying underserved areas [8]. The novelty of this study lies in integrating KDE with weighted overlay GIS analysis to generate suitability zones for university location planning, emphasizing both equity in access and risk-informed spatial exclusion, a combination rarely found in educational infrastructure studies.
Furthermore, GIS tools allow for the simultaneous consideration of multiple criteria such as terrain, population density, proximity to services, and environmental risk factors that are essential when planning a higher education institution [9]. These capabilities make GIS an ideal methodology for selecting a university location that balances accessibility, sustainability, and regional development needs. Therefore, GIS was selected as the core tool for this study due to its proven effectiveness in spatial decision-making across education and infrastructure planning domains.
Southern Jordan, encompassing an area of 45,441 square kilometers and home to approximately 820,200 people as of 2018 (according to Jordan Statistical estimates), faces a notable disparity in higher educational infrastructure compared to other regions within the country. This deficiency impedes community development and equitable access to quality education, necessitating a strategic approach to address these challenges.
Furthermore, GIS offers a replicable methodology applicable across different global contexts [10], ensuring that the chosen university site not only meets immediate educational needs but also aligns with long-term regional development and sustainability objectives [11]. By demonstrating the efficacy of GIS in optimizing educational infrastructure planning, this study exemplifies a forward-thinking approach to urban and regional development [12].
Despite the growing use of GIS in site selection, limited research has specifically focused on university planning in sparsely populated and environmentally diverse regions like southern Jordan, where infrastructure disparities pose significant challenges to equitable access [13]. Most existing studies target urban centers or densely populated regions, often overlooking the unique constraints of semi-arid and mountainous terrains.
This study addresses a critical gap by applying a GIS-based weighted overlay approach tailored to the unique regional characteristics of southern Jordan. It integrates both environmental risk factors (e.g., flood-prone zones and proximity to industrial areas) and key elements of social infrastructure (e.g., health, education, and banking services). The novelty of this work lies in its comprehensive multi-criteria integration of topographic, infrastructural, and demographic datasets, combined with the use of Kernel Density Estimation (KDE) to highlight areas of service concentration—an approach rarely applied in the context of university site selection. By incorporating KDE alongside weighted spatial analysis, this study provides a more refined and data-driven understanding of location suitability. Moreover, the proposed methodology offers a replicable framework for sustainable and equitable educational infrastructure planning, particularly in underserved or geographically complex regions.
This study seeks to bridge this educational gap by utilizing advanced GIS techniques, including Digital Elevation Models (DEMs), land use maps, and road networks, to pinpoint the most suitable site for a new university. Unlike traditional methodologies relying on manual surveys and subjective assessments, GIS enables rigorous spatial analysis by integrating diverse datasets and employing tools like Model Builder for enhanced accuracy and efficiency [14,15].
1.1. GIS Applications in Site Selection
GIS has revolutionized site selection processes by enabling the integration and analysis of spatial data with precision and efficiency [2,16]. Refs. [17,18] underscores GIS’s capability to collect, store, manipulate, and visualize geographic information crucial for decision-making. GIS integrates diverse spatial data layers such as land use patterns, transportation networks, demographic profiles, and environmental factors to facilitate the identification of optimal locations based on predefined criteria.
In the education sector, GIS is used to optimize accessibility and service coverage. Mustaffa et al. [19] conducted a systematic site selection for primary schools in the Melaka Tengah District, Malaysia, integrating both spatial and non-spatial factors. By employing Multi-Criteria Decision Analysis (MCDA) within GIS, they evaluated demographic patterns, safety considerations, and constraints. Public input and expert opinions were then included in an accessibility analysis, resulting in a suitability map showing that 46% of the region was appropriate for school development. GIS is also crucial in locating environmentally sensitive infrastructure. Basha et al. [20] applied both classical and fuzzy analytical hierarchy process (AHP) methods to identify optimal locations for a solid waste-to-energy plant. Thirteen criteria, including environmental, social, and economic factors, were integrated into a GIS-based MCDM model. Their suitability mapping showed that only 0.04% of the study area was highly suitable, underscoring the tool’s precision in ruling out inappropriate sites. For urban infrastructure, GIS enhances spatial planning and demand analysis. In Shiraz, Iran, researchers developed a fuzzy MCDM model using GIS to manage parking in the central business district [21]. Variables included proximity to roads and attractions, land value, and availability of multi-story parking. GIS overlays identified areas with parking shortages that also met planning criteria, illustrating the model’s practical utility for urban service optimization.
1.2. Factors Influencing University Site Selection
Selecting an ideal site for a university involves evaluating various factors that collectively determine its suitability. Prasetyo et al. [22] aimed to assist the government in determining the suitability of the entire city area for new school locations and evaluating existing school sites. The research proposed six spatial factors: administration, population, transportation, land use, student flow, and public preferences. These factors were represented as raster files, constructed from primary and secondary tabular and spatial data. Each factor was then assigned a weight using the multi-criteria decision analysis method through the analytical hierarchy process. The findings indicated areas in Surabaya that are recommended and not recommended for new school construction.
Mukhopadhaya [23] outlined the application of GIS and MCE techniques for identifying the most suitable locations for a new professional college in Dehradun, Uttarakhand. Topographic sheets and satellite data were utilized to generate various thematic layers using software like ArcGIS 10.7. The criteria for site selection included connectivity to ads while avoiding highways, distance from major residential areas but not too far from the city, land use/land cover, land proximity, and other geographical information. Each criterion was assigned a weight based on its importance. These weights and maps were then combined using ArcGIS tools to produce a final map showing the most suitable sites for the college.
Tamimi et al. [24] investigated the main factors influencing Omani college students when selecting a university for higher education. Using questionnaires, data were collected to assess students’ needs, expectations, and perceptions regarding their university choice, and the findings were analyzed through Structural Equation Modeling-Partial Least Squares (SEM-PLS). The results revealed that while factors such as university infrastructure and location had a minimal impact on students’ decisions, the institution’s reputation played a significant role in influencing their choice. This suggests that students place more importance on a university’s reputation than on its physical attributes when making their selection.
Mehedi et al. [25] examined the factors influencing students’ decisions on selecting an institution for higher education, focusing on students from seven private institutions in Dhaka. A quantitative approach was used to gather and analyze data, with responses from 140 students primarily described using descriptive statistics, including frequencies, percentages, meanings, and standard deviations. The results show that factors such as family monthly income, tuition fees, job opportunities outside the university, parents’ or guardians’ income, transportation costs, the availability of required programs, academic reputation, university ranking, financial assistance, and international recognition all play an influential role in the university selection process in Bangladesh. Additionally, personal interest, parents’ or guardians’ opinions, the university’s location, surrounding and internal facilities, and campus security were also found to significantly impact students’ decisions.
Lou et al. [26] investigated the key factors influencing the selection of sites for higher education institutions worldwide. Through a comprehensive literature review and meta-analysis of secondary data spanning from 1990 to 2024, insights were synthesized from 37 original research articles. The findings highlighted the critical importance of socio-economic and health-related conditions, students’ preferences regarding institutional accessibility, and the availability of transportation services. These results emphasize the need for a greater global focus on improving institutional site suitability by addressing socio-economic and health-related factors.
1.3. GIS-Based Spatial Analysis Techniques
GIS offers powerful spatial analysis techniques essential for evaluating potential university sites [27,28]. Kuznichenko et al. [29] proposed a methodology for a two-stage fuzzy multi-criteria decision analysis within a raster-based GIS to identify suitable locations for territorial objects. The process includes recommendations for selecting alternatives based on spatial and non-spatial constraints. The fuzzification of criteria involves converting attribute values into fuzzy sets, based on expert evaluation using a fuzzy membership function., helps in screening alternatives by establishing alpha-cut thresholds for each criterion. Afterward, criteria attributes are combined using aggregation operators such as minimum, maximum, weighted sum, or the Ordered Weighted Averaging (OWA) operator by Jager. Incorporating an additional stage of alternative filtration in the multi-criteria analysis enables a reduction in the number of alternatives, ultimately decreasing processing time for the criteria layers using aggregation operators.
The Nansi Lake Region was selected as a case study for developing a site selection decision framework that takes ecological constraints into account. GIS and multi-criteria decision-making methods were integrated to assess land suitability and evaluate potential site alternatives. The results showed that the very high-suitability area covered approximately 44.40 km2, primarily located along Nansi Lake, with concentrations in Weishan County, Yutai County, and Peixian County. The optimal township for establishing the optimal Agricultural Production and Livelihood Center (OAPLC) was identified as Xiazhen Street in Weishan County, with the best specific site (P1) found in Malou village. A sensitivity analysis further validated that the decision framework, developed under ecological constraints and incorporating multiscale approaches, performed effectively in determining the optimal OAPLC location [30].
1.4. Model Builder in GIS
Model Builder plays a crucial role in GIS platforms, enabling the automation and customization of complex geoprocessing workflows tailored to site selection criteria [31]. Khazael and Al-Bakri [32] integrated the Analytic Hierarchy Process (AHP), a multi-criteria decision-making technique, with Model Builder in GIS to evaluate land suitability for establishing solar farms in Iraq. The modeling process considered various climatic, geomorphological, economic, and environmental criteria, along with exclusionary constraints, and was supported by expert knowledge and a comprehensive literature review. The results indicated that approximately 19% of the study area is optimal for solar farm installation, with the southern, southeastern, and parts of the western regions containing the largest portions of suitable land.
Nguyen, Truong, and Phan [33] identified the best sites for solar farm development in Binh Thuan province, located in the low, hilly–mountainous region of south-central Vietnam, using Model Builder in GIS. It evaluates four main criteria groups: climate, location, land use, and orography, which encompass eight specific criteria: solar radiation, land surface temperature, proximity to substations, main roads, residential areas, historical and tourism sites, land use type, and slope. These criteria are further broken into twenty-four sub-criteria, assessing the pros and cons of each. The Analytic Hierarchy Process is utilized to assign relative weights to each criterion and sub-criterion. A Land Suitability Index score is calculated to classify areas into four categories: very advantageous, advantageous, rather advantageous, and disadvantageous for solar farm development. A suitability map is then created to visually represent these classifications.
2. Methodology
2.1. Study Area
The use of GIS in higher education site selection has gained increasing attention in sustainable development and spatial equity research. GIS enables planners to evaluate complex criteria—such as population distribution, terrain, infrastructure, and risk factors—in an integrated and spatially explicit manner. This approach is particularly valuable in regions where natural and socio-economic conditions limit access to public services, such as higher education.
This study focuses on southern Jordan, which comprises the governorates of Karak, Tafileh, Ma’an, and Aqaba, spanning over 45,000 km2, or more than half of Jordan’s total land area. Geographically, the region lies in the southern part of the Hashemite Kingdom of Jordan, bordered by Saudi Arabia to the south and east, and the Dead Sea to the west. It is of strategic national importance, particularly due to the presence of Aqaba, Jordan’s only seaport and gateway to the Red Sea. The region’s topography is highly diverse, featuring mountainous areas with elevations above 1300 m, expansive desert plateaus, deep wadis, and volcanic basalt fields. Climatically, southern Jordan experiences arid to semi-arid conditions, with extremely hot summers and limited rainfall—especially in Ma’an and Aqaba, where annual precipitation averages around 50 mm. Figure 1 shows the study area.
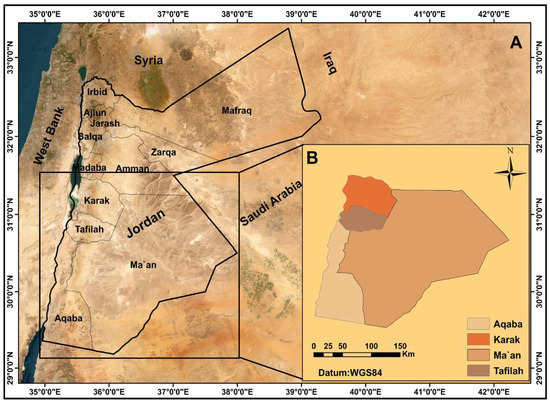
Figure 1.
Study area.
Socio-economically, southern Jordan is less urbanized and less developed than the central and northern parts of the country. The population is unevenly distributed, with urban concentrations in Karak City, Tafileh City, Ma’an City, and Aqaba City, and sparse settlements in surrounding rural areas. The local economy depends heavily on tourism, phosphate mining, agriculture, and port-related industries, yet access to higher education remains limited, with few universities serving a large and geographically dispersed population.
To address these disparities, this study applies a GIS-based weighted overlay analysis combined with Kernel Density Estimation (KDE) to identify optimal locations for new universities. This methodology supports informed, equitable, and sustainable decision-making in educational infrastructure planning.
While GIS-based techniques have been employed in prior educational planning studies, the novelty of this research lies in its integrated, equity-focused approach tailored to the specific challenges of southern Jordan. This study uniquely combines KDE with weighted overlay analysis to identify not only suitable land but also underserved population clusters that lack access to higher education. A key innovation is the incorporation of distance from existing universities as a core exclusion criterion, ensuring that the selected sites serve genuinely unaddressed needs. Furthermore, proximity to essential services, such as healthcare and banking, was considered alongside environmental risk avoidance (e.g., flood zones and industrial areas), enabling a comprehensive, safety-conscious selection model. The use of Model Builder in ArcGIS for automating the entire spatial decision-making process adds to the transparency and reproducibility of the methodology. The study’s key finding that only 8% of the region meets the stringent suitability criteria underscores the severity of spatial inequality in educational access and highlights the importance of data-driven planning in promoting regional equity. This framework offers a replicable model for other geographically constrained or underserved regions facing similar development challenges.
2.2. Data Analysis
The methodology employed in this study involved a structured approach to assessing potential sites for a new university in southern Jordan using GIS and spatial analysis techniques; Figure 2 shows a flowchart of the study.

Figure 2.
Flowchart of the study.
The study employed a robust methodology to gather and analyze comprehensive data essential for evaluating potential sites for a new university in southern Jordan. The study factors were selected based on their direct relevance to the accessibility, functionality, and safety sustainability of a university environment. Priority was given to factors that have a main impact on the success and daily operation of a higher education institution, including proximity to major roads, population centers, health and banking services, and terrain features such as slopes. Environmental risk factors, for example, flood-prone areas, distance from industrial zones, and water bodies, were also included to ensure the site viability and safety. Commercial features such as shopping areas were not selected as essential for site selection, as they do not significantly influence academic outcomes or core operational needs. This aligns with previous studies emphasizing basic infrastructure and environmental suitability over non-essential amenities in educational planning [19,23].
In the first stage, key spatial datasets were collected to build a foundational understanding of the study area’s physical and socio-economic context. These included a DEM with a spatial resolution of 12.5 m for analyzing slope and elevation changes, administrative boundaries to delineate provincial extents, and a road network map to assess regional accessibility following approaches recommended by Karna et al. [34]. Additional datasets included locations of healthcare services, industrial zones, water bodies, and natural features such as wadis. Together, these data layers represented both infrastructure availability and environmental constraints.
In the second stage, the data collected were processed using ArcToolbox in ArcGIS 10.7. This involved computing Euclidean distances from key features such as roads, health services, valleys, and universities to understand spatial relationships. Each data layer was reclassified into ten suitability categories, standardizing values across factors to support multi-criteria analysis. These reclassified layers were combined using GIS 10.7 overlay techniques to identify areas of cumulative suitability. A weighted overlay was carried out, in which expert-derived weights were assigned to each factor to reflect their relative importance (e.g., population density at 30%, and terrain slope and road access at 14% each). To further enhance spatial understanding, KDE was applied to identify clusters of high population and service density. KDE was executed with a Gaussian kernel, a bandwidth of 1500 m, and a raster cell size of 100 m, appropriate for the study area’s regional scale. The KDE results highlighted population/service concentration zones, critical for understanding demand and infrastructure accessibility, following the spatial analysis framework presented by Dehghani and Soltani [21,35].
In the final stage, the weighted layers were overlaid to create a composite suitability map, displaying varying degrees of site suitability across the region. The map was color-coded to clearly distinguish high, moderate, and low suitability zones. High-scoring areas were identified and selected as potential university locations, and their geographic coordinates were recorded to support future site-specific planning and development.
A wide range of spatial and non-spatial datasets were utilized in this study to conduct a comprehensive site suitability analysis. These datasets were sourced from both local and international institutions. Road networks were sourced from the Ministry of Public Works and Housing. Population and residential distribution data were derived from the 2018 census by the Department of Statistics and used for Kernel Density Estimation (KDE) to evaluate service accessibility. Locations of hospitals, clinics, and ATMs were collected from the Ministry of Health, Central Bank of Jordan, and OSM. Educational institutions were identified using data from the Ministry of Higher Education. Industrial zones, airports, and water bodies were integrated by the Ministry of Environment and the Ministry of Transport. Historical flood-prone areas and water channels were mapped based on data from the Jordan Meteorological Department and the Ministry of Water and Irrigation. Points of interest such as student housing, hotels, and service facilities were verified using OpenStreetMap and field visits. All spatial data were projected using the WGS 1984 UTM Zone 36N coordinate system and analyzed in ArcGIS 10.8.
Table 1 outlines the specific criteria used for evaluating the suitability of potential university sites, detailing the range of values assigned after reclassification and the resultant layers created for analysis.

Table 1.
The criteria used for evaluating the suitability of potential university sites.
3. Results
3.1. Elevated or Moderately Sloped Terrain
The selection of the university site prioritized elevated or moderately sloped terrain to enhance both health and aesthetic appeal while avoiding mountain peaks and rugged areas. The slope of the study area was assessed using a DEM, revealing that the southern and southeastern regions were steeper, with slopes reaching up to 82 degrees. This criterion was considered significant in the analysis and was assigned a weight of 14%. By prioritizing areas with gentle slopes and moderate elevations, this criterion ensures that the selected site will not only be accessible and conducive to construction but also provide a pleasant and sustainable environment for the university community. Figure 3 illustrates slope suitability values reclassified on a scale from 1 (very steep, unsuitable) to 10 (gentle slope, highly suitable), with green areas indicating optimal terrain and red representing areas unsuitable for development.

Figure 3.
The slope of the area.
3.2. Proximity to Main Roads
Proximity to main roads is a critical factor in university site selection, as it ensures ease of access for students, faculty, visitors, and service providers. The resulting distance values were then reclassified into ten suitability categories ranging from 1 to 10. Areas closer to main roads received higher suitability scores (10), indicating greater accessibility, while locations farther away were assigned lower scores (1) due to potential transportation challenges. A weight of 14% was assigned to this factor in the weighted overlay model to reflect its substantial impact on site feasibility.
Figure 4 presents the spatial distribution of road accessibility using a color-coded legend. Green areas (value 10) represent regions with the highest accessibility, located closest to the main road network. Purple to light pink zones indicate decreasing levels of suitability, with the red and magenta tones (values 1–3) identifying the most inaccessible areas. The dense red lines represent the existing main roads in the study area. This classification facilitates the identification of potential university locations with strong transportation connectivity, supporting long-term operational efficiency and community integration.

Figure 4.
The main road distribution.
3.3. Environmental and Geological Risk Considerations
To ensure environmental sustainability and minimize exposure to natural and man-made hazards, this study incorporated key environmental and geological risk factors in the site selection process. These include proximity to industrial zones, flood-prone areas, and natural waterways. Integrating these layers helps exclude areas with potential pollution, ecological sensitivity, or flooding risk, thereby identifying safer and more sustainable locations for establishing a university campus.
Industrial zones, such as those in Karak, Aqaba, and Ma’an, were considered areas of environmental concern due to potential pollution and incompatible land use. Euclidean distance analysis was used to create a proximity-based raster surface. The resulting map was reclassified into ten suitability levels, where greater distances from industrial zones were considered more favorable. Figure 5a illustrates this distribution, emphasizing areas less affected by industrial activities. Higher values (green) represent areas far from industrial zones (suitable), while lower values (red) indicate close proximity and potential environmental risk.
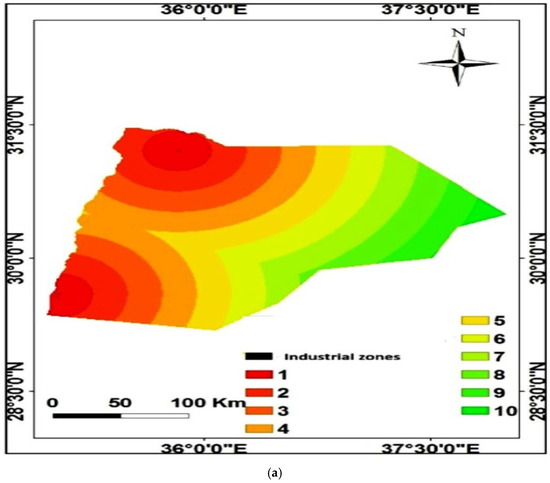
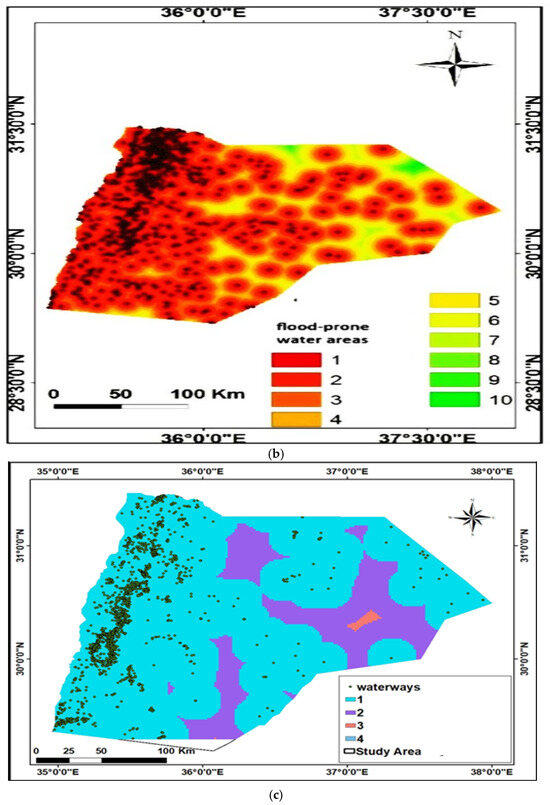
Figure 5.
(a). The spatial distribution of industrial influence across the study area; (b). flood-prone water suitability map; (c). the water resourse distribution in the area.
Flood-prone areas were identified using point data from historical flood events and seasonal water channel locations. A Euclidean distance surface was generated to show flood exposure, then reclassified into ten categories representing suitability. Areas closer to flood-prone locations were deemed less suitable, while distant areas received higher scores. This analysis ensures the exclusion of flood-vulnerable regions. Figure 5b displays the flood-prone water suitability map. The color scale shows suitability based on distance from flood-prone zones, where green (value 10) denotes safe areas far from risk and red (value 1) indicates proximity to flood hazards.
Waterways, including natural rivers and streams, play an important role in long-term sustainability and environmental protection. Proximity to these features was analyzed using Euclidean distance to ensure university sites are located at an optimal distance—close enough to benefit from water resources but far enough to prevent ecological disturbance. The suitability map, shown in Figure 5c, classifies the study area into ten categories, where intermediate distances are generally preferred. The legend reflects suitability based on proximity to water bodies, with intermediate distances (green–yellow range) rated as more favorable for site selection.
All three environmental risk layers were standardized and assigned appropriate weights in the weighted overlay model (7% each). Incorporating these environmental and hydrological considerations helps ensure that the final recommended locations are environmentally appropriate, resilient to hazards, and aligned with sustainable land use planning principles.
3.4. Distance from Existing Universities
The selected site for the new university should maintain a considerable distance from existing universities, both public and private, within the study area. This approach is essential to ensure that the new institution serves underserved regions, thus providing educational opportunities in areas where they are most needed. By deliberately avoiding proximity to established universities, the new university can better address the demand for higher education in less-served areas, enhancing access to education and fostering regional development. This strategy underscores the commitment to equitable education distribution and the necessity of expanding higher education access to diverse communities. Figure 6 displays the distribution of education services within the study area. Suitability scores, ranging from 1 to 10, are based on the distance from existing universities and colleges, where the green areas represent underserved regions with high suitability (score 10), while the red areas indicate zones already served by nearby institutions and are thus considered low in suitability.
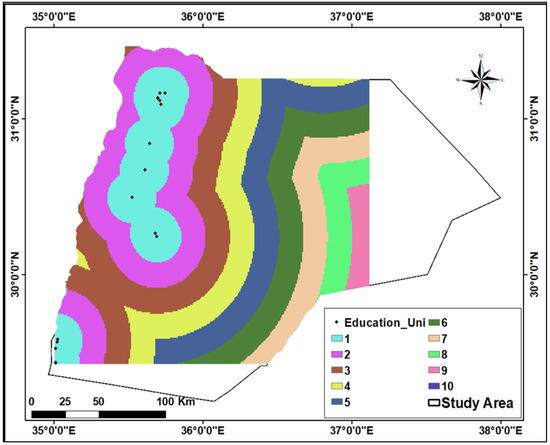
Figure 6.
Education service distribution in the area.
3.5. Distance from Populated Area
A layer representing population distribution within the study area was developed to identify high-density areas. Sites located near these populated regions were considered more suitable for establishing the new university, ensuring that the institution effectively serves the local community. Recognizing the importance of accessibility and outreach, this criterion was assigned the highest weight of 30%. This prioritization emphasizes the necessity of connecting the university with its surrounding population, thereby enhancing educational opportunities and fostering community engagement. Figure 7 illustrates the population area distribution, where areas with high population density are shown in green (score 10), reflecting strong community demand and high suitability for university development. In contrast, the red areas represent sparsely populated zones with low suitability scores (1–3) due to limited local demand.
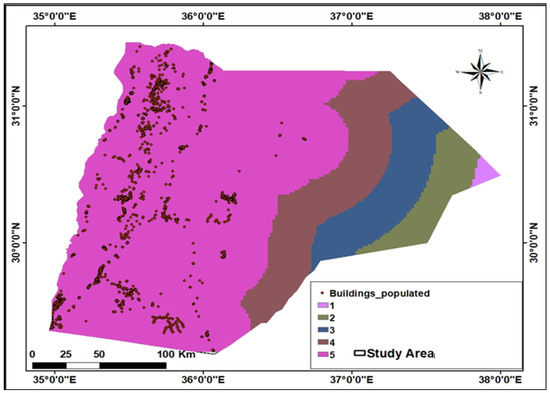
Figure 7.
The population area distribution.
3.6. Distance from Health Services and Banking Services
To ensure effective and sustainable educational services, it is crucial for these services to be close to key health facilities such as hospitals. Therefore, when selecting a location for educational services, it is essential to consider proximity to these health services to handle emergency situations involving students and staff. A weight value of 14% has been allocated to the importance of this proximity. Additionally, the location should be near banking services, such as banks and ATMs, to meet the financial needs of students and staff. Figure 8 presents the distribution of health and banking services in the study area. The suitability scale ranges from 1 (least suitable) to 10 (most suitable) based on proximity to hospitals and ATMs, where the green areas indicate high accessibility and therefore higher suitability, while the red areas represent remote regions with limited access to essential services.

Figure 8.
The health facility distribution.
3.7. Distance from Airports
When selecting a location for educational services, it is also important to consider the proximity to airports. The distance from airports can impact the accessibility of the institution for students, staff, and visitors traveling from different regions or countries. Figure 9 illustrates the spatial distribution of airports within the study area. The color scale reflects suitability based on distance, where moderate to far distances from airports—represented by green to yellow tones—are considered more suitable to minimize potential noise pollution and security risks, while areas in red are less suitable due to close proximity.
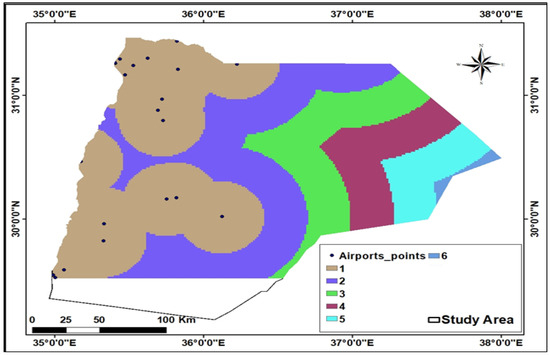
Figure 9.
The airport distribution.
3.8. Layer Weighting and Suitability Mapping
The influential weights for various layers in the study area were calculated, with each layer assigned a specific weight based on its importance (as determined by the researcher). The weights are presented in Table 2 and illustrated in Figure 10.
Table 2.
Weights for the classified layers used in the study area.
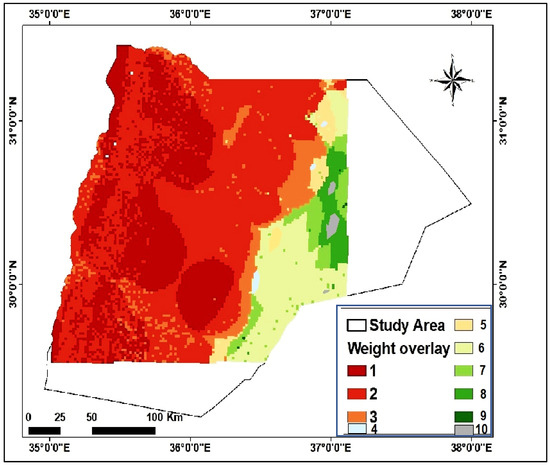
Figure 10.
The distribution of weights across the different layers.
The weights assigned to each layer reflect their relative importance in the site selection process. Higher weights indicate layers that have a more significant impact on the suitability of the site for establishing a university. For instance, population and residential areas have the highest weight (30%), suggesting that proximity to these areas is crucial for the site selection. Main roads, universities and colleges, and slope each have a weight of 14%, indicating their substantial influence. The remaining layers (hospitals and banking services, points of interest, valleys, industrial areas, airports, and water bodies) each have a weight of 7%, denoting their relatively lower but still essential impact on the decision-making process.
Figure 10 represents the distribution of weights across the different layers and illustrates how these weights influence the determination of the optimal site for establishing the university. The color-coded bars represent the relative influence of each factor on overall suitability, with the green tones indicating more heavily weighted and influential layers (e.g., population density), and the red tones reflecting factors with lower relative weight in the decision-making process.
The figure displays a map of the study area with an overlay of weight values representing different suitability levels for university site selection. The map uses a color-coded scale to indicate the varying degrees of suitability based on the weights assigned to different layers in the analysis. The areas shaded in green (weights 5–8) are identified as having higher suitability for establishing a university. These regions meet the criteria defined by the weighted factors and are considered optimal locations. The red-shaded regions (weights 1–4) are less suitable for a university site. These areas may have limitations or fewer desirable attributes based on the factors considered in the analysis. Areas with a mix of light red and green shades indicate transitional zones where suitability gradually changes. These areas may require further investigation to determine their feasibility for site selection.
This GIS model is designed to identify suitable locations based on a weighted overlay analysis as shown in Figure 11. The model incorporates various factors, including slope, features, populated places, educational institutions, main roads, health facilities, waterways, and points of interest. Each factor is analyzed for its distance and reclassified before being integrated into a weighted overlay to suggest optimal locations.
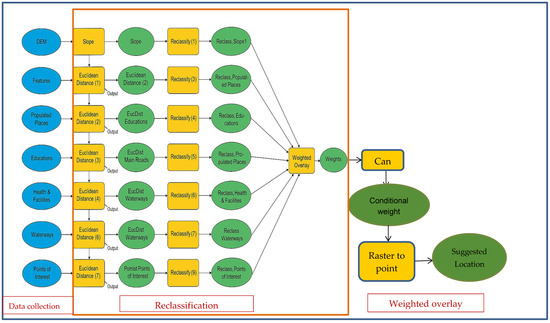
Figure 11.
GIS Model Builder workflow.
Finally, the raster data, representing the overall suitability, is converted into point data to identify specific suggested locations for the new university. The flowchart, thus, encapsulates a systematic and data-driven approach to site selection, integrating spatial analysis and multi-criteria decision-making to pinpoint the optimal sites for establishing the educational institution.
The output points represent suggested locations that are optimal based on the criteria and weights applied in the model. These locations reflect the highest composite suitability scores derived from multiple reclassified and weighted spatial layers. As part of the analysis, KDE was applied to visualize the spatial concentration of population centers and essential services. The KDE was conducted using a Gaussian kernel, with a bandwidth of 1500 m and an output raster cell size of 100 m. This helped identify areas with higher service accessibility and community presence. In Figure 12, the color gradient represents varying levels of suitability, where dark blue zones indicate high suitability, light blue indicates moderate suitability, and light gray zones reflect low suitability. These visualizations support data-driven decision-making for selecting the most appropriate university site in southern Jordan.
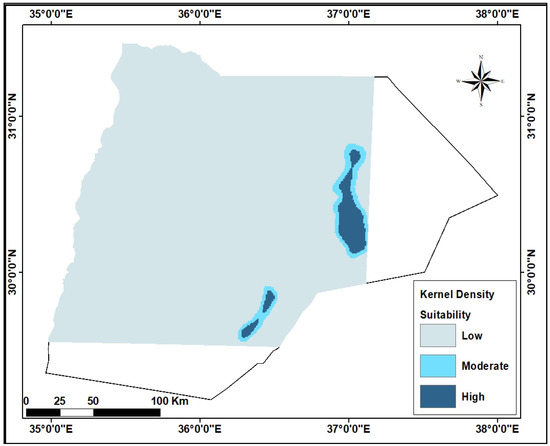
Figure 12.
Suggested optimal areas based on the criteria and weights applied in the model.
To evaluate the reliability of the generated suitability map, a statistical validation was performed by comparing the classified results with the actual locations of existing universities and dense population centers in the study area. The final suitability map was reclassified into three categories: highly suitable, moderately suitable, and unsuitable. Using spatial overlay, we assessed whether the reference points fell within the predicted suitable areas. The results showed that 83% of the ground truth points were in zones classified as highly suitable, yielding an overall accuracy of 83% and a Kappa coefficient of 0.78. This demonstrates a strong correlation between model outputs and real-world conditions, confirming the model’s effectiveness in identifying optimal locations for a university.
4. Decision
Site selection for the new university in Jordan utilizes a GIS-based weighted overlay analysis that aligns with the established methodologies. Emphasizing terrain suitability, our approach prioritizes elevated or moderately sloped areas to enhance both aesthetics and health benefits. This is consistent with the findings from Karna et al. [34] who similarly used GIS to select terrain conducive to construction and environmental sustainability. Proximity to main roads is also a key factor in our study, ensuring easy access and connectivity, which aligns with Moussa et al. [36] highlighting the importance of transportation infrastructure for campus accessibility.
Environmental considerations in our study focus on minimizing proximity to industrial areas, water bodies, and channels to avoid potential negative impacts. This mirrors the approach of Sugiarto et al. [37], who integrates environmental factors into campus planning to support sustainability. Our criterion of avoiding existing universities addressing service gaps reflects the strategic approach seen in Compagnucci and Spigarelli [38] which emphasizes placing new institutions in underserved regions. Additionally, the emphasis on proximity to populated areas is consistent with the findings of Chupp et al. [39], who stress the importance of community accessibility for maximizing the university’s reach.
The suitability results of this study align with key findings in the literature. For example, proximity to roads and residential clusters is consistent with Moussa et al. [34] and Mustaffa et al. [15], who highlight the importance of accessibility for site functionality. The emphasis on avoiding industrial zones and flood-prone areas follows principles outlined in sustainable infrastructure planning [16,21]. The innovative contributions of this study include the integration of KDE to analyze service and population concentrations—a rarely used technique in university site planning. Additionally, the use of Model Builder for automating weighted overlay analysis ensures repeatability and transparency in spatial decision-making. However, some limitations exist. First, the analysis relies on static geospatial datasets, which may not reflect future urban growth or climate risks. Second, there was limited incorporation of community input or ground truthing, which is vital for refining proposed sites. Future research should include stakeholder engagement, dynamic land use modeling, and scenario-based simulation to enhance policy relevance and implementation near large population centers.
In this study, population density outweighs environmental factors due to Jordan’s pressing need to expand educational access in densely populated areas. Unlike regions where land availability allows for greater emphasis on environmental preservation, Jordan’s limited urban space and uneven distribution of universities necessitate placing new institute.
Access to essential services such as health facilities and banking is another critical factor in our study, aligning with Griffin [40], which views these services as vital for campus functionality. Although proximity to airports is less emphasized, Ke et al. [41] also recognize it as an important supplementary factor, particularly for institutions with significant international student populations. Overall, our study’s approach effectively integrates practical and strategic factors, reflecting a comprehensive and well-aligned methodology with best practices in site selection.
5. Conclusions
This study employed a GIS-based weighted overlay analysis to identify the most suitable locations for a new university in southern Jordan. The methodology integrated multiple spatial criteria including terrain, road accessibility, environmental risks, and proximity to essential services to evaluate site suitability in a systematic and data-driven manner. The objective was to ensure that selected locations support long-term operational effectiveness, sustainability, and community engagement.
The analysis showed that 8% of the study area is highly suitable, with three optimal locations scoring above 85% suitability. These sites are located near major population centers and road networks specifically in areas of moderate slope (less than 15%), within 2 km of main roads, and well-served by health and banking services, while also being safely distanced from industrial zones and flood-prone regions. These characteristics make them ideal in terms of accessibility, environmental stability, and future development potential.
The findings highlight the importance of population density (assigned the highest weight at 30%) and slope, road access, and institutional distribution (14% each) in guiding location decisions. The final suitability map and identified sites serve as a decision-support tool for planners and policymakers tasked with improving higher education accessibility in southern Jordan.
This approach demonstrates a scalable framework for university site selection that can be adapted to other regions. Future research should include ground truthing the selected sites, incorporating community input, and accounting for long-term urban growth and environmental change scenarios. Such efforts will enhance the robustness of site selection and support the sustainable expansion of higher education infrastructure.
Author Contributions
Conceptualization, S.H.A.R.; methodology, S.A.A. and T.S.B.A.M.; data curation, S.H.A.R.; writing—original draft preparation, S.A.A.; visualization, E.A.; investigation, S.H.A.R.; software, S.A.A.; validation, Z.A.; writing—reviewing and editing, S.A.A. and E.A. All authors have read and agreed to the published version of the manuscript.
Funding
This research received no external funding.
Institutional Review Board Statement
Not applicable.
Informed Consent Statement
Not applicable.
Data Availability Statement
The data presented in this study are available on request from the corresponding author.
Conflicts of Interest
The authors declare no conflicts of interest.
References
- Technology, G. The Potential of Geographic Information Systems as a Tool to Achieve Sustainable Development Goals; Springer Nature Switzerland: Chem, Switzerland, 2024; pp. 1–13. [Google Scholar]
- Quamar, M.M.; Al-Ramadan, B.; Khan, K.; Shafiullah, M.; El Ferik, S. Advancements and Applications of Drone-Integrated Geographic Information System Technology—A Review. Remote Sens. 2023, 15, 5039. [Google Scholar] [CrossRef]
- Ali, U.; Shamsi, M.H.; Bohacek, M.; Purcell, K.; Hoare, C.; Mangina, E.; O’Donnell, J. A data-driven approach for multi-scale GIS-based building energy modeling for analysis, planning and support decision making. Appl. Energy 2020, 279, 115834. [Google Scholar] [CrossRef]
- Zubair, M.; Zafar, Z.; Mehmood, M.S.; Ahamad, M.I. Innovative GIS techniques for identifying optimal service center locations in Islamabad a PTCL case study. Discov. Cities 2025, 2, 4. [Google Scholar] [CrossRef]
- Malczewski, J.; Rinner, C. Multicriteria Decision Analysis in Geographic Information Science; Springer: Berlin/Heidelberg, Germany, 2015. [Google Scholar] [CrossRef]
- Thaden, H.; Kneib, T. Structural Equation Models for Dealing with Spatial Confounding. Am. Stat. 2018, 72, 239–252. [Google Scholar] [CrossRef]
- Terán-Gómez, V.F.; Buitrago-Ramírez, A.M.; Echeverri-Sánchez, A.F.; Figueroa-Casas, A.; Benavides-Bolaños, J.A. Integrating AHP and GIS for Sustainable Surface Water Planning: Identifying Vulnerability to Agricultural Diffuse Pollution in the Guachal River Watershed. Sustainability 2025, 17, 4130. [Google Scholar] [CrossRef]
- Bonnier, A.; Finné, M.; Weiberg, E. Examining Land-Use through GIS-Based Kernel Density Estimation: A Re-Evaluation of Legacy Data from the Berbati-Limnes Survey Examining Land-Use through GIS-Based Kernel Density Estimation: A Re-Evaluation of Legacy Data from the Berbati-Limnes Survey. J. Field Archaeol. 2019, 44, 70–83. [Google Scholar] [CrossRef]
- Sánchez-Lozano, J.M.; Teruel-Solano, J.; Soto-Elvira, P.L.; García-Cascales, M.S. Geographical Information Systems (GIS) and Multi-Criteria Decision Making (MCDM) methods for the evaluation of solar farms locations: Case study in south-eastern Spain. Renew. Sustain. Energy Rev. 2013, 24, 544–556. [Google Scholar] [CrossRef]
- Šoltésová, M.; Iannaccone, B.; Štrba, Ľ.; Sidor, C. Application of GIS Technologies in Tourism Planning and Sustainable Development: A Case Study of Gelnica. ISPRS Int. J. Geo-Inf. 2025, 14, 120. [Google Scholar] [CrossRef]
- Cappelletti, M.; Saruchera, F. Sustainability: A Concept in Flux? The Role of Multidisciplinary Insights in Shaping Sustainable Futures. Sustainability 2025, 17, 326. [Google Scholar] [CrossRef]
- Xhafa, S.; Kosovrasti, A. Geographic Information Systems (GIS) in Urban Planning. Eur. J. Interdiscip. Stud. 2015, 1, 85. [Google Scholar] [CrossRef]
- Al-Kofahi, S.D.; Jamhawi, M.M.; Hajahjah, Z.A. Investigating the current status of geospatial data and urban growth indicators in Jordan and Irbid municipality: Implications for urban and environmental planning. Environ. Dev. Sustain. 2018, 20, 1067–1083. [Google Scholar] [CrossRef]
- Wang, W.; Xue, C.; Zhao, J.; Yuan, C.; Tang, J. Machine learning-based field geological mapping: A new exploration of geological survey data acquisition strategy. Ore Geol. Rev. 2024, 166, 105959. [Google Scholar] [CrossRef]
- Dritsas, E.; Trigka, M. Remote Sensing and Geospatial Analysis in the Big Data Era: A Survey. Remote Sens. 2025, 17, 550. [Google Scholar] [CrossRef]
- Nuhu, S.K.; Manan, Z.A.; Alwi, S.R.W.; Reba, M.N.M. Roles of geospatial technology in eco-industrial park site selection: State–of–the-art review. J. Clean. Prod. 2021, 309, 127361. [Google Scholar] [CrossRef]
- Oliveira, A.; Fachada, N.; Matos-Carvalho, J.P. Data Science for Geographic Information Systems. In Proceedings of the 2024 8th International Young Engineers Forum on Electrical and Computer Engineering (YEF-ECE), Caparica, Portugal, 5 July 2024; pp. 1–7. [Google Scholar] [CrossRef]
- Sisman, S.; Ergul, I.; Aydinoglu, A.C. Designing Gis-Based Site Selection Model for Urban Investment Planning in Smart Cities with the Case of Electric Vehicle Charging Stations. In Proceedings of the 6th International Conference on Smart City Applications, Safranbolu, Turkey, 27–29 October 2021; Volume 4. [Google Scholar] [CrossRef]
- Mustaffa, A.A.; Bahiah, B.; Rasib, A.W.; Saifullizan, M.B. GIS and Multi-criteria Analysis for School Site Selection (Study Case: Malacca Historical City). Int. J. Integr. Eng. 2021, 13, 234–241. [Google Scholar] [CrossRef]
- Basha, A.; Salem, A.; Mostafa, W.; Farhan, M.H. Application of GIS Models in Determining the Suitable Site for a Solid Waste to Energy Plant in an Urban Area. Civ. Eng. J. 2024, 10, 171–188. [Google Scholar] [CrossRef]
- Dehghani, A.; Soltani, A. Site Selection of Car Parking with the GIS-Based Fuzzy Multi-Criteria Decision Making. Int. J. Inf. Technol. Decis. Mak. 2023, 23, 715–740. [Google Scholar] [CrossRef]
- Prasetyo, D.H.; Mohamad, J.; Fauzi, R. A GIS-based multi-criteria decision analysis approach for public school site selection in Surabaya, Indonesia. Geomatica 2018, 72, 69–84. [Google Scholar] [CrossRef]
- Mukhopadhaya, S. GIS-based Site Suitability Analysis: Case Study for Professional College in Dehradun. J. Civ. Eng. Environ. Technol. 2016, 3, 60–64. [Google Scholar]
- Al Tamimi, N.N.M.; Al Mashrafi, O.M.S.; Thottoli, M.M. Exploring the Factors that Influence University Selection: Insights from College Students. J. Bus. Manag. Rev. 2023, 4, 439–454. [Google Scholar] [CrossRef]
- Mehedi, M.; Emon, H.; Abtahi, A.T.; Jhuma, S.A. Factors Influencing College Student’s Choice of a University in Bangladesh. Soc. Values Soc. 2023, 5, 1–3. [Google Scholar] [CrossRef]
- Lou, Y.; Azadi, H.; Witlox, F. Factors Influencing Site Selection for Higher Education Institutes: A Meta-Analysis. Land 2024, 13, 2123. [Google Scholar] [CrossRef]
- Gonçalves, A.B. Spatial analysis and geographic information systems as tools for sustainability research. Sustainability 2021, 13, 612. [Google Scholar] [CrossRef]
- Charles, A.C.; Armstrong, A.; Nnamdi, O.C.; Innocent, M.T.; Obiageri, N.J.; Begianpuye, A.F.; Timothy, E.E. Review of Spatial Analysis as a Geographic Information Management Tool. Am. J. Eng. Technol. Manag. 2024, 9, 8–20. [Google Scholar] [CrossRef]
- Kuznichenko, S.; Buchynska, I.; Kovalenko, L.; Gunchenko, Y. Suitable Site Selection Using Two-Stage GIS-Based Fuzzy Multi-criteria Decision Analysis. In Advances in Intelligent Systems and Computing IV; Springer: Berlin/Heidelberg, Germany, 2020; Volume 1080, pp. 214–230. [Google Scholar] [CrossRef]
- Sun, Z.; Liu, Y.; Sang, H.; Wang, Y. Site selection decision framework for origin-based aquatic product logistics center under ecological constraints: A case study of the Nansi Lake Region, China. Aquaculture 2025, 594, 741427. [Google Scholar] [CrossRef]
- Scheider, S.; Ballatore, A. Semantic typing of linked geoprocessing workflows. Int. J. Digit. Earth 2018, 11, 113–138. [Google Scholar] [CrossRef]
- Khazael, S.M.; Al-Bakri, M. The Optimum Site Selection for Solar Energy Farms using AHP in GIS Environment, a Case Study of Iraq. Iraqi J. Sci. 2021, 62, 4571–4587. [Google Scholar] [CrossRef]
- Nguyen, D.T.; Truong, M.H.; Phan, D.T. Gis-based simulation for solar farm site selection in south-central Vietnam. GeoJournal 2022, 87, 3685–3699. [Google Scholar] [CrossRef]
- Karna, B.K.; Shrestha, S.; Koirala, H.L. GIS based Approach for Suitability Analysis of Residential Land Use. Geogr. J. Nepal 2023, 16, 35–50. [Google Scholar] [CrossRef]
- Danese, M.; Lazzari, M.; Murgante, B. Kernel Density Estimation Methods for a Geostatistical Approach in Seismic Risk Analysis: The Case Study of Potenza Hilltop Town (Southern Italy). In Lecture Notes in Computer Science (Including Subseries Lecture Notes in Artificial Intelligence and Lecture Notes in Bioinformatics); Springer: Berlin/Heidelberg, Germany, 2008; Volume 5072, pp. 415–429. [Google Scholar] [CrossRef]
- Moussa, M.; Mostafa, Y.; Elwafa, A.A. School Site Selection Process. Procedia Environ. Sci. 2017, 37, 282–293. [Google Scholar] [CrossRef]
- Sugiarto, A.; Lee, C.W.; Huruta, A.D. A Systematic Review of the Sustainable Campus Concept. Behav. Sci. 2022, 12, 130. [Google Scholar] [CrossRef] [PubMed]
- Compagnucci, L.; Spigarelli, F. The Third Mission of the university: A systematic literature review on potentials and constraints. Technol. Forecast. Soc. Change 2020, 161, 120284. [Google Scholar] [CrossRef]
- Chupp, M.G.; Joseph, M.L. Getting the most out of service learning: Maximizing student, university and community impact. J. Community Pract. 2010, 18, 190–212. [Google Scholar] [CrossRef]
- Griffin, M.M. The Impact of Campus Health Services on the Attitudes, Perceptions, Beliefs, and Behaviors of Historically Black College and University Students. Ph.D. Thesis, Walden University, Minneapolis, MN, USA, 2019. [Google Scholar]
- Ke, H.; Junfeng, D.; Xiaojing, L. International students’ university choice to study abroad in higher education and influencing factors analysis. Front. Psychol. 2022, 13, 1036569. [Google Scholar] [CrossRef]
Disclaimer/Publisher’s Note: The statements, opinions and data contained in all publications are solely those of the individual author(s) and contributor(s) and not of MDPI and/or the editor(s). MDPI and/or the editor(s) disclaim responsibility for any injury to people or property resulting from any ideas, methods, instructions or products referred to in the content. |
© 2025 by the authors. Licensee MDPI, Basel, Switzerland. This article is an open access article distributed under the terms and conditions of the Creative Commons Attribution (CC BY) license (https://creativecommons.org/licenses/by/4.0/).