

Sustainable Supply Chain Strategies for Modular-Integrated Construction Using a Hybrid Multi-Agent–Deep Learning Approach


Abstract
1. Introduction
2. Related Works
2.1. MiC Supply-Chain Management
2.2. Sustainability Strategies in Off-Site Construction and Modular Integrated Supply Chains
2.3. Applications of Computer Simulations and Machine Learning for Carbon Footprint Evaluation in MiC
2.4. Assessment Methods for Carbon Emissions and Cost Across the Life Cycle of Buildings
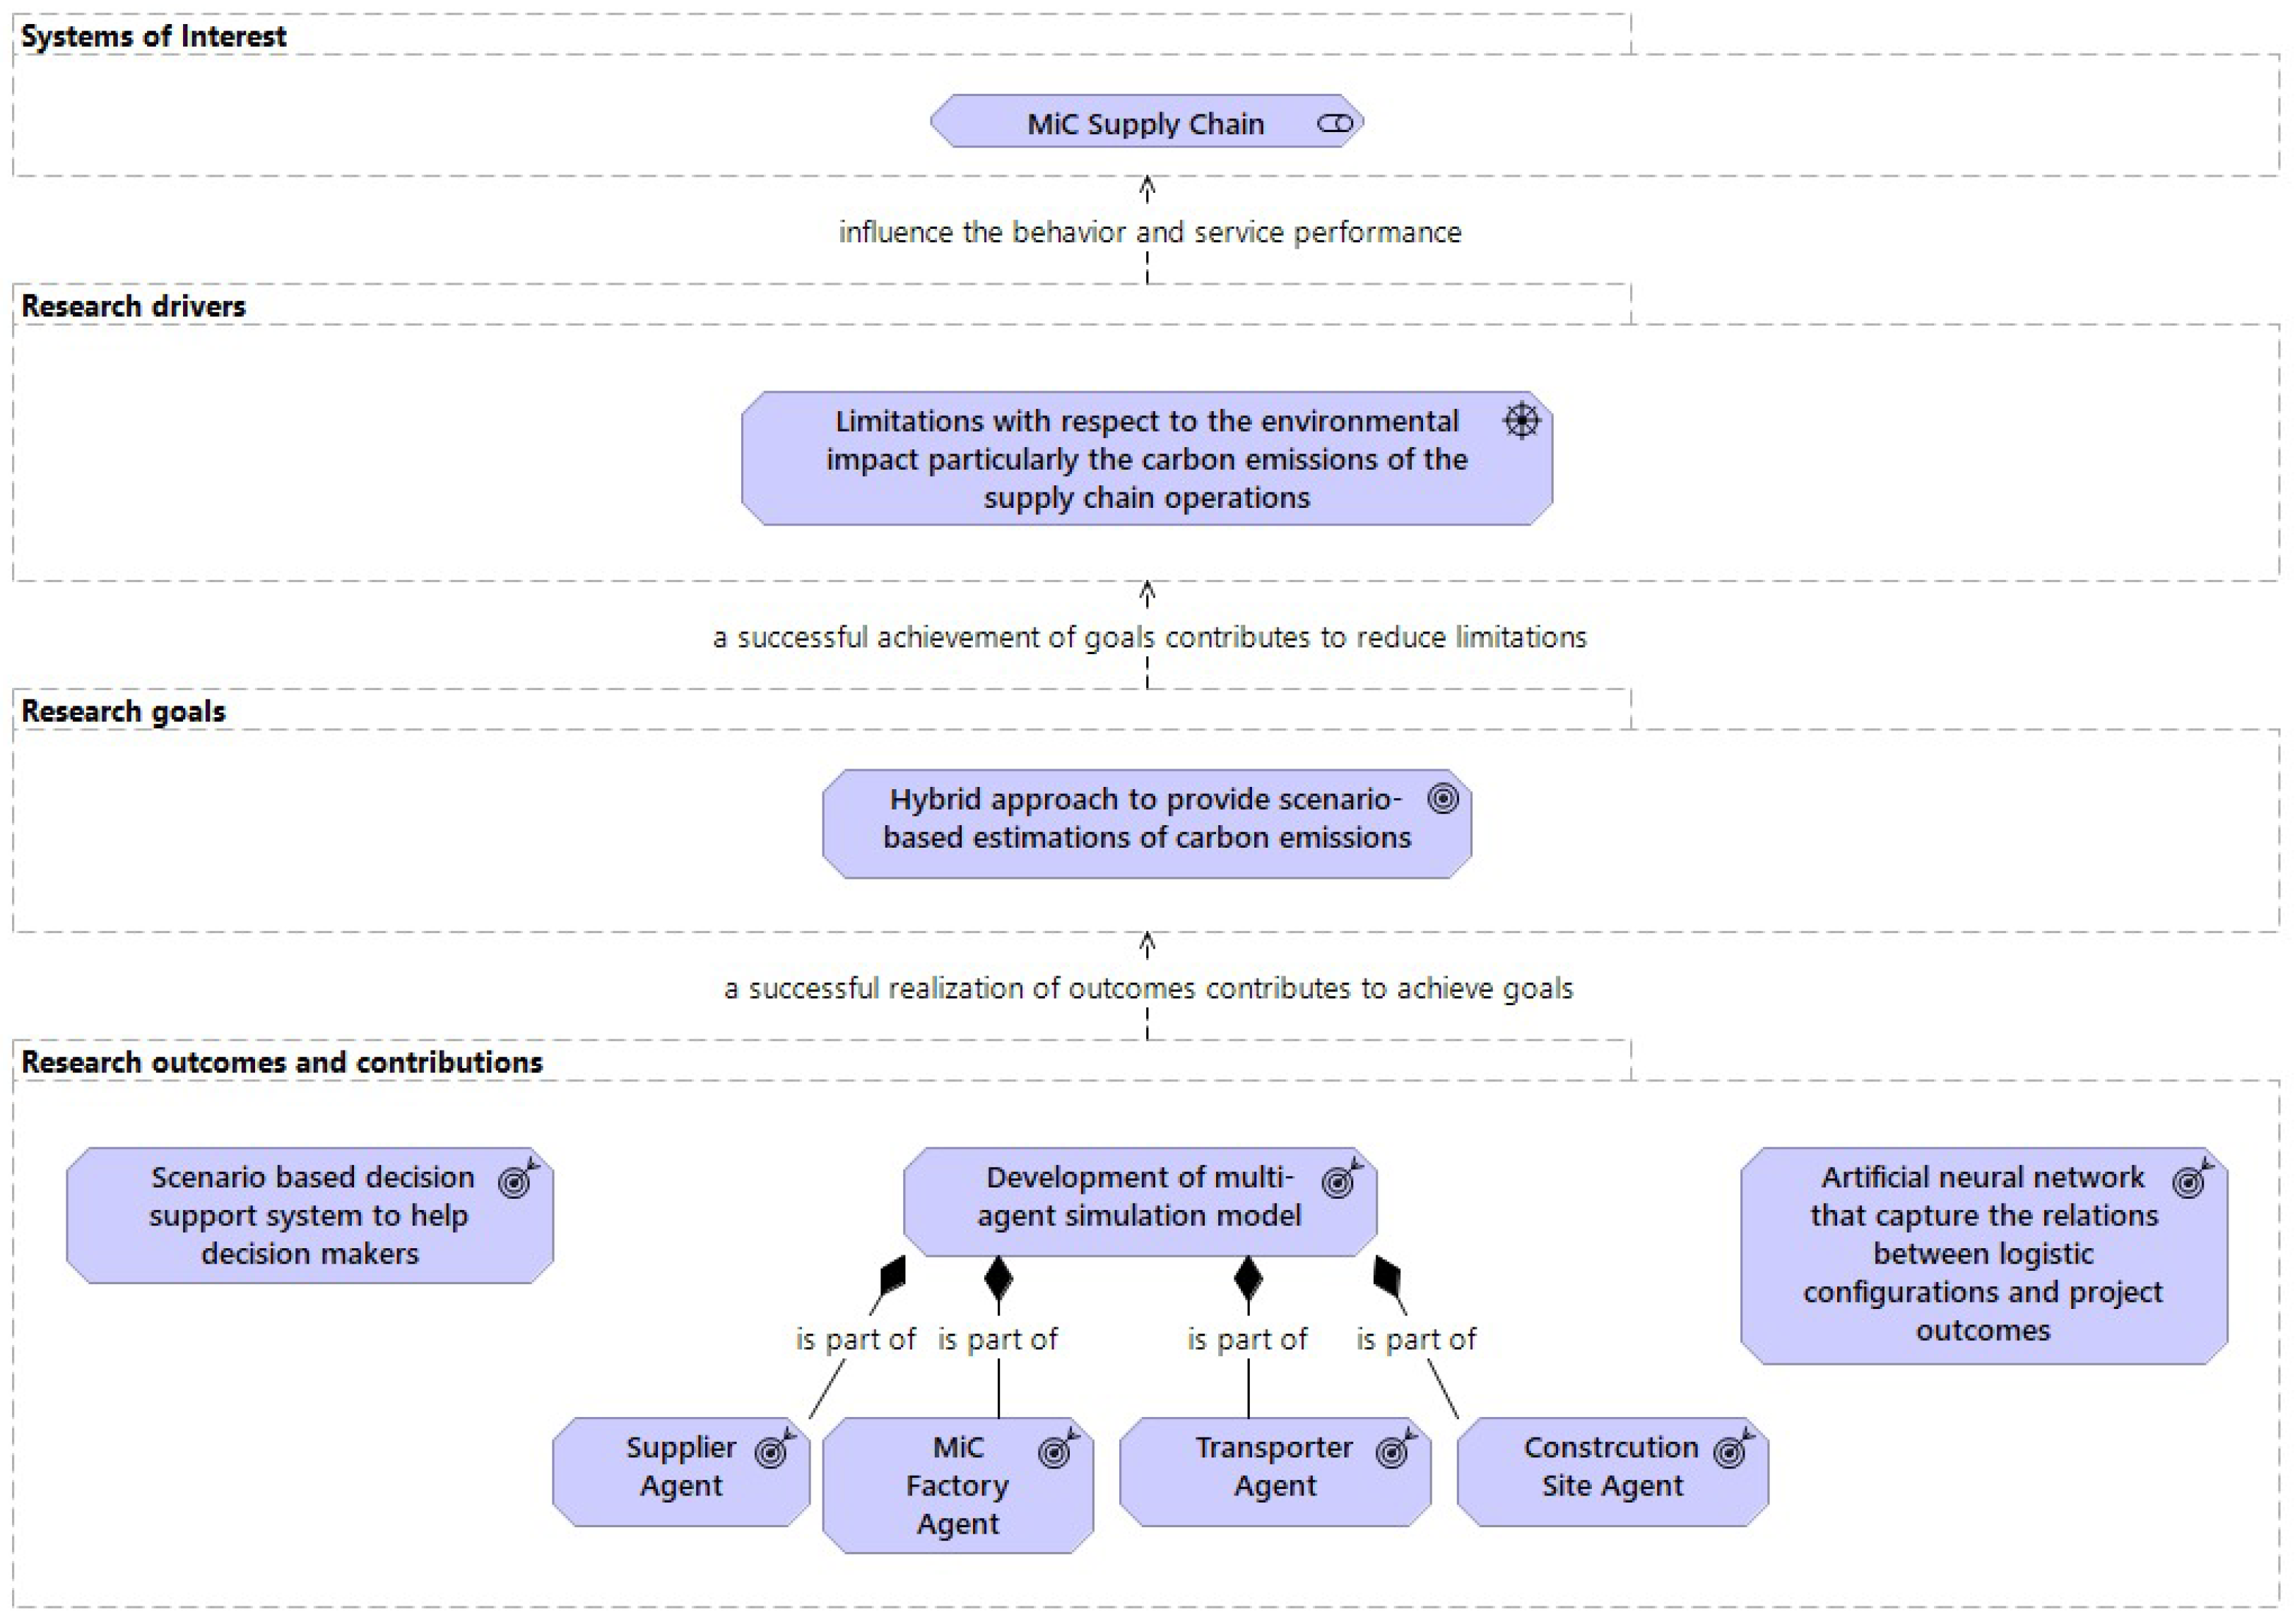
3. Proposed Agent-Based and Machine Learning Optimization Models
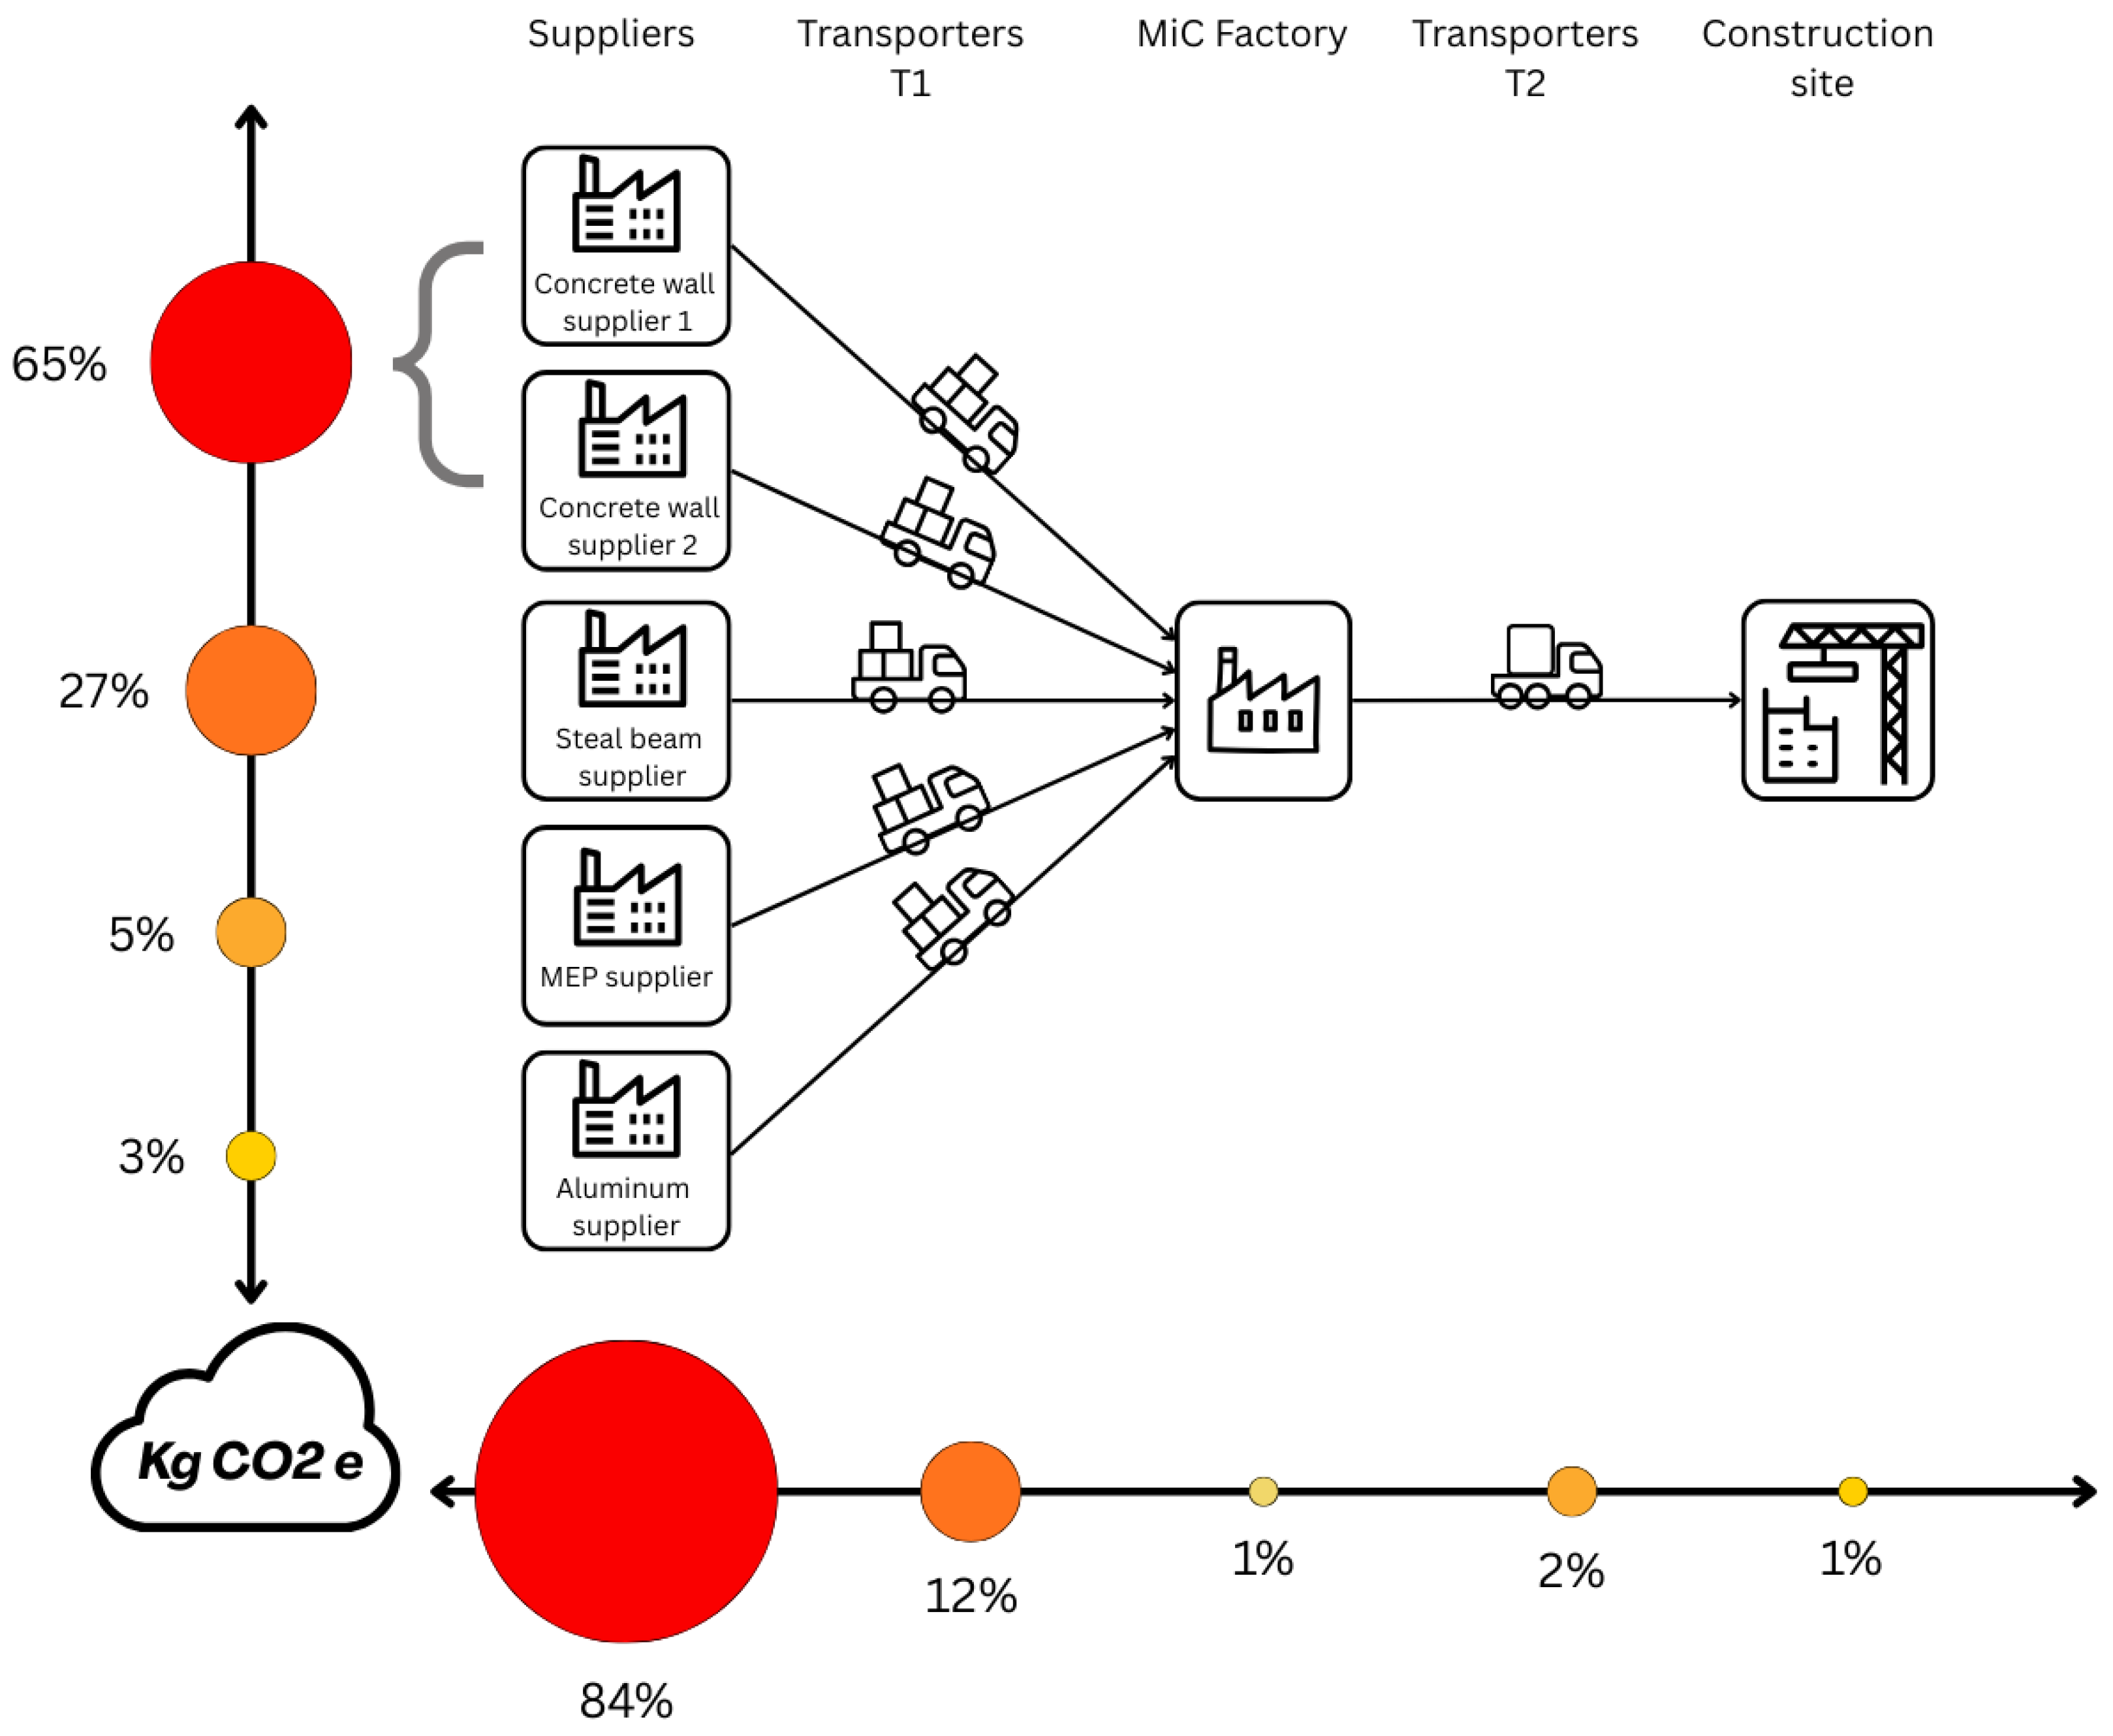
3.1. Problem Description: MiC Supply Chain
- Suppliers: Responsible for producing prefabricated components such as beams, walls, and other structural or architectural elements. These components may vary in type, including concrete, steel, aluminum, and other materials, depending on the design specifications.
- MiC Factories: Prefabricated components from various suppliers are assembled into fully integrated construction modules. These modules are equipped with structural features and also include mechanical, electrical, and plumbing systems. The goal is to produce complete, ready-to-install units that minimize the need for on-site work.
- Construction Sites: Finished modules are received and installed, often with minimal on-site assembly.
- Transporters: These actors are connected through a series of transportation activities. There are two main types of transport activities:
- –
- From suppliers to MiC factories: This stage uses specialized vehicles tailored to the specific materials being transported. For example, transporting concrete elements may require different vehicles than those used for lighter or more fragile materials like aluminum or glass.
- –
- From MiC factories to construction sites: This stage involves the movement of fully assembled modules. These modules are often large and delicate, requiring custom vehicles equipped to handle oversized and heavy loads while preventing damage during transit.
3.2. Footprint Carbon in MiC Supply Chain
- Suppliers: Suppliers are responsible for producing and delivering prefabricated components, which are often made from a variety of materials such as concrete, steel, or aluminum. Since different materials have different environmental impacts, we base the emissions for this actor primarily on the weight of the components produced. Heavier components usually require more raw materials and energy to manufacture, leading to higher emissions.The main factor used to calculate emissions at this stage is the emission factor expressed in kg per kg of material. This value represents the average amount of CO2e released for each kilogram of material produced.where:
- –
- = Supplier emissions (kg CO2e);
- –
- = Emission factor per kg of material (kg CO2e/kg);
- –
- W = Weight per component (kg);
- –
- N = Number of components.
The emission factor can vary depending on the type of material used. For instance, concrete may have a lower emission factor than steel or aluminum, but may still contribute significantly due to its higher usage and weight. - Transporters: Transporters play a vital role in moving both prefabricated components and finished modules. Emissions in this stage are influenced by the distance traveled and the weight of the transported goods.To estimate transport-related emissions, we use an emission factor expressed in kilograms of per kilogram of material transported per kilometer traveled (kg CO2e/kg · km). This reflects the emissions produced when transporting one kilogram of material over one kilometer.where:
- –
- = Transport emissions (kg CO2e);
- –
- = Emission factor per kg per km (kg CO2e/kg · km);
- –
- D = Distance traveled (km);
- –
- W = Weight carried (kg);
- –
- N = Number of modules or components.
The emission factor can vary depending on the type of transporter. For example, trucks used to transport concrete components need a higher load capacity and consume more fuel than those used to transport lighter materials. In addition, vehicles carrying completed MiC modules that are often too large and delicate require specialized equipment, which can also result in higher emissions. - MiC Factories: Emissions from MiC factories primarily result from the energy used during the module assembly process. This includes the operation of machines, lighting, heating, and other equipment. These emissions are calculated using the factory’s energy consumption measured in kilowatt-hours (kWh), multiplied by an appropriate emission factor (kg CO2e/kWh).where:
- –
- = Factory emissions (kg CO2e);
- –
- = Emission factor per kWh (kg CO2e/kWh);
- –
- P = Power consumption per module (kW);
- –
- T = Fabrication time (hours);
- –
- N = Number of modules.
- Construction Sites: While the construction site activities are relatively limited in MiC projects, there are still emissions related to on-site energy usage. These may include crane operations, minor installations, and lighting or heating during final assembly. Similar to the factory, emissions here are based on energy consumption.where:
- –
- = Site emissions (kg CO2e);
- –
- = Emission factor per kWh (kg CO2e/kWh);
- –
- P = Power consumption per module (kW);
- –
- T = Operational time (hours);
- –
- N = Number of modules.
- Total Carbon Footprint: At the end of the evaluation process, the emissions calculated for each actor in the supply chain are summed to determine the total carbon footprint of the entire MiC supply chain. This aggregated value gives a complete picture of the environmental impact from raw-material supply through final on-site installation:Here:
- –
- = Emissions from supplier i;
- –
- = Emissions from transporter k;
- –
- = Emissions from factory j;
- –
- = Emissions from construction site c;
- –
- = Number of suppliers, transporters, factories, and construction sites, respectively.
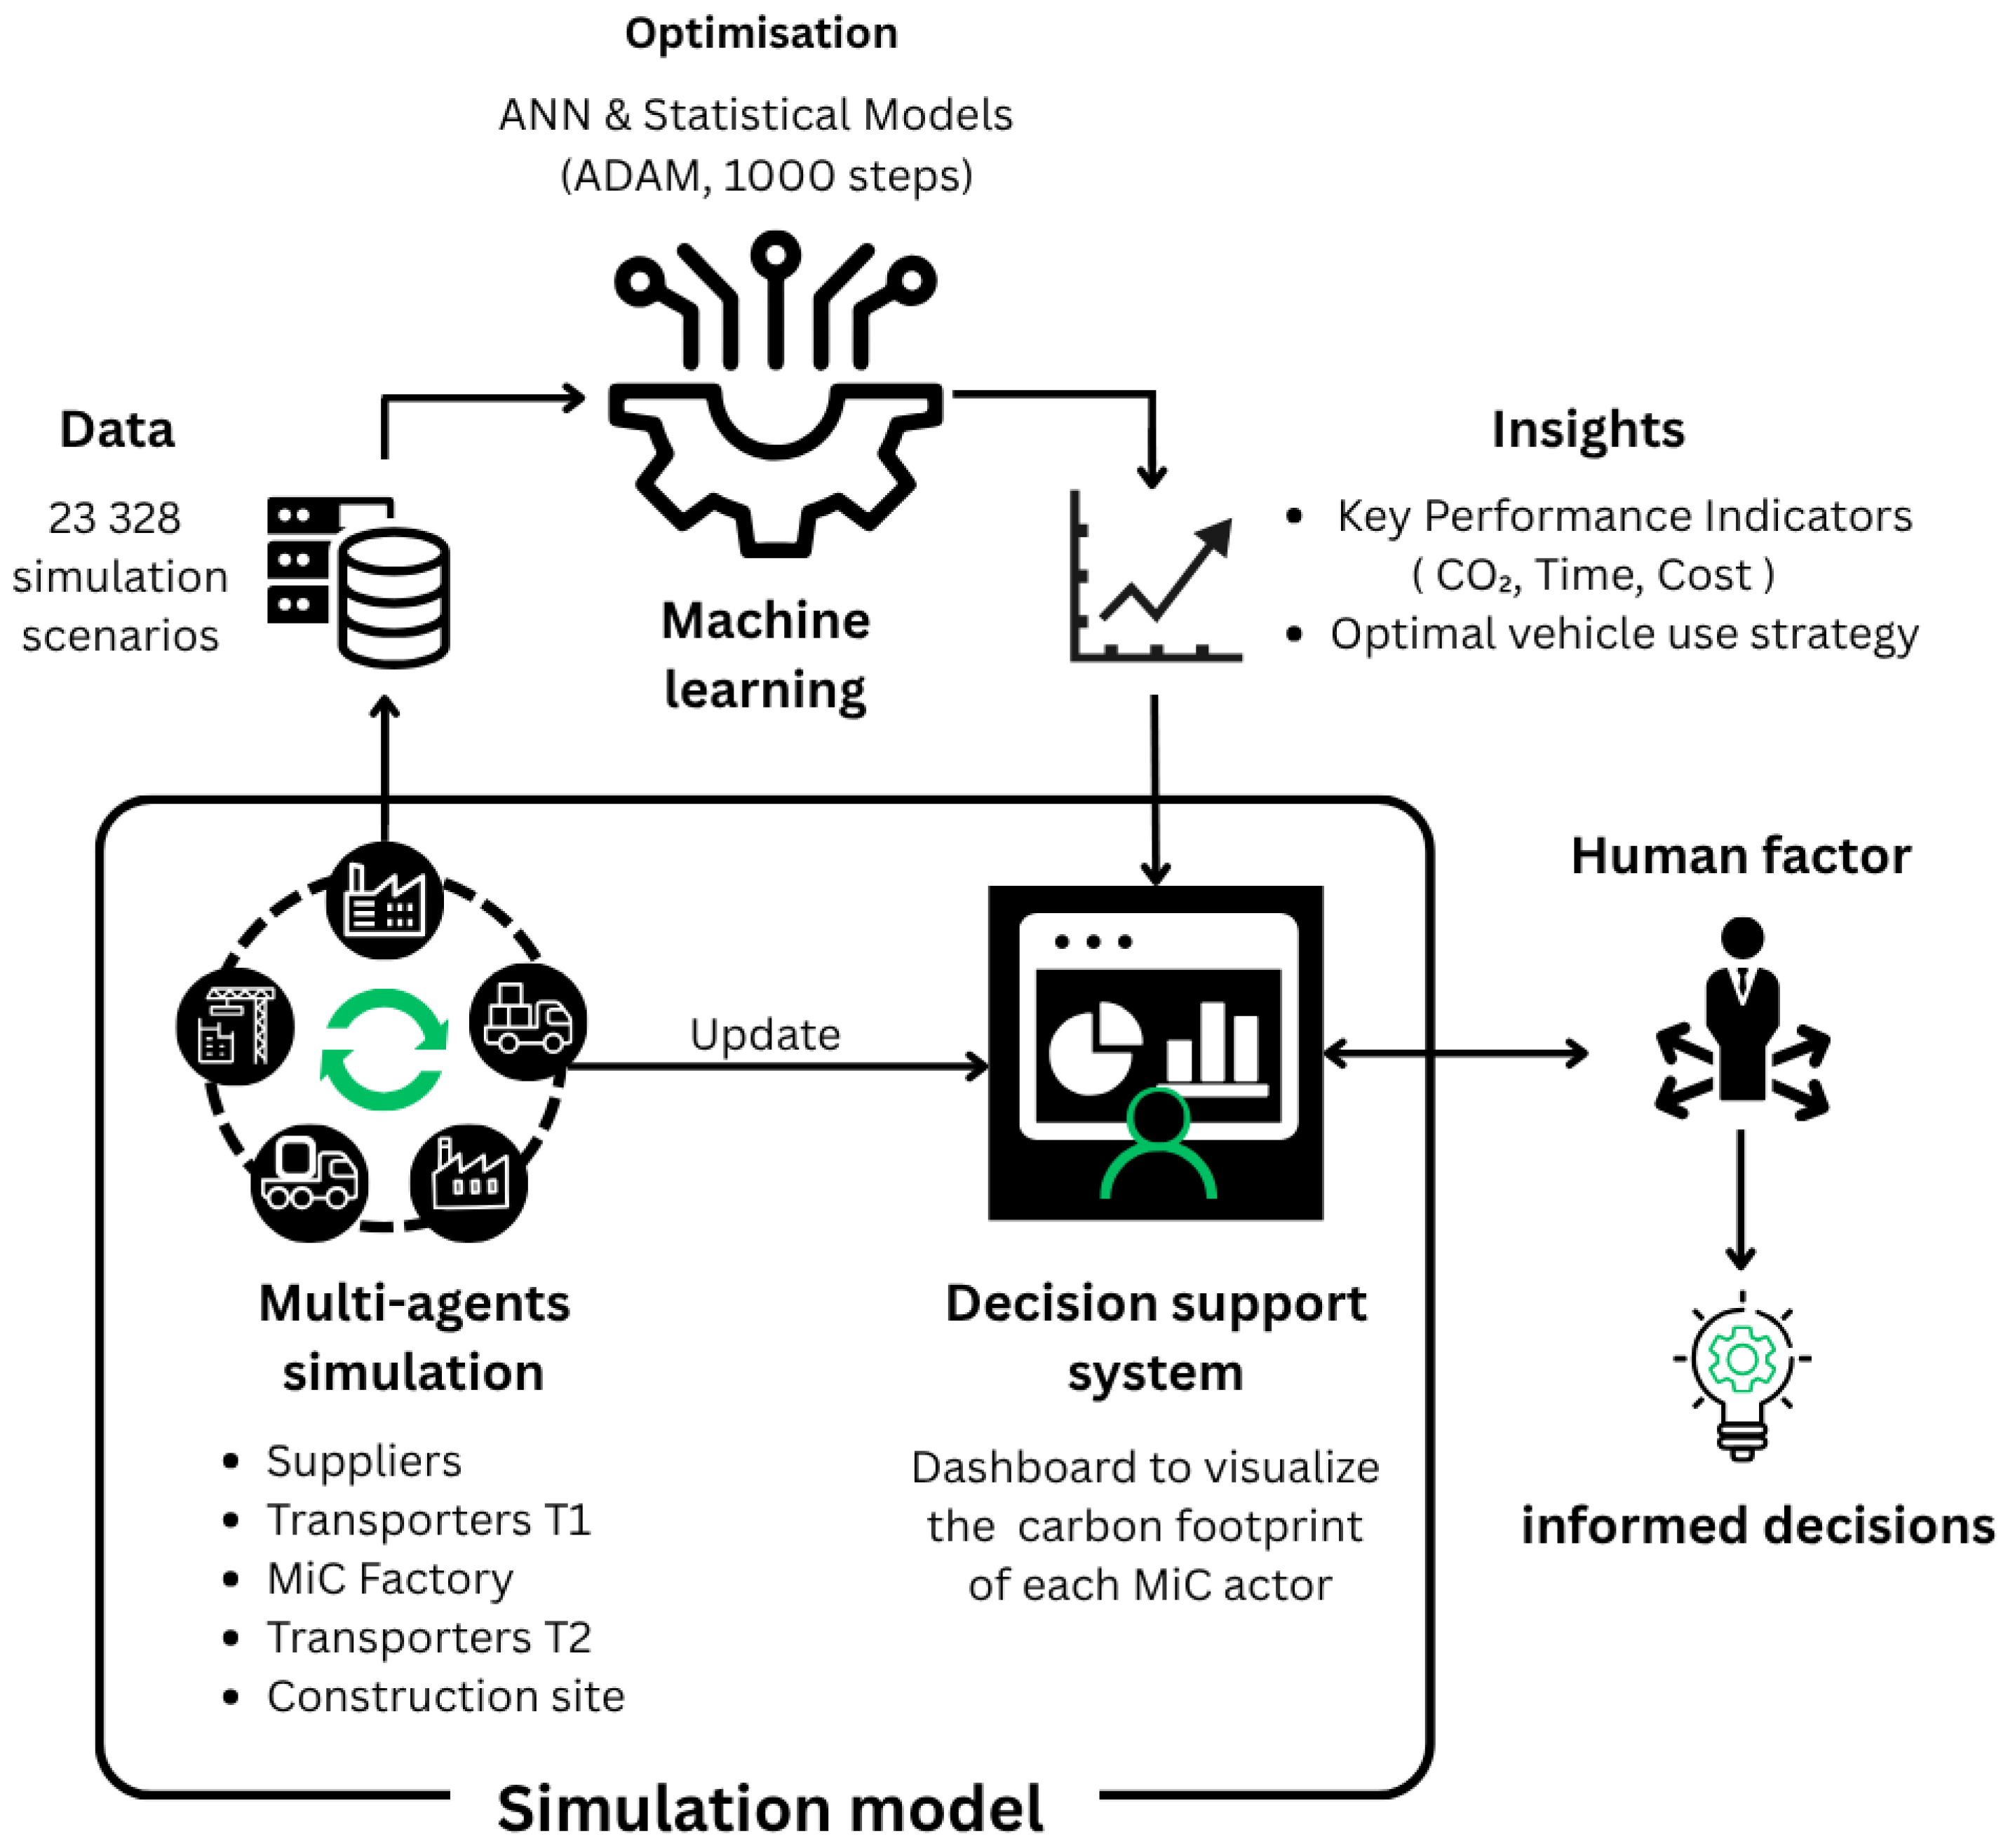
3.3. Proposed Approach
3.3.1. Modeling of Interactions Between Agents
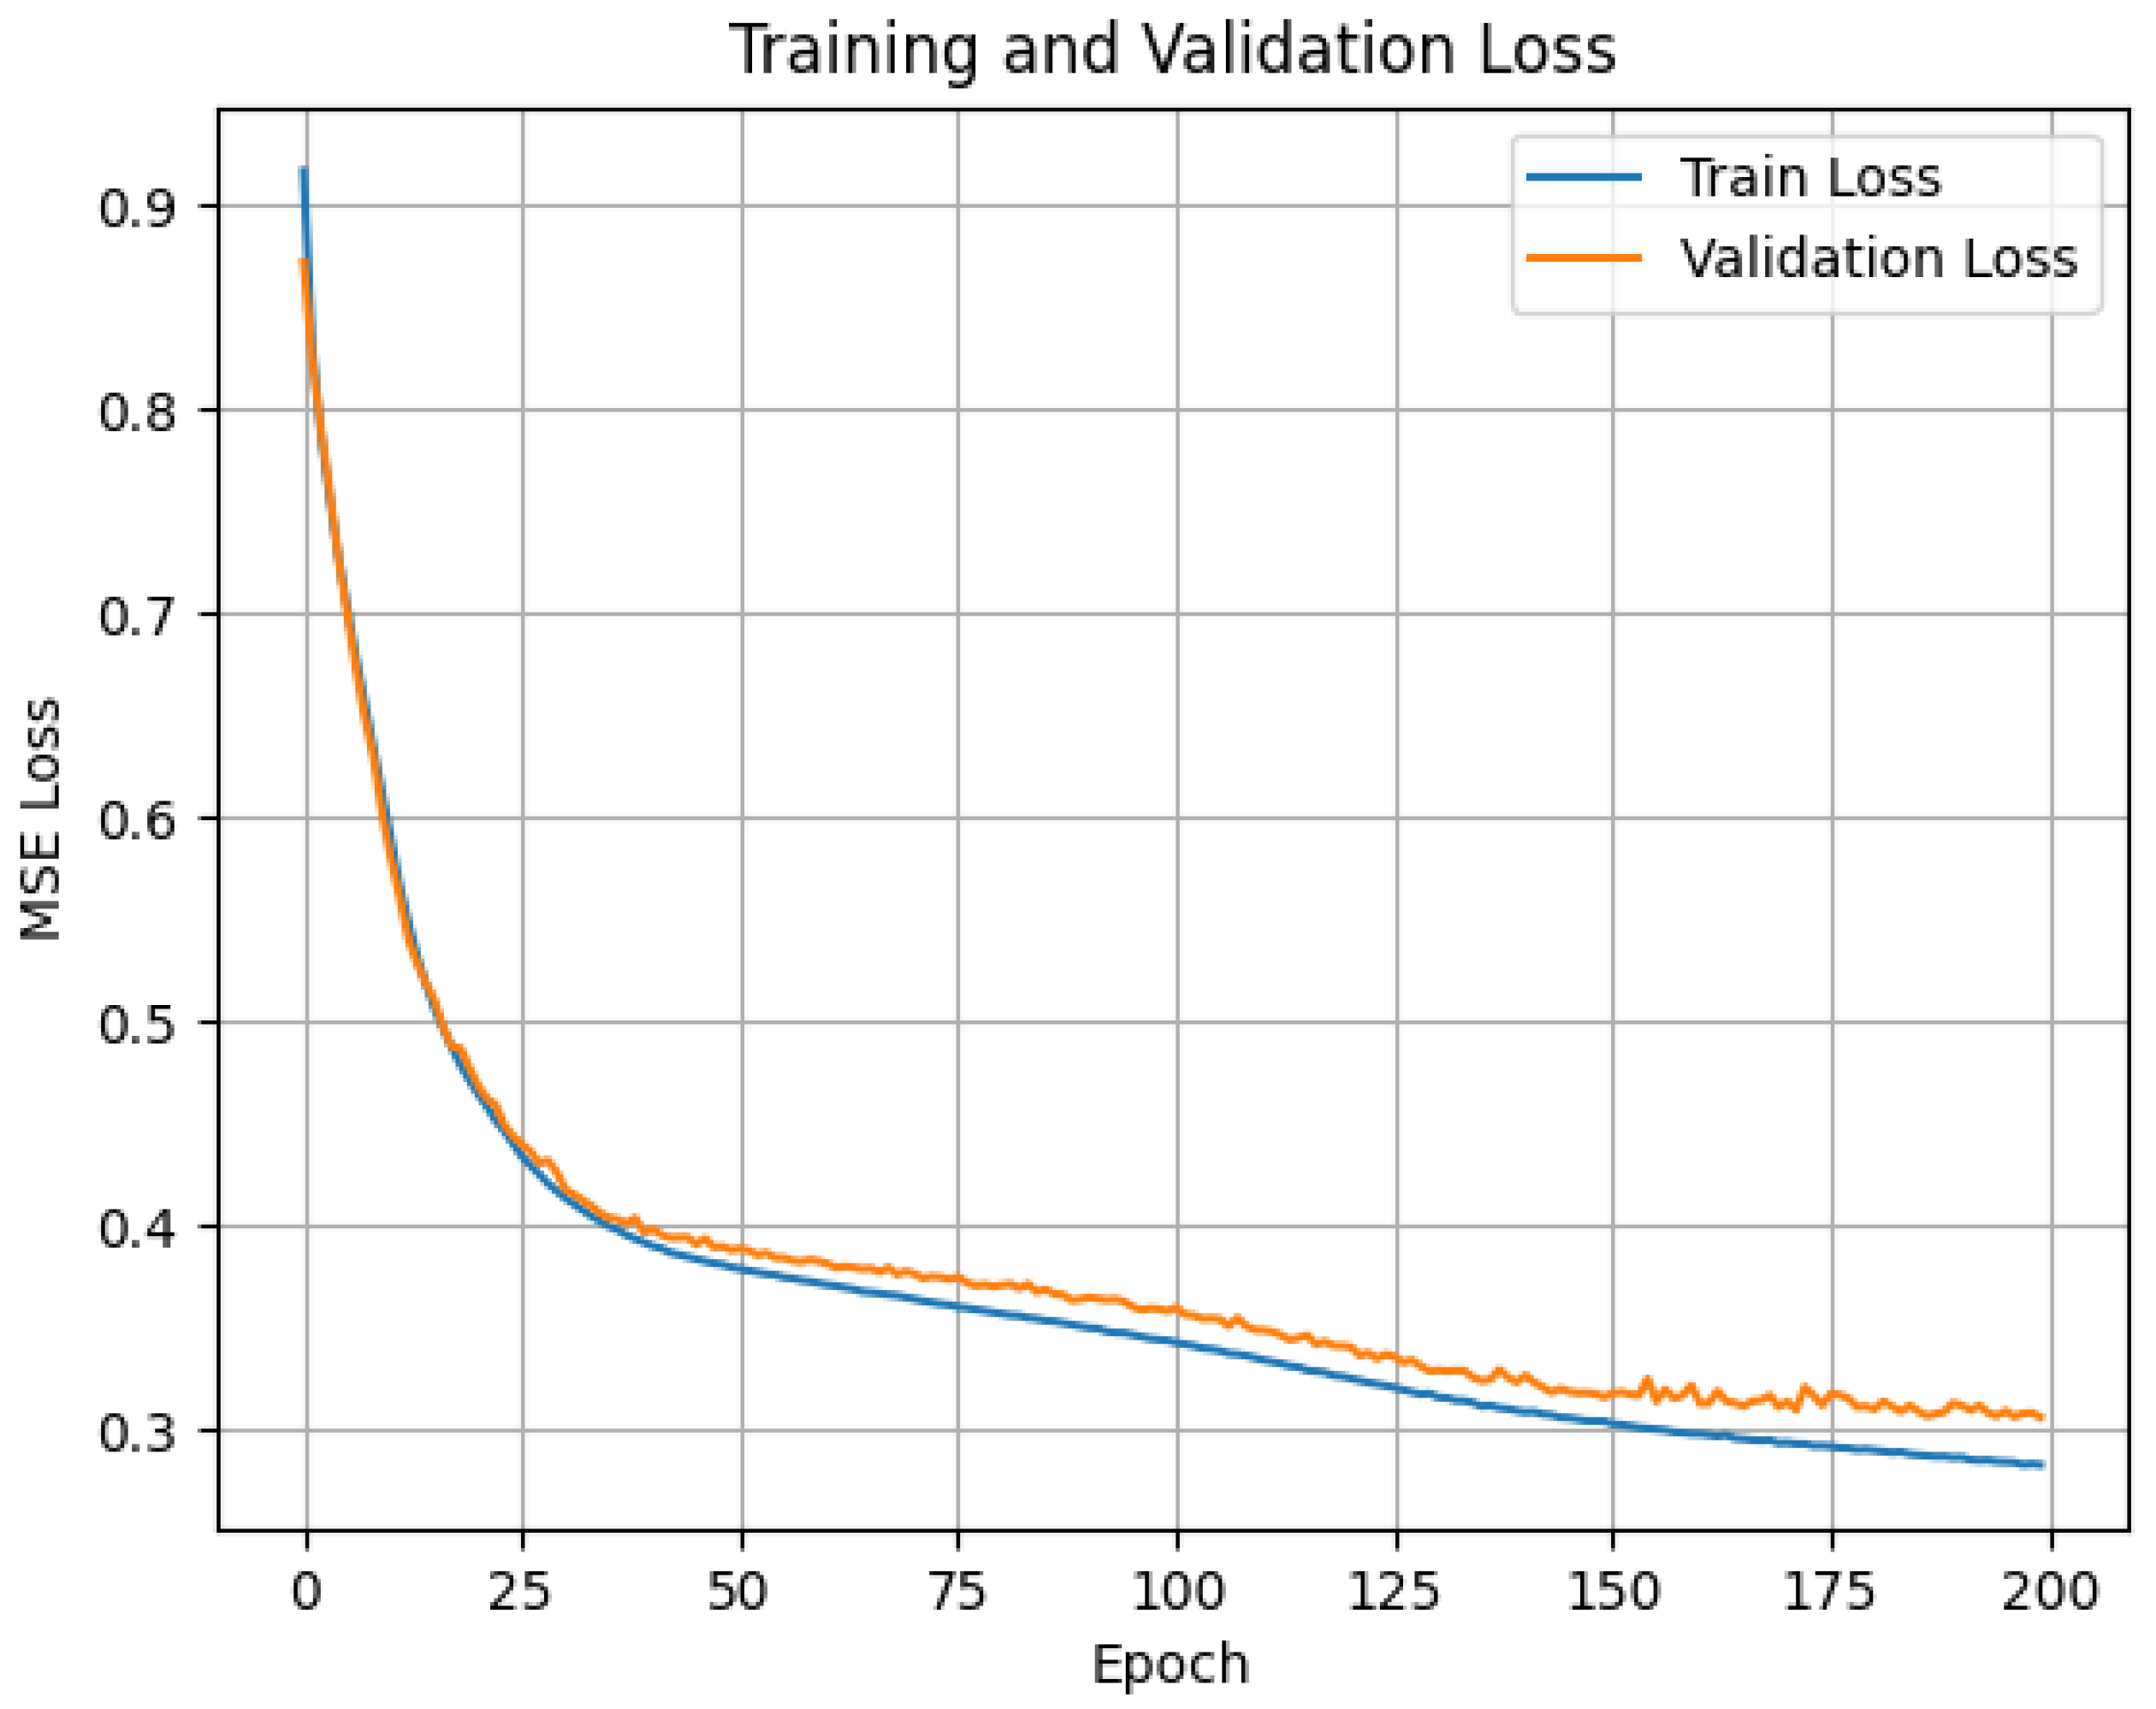
3.3.2. Machine Learning Surrogate Models for Supply Chain Optimization
- MSE for total carbon footprint (in kg CO2e): 481,689,693.30;
- MSE for completion time (in days): 20.45;
- MSE for total cost (in EUR): 529,124,195.93.
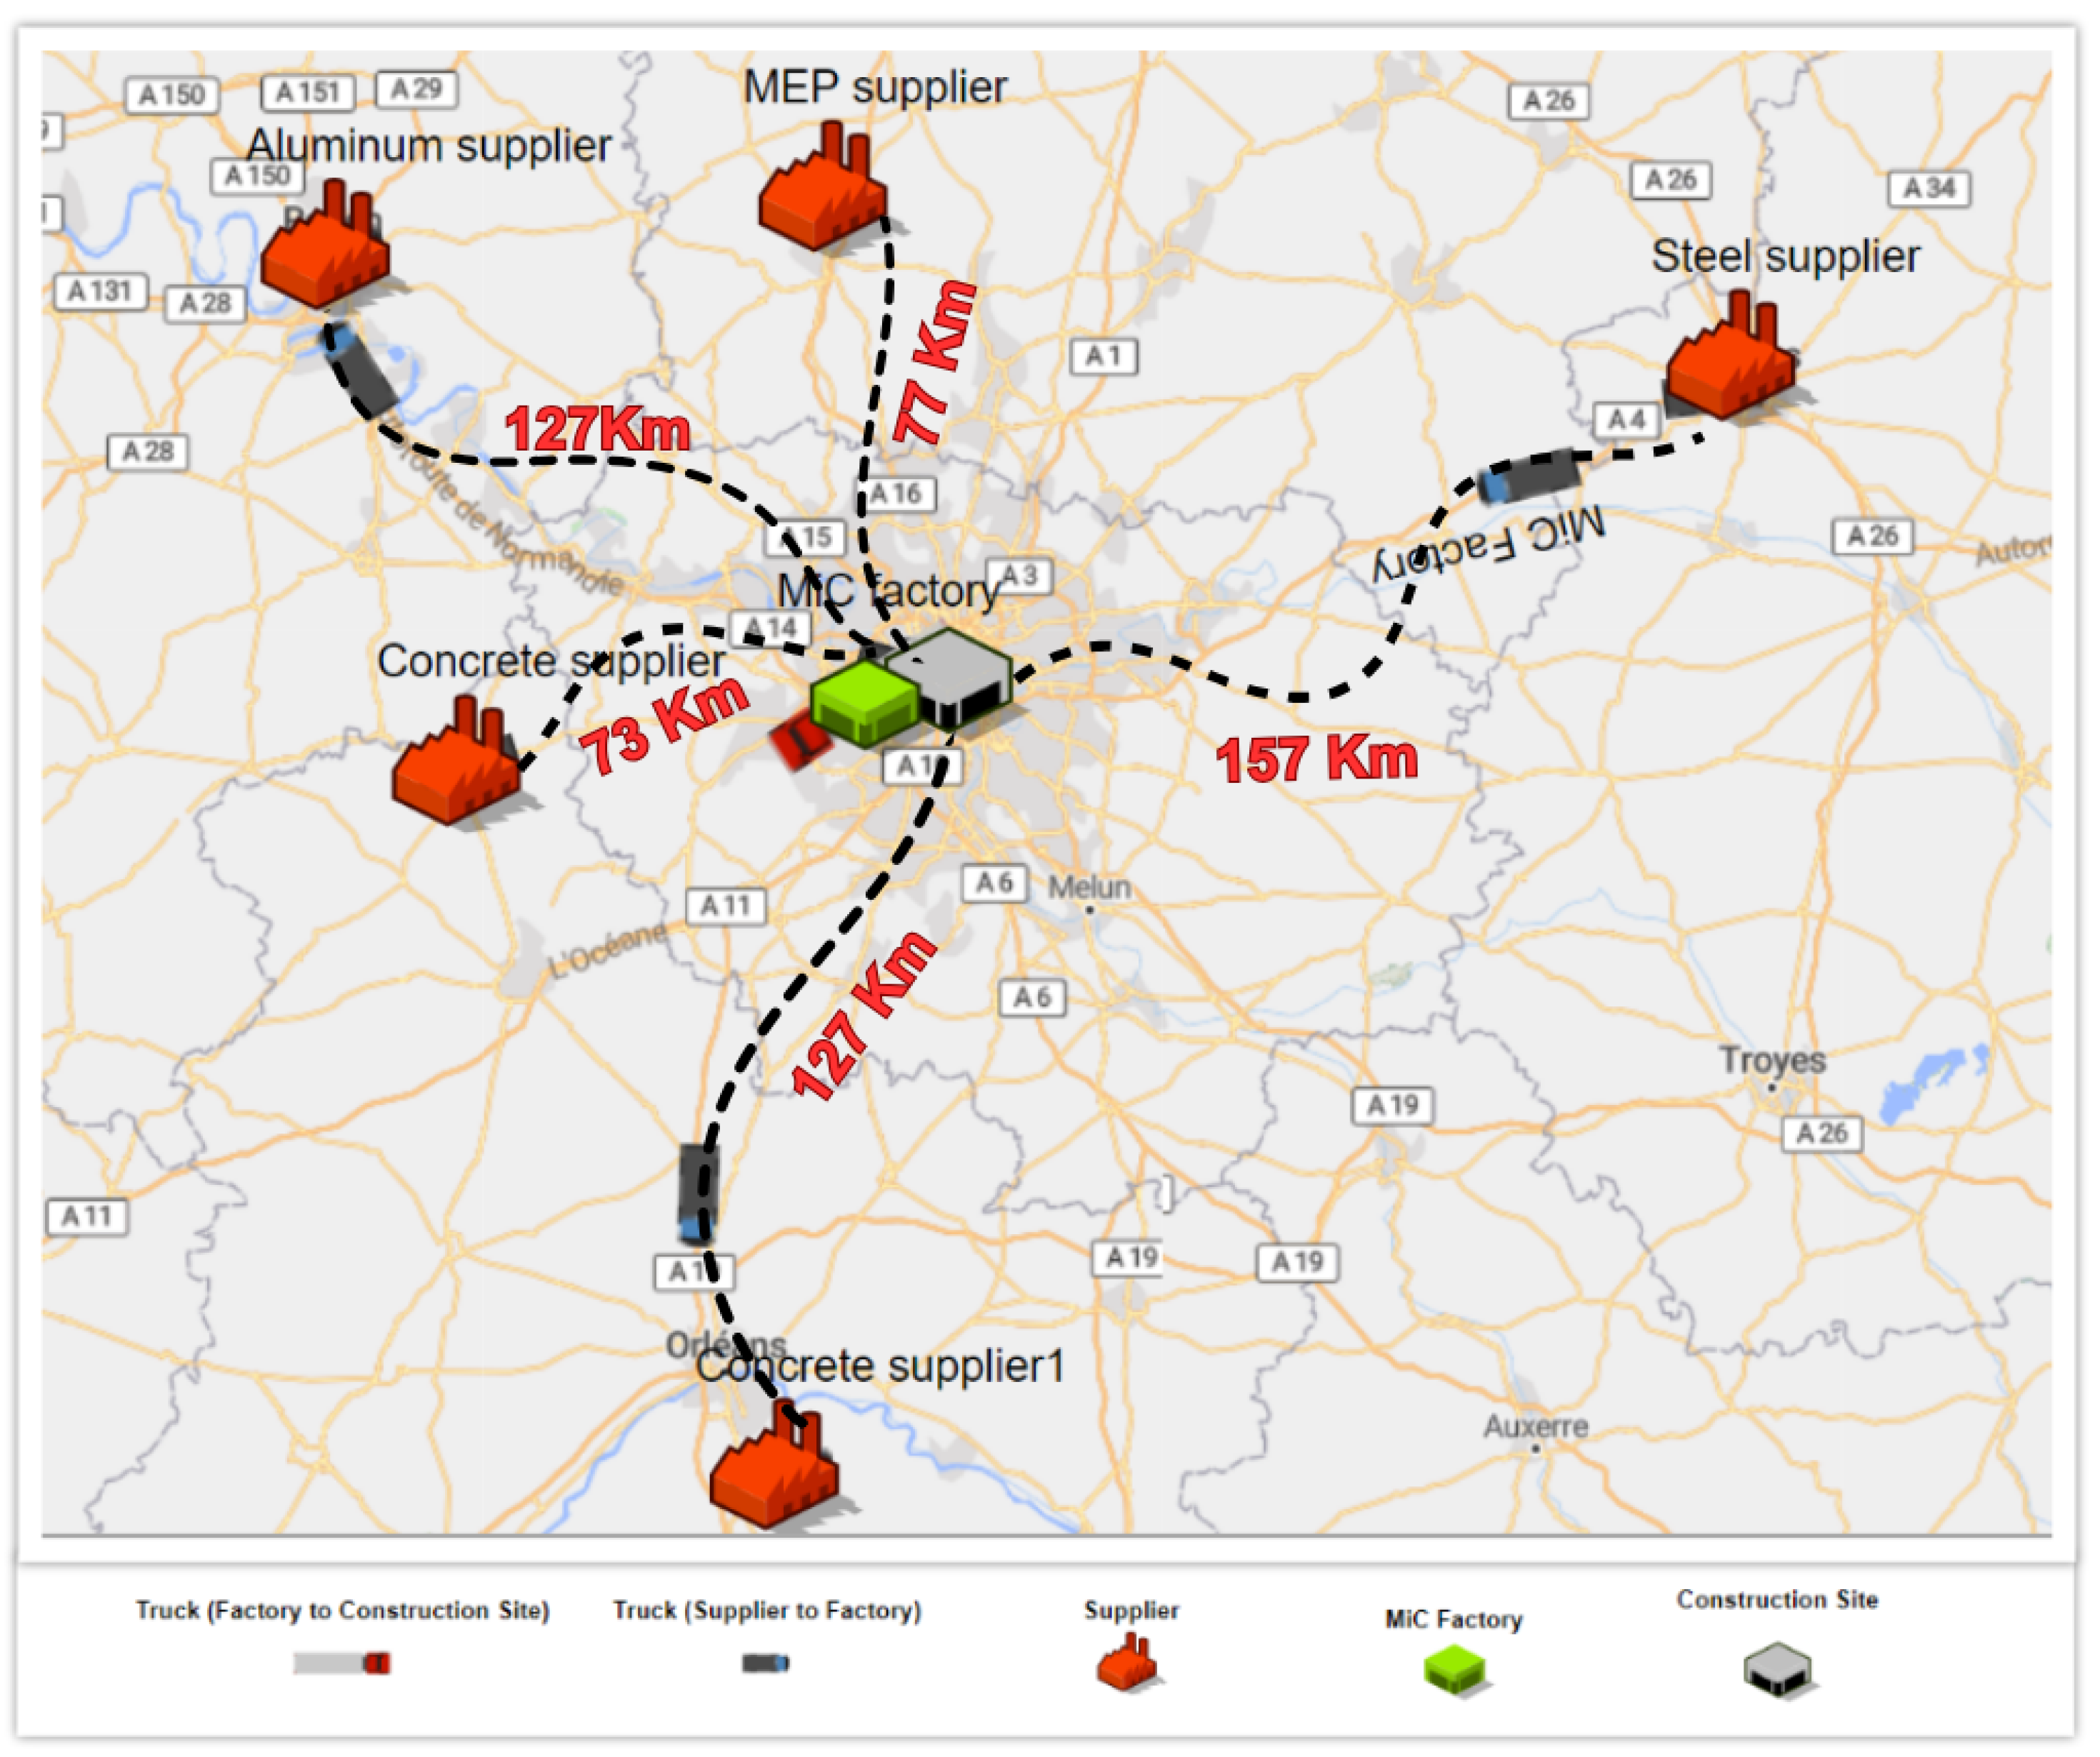
4. Case Study
4.1. Agents Description
- Construction site: Generates demand for modules based on BIM data and project schedules. It initiates requests for integrated modules.
- MiC factory: Handles the reception of orders, fabrication of integrated modules, and assignment of vehicles for delivery to construction sites.
- Suppliers: Responsible for producing and delivering prefabricated components to the MiC factory. Each supplier has parameters such as production rate, storage capacity, and vehicle availability. In our case study, we used a total of five suppliers, divided into four categories: two for concrete wall panels, one for steel beams, one for MEP components, and one for aluminum frames.
- Transporters:
- –
- T1: Transports components from suppliers to the MiC factory.
- –
- T2: Transports completed modules from the MiC factory to construction sites.
Both are managed using state charts to simulate the loading, traveling, unloading, and returning cycles.
4.2. Parameter Selection
4.3. Simulation Results
4.4. Optimal Supply Chain Strategies for Sustainable, Cost-Effective, and/or Fast Construction
4.5. Discussion
5. Conclusions and Perspectives
Author Contributions
Funding
Institutional Review Board Statement
Informed Consent Statement
Data Availability Statement
Conflicts of Interest
Abbreviations
| CSC | Construction Supply Chain |
| OSC | Off-Site Construction |
| PC | Prefabricated Components |
| MC | Modular Construction |
| MiC | Modular integrated Construction |
| MAS | Multi-Agent Simulation |
| ABM | Agent-Based Modeling |
| OSM | OpenStreetMap |
| BIM | Building Information Modeling |
| MEP | Mechanical-Electrical-Plumbing |
Appendix A. Optimal Vehicle Allocation Strategies Predicted by Statistical Learning Algorithms

| Strategy | Carbon Footprint (kg CO2e) | Project Time (Days) | Total Cost (EUR) | |||
|---|---|---|---|---|---|---|
| 1.00 | 0.00 | 0.00 | [1, 6, 1, 2, 1, 3] | 3,784,115.73 | 294.06 | 2,443,178.13 |
| 0.00 | 1.00 | 0.00 | [3, 5, 5, 6, 5, 3] | 3,798,058.77 | 77.22 | 2,015,068.14 |
| 0.00 | 0.00 | 1.00 | [3, 5, 3, 5, 4, 1] | 3,783,287.56 | 88.18 | 1,951,318.48 |
| 0.33 | 0.33 | 0.34 | [3, 5, 3, 3, 4, 1] | 3,787,855.40 | 94.04 | 1,967,158.35 |
| 0.50 | 0.50 | 0.00 | [5, 1, 6, 6, 6, 3] | 3,758,459.58 | 252.42 | 2,836,372.95 |
| 0.50 | 0.00 | 0.50 | [3, 6, 5, 5, 2, 1] | 3,783,672.58 | 126.26 | 2,117,662.12 |
| 0.00 | 0.50 | 0.50 | [3, 5, 5, 3, 4, 1] | 3,781,124.36 | 81.88 | 1,955,009.28 |
| Strategy | Carbon Footprint (kg CO2e) | Project Time (Days) | Total Cost (EUR) | |||
|---|---|---|---|---|---|---|
| 1.00 | 0.00 | 0.00 | [1, 6, 1, 2, 1, 3] | 3,770,827.21 | 292.37 | 2,450,530.52 |
| 0.00 | 1.00 | 0.00 | [3, 5, 5, 6, 5, 3] | 3,796,971.18 | 80.83 | 2,036,033.15 |
| 0.00 | 0.00 | 1.00 | [3, 5, 3, 5, 4, 1] | 3,785,973.25 | 86.90 | 1,950,204.44 |
| 0.33 | 0.33 | 0.34 | [3, 5, 3, 3, 4, 1] | 3,781,343.71 | 97.63 | 1,975,610.88 |
| 0.50 | 0.50 | 0.00 | [5, 1, 6, 6, 6, 3] | 3,804,725.82 | 260.12 | 2,809,141.08 |
| 0.50 | 0.00 | 0.50 | [3, 6, 5, 5, 2, 1] | 3,793,755.45 | 126.32 | 2,120,010.58 |
| 0.00 | 0.50 | 0.50 | [3, 5, 5, 3, 4, 1] | 3,780,677.81 | 80.85 | 1,959,081.14 |
| Strategy | Carbon Footprint (kg CO2e) | Project Time (Days) | Total Cost (EUR) | |||
|---|---|---|---|---|---|---|
| 1.00 | 0.00 | 0.00 | [1, 6, 1, 2, 1, 3] | 3,798,056.88 | 292.93 | 2,529,926.56 |
| 0.00 | 1.00 | 0.00 | [3, 5, 5, 6, 5, 3] | 3,794,873.51 | 93.73 | 2,128,785.70 |
| 0.00 | 0.00 | 1.00 | [3, 5, 3, 5, 4, 1] | 3,785,240.99 | 96.61 | 2,065,890.33 |
| 0.33 | 0.33 | 0.34 | [3, 5, 3, 3, 4, 1] | 3,786,759.29 | 104.25 | 2,067,947.50 |
| 0.50 | 0.50 | 0.00 | [5, 1, 6, 6, 6, 3] | 3,789,078.95 | 246.00 | 2,677,288.01 |
| 0.50 | 0.00 | 0.50 | [3, 6, 5, 5, 2, 1] | 3,788,573.06 | 123.99 | 2,117,511.81 |
| 0.00 | 0.50 | 0.50 | [3, 5, 5, 3, 4, 1] | 3,788,060.45 | 93.73 | 2,089,791.47 |
| Strategy | Carbon Footprint (kg CO2e) | Project Time (Days) | Total Cost (EUR) | |||
|---|---|---|---|---|---|---|
| 1.00 | 0.00 | 0.00 | [1, 6, 1, 2, 1, 3] | 3,766,735.25 | 292.47 | 2,437,129.75 |
| 0.00 | 1.00 | 0.00 | [3, 5, 5, 6, 5, 3] | 3,798,643.75 | 80.86 | 2,037,618.13 |
| 0.00 | 0.00 | 1.00 | [3, 5, 3, 5, 4, 1] | 3,789,310.50 | 86.95 | 1,951,549.75 |
| 0.33 | 0.33 | 0.34 | [3, 5, 3, 3, 4, 1] | 3,785,677.75 | 97.54 | 1,973,190.88 |
| 0.50 | 0.50 | 0.00 | [5, 1, 6, 6, 6, 3] | 3,791,028.25 | 260.17 | 2,851,382.00 |
| 0.50 | 0.00 | 0.50 | [3, 6, 5, 5, 2, 1] | 3,789,575.25 | 126.36 | 2,120,164.75 |
| 0.00 | 0.50 | 0.50 | [3, 5, 5, 3, 4, 1] | 3,788,197.75 | 80.77 | 1,956,994.50 |
References
- Olasolo-Alonso, P.; López-Ochoa, L.M.; Las-Heras-Casas, J.; López-González, L.M. Energy Performance of Buildings Directive implementation in Southern European countries: A review. Energy Build. 2023, 281, 112751. [Google Scholar] [CrossRef]
- International Energy Agency (IEA). Global Status Report for Buildings and Construction 2019; IEA: Paris, France, 2019; Available online: https://www.iea.org/reports/global-status-report-for-buildings-and-construction-2019 (accessed on 5 April 2025).
- Davis, S.J.; Liu, Z.; Deng, Z.; Zhu, B.; Ke, P.; Sun, T.; Guo, R.; Hong, C.; Zheng, B.; Wang, Y.; et al. Emissions rebound from the COVID-19 pandemic. Nat. Clim. Change 2022, 12, 412–414. [Google Scholar] [CrossRef]
- United Nations Environment Programme; International Energy Agency. 2019 Global Status Report for Buildings and Construction: Towards a Zero-Emissions, Efficient and Resilient Buildings and Construction Sector; UNEP and IEA Reports; United Nations Environment Programme, International Energy Agency: Paris, France, 2019; Available online: https://wedocs.unep.org/20.500.11822/30950 (accessed on 5 April 2025).
- Diesendorf, M. Scenarios for mitigating CO2 emissions from energy supply in the absence of CO2 removal. Clim. Policy 2022, 22, 882–896. [Google Scholar] [CrossRef]
- United Nations Environment Programme.; Global Alliance for Buildings and Construction. Global Status Report for Buildings and Construction—Beyond Foundations: Mainstreaming Sustainable Solutions to Cut Emissions from the Buildings Sector; UNEP and GlobalABC Reports; United Nations Environment Programme, Global Alliance for Buildings and Construction: Paris, France, 2024. [Google Scholar] [CrossRef]
- Andrew, R.M. Global CO2 emissions from cement production 1928–2017. Earth Syst. Sci. Data 2018, 10, 2213–2239. [Google Scholar] [CrossRef]
- Singh, K.; Meena, R.S.; Kumar, S.; Dhyani, S.; Sheoran, S.; Singh, H.M.; Pathak, V.V.; Khalid, Z.; Singh, A.; Chopra, K.; et al. India’s renewable energy research and policies to phase down coal: Success after Paris agreement and possibilities post-Glasgow Climate Pact. Biomass Bioenergy 2023, 177, 106944. [Google Scholar] [CrossRef]
- Yang, Y.; Wang, H.; Zhou, P. The CO2 emission effects of global supply chain geographic restructuring on emerging economies. Energy Econ. 2025, 143, 108255. [Google Scholar] [CrossRef]
- Karakosta, C.; Papathanasiou, J. Decarbonizing the Construction Sector: Strategies and Pathways for Greenhouse Gas Emissions Reduction. Energies 2025, 18, 1285. [Google Scholar] [CrossRef]
- Khedr, A.M.; Rani, S. Enhancing supply chain management with deep learning and machine learning techniques: A review. J. Open Innov. Technol. Mark. Complex. 2024, 10, 100379. [Google Scholar] [CrossRef]
- Su, S.; Zang, Z.; Yuan, J.; Pan, X.; Shan, M. Considering critical building materials for embodied carbon emissions in buildings: A machine learning-based prediction model and tool. Case Stud. Constr. Mater. 2024, 20, e02887. [Google Scholar] [CrossRef]
- Wang, H.; Wang, Y.; Zhao, L.; Wang, W.; Luo, Z.; Wang, Z.; Luo, J.; Lv, Y. Integrating BIM and machine learning to predict carbon emissions under foundation materialization stage: Case study of China’s 35 public buildings. Front. Archit. Res. 2024, 13, 876–894. [Google Scholar] [CrossRef]
- Xu, L.; Mak, S.; Minaricova, M.; Brintrup, A. On implementing autonomous supply chains: A multi-agent system approach. Comput. Ind. 2024, 161, 104120. [Google Scholar] [CrossRef]
- Xiang, L.; Tan, Y.; Shen, G.; Jin, X. Applications of multi-agent systems from the perspective of construction management: A literature review. Eng. Constr. Archit. Manag. 2022, 29, 3288–3310. [Google Scholar] [CrossRef]
- Zhou, T.; Tang, D.; Zhu, H.; Zhang, Z. Multi-agent reinforcement learning for online scheduling in smart factories. Robot. Comput.-Integr. Manuf. 2021, 72, 102202. [Google Scholar] [CrossRef]
- Hussein, M.; Karam, A.; Eltoukhy, A.E.; Darko, A.; Zayed, T. Optimized multimodal logistics planning of modular integrated construction using hybrid multi-agent and metamodeling. Autom. Constr. 2023, 145, 104637. [Google Scholar] [CrossRef]
- Hou, L.; Tan, Y.; Luo, W.; Xu, S.; Mao, C.; Moon, S. Towards a more extensive application of off-site construction: A technological review. Int. J. Constr. Manag. 2022, 22, 2154–2165. [Google Scholar] [CrossRef]
- Lawson, M.; Ogden, R.; Goodier, C.I. Design in Modular Construction; CRC Press: Boca Raton, FL, USA, 2014; Volume 476. [Google Scholar] [CrossRef]
- Gardan, J.; Hedjazi, L.; Attajer, A. Additive manufacturing in construction: State of the art and emerging trends in civil engineering. J. Inf. Technol. Constr. (ITcon) 2025, 30, 92–112. [Google Scholar] [CrossRef]
- Hussein, M.; Eltoukhy, A.E.; Karam, A.; Shaban, I.A.; Zayed, T. Modelling in off-site construction supply chain management: A review and future directions for sustainable modular integrated construction. J. Clean. Prod. 2021, 310, 127503. [Google Scholar] [CrossRef]
- Liao, L.; Yang, C.; Quan, L. Construction supply chain management: A systematic literature review and future development. J. Clean. Prod. 2023, 382, 135230. [Google Scholar] [CrossRef]
- Attajer, A.; Mecheri, B. Framework for Modeling the Propagation of Disturbances in Smart Construction Sites. In Proceedings of the 21st International Conference on Smart Business Technologies, Dijon, France, 9–11 July 2024; pp. 80–87. [Google Scholar] [CrossRef]
- Attajer, A.; Chaabane, S.; Darmoul, S.; Sallez, Y.; Riane, F. Evaluation of Operational Resilience in Cyber-Physical Production Systems: Literature review. IFAC-PapersOnLine 2022, 55, 2264–2269. [Google Scholar] [CrossRef]
- Chen, Z.; Hammad, A.W. Mathematical modelling and simulation in construction supply chain management. Autom. Constr. 2023, 156, 105147. [Google Scholar] [CrossRef]
- Ghaffarianhoseini, A.; Tookey, J.; Ghaffarianhoseini, A.; Naismith, N.; Azhar, S.; Efimova, O.; Raahemifar, K. Building Information Modelling (BIM) uptake: Clear benefits, understanding its implementation, risks and challenges. Renew. Sustain. Energy Rev. 2017, 75, 1046–1053. [Google Scholar] [CrossRef]
- Attajer, A.; Darmoul, S.; Chaabane, S.; Sallez, Y.; Riane, F. An analytic hierarchy process augmented with expert rules for product driven control in cyber-physical manufacturing systems. Comput. Ind. 2022, 143, 103742. [Google Scholar] [CrossRef]
- Eneyew, D.D.; Capretz, M.A.; Bitsuamlak, G.T. Toward smart-building digital twins: BIM and IoT data integration. IEEE Access 2022, 10, 130487–130506. [Google Scholar] [CrossRef]
- Zhai, Y.; Chen, K.; Zhou, J.X.; Cao, J.; Lyu, Z.; Jin, X.; Shen, G.Q.; Lu, W.; Huang, G.Q. An Internet of Things-enabled BIM platform for modular integrated construction: A case study in Hong Kong. Adv. Eng. Inform. 2019, 42, 100997. [Google Scholar] [CrossRef]
- Hossain, M.U.; Ng, S.T.; Antwi-Afari, P.; Amor, B. Circular economy and the construction industry: Existing trends, challenges and prospective framework for sustainable construction. Renew. Sustain. Energy Rev. 2020, 130, 109948. [Google Scholar] [CrossRef]
- Garusinghe, G.D.A.U.; Perera, B.A.K.S.; Weerapperuma, U.S. Integrating circular economy principles in modular construction to enhance sustainability. Sustainability 2023, 15, 11730. [Google Scholar] [CrossRef]
- Abdelmageed, S.; Zayed, T. A study of literature in modular integrated construction-Critical review and future directions. J. Clean. Prod. 2020, 277, 124044. [Google Scholar] [CrossRef]
- Nguyen, T.D.H.N.; Moon, H.; Ahn, Y. Critical review of trends in modular integrated construction research with a focus on sustainability. Sustainability 2022, 14, 12282. [Google Scholar] [CrossRef]
- Zhang, H.; Jiang, W.; Mu, J.; Cheng, X. Optimizing Supply Chain Financial Strategies Based on Data Elements in the China’s Retail Industry: Towards Sustainable Development. Sustainability 2025, 17, 2207. [Google Scholar] [CrossRef]
- Ding, S.; Hu, H.; Xu, F.; Chai, Z.; Wang, W. Blockchain-based security-minded information-sharing in precast construction supply chain management with scalability, efficiency and privacy improvements. Autom. Constr. 2024, 168, 105698. [Google Scholar] [CrossRef]
- Siebers, P.O.; Aickelin, U. Introduction to multi-agent simulation. In Encyclopedia of Decision Making and Decision Support Technologies; IGI Global: Hershey, PA, USA, 2008; pp. 554–564. [Google Scholar] [CrossRef]
- Mohammed, A.B. Process map for accessing automatization of life cycle assessment utilizing building information modeling. J. Archit. Eng. 2023, 29, 04023012. [Google Scholar] [CrossRef]
- Pan, W.; Gibb, A.G.; Dainty, A.R. Strategies for integrating the use of off-site production technologies in house building. J. Constr. Eng. Manag. 2012, 138, 1331–1340. [Google Scholar] [CrossRef]
- United Nations Environment Programme. 2022 Global Status Report for Buildings and Construction: Towards a Zero-Emission, Efficient and Resilient Buildings and Construction Sector; Technical Report; United Nations Environment Programme (UNEP): Nairobi, Kenya, 2022; Available online: https://globalabc.org/resources/publications/2022-global-status-report-buildings-and-construction (accessed on 10 April 2025).
- Wuni, I.Y.; Shen, G.Q. Barriers to the adoption of modular integrated construction: Systematic review and meta-analysis, integrated conceptual framework, and strategies. J. Clean. Prod. 2020, 249, 119347. [Google Scholar] [CrossRef]
- Liu, Y.; Yao, F.; Ji, Y.; Tong, W.; Liu, G.; Li, H.X.; Hu, X. Quality control for offsite construction: Review and future directions. J. Constr. Eng. Manag. 2022, 148, 03122003. [Google Scholar] [CrossRef]
- Gosling, J.; Naim, M.; Towill, D. Identifying and categorizing the sources of uncertainty in construction supply chains. J. Constr. Eng. Manag. 2013, 139, 102–110. [Google Scholar] [CrossRef]
- Pomponi, F.; Moncaster, A. Embodied carbon mitigation and reduction in the built environment–What does the evidence say? J. Environ. Manag. 2016, 181, 687–700. [Google Scholar] [CrossRef]
- Wei, J.; Ge, B.; Zhong, Y.; Lee, T.L.; Zhang, Y. Comparative analysis of embodied carbon in modular and conventional construction methods in Hong Kong. Sci. Rep. 2024, 14, 23603. [Google Scholar] [CrossRef]
- Attajer, A.; Darmoul, S.; Riane, F.; Bouras, A. Distributed maintenance: A literature analysis and classification. IFAC-PapersOnLine 2019, 52, 619–624. [Google Scholar] [CrossRef]
- Clough, I. The case for more modular facilities in the NHS. Br. J. Healthc. Manag. 2022, 28, 3–11. [Google Scholar] [CrossRef]
- Lomas, K.J.; Giridharan, R.; Short, C.A.; Fair, A. Resilience of ‘Nightingale’hospital wards in a changing climate. Build. Serv. Eng. Res. Technol. 2012, 33, 81–103. [Google Scholar] [CrossRef]
- Tapia, D.; González, M.; Vera, S.; Aguilar, C. A Novel Offsite Construction Method for Social Housing in Emerging Economies for Low Cost and Reduced Environmental Impact. Sustainability 2023, 15, 16922. [Google Scholar] [CrossRef]
- Li, X.; Jiang, M.; Lin, C.; Chen, R.; Weng, M.; Jim, C. Integrated BIM-IoT platform for carbon emission assessment and tracking in prefabricated building materialization. Resour. Conserv. Recycl. 2025, 215, 108122. [Google Scholar] [CrossRef]
- Yang, Y.; Li, M.; Yu, C.; Zhong, R.Y. Digital twin-enabled visibility and traceability for building materials in on-site fit-out construction. Autom. Constr. 2024, 166, 105640. [Google Scholar] [CrossRef]
- Fernandez, J.; Borge, R.; de la Paz, D.; Lumbreras, J. Assessing on-road emissions from urban buses in different traffic congestion scenarios by integrating real-world driving, traffic, and emissions data. Sci. Total Environ. 2022, 838, 156481. [Google Scholar] [CrossRef]
- OECD. Tackling Air Pollution in Dense Urban Areas: The Case of Santiago Metropolitan Region; Technical Report 195; OECD Publishing: Paris, France, 2022. [Google Scholar] [CrossRef]
- Patella, S.M.; Grazieschi, G.; Gatta, V.; Marcucci, E.; Carrese, S. The adoption of green vehicles in last mile logistics: A systematic review. Sustainability 2020, 13, 6. [Google Scholar] [CrossRef]
- Chhatwani, M.; Golparvar-Fard, M. Model-driven management a of construction carbon footprint: Case study. In Proceedings of the Construction Research Congress 2016, San Juan, Puerto Rico, 31 May–2 June 2016; pp. 1202–1212. [Google Scholar] [CrossRef]
- Mohamed Abdul Ghani, N.M.A.; Egilmez, G.; Kucukvar, M.; S. Bhutta, M.K. From green buildings to green supply chains: An integrated input-output life cycle assessment and optimization framework for carbon footprint reduction policy making. Manag. Environ. Qual. Int. J. 2017, 28, 532–548. [Google Scholar] [CrossRef]
- Hussein, M.; Darko, A.; Eltoukhy, A.E.; Zayed, T. Sustainable logistics planning in modular integrated construction using multimethod simulation and Taguchi approach. J. Constr. Eng. Manag. 2022, 148, 04022022. [Google Scholar] [CrossRef]
- Ng, C.L.; Wu, H.; Li, M.; Zhong, R.Y.; Qu, X.; Huang, G.Q. A carbon-aware routing protocol for optimizing carbon emissions in modular construction logistics. In Proceedings of the 2024 IEEE 20th International Conference on Automation Science and Engineering (CASE), Bari, Italy, 28 August–1 September 2024; pp. 2852–2856. [Google Scholar] [CrossRef]
- Płoszaj-Mazurek, M.; Ryńska, E.; Grochulska-Salak, M. Methods to optimize carbon footprint of buildings in regenerative architectural design with the use of machine learning, convolutional neural network, and parametric design. Energies 2020, 13, 5289. [Google Scholar] [CrossRef]
- Xiang, Y.; Ma, Y.; Zhang, Z.; Chen, Z. Project management mode under the concept of low carbon environmental protection and its value in intelligent construction. Res. Sq. 2023. [CrossRef]
- Wang, B.; Geng, L.; Tam, V.W. Effective carbon responsibility allocation in construction supply chain under the carbon trading policy. Energy 2025, 319, 135059. [Google Scholar] [CrossRef]
- Sánchez-Garrido, A.J.; Sánchez-Cantalejo, C.; Llorens-Montes, F.J. A systematic literature review on modern methods of construction in building: An integrated approach using machine learning. J. Build. Eng. 2023, 71, 106725. [Google Scholar] [CrossRef]
- Onat, N.C.; Kucukvar, M. Carbon footprint of construction industry: A global review and supply chain analysis. Renew. Sustain. Energy Rev. 2020, 124, 109783. [Google Scholar] [CrossRef]
- Klammer, N.; Kaufman, Z.; Podder, A.; Pless, S.; Celano, D.; Rothgeb, S. A Life Cycle Decarbonization of Modular Building Solutions. In Proceedings of the ASHRAE/IBPSA-USA Building Simulation Conference, Chicago, IL, USA, 14–16 September 2022. [Google Scholar]
- Klammer, N.; Kaufman, Z.; Podder, A.; Pless, S.; Celano, D.; Rothgeb, S. Decarbonization During Predevelopment of Modular Building Solutions; Technical Report; U.S. Department of Energy: Golden, CO, USA, 2021.
- Hamza, O.; Abogdera, A.; Zoras, S. Emissions-Based Options Appraisal for Modular Building Foundations—A Case Study. Eng. Sustain. 2023, 176, 173–183. [Google Scholar] [CrossRef]
- Rodrigo, M.; Perera, S.; Senaratne, S.; Jin, X. Review of Supply Chain Based Embodied Carbon Estimating Method: A Case Study Based Analysis. Sustainability 2021, 13, 9171. [Google Scholar] [CrossRef]
- Acquaye, A.; Genovese, A.; Barrett, J.; Koh, S. Benchmarking Carbon Emissions Performance in Supply Chains. Ecol. Econ. 2014, 105, 106–118. [Google Scholar] [CrossRef]
- Yevu, S.; Owusu, E.; Chan, A.; Sepasgozar, S.; Kamat, V. Digital Twin-Enabled Prefabrication Supply Chain for Smart Construction and Carbon Emissions Evaluation in Building Projects. J. Build. Eng. 2023, 75, 107598. [Google Scholar] [CrossRef]
- Attajer, A.; Darmoul, S.; Chaabane, S.; Riane, F.; Sallez, Y. Benchmarking simulation software capabilities against distributed control requirements: FlexSim vs. AnyLogic. In International Workshop on Service Orientation in Holonic and Multi-Agent Manufacturing; Springer: Cham, Switzerland, 2020; pp. 520–531. [Google Scholar] [CrossRef]
- Attajer, A.; Mecheri, B. Multi-Agent Simulation Approach for Modular Integrated Construction Supply Chain. Appl. Sci. 2024, 14, 5286. [Google Scholar] [CrossRef]
- Banerjee, C.; Mukherjee, T.; Pasiliao, E., Jr. An empirical study on generalizations of the ReLU activation function. In Proceedings of the 2019 ACM Southeast Conference, Kennesaw, GA, USA, 14–15 November 2019; pp. 164–167. [Google Scholar] [CrossRef]
- Kingma, D.P.; Ba, J. Adam: A method for stochastic optimization. arXiv 2014, arXiv:1412.6980. [Google Scholar]
- Developers, T. TensorFlow. Zenodo. 2022. Available online: https://zenodo.org/records/4758419 (accessed on 10 April 2025).
- Ketkar, N. Introduction to keras. In Deep Learning with Python: A Hands-On Introduction; Springer: Berlin/Heidelberg, Germany, 2017; pp. 97–111. [Google Scholar] [CrossRef]
- Awad, M.; Khanna, R.; Awad, M.; Khanna, R. Support vector regression. Efficient Learning Machines: Theories, Concepts, and Applications for Engineers and System Designers; Springer: Berlin/Heidelberg, Germany, 2015; pp. 67–80. [Google Scholar] [CrossRef]
- Rigatti, S.J. Random forest. J. Insur. Med. 2017, 47, 31–39. [Google Scholar] [CrossRef]
- Natekin, A.; Knoll, A. Gradient boosting machines, a tutorial. Front. Neurorobot. 2013, 7, 21. [Google Scholar] [CrossRef]
- Chen, T.; Guestrin, C. Xgboost: A scalable tree boosting system. In Proceedings of the 22nd ACM Sigkdd International Conference on Knowledge Discovery and Data Mining, San Francisco, CA, USA, 13–17 August 2016; pp. 785–794. [Google Scholar] [CrossRef]
- Kramer, O.; Kramer, O. Scikit-learn. In Machine Learning for Evolution Strategies; Springer: Cham, Switzerland, 2016; pp. 45–53. [Google Scholar] [CrossRef]
- Climatiq-API for Carbon Footprint Calculations. Available online: https://www.climatiq.io/ (accessed on 10 April 2025).
- Sun, X.; Pan, X.; Jin, C.; Li, Y.; Xu, Q.; Zhang, D.; Li, H. Life Cycle Assessment-Based Carbon Footprint Accounting Model and Analysis for Integrated Energy Stations in China. Int. J. Environ. Res. Public Health 2022, 19, 16451. [Google Scholar] [CrossRef] [PubMed]
- Zhao, Z.; Li, H.; Wang, S. Machine learning-based surrogate models for fast impact assessment of a new building on urban local microclimate at design stage. Build. Environ. 2024, 266, 112142. [Google Scholar] [CrossRef]
- Achamrah, F.E.; Attajer, A.; Bouchnita, A.; Krimi, I. Enhanced Deep Reinforcement Learning for Selective Maintenance with Learning Effects. In Proceedings of the 2024 IEEE International Conference on Technology Management, Operations and Decisions (ICTMOD), Sharjah, United Arab Emirates, 4–6 November 2024; pp. 1–6. [Google Scholar] [CrossRef]
- Achamrah, F.E.; Attajer, A. Multi-objective reinforcement learning-based framework for solving selective maintenance problems in reconfigurable cyber-physical manufacturing systems. Int. J. Prod. Res. 2024, 62, 3460–3482. [Google Scholar] [CrossRef]


| Study | Study Type | Application Domain | Estimation Scope | Key Technologies Used |
|---|---|---|---|---|
| [54] | Simulation | Project-level | Carbon footprint benchmarking and monitoring | 4D Building Information Modeling (BIM), Life Cycle Assessment (LCA) tools |
| [56] | Simulation | MiC supply chain | Logistics planning, project key performance indicators (KPIs): Project duration, MiC-SC costs, emissions | Agent-based modeling, Discrete-event simulation, Taguchi approach |
| [17] | Hybrid | Multi-modal logistics in MiC | Multi-modal logistics optimization: Project duration, total costs, emissions | Hybrid multi-agent simulation, Design of experiments, Metamodeling |
| [55] | Simulation | Building supply chain | Supply chain carbon footprint: GHG emissions, economic output | Economic Input-Output Life Cycle Assessment (EIO-LCA), Mixed Integer Linear Programming (MILP) |
| [57] | Simulation | Modular construction logistics | Routing optimization for carbon emissions reduction | Cyber-Physical Internet framework, Carbon-aware routing protocol |
| [62] | Review | General Construction | Global and regional supply chain analysis | Input-output analysis, Life cycle assessment |
| [58] | Machine Learning | Early architectural design stage | Early-stage carbon footprint estimation | Machine Learning Models, Convolutional Neural Networks |
| [12] | Machine Learning | Design stage, 70 projects in Yangtze River Delta | Embodied carbon emissions prediction | Artificial Neural Network, Support Vector Regression, Extreme Gradient Boosting |
| [13] | Machine Learning | Building foundations, 35 public buildings in China | Carbon emissions prediction | BIM, Decision Tree, Random Forest, XGBoost, Neural Network |
| [59] | Machine Learning | Intelligent Construction | CO emissions and energy consumption forecasting | Deep Neural Networks |
| Model | MSE () | MSE (Time) | MSE (Cost) |
|---|---|---|---|
| SVM (SVR) | 541,352,400.00 | 39.32 | 398,188,700.00 |
| Random Forest | 589,882,000.00 | 0.29 | 239,012,000.00 |
| Gradient Boosting | 496,780,700.00 | 82.00 | 5,397,325,000.00 |
| XGBoost | 508,183,300.00 | 0.22 | 81,027,600.00 |
| Parameter | Value | Unit | Description |
|---|---|---|---|
| Project Setup | |||
| Number of Suppliers | 5 | - | Suppliers providing prefabricated components |
| Number of MiC Factories | 1 | - | Centralized factory for module assembly |
| Construction Site Location | Paris, France | - | Location of final module installation |
| Normal Project Completion Time | 120 | days | Deadline to avoid penalty |
| Production and Storage | |||
| Avg. Requests per Day | 60 C, 3 M | C: Components, M: Modules | Daily component/module demand |
| Initial Storage per Supplier | uniform(5, 10) | Components | Initial buffer stock |
| Production Capacity (Supplier) | uniform(10, 15) | Components/day | Daily component production |
| Production Capacity (Factory) | uniform(3, 5) | Modules/day | Daily module output |
| Logistics and Transportation | |||
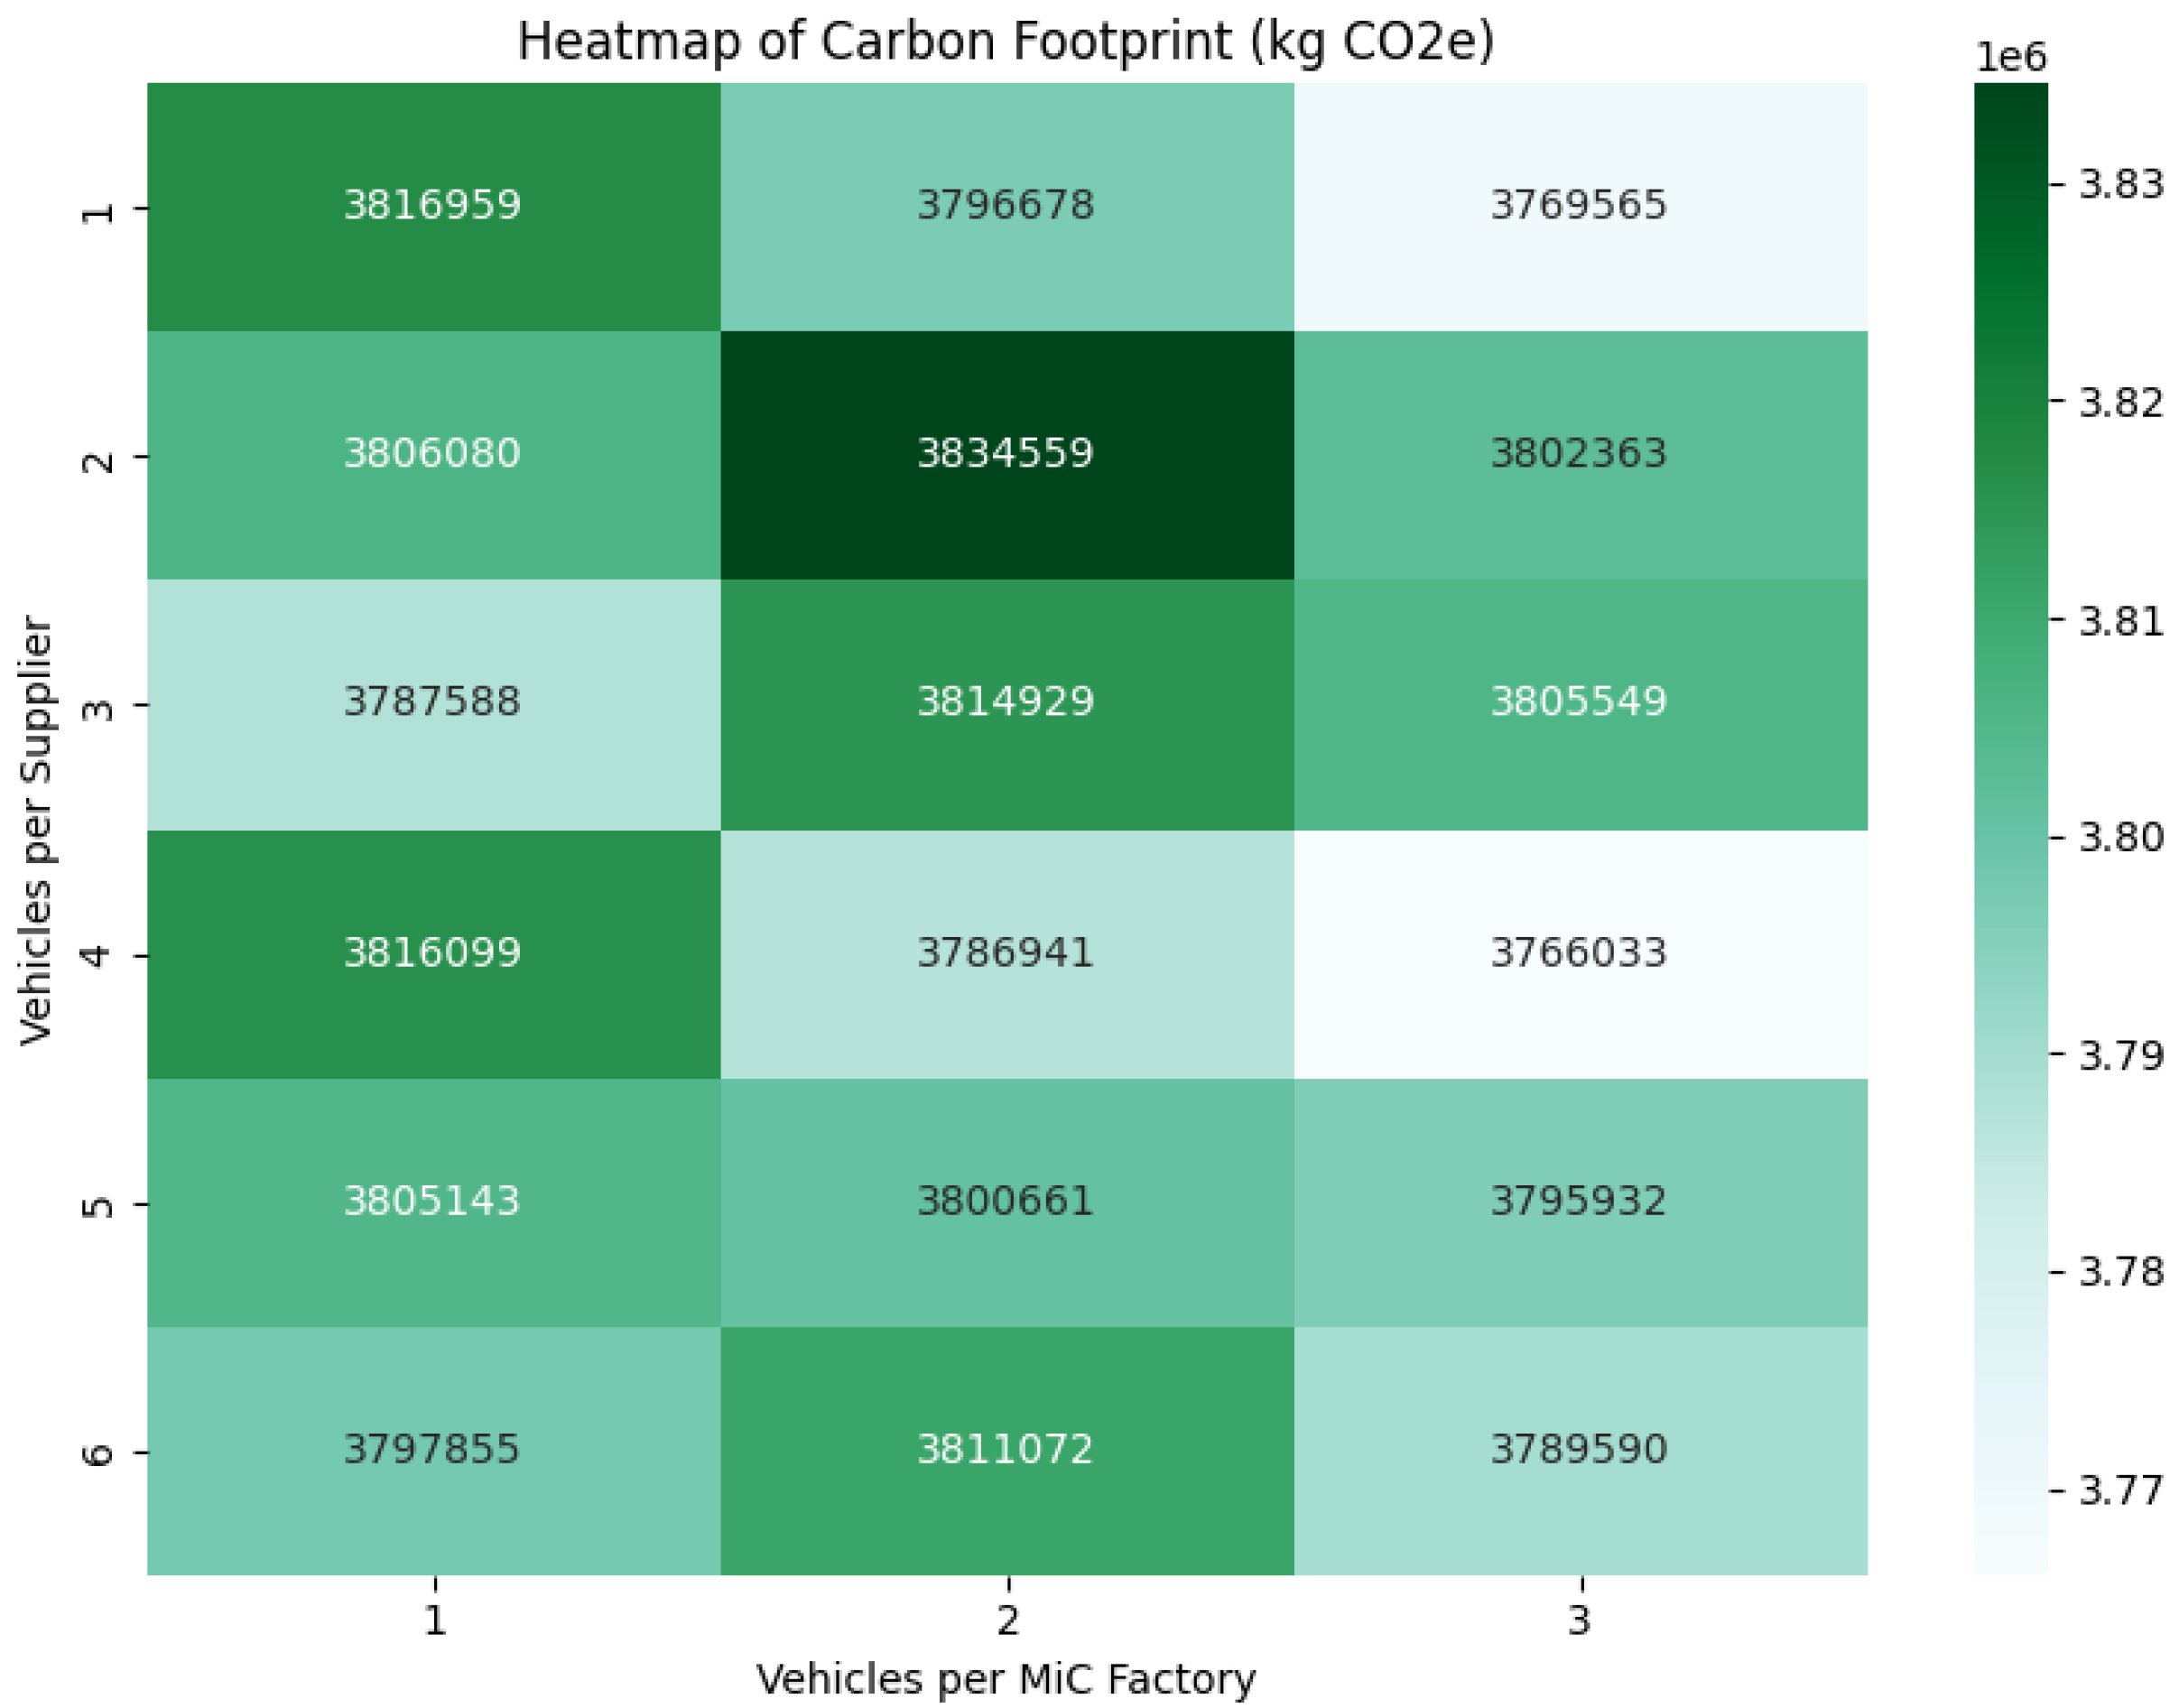
| Vehicles (T1) per Supplier | [1,2,3,4,5,6] | vehicles | Vehicles used to transport components |
| Vehicles (T2) per Factory | [1,2,3] | vehicles | Vehicles used to deliver assembled modules |
| Vehicle Speed T1 | uniform(50, 70) | km/h | Speed range for component delivery |
| Vehicle Speed T2 | uniform(40, 60) | km/h | Speed range for module delivery |
| Fixed Cost T1 | 150 | EUR/day | Daily fixed cost for T1 vehicles (e.g., rental, driver salary, insurance) |
| Fixed Cost T2 | 200 | EUR/day | Daily fixed cost for T2 vehicles (e.g., rental, driver salary, insurance) |
| Variable Cost T1 | 2 | EUR/km | Per-kilometer variable cost for T1 (e.g., fuel, maintenance, tire wear) |
| Variable Cost T2 | 3 | EUR/km | Per-kilometer variable cost for T2 (e.g., fuel, maintenance, tire wear) |
| Project Delay Penalty | 500 | EUR/day | Penalty for late delivery |
| Supplier Locations to MiC Factory | Supplier1: uniform(70, 75), Supplier2: uniform(125, 130), Supplier3: uniform(155, 160), Supplier4: uniform(75, 80), Supplier5: uniform(125, 130) | km | Distance from suppliers to factory |
| Factory to Site Distance | uniform(20, 22.5) | km | Transport distance for modules |
| Energy and Emissions | |||
| Energy Emission Factor | uniform(0.039, 0.4041) | kg CO2e/kWh | Emissions per energy unit |
| Fabrication Energy Use | uniform(13, 70) | kW | Energy required for assembly |
| Fabrication Time | uniform(2, 3) | hours | Time to assemble one module |
| Construction Energy Use | uniform(65, 300) | kW | Energy used during site work |
| Construction Time | uniform(0.1, 1) | hours | Time for on-site installation |
| Material Details | |||
| Concrete Emission Factor | uniform(0.17, 0.27) | kg CO2e/kg | Concrete emission rate based on the weight |
| Steel Emission Factor | uniform(0.5, 0.7) | kg CO2e/kg | Steel emission rate based on the weight |
| Insul. + MEP Emission Factor | uniform(10.3, 11.45) | kg CO2e/kg | Insulation with MEP emission rate based on the weight |
| Aluminum Emission Factor | uniform(1.4, 3.85) | kg CO2e/kg | Aluminum emission rate based on the weight |
| Concrete Weight | uniform(2400, 7700) | kg | Weight of prefabricated concrete |
| Steel Weight | uniform(457.2, 2880) | kg | Weight of steel beams |
| Insul. + MEP Weight | uniform(14, 17) | kg | Weight of internal MEP units |
| Aluminum Weight | uniform(1.62, 108.00) | kg | Weight of aluminum units |
| Module Weight | uniform(21,091, 73,616) | kg | Assembled module weight |
| Transportation Emissions | |||
| Concrete Transport Factor | uniform(0.000062, 0.000256) | kg CO2e/kg · km | Emission rate for concrete freight |
| Steel Transport Factor | uniform(0.000088, 0.000363) | kg CO2e/kg · km | Emission rate for steel freight |
| MEP+Aluminum Transport Factor | uniform(0.00012, 0.00015) | kg CO2e/kg · km | Emission rate for MEP/Aluminum freight |
| General Freight Factor | uniform(0.00005, 0.00006) | kg CO2e/kg · km | Baseline freight emissions |
| Vehicles per Supplier | Vehicles per MiC factory | Var. Cost T1 (EUR) | Var. Cost T2 (EUR) | Fixed Cost T1 (EUR) | Fixed Cost T2 (EUR) | Project Time (Days) | Penalty (EUR) | Total Cost (EUR) | Carbon Footprint (kg ) |
|---|---|---|---|---|---|---|---|---|---|
| 1 | 1 | 1,648,941 | 46,042 | 219,100 | 58,427 | 292 | 86,067 | 2,058,576 | 3,816,959 |
| 1 | 2 | 1,648,806 | 45,974 | 219,430 | 117,029 | 293 | 86,286 | 2,117,525 | 3,796,678 |
| 1 | 3 | 1,649,246 | 46,254 | 219,349 | 175,479 | 292 | 86,233 | 2,176,560 | 3,769,565 |
| 2 | 1 | 1,648,691 | 46,066 | 219,560 | 29,275 | 146 | 13,187 | 1,956,778 | 3,806,080 |
| 2 | 2 | 1,649,390 | 46,010 | 219,736 | 58,596 | 146 | 13,245 | 1,986,978 | 3,834,559 |
| 2 | 3 | 1,648,785 | 45,979 | 218,550 | 87,420 | 146 | 12,850 | 2,013,585 | 3,802,363 |
| 3 | 1 | 1,649,603 | 45,994 | 219,583 | 19,518 | 98 | 0 | 1,934,699 | 3,787,588 |
| 3 | 2 | 1,649,795 | 46,039 | 220,150 | 39,138 | 98 | 0 | 1,955,123 | 3,814,929 |
| 3 | 3 | 1,649,388 | 45,994 | 220,024 | 58,673 | 98 | 0 | 1,974,079 | 3,805,549 |
| 4 | 1 | 1,649,598 | 46,024 | 242,550 | 16,170 | 81 | 0 | 1,954,342 | 3,816,099 |
| 4 | 2 | 1,649,555 | 46,092 | 242,505 | 32,334 | 81 | 0 | 1,970,486 | 3,786,941 |
| 4 | 3 | 1,649,472 | 46,063 | 242,569 | 48,514 | 81 | 0 | 1,986,618 | 3,766,033 |
| 5 | 1 | 1,649,060 | 46,045 | 303,118 | 16,166 | 81 | 0 | 2,014,389 | 3,805,143 |
| 5 | 2 | 1,648,942 | 46,095 | 303,127 | 32,334 | 81 | 0 | 2,030,498 | 3,800,661 |
| 5 | 3 | 1,649,147 | 45,972 | 303,072 | 48,492 | 81 | 0 | 2,046,683 | 3,795,932 |
| 6 | 1 | 1,649,559 | 46,035 | 363,737 | 16,166 | 81 | 0 | 2,075,496 | 3,797,855 |
| 6 | 2 | 1,649,520 | 46,092 | 363,725 | 32,331 | 81 | 0 | 2,091,669 | 3,811,072 |
| 6 | 3 | 1,649,001 | 45,944 | 363,727 | 48,497 | 81 | 0 | 2,107,169 | 3,789,590 |
| Strategy | Carbon Footprint (kg CO2e) | Project Time (Days) | Total Cost (EUR) | |||
|---|---|---|---|---|---|---|
| 1 | 0 | 0 | [1 6 1 2 1 3] | 3,776,432.50 | 288.79 | 2,392,895.50 |
| 0 | 1 | 0 | [3 5 5 6 5 3] | 3,791,940.50 | 82.67 | 2,036,646.38 |
| 0 | 0 | 1 | [3 5 3 4 1 1] | 3,777,434.00 | 99.66 | 1,948,504.75 |
| 0.33 | 0.33 | 0.33 | [3 5 3 4 1 1] | 3,781,251.00 | 90.76 | 1,960,009.00 |
| 0.5 | 0.5 | 0 | [5 1 6 6 6 3] | 3,772,361.00 | 260.93 | 2,712,012.50 |
| 0.5 | 0 | 0.5 | [3 6 5 5 2 1] | 3,797,530.50 | 123.04 | 2,099,554.50 |
| 0 | 0.5 | 0.5 | [3 5 5 3 4 1] | 3,791,096.50 | 118.98 | 2,038,015.88 |
Disclaimer/Publisher’s Note: The statements, opinions and data contained in all publications are solely those of the individual author(s) and contributor(s) and not of MDPI and/or the editor(s). MDPI and/or the editor(s) disclaim responsibility for any injury to people or property resulting from any ideas, methods, instructions or products referred to in the content. |
© 2025 by the authors. Licensee MDPI, Basel, Switzerland. This article is an open access article distributed under the terms and conditions of the Creative Commons Attribution (CC BY) license (https://creativecommons.org/licenses/by/4.0/).
Share and Cite
Attajer, A.; Mecheri, B.; Hadbi, I.; Amoo, S.N.; Bouchnita, A. Sustainable Supply Chain Strategies for Modular-Integrated Construction Using a Hybrid Multi-Agent–Deep Learning Approach. Sustainability 2025, 17, 5434. https://doi.org/10.3390/su17125434
Attajer A, Mecheri B, Hadbi I, Amoo SN, Bouchnita A. Sustainable Supply Chain Strategies for Modular-Integrated Construction Using a Hybrid Multi-Agent–Deep Learning Approach. Sustainability. 2025; 17(12):5434. https://doi.org/10.3390/su17125434
Chicago/Turabian StyleAttajer, Ali, Boubakeur Mecheri, Imane Hadbi, Solomon N. Amoo, and Anass Bouchnita. 2025. "Sustainable Supply Chain Strategies for Modular-Integrated Construction Using a Hybrid Multi-Agent–Deep Learning Approach" Sustainability 17, no. 12: 5434. https://doi.org/10.3390/su17125434
APA StyleAttajer, A., Mecheri, B., Hadbi, I., Amoo, S. N., & Bouchnita, A. (2025). Sustainable Supply Chain Strategies for Modular-Integrated Construction Using a Hybrid Multi-Agent–Deep Learning Approach. Sustainability, 17(12), 5434. https://doi.org/10.3390/su17125434