Article

Research on the Impact of Population Aging on Agricultural Sustainable Development

by
Yan Liu
1,
Xuanzhe Song
2,
Senwei Huang
1,* and
Manqian Xu
1
1
School of Public Administration and Law, Fujian Agriculture and Forestry University, Fuzhou 350002, China
2
Faculty of Arts, Design and Media, Birmingham City University, Birmingham B4 7BD, UK
*
Author to whom correspondence should be addressed.
Sustainability 2025, 17(10), 4738; https://doi.org/10.3390/su17104738
Submission received: 18 February 2025 / Revised: 9 May 2025 / Accepted: 14 May 2025 / Published: 21 May 2025

Abstract

:
Using panel data from 31 provinces and municipalities in China spanning the period from 2002 to 2021, this study constructs a comprehensive indicator system to assess the level of agricultural sustainable development from the dimensions of economic, social, and ecological. A panel threshold regression model is developed, with rural labor transfer serving as the threshold variable, to explore the nonlinear effects of rural population aging on agricultural sustainable development. The empirical findings indicate that the overall level of agricultural sustainable development in China has shown a consistent upward trend over the study period, with the highest level observed in the main grain-consuming areas, followed by the main grain-producing areas, and the lowest in the grain-producing and consuming balance areas. Moreover, rural population aging exhibits a significant nonlinear and positive effect on agricultural sustainable development. Based on two identified threshold values of labor transfer, the results suggest that as the proportion of labor transfer increases, the positive impact also increases. Against the backdrop of intensified rural labor migration and the consequent acceleration of rural population aging, it is imperative to promote the scaling-up of agricultural operations, foster a new generation of professional farmers, and implement region-specific sustainable agricultural development strategies to support long-term sustainability in the agricultural sector.

1. Introduction

Agriculture serves as the foundation of national economic growth and plays a pivotal role in social development. The ability of the agricultural sector to achieve long-term stability directly influences the overall trajectory of economic progress and social stability. In 1981, American agricultural scientist Lester R. introduced the concept of sustainable agricultural development in Building a Sustainable Society [1], sparking extensive academic discussions on the subject. The 2030 Agenda for Sustainable Development further reinforces the importance of this concept by identifying food security and sustainable agricultural development as key global objectives [2]. China, despite possessing limited arable land, is responsible for feeding approximately 22% of the world’s population. However, rapid agricultural expansion has led to serious environmental challenges, including soil degradation and water pollution, which pose significant threats to the long-term sustainability of agricultural production (Agricultural production: In this study, it specifically refers to the activities of farmers engaged in agricultural planting to meet food demands and other agricultural outputs. Agricultural production is fundamental, focusing on the production activities themselves) [3]. The core principle of agricultural sustainable development underscores the necessity of balancing agricultural productivity with ecological conservation, social well-being, and resource efficiency [4]. In this regard, Chinese policymakers have emphasized the promotion of green agricultural practices (Green agriculture: Green agriculture emphasizes the resource and environmental carrying capacity as its benchmark, focusing on resource conservation, efficiency, ecological preservation, and environmental friendliness. The goal is to provide green products. It prioritizes environmental protection during the production process and product safety), the mitigation of environmental risks, and improvements in resource utilization efficiency to promote the sustainable development of agriculture. At the same time, China’s rural demographic landscape is undergoing profound transformations. The increasing outflow of rural labor has accelerated the aging of the rural population, leading to pressing concerns such as the aging agricultural workforce and the hollowing-out of rural communities. These demographic shifts present significant challenges for agricultural production, rural development, and farmers’ livelihoods [5]. Acknowledging the urgency of this issue, the 20th National Congress of the Communist Party of China has incorporated strategies to proactively address population aging into the national agenda. Understanding how rural population aging influences sustainable agricultural development is therefore critical to ensuring long-term agricultural sustainability.
Despite the significance of this issue, studies on the impact of rural population aging on sustainable agricultural development remain limited. To bridge this gap, this study first reviews existing literature on agriculture before investigating the mechanisms through which rural population aging affects agricultural sustainable development. A comprehensive evaluation framework is developed based on economic, social, and ecological dimensions. Using a multi-indicator evaluation method, the study calculates the Agricultural Sustainable Development Index (ASDI) for 31 provinces in China from 2002 to 2021 and analyzes its spatiotemporal evolution trends. Furthermore, a threshold effect model is applied to explore the heterogeneous effects of rural population aging on sustainable agricultural development at different stages of rural labor transfer.

2. Literature Review

Research on the impact of rural population aging on sustainable development remains relatively limited. Therefore, this study reviews existing literature on the evaluation of agricultural sustainable development and the influence of rural population aging on agricultural production. Firstly, numerous scholars discussed the definition and evaluation of agricultural sustainable development. Luo emphasized that agricultural sustainable development should be rooted in ecological sustainability, social sustainability, and the sustainability of resources and environment [4]. Miao et al., focusing on the hilly areas of southern China, constructed an evaluation framework for agricultural sustainable development encompassing agricultural economy, resource environment, culture and technology, and rural society. Their findings suggest that the prospects for agricultural sustainable development in these regions are promising [6]. Similarly, Tang et al. developed an index system to measure the degree of agricultural sustainable development in 11 provinces within the Yangtze River Economic Belt, incorporating population, society, economic, environmental, and resource-related factors in municipalities [7]. Their analysis of the trend from 2004 to 2019 reveals an initial period of slow improvement, followed by rapid growth, with significant spatial disparities across provinces. Cao used related agricultural data of Guangxi from 2007 to 2016 and employed the ecological footprint model to assess the region’s carrying capacity, concluding that the agricultural ecological carrying capacity of Guangxi is either already insufficient or will soon fail to meet the demand for agricultural products. This suggests an urgent need for government intervention [8]. Wang et al. applied the Euclidean distance method to assess and analyze the agricultural sustainable development in Chengdu from 2000 to 2016, finding a consistent upward trend [9]. Zhang et al., using panel data from 2004 to 2015, observed that China’s agricultural sustainable development index remains relatively low and shows a spatial pattern of decline from east to west [10]. Zhao focuses on the main grain-producing areas and points out that from 2004 to 2015, the average value of the agricultural sustainability development comprehensive index in these regions also displayed a decreasing trend from east to west [11].
Secondly, as rural population aging intensifies, researchers have debated its effects on China’s agricultural production, with no clear consensus. Some scholars argue that rural population aging is detrimental to China’s agricultural production and will negatively affect agricultural ecological efficiency, total factor productivity, industrial structure upgrading, and high-quality development [12,13,14,15,16,17,18]. Others contend that rural population aging does not necessarily impede agricultural production. They suggest that as workers age, their experience in production, management, and technology use will improve production efficiency [19,20,21,22,23,24]. Additionally, some studies highlight a dual effect of population aging on agricultural technological progress. On the one hand, the accumulation of human capital and technical experience by aging promotes technological advancement. On the other hand, aging may cause a shortage of agricultural production resources for restricting technological progress [25].
Thirdly, several studies have also examined the spatial effects of agricultural production and development. Between 1978 and 2015, agricultural total factor productivity across 28 provinces in mainland China exhibited a shifting pattern of spatial correlation, transitioning from weak to strong and then back to weak [26]. Research utilizing the Spatial Durbin Model has demonstrated that agricultural carbon emission efficiency exhibits positive spillover effects, meaning that improvements in one region can enhance efficiency in neighboring areas [27]. Tang’s study further indicates that rural population aging positively impacts high-quality agricultural development, with stronger effects in major grain-producing regions than in balanced production-consumption areas. However, in major grain-consuming areas, this positive effect is not significant [23]. Other research suggests that the aging of agricultural labor in another region can influence agricultural output in the local region through spillover effects. This implies that addressing the aging of agricultural labor and the insufficient supply of agricultural labor requires a coordinated global and regional approach [28]. In summary, despite progress in research on agricultural production and sustainable development, there is still room for further research. First, while existing studies have constructed indicator systems to measure agricultural sustainable development, many rely on similar variables. This study introduces an innovative approach by integrating the land carrying capacity index(LCCI), urban-rural income comparison, and agricultural carbon emission efficiency(ρ) into the evaluation framework to better capture the essence of agricultural sustainable development. Second, most research has focused on the impact of rural population aging on agricultural production, with limited attention to its effects on agricultural sustainable development. While correlated, these two concepts differ—agricultural sustainable development emphasizes the long-term viability of agricultural progress, requiring a broader analytical framework. Moreover, inconsistent conclusions exist regarding how rural population aging affects agricultural production. Third, rural population aging is a direct consequence of rural labor transfer. Unlike previous studies that primarily use general regression models, this study employs a threshold effect model to examine how rural population aging affects agricultural sustainable development at different stages of rural labor transfer.

3. Theoretical Analysis

3.1. Labor Transfer Contributes to the Aging of the Rural Population

Traditionally, scholars have attributed population aging to declining birth and death rates. However, Skeldon (1999) proposed that rural labor mobility is a key factor in rural population aging [29]. According to China’s Seventh National Census, 509.79 million people lived in rural areas in China, accounting for 36.11% of the population. Compared to the Sixth National Census, the rural population decreased by 164.36 million, confirming that rural areas remain the primary source of population movement. In 2000, individuals aged 65 and above comprised only 7.35% of the rural population in China. By 2016, the proportion had risen to 12.53% [30]. China’s Seventh National Census in 2021 further revealed that 23.81% of the rural population was aged 60 or older, while 17.72% were aged 65 or older, 7.99 and 6.61 percentage points higher than in urban areas, respectively. The primary reason for this trend lies in the strong age selectivity of labor migration. The outflow population is primarily composed of young workers, typically aged 15 to 30 [31,32]. This migration pattern reflects the rational decision-making of rural households, as engaging in off-farm employment serves as a key livelihood strategy [33]. Consequently, the average age of those leaving rural areas is significantly lower than that of the remaining rural population, accelerating the aging process in rural communities [34]. Li et al., using panel data from a longitudinal household survey conducted by the Liaoning Rural Socioeconomic Survey Team from 2003 to 2008, empirically demonstrated that rural labor migration exacerbates the aging of the agricultural workforce [35]. As rural-to-urban migration continues, the rural population will continue to increase in age [36]. Quantitative studies indicate that for every 1% increase in rural labor outflow, the aging of the agricultural workforce rises by 0.067% [37]. Furthermore, rural migrants who successfully integrate into urban employment and lifestyles are unlikely to return to their rural hometowns. At the same time, traditional clan-based rural settlement patterns in China are gradually weakening. Younger and middle-aged migrants tend to settle in urban areas permanently, while elderly individuals, due to their lifestyle preferences and financial constraints, remain in rural areas, further accelerating rural aging [38]. In summary, ongoing rural labor transfer is a major driver of rural population aging.

3.2. Impact of Population Aging on Agricultural Sustainability

As an essential element of agricultural production, human labor plays a crucial role in shaping agricultural development. Agricultural sustainability was formally established as a development goal in the 2015 Sustainable Development Goals (SDGs), with an emphasis on “ending hunger, achieving food security, improving nutrition, and promoting sustainable agriculture” [39]. However, the continued outmigration of young and middle-aged rural laborers is altering the structure of human capital in rural areas, potentially hindering its accumulation and improvement [40]. At the same time, with advancements in agricultural technology, the role of human labor in modern agricultural production has evolved. Rural population aging does not necessarily have a uniformly negative impact on agricultural production, as its effects can be analyzed through two key pathways: mechanization and land transfer. The Smart Villages paradigm, promoted by the European Union, presents an innovative response to the demographic and economic transitions faced by rural areas. In the context of an aging rural population, smart technologies—such as precision agriculture and remote monitoring—can help compensate for shrinking labor pools and support older farmers in maintaining productivity. According to the induced technological progress theory, the requirements for agricultural technology depend on the scarcity of production factors. As rural laborers age and their physical strength declines, they increasingly adopt alternative production factors to compensate for the reduced labor supply [41]. Among these alternatives, mechanization is the most prevalent and effective means of substituting manual labor [42]. In the long run, rural population aging fosters the expansion of large-scale agricultural production and accelerates the adoption of mechanized farming [43]. As mechanization reduces the reliance on physical labor, both agricultural labor productivity and land productivity improve significantly [33]. Consequently, even in the rural areas of central and western China, where rural population aging and labor outmigration are severe, grain output has not decreased due to the widespread mechanization [44].
Another crucial factor is land transfer. As rural labor outmigration continues, the shortage of surplus labor and the declining productivity of the remaining elderly workforce incentivize farmers to lease or transfer their land to more efficient production entities [45]. Large-scale operations lower production costs and improve efficiency, achieving economies of scale. At the same time, the household’s income is increased by transferring out the land. Moreover, land transfer enhances land use efficiency, stabilizing grain production and significantly increasing per capita grain yield [46]. Beyond economic benefits, land transfer also plays a critical role in improving agricultural ecosystems. Compared to traditional fragmented farming practices, large-scale, organized agricultural management leads to enhanced energy output efficiency, reduced environmental pressure, and improved sustainability [47]. In summary, deepening rural population aging does not inherently hinder agricultural sustainable development. Instead, agricultural sustainable development is a dynamic process. Therefore, the relationship between rural population aging and agricultural sustainability may exhibit dynamic changes. In the early stage of rural labor migration, when outflows remain moderate and aging is not yet severe, farmers adopt mechanized technologies to enhance agricultural productivity, thereby achieving sustainable agricultural development. However, as labor migration intensifies, rural labor shortages become more pronounced. Once rural migrant establishes stable urban livelihoods, they tend to transfer their land use rights. This land consolidation facilitates large-scale farming, further advancing sustainable agricultural development. Based on this theoretical framework, this study proposes the following hypothesis: the impact of rural population aging on agricultural sustainable development intensifies with the increase in rural labor force transfer.

4. Research Methodology, Variables, and Data Sources

4.1. Research Methodology

4.1.1. Super Efficiency SBM Model

This study employs the super-efficiency Slack-Based Measure (SBM) model, which accounts for undesirable outputs, to assess agricultural carbon emission efficiency within the ecological subsystem of the agricultural sustainable development indicator system. Data Envelopment Analysis (DEA) is a widely used method for evaluating the efficiency of decision-making units (DMUs) with multiple inputs and outputs [48]. Common DEA models include the CCR, BCC, and SBM models. However, the SBM model often assigns an efficiency score of 1 to multiple DMUs, resulting in several units being classified as efficient simultaneously, which limits effective evaluation and ranking [13]. The Super-efficiency SBM model, an extension of the SBM model, introduces slack variables into the objective function via a non-radial distance function, allowing it to account for undesirable outputs while addressing the issue of multiple DMUs obtaining an efficiency score of 1 [49]. Considering the environmental issues arising from agricultural production, this study treats agricultural carbon emissions as an undesirable output, while agricultural carbon sequestration is incorporated as a desirable output to capture the dual effects of agricultural carbon dynamics accurately. The super-efficiency SBM model is applied to compute agricultural carbon emission efficiency. The specific model formulation is presented as follows:
m i n ρ = 1 1 m i = 1 m S i / x i k 1 + 1 q r = 1 q S i + / y i k s . t               x K = X λ + s                           y K = Y λ + s +                                                     λ 0 , s + 0 ,   s 0      
Among them, ρ represents the efficiency evaluation indicator, specifically referring to agricultural carbon emission efficiency; xk and yk denote the input and output vectors of the DMU, with xik and yik representing their respective elements. X and Y refer to the input and output matrices, while s and s+ represent input and output slack variables, respectively. λ is the column vector. The value of ρ is used to measure the agricultural carbon emission efficiency within the ecological subsystem of the agricultural sustainability indicator system.

4.1.2. CRITIC-Entropy Weight Combination Model

The Criteria Importance Through Intercriteria Correlation (CRITIC) method determines the objective weight of indicators by assessing both the contrast intensity and conflict among evaluation indicators [50]. The contrast intensity is represented by the standard deviation, while the conflict is captured through the correlation coefficient. Some researchers have noted that the standard deviation carries a unit, whereas the correlation coefficient can be negative, but the conflict essentially relates only to the absolute magnitude of the correlation coefficient, regardless of sign [51]. Therefore, the CRITIC method has been modified accordingly [52]. While the CRITIC method effectively integrates the contrast intensity and indicator conflict, it does not account for indicator dispersion. Conversely, the entropy weight method assigns indicator weights based on their dispersion levels. By combining the improved CRITIC method with the entropy weight method, a more objective assessment of indicator weights can be achieved [53]. This study uses the improved CRITIC-Entropy method, assuming equal importance for both methods, with each contributing 50% to the final weight calculation.

4.1.3. VIKOR Method

The Vise Kriterijumska Optimizacija I Kompromisno Resenje (VIKOR) method ranks alternative solutions based on their proximity to the ideal solution. Compared to the Technique for Order Preference by Similarity to an Ideal Solution (TOPSIS), VIKOR considers the decision-maker’s subjective preferences. By integrating the maximization of “group utility” and the minimization of “individual regret”, this makes it a more reasonable approach for solving multi-attribute decision-making problems [54]. The main computational process follows the approach of Yao Y. et al. [55]. The VIKOR index Qi ranges from 0 to 1, with lower VIKOR values corresponding to higher levels of agricultural sustainable development; this study transforms the VIKOR values such that values closer to 1 represent higher levels of sustainability. The conversion formula is presented as follows:
Q i = 1 Q i

4.1.4. Threshold Regression

Traditional linear regression models are limited in capturing the potential nonlinear effects of rural population aging on agricultural sustainable development. Considering that the impact of rural population aging on agricultural sustainable development may operate through multiple mechanisms, this study introduces rural labor transfer as a threshold variable based on the mechanism and research hypotheses of the previous article. This allows for an examination of whether the effect of rural population aging on agricultural sustainable development varies under different levels of labor transfer. Drawing on Hansen’s work [56], a panel threshold model is established to empirically estimate the threshold value and test for the presence of threshold effects. The panel threshold model is presented as follows:
Y i t = β 0 + β 1 X × I ( l a b o r λ ) + β 2 X × I ( l a b o r > λ ) + C V i t + ε i t
Among them, Yit represents the dependent variable, referring to the agricultural sustainable development index. X denotes the degree of rural population aging. Also, labor represents the threshold variable of the labor transfer level. I (·) represents the indicative stage function, which takes a value of 0 when the expression in parentheses is not satisfied and 1 otherwise. λ is the threshold value to be estimated. The coefficients β1, β2 capture the effects of rural population aging on agricultural sustainable development across different labor transfer levels. Β0 is the constant, CV are control variables, and ε i t is the random error term.

4.2. Variable

4.2.1. Dependent Variable

The dependent variable is agricultural Sustainable development. Brown et al. defined sustainable agriculture based on three dimensions: ecological sustainability, economic sustainability, and social sustainability [57]. The 1991 International Conference on Agriculture and Environment in the Danube region further emphasized that sustainable agriculture should meet the needs of both present and future generations without environmental degradation while remaining technically and economically feasible and socially acceptable [58]. As a complex system shaped by the interplay of natural and anthropogenic factors at a specific spatio-temporal scale, a zone is decomposed by the Organisation for Economic Co-operation and Development (OECD) into three subsystems: ecological, economic, and social. This study establishes an evaluation system for agricultural sustainable development by integrating the ‘ecological-economic-social’ subsystems proposed by the OECD with the previously discussed conceptual framework of agricultural sustainable development, while also taking into account data availability (see Table 1). Compared to previous research, this study takes the connotation of agricultural sustainable development as a guide and adds three specific indicators: LCCI, agricultural carbon emission efficiency, and the urban–rural income comparison (rural residents = 1). The LCCI can be measured by the scale of the population that regional total grain production can sustain under a certain food consumption level [59]. It reflects the economic and demographic scale that can be supported by the regional resource endowment while maintaining ecological stability, indicating the agricultural demand of current and future generations. Agricultural carbon emission efficiency is crucial for agricultural sustainable development, as improving carbon emission efficiency mitigates the ecological impact of agricultural activities. The urban–rural income comparison reflects income disparities. Agricultural sustainable development is inseparable from human agency. As rational economic actors, rural residents’ decisions are indisputably influenced by urban–rural income gaps, which in turn affect the agricultural sustainable development.
For the specific calculation of LCCI, this study follows the method proposed by Wang et al., [60] using the following formula:
L c c = G / G p c
L C C I = P a / L c c
where LCC is the population carrying capacity of land resources, G is the total food production, and Gpc is the per capita food consumption standard. Since 1949, in terms of pure food consumption, 400 kg per person is considered the standard for nutritional security. LCCI is the Land Carrying Capacity Index; it is the indicator of ecological subsystem in the agricultural sustainable development indicator system, Pa is the real population size.
Regarding the measurement of agricultural carbon emission efficiency, this study constructs an agricultural carbon emission efficiency evaluation system based on relevant research [27,61]. The index system is shown in Table 2.
In Table 2, the measurement of agricultural carbon sequestration (S) as the desirable output and agricultural carbon emissions (E) as the undesirable output follows the approach of Tian et al. (2013) [62]. When calculating agricultural carbon sequestration (S) as a desirable output in the carbon emission efficiency evaluation system, the expression is as follows:
S = i = 1 k S i = i = 1 k s i Y i ( 1 r ) / H I i
where S is the crop carbon absorption capacity, Si is the carbon absorption capacity of a specific crop, k is the crop type, si is the crop carbon absorption rate, Yi is the economic yield of the crop, r is the moisture content of the economic product portion of the crop, and HIi is the crop economic coefficient. The moisture content, carbon absorption rate, and economic coefficients of major crops are shown in Table 3.
Followed by measuring agricultural carbon emissions (E) as an undesirable output in the carbon emission efficiency evaluation system. Carbon emissions from agricultural materials are the primary contributors to the planting sector’s carbon footprint. Tian argues that agricultural material-related carbon emissions stem from two main sources: firstly, direct or indirect emissions associated with inputs such as fertilizers, pesticides, and agricultural films; and secondly, emissions from the energy consumed during agricultural irrigation. This study employs the IPCC (2013) [63] carbon emission coefficient method to quantify carbon sources in the planting industry. The expression for estimating carbon emissions is:
E = E i = T i · δ i
where E represents total carbon emission from agricultural production, Ei denotes carbon emission from individual sources, Ti is the quantity of each emission source input, and δi is the corresponding emission coefficient. These coefficients include: fertilizers (0.8956 kg/kg), pesticides (4.9341 kg/kg), agricultural films (5.18 kg/kg), diesel (0.5927 kg/kg), and agricultural irrigation (266.48 kg/ha).

4.2.2. Independent Variable

The independent variable is rural population aging. This study uses rural population aging to characterize the aging structure of the rural labor [64]. They are expressed as the proportion of the rural population aged 65 and above relative to the total population.

4.2.3. Threshold Variable

The threshold variable in this study is rural labor transfer. As no consensus exists on its measurement in the literature, this research operationalizes rural labor transfer using employment data from rural secondary and tertiary industries. This approach captures the distribution of rural labor to non-agricultural sectors and accurately measures the quantity of rural labor transfer. Therefore, this research refers to previous studies [65,66,67] to measure it (Rural labor transfer rate = (number of persons employed in the rural − number of persons employed in the primary sector in the rural)/number of persons employed in the rural. The number of persons employed in the primary sector in rural areas = (number of persons employed in the primary sector/total number of employed persons) × the number of persons employed in rural).

4.2.4. Control Variables

To mitigate omitted variable bias, this study incorporates control variables including effective irrigation, urbanization rate, agricultural planting structure, and soil erosion control area. Among them, the urbanization rate is measured as the proportion of the permanent urban population to the total provincial population, serving as a proxy for regional living standards, infrastructure, and urban–rural interaction mechanisms that influence agricultural sustainable development [12]. Agricultural planting structure is operationalized as the ratio of grain sown area to total crop sown area. Changes in the planting structure can reflect the current state of food security and affect the sustainability of agriculture.

4.3. Data Source

This study uses panel data spanning 31 Chinese provinces from 2002 to 2021. Specifically, data for the dependent variable (agricultural sustainable development) and control variables are sourced from the National Bureau of Statistics, EPS Database, and China Agricultural Statistical Yearbook. Data for the independent variable (rural population aging) is obtained from the China Population and Employment Statistical Yearbook, while threshold variable measurements (rural labor transfer) rely on provincial statistical yearbooks and the China Macro Statistical Database. Missing data were imputed using linear interpolation.

5. Empirical Results Analysis

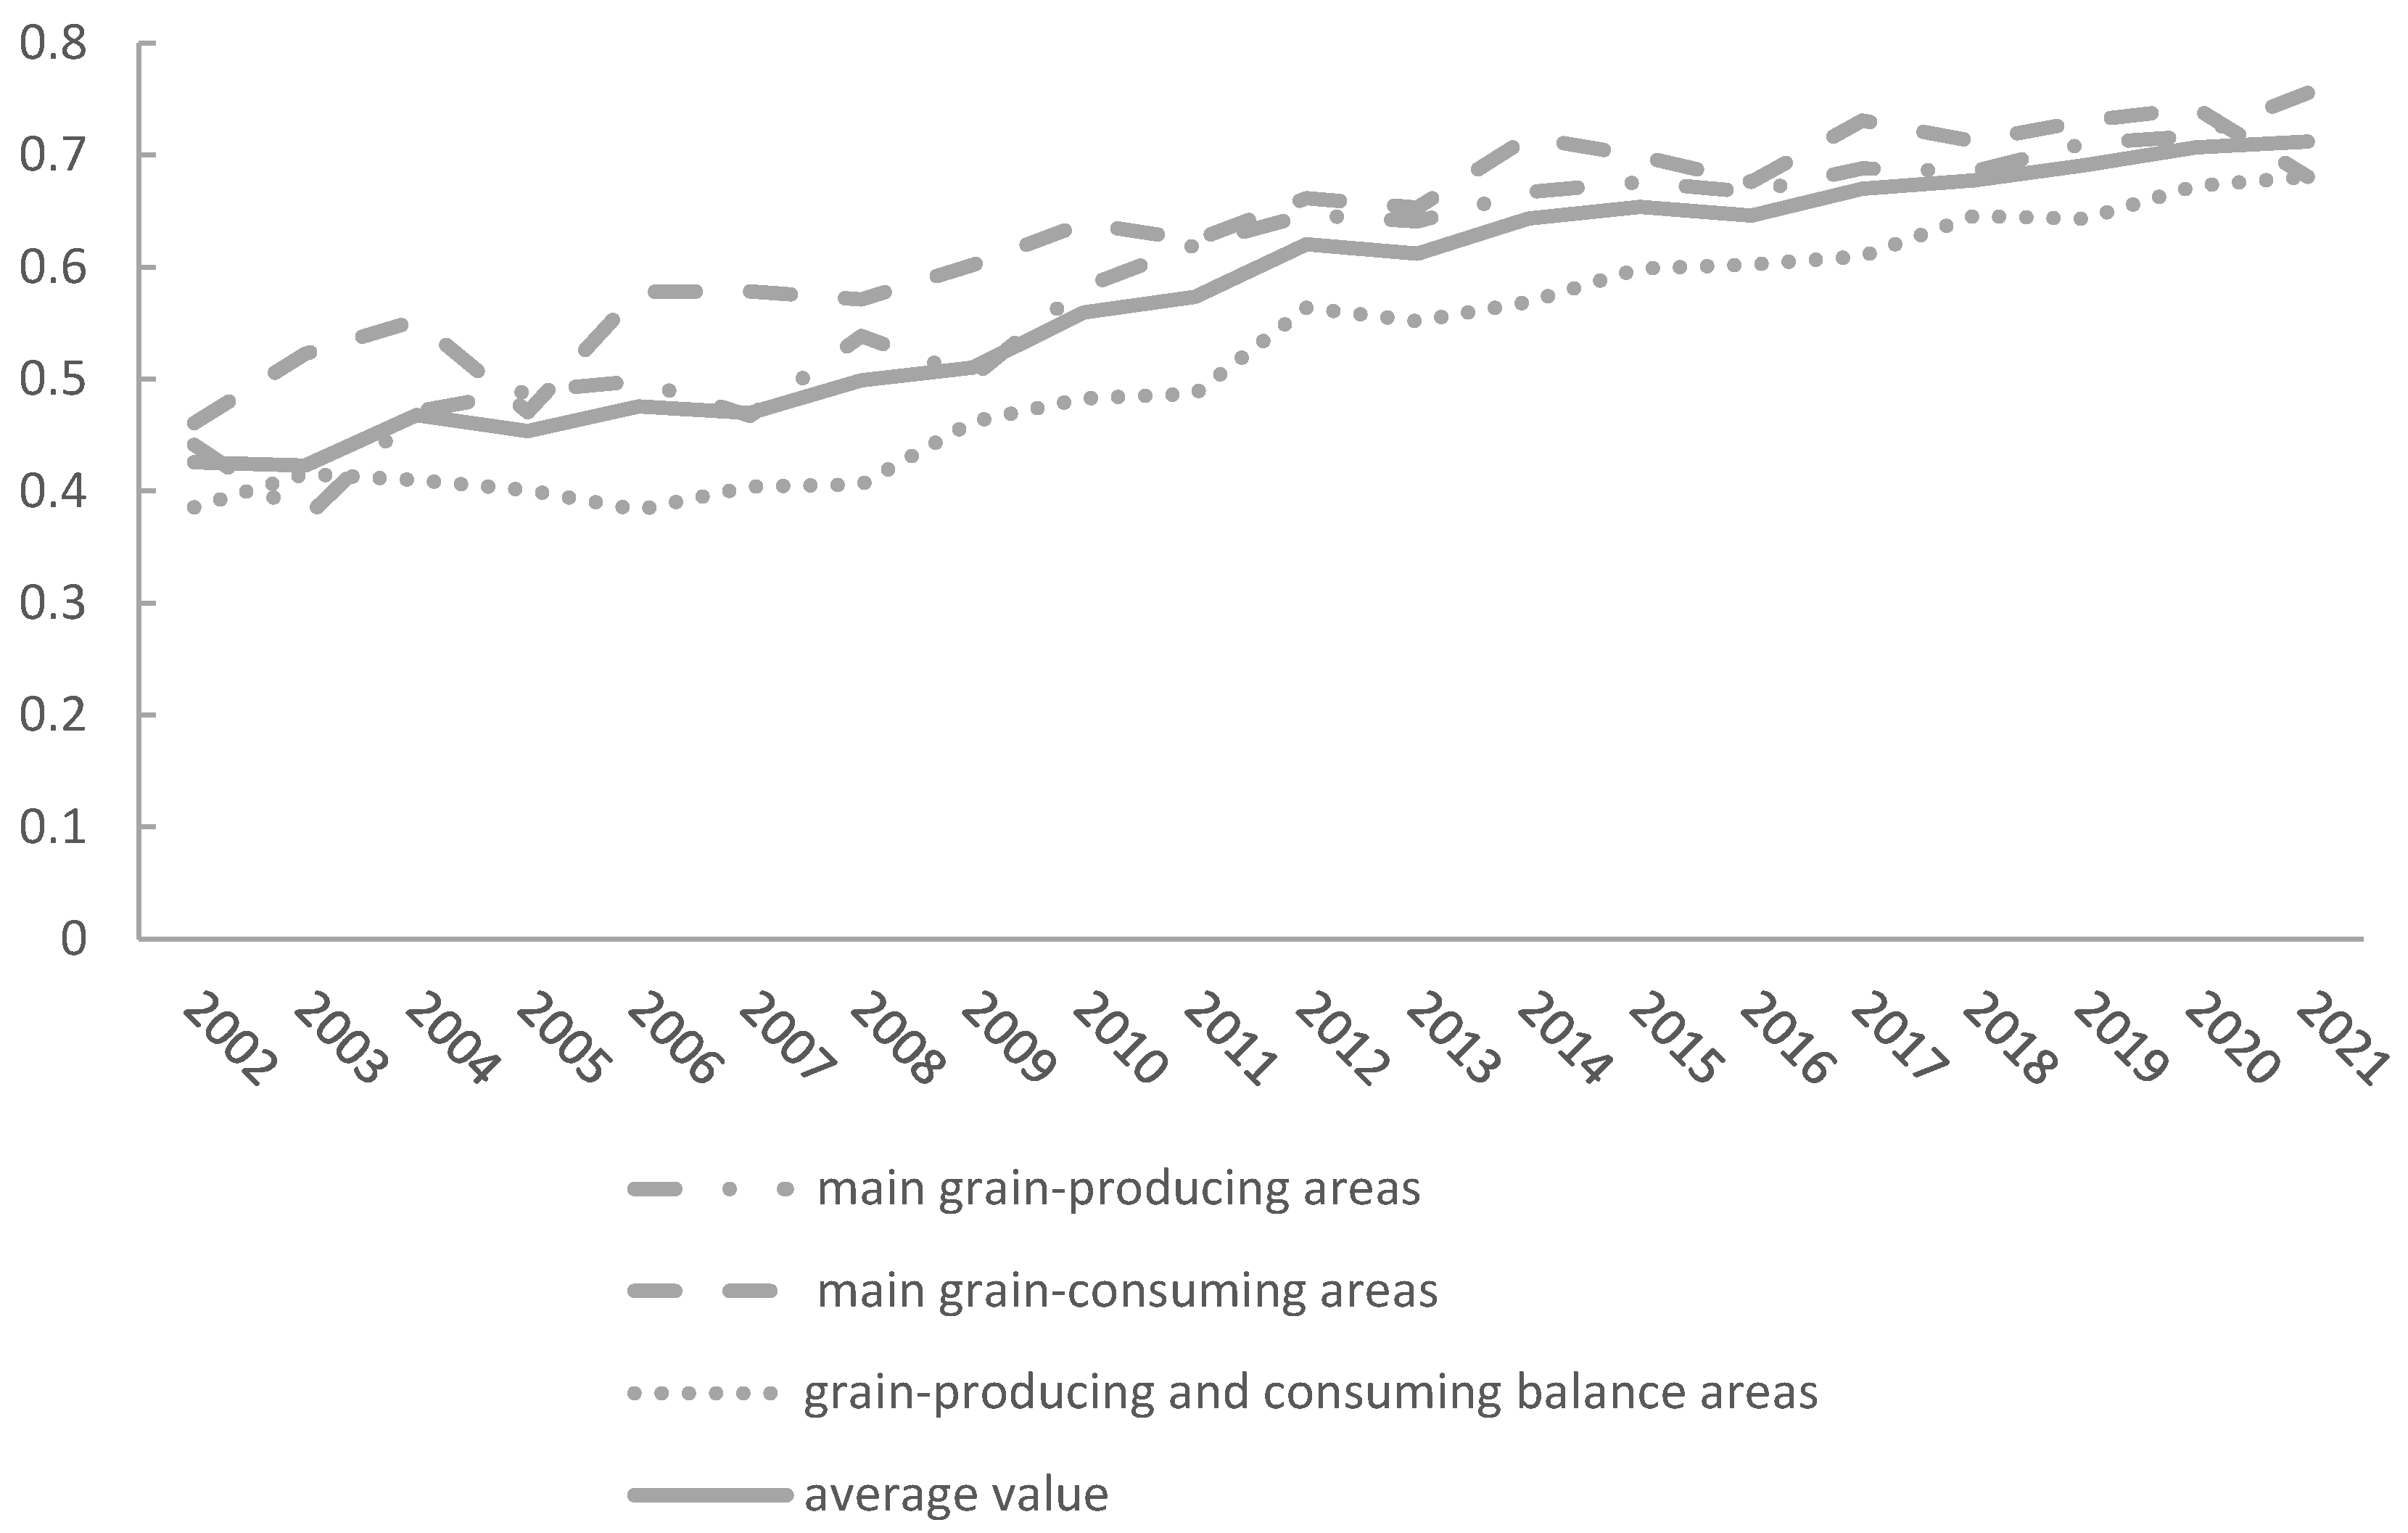
5.1. Agricultural Sustainable Development Index

Overall, China’s agricultural sustainable development ability improved steadily from 2002 to 2021 (Figure 1), with an average annual growth rate of 2.47%. The highest ASDI was recorded in 2021 (0.712), followed by 2020 (0.707), and the lowest appeared in 2003 (0.423). Regionally, the highest sustainability levels were found in the main grain-consuming areas, followed by grain-producing areas, with the grain production and consumption balance area exhibiting the lowest levels. From 2002 to 2021, the ASDI in all regions displayed a consistent upward trend. Notably, the grain production and consumption balance area consistently remains below the national ASDI average throughout the study period. This discrepancy is primarily attributed to significant regional heterogeneity in economic, social, and environmental systems, contributing to uneven rural agricultural sustainable development across regions. China’s main grain-consuming areas, such as Beijing and Tianjin, are economically developed and have adopted a large-scale breeding mode, relying on leading enterprises to foster agricultural industrialization. By leveraging advanced production factors and adhering to green, low-carbon development principles, these regions have achieved sustainable modern agricultural development. Shanghai and Zhejiang benefit from favorable agricultural resources and a higher level of agricultural development, enabling them to generate relatively greater economic returns. By contrast, although Fujian and Hainan possess abundant hydrothermal resources, they face severe soil erosion issues, which hinders their agricultural sustainable development compared to other main grain-consuming areas. Meanwhile, the main grain-producing areas, despite their fertile land resources, face ecological pressure due to intensive farming practices. The excessive use of pesticides and chemical fertilizers, coupled with the ongoing push toward mechanization, may explain their lower ASDI values. In addition, the grain production and consumption balance areas are constrained by less favorable water resources and geographic conditions. These areas often suffer from inefficient water usage, high agricultural production costs, and excessive resource consumption, all of which contribute to their lower sustainability levels.
To better understand the evolution of agricultural sustainable development at the provincial level, this study categorizes ASDI into three levels: low (Qi′ ≤ 0.6), medium (0.6 < Qi′ ≤ 0.7), and high (Qi′ > 0.7). Taking five-year intervals as analytical nodes, this study analyzes the spatio-temporal evolution of the agricultural sustainable development level across China’s 31 provinces and municipalities from 2002 to 2021 (Table 4).
Over the past two decades, the ASDI showed a clear upward trend nationwide. Specifically, in 2006, ASDI in 27 provinces and municipalities was at a low level. By 2021, only five provinces were still at a low level, while several others had advanced from medium to high levels. Temporally, starting from 2006, each five-year interval saw provinces transitioning from low to medium, or from medium to high ASDI levels. Spatially, by 2011, nine provinces—Hebei, Liaoning, Jilin, Heilongjiang, Jiangsu, Fujian, Shandong, Henan, and Guangdong—had reached a medium level. By 2016, more than half of all provinces had achieved this threshold, and Shanghai and Jiangsu were moving into a high level of agricultural sustainable development. Currently, China promotes agricultural production and quality improvement by shifting away from extensive development toward innovation-driven, green, and low-carbon emission models. For example, Shanghai’s relatively high ASDI may be attributed to its emphasis on modern agricultural development, continuous strengthening of agricultural technology and equipment support, and the sustained promotion of the integration of production, education, and research. This comprehensive approach has fostered new types of agricultural management entities, accelerated the transformation and application of agricultural technology, and strengthened the institutional framework for agricultural innovation. By 2021, although some provinces saw minor fluctuations in their ASDI, 5 provinces remained at the low level, while 26 provinces reached the medium level, an increase of 22 compared to 2006. Notably, Heilongjiang progressed from the medium to the high level in 2016. This improvement can be attributed to the emergence of Northeast China as a potential development area for livestock and poultry farming, which led to increased investment in supporting manure treatment facilities and the continued promotion of resource utilization of livestock and poultry waste, forming a cyclical development model of crop and livestock integration. In support of this transition, the General Office of the People’s Government of Heilongjiang Province issued the “Work Plan for Resource Utilization of Livestock and Poultry Breeding Waste” in 2017. This policy emphasizes increasing the resource utilization rate of livestock and poultry manure through safe treatment and localized application, thereby making a positive contribution to agricultural sustainable development.

5.2. Threshold Effect Test

To reduce heteroscedasticity and mitigate data volatility, the variable representing rural population aging, along with control variables such as effective irrigation and soil erosion, was log-transformed. Considering the potential nonlinear relationship between rural population aging and agricultural sustainable development under different scales of rural labor transfer, a panel threshold model was adopted. Before threshold regression, it was necessary to conduct a pretest to determine the number and values of thresholds. Using the Bootstrap method with 300 resampling iterations, this study identified rural labor transfer as the threshold variable. The results (Table 5) show that both the single and double thresholds of rural labor transfer pass the 1% significance level based on the F-statistics and p-values, while the triple threshold result is not statistically significant. This indicates that, driven by rural labor transfer, there is a double threshold for the impact of rural population aging on agricultural sustainable development. The estimated threshold values for rural labor transfer are 37.6210 and 58.1616, with corresponding 95% confidence intervals of [36.7153, 38.7334] and [56.8708, 58.8997], respectively.
Following the identification of two thresholds, the parameters of the nonlinear double-threshold model were estimated. The regression results (Table 6) reveal that rural aging exerts a positive and increasingly stronger effect on agricultural sustainable development as the labor transfer rate increases. From the view of estimated coefficients, it is evident that rural population aging has a nonlinear positive correlation with agricultural sustainability development. In the first regime, when the proportion of rural labor transfer is below 37.621%, the estimated coefficient is 0.082. At this stage, rural labor transfer is in its early phase, and rural population aging is emerging, but many of those migrants are part-time workers who engage in agricultural production at the same time. Moreover, their exposure to urban areas improves their awareness of ecological and environmental protection, thereby reducing behaviors harmful to the environment, and promoting agricultural sustainable development. As rural labor transfer increases (37.621% < labor transfer rate ≤ 58.1616%), the positive effect strengthens, with an impact coefficient of 0.123. At this stage, a portion of the migrant population has secured stable employment and higher income, enabling them to lease out their idle land. This helps prevent land abandonment, preserves arable land quality, and contributes to agricultural sustainability. When the labor transfer rate exceeds 58.1616%, the impact coefficient rises to 0.146. At this stage, labor transfer is at a high level, with most migrant farmers leasing out their land, leading to the scale-up of agricultural operations. Simultaneously, the adoption of mechanized production compensates for the labor shortage caused by rural population aging, further promoting agricultural sustainable development. The data used in this study spans from 2002 to 2021, a period that includes the global pandemic in 2020 and 2021. To account for pandemic effects and validate robustness, this study incorporates dummy variables for 2020 and 2021 as control variables in the threshold regression. The results, presented as Model 2 in Table 6, remain statistically significant, confirming the robustness of the findings.
In summary, as rural labor transfer intensifies, the positive effect of rural population aging on agricultural sustainable development also strengthens. This may be attributed to the fact that labor outflows exacerbate rural aging while reducing surplus rural labor. Moreover, rural labor transfer facilitates land consolidation [68], enabling farmers to adopt more efficient, large-scale operations and maintain agricultural sustainable development.

5.3. Labor Transfer Patterns and Agricultural Sustainable Development

Based on the identified threshold values, rural labor transfer levels are categorized into three stages: low, medium, and high. Changes in these levels are examined at five-year intervals (Table 7). In 2006, Guizhou, Yunnan, and Gansu were at the low labor transfer stage, 17 provinces and municipalities were at the medium level, and 11 provinces and municipalities were at the high level. By 2011, only Guizhou remained at the low rural labor transfer stage, while Yunnan and Gansu had progressed to the medium transfer stage from the rural labor low transfer stage of 2006. And the provinces such as Hebei, Heilongjiang, Anhui, Chongqing, Shaanxi, and Qinghai advanced from the medium to the high transfer stage. By 2016 and 2021, no provinces remained in the low labor transfer stage. In 2016, the number of provinces at the medium stage decreased from 13 to 6, while those at the high stage increased by 8. By 2021, only Yunnan and Gansu remained in the medium transfer stage, with all other provinces transitioning to the high transfer stage. It can be observed that from 2006 to 2021, provinces such as Guizhou, Yunnan, and Gansu—situated in the grain production and consumption balance area—maintained relatively low levels of rural labor transfer, and their levels of agricultural sustainable development were not as high as those of provinces with higher levels of rural labor transfer. Related studies have demonstrated that Zhejiang exhibits higher levels of agricultural sustainable development than Guangxi, while Guangxi outperforms Gansu in this regard [10]. According to this study’s classification, from 2002 to 2021, Zhejiang experienced the highest level of rural labor transfer, followed by Guangxi and then Guizhou, indicating that the higher level of labor transfer is associated with a higher degree of agricultural sustainable development. It is worth noting that some studies have pointed out that the guiding role of Zhejiang’s social-population sustainability index in its agricultural sustainable development has significantly diminished. However, Zhejiang’s recognition as China’s pilot demonstration zone for agricultural sustainable development is closely tied to its overall agricultural sustainability capabilities. Undoubtedly, the cultivation of new types of agricultural operating entities and co-operatives plays a crucial role in Zhejiang’s agricultural sustainable development [69]. In contrast, despite Gansu’s relatively low labor transfer rate, some studies argue that its slow natural population growth has caused fluctuations and declines in the agricultural population subsystem’s development level, resulting in inadequate human capital accumulation. Additionally, Gansu’s fragile natural resource base, shaped by its rugged terrain, restricts agricultural development, [70] contributing to its lower levels of agricultural sustainable development.
To gain a clearer understanding of how rural population aging interacts with rural labor transfer to influence agricultural sustainable development, a cross-analysis was conducted (Figure 2). As shown in the figure, rising levels of aging do not inhibit agricultural sustainable development. Instead, it positively promotes agricultural sustainable development. Moreover, the higher the proportion of rural labor transfer, the stronger the impact of aging on agricultural sustainable development. This pattern likely emerges because, as more rural residents migrate out, the remaining rural labor force becomes increasingly scarce., Migrants often transfer their land, leading to the expansion of the large-scale farming operations that enhance agricultural sustainable development. Additionally, rural labor transfer contributes to population aging in rural areas, which in turn drives mechanization to improve agricultural production efficiency, thereby further promoting agricultural sustainable development.

6. Conclusions and Implications

6.1. Conclusions

This paper constructs an indicator system to measure ASDI in China and empirically analyzes how rural population aging influences agricultural sustainable development using a panel threshold regression model. The research findings are as follows:
First, from 2002 to 2021, China’s ASDI showed an upward trend. Temporally, several provinces had transitioned from the medium to the high level of agricultural sustainable development. Regionally, the highest ASDI levels were observed in China’s main grain-consuming areas, followed by the main grain-producing areas, with the lowest levels found in grain production and consumption balanced areas. Second, the panel threshold regression results, using rural labor transfer as the threshold variable, reveal a significant nonlinear double-threshold of rural population aging on agricultural sustainable development. The regression results indicate that the impact of rural population aging on agricultural sustainable development is consistently positive and intensifies as the scale of labor transfer increases. Third, cross-analysis of rural labor transfer, population aging, and agricultural sustainable development further confirmed that higher levels of labor transfer are associated with more advanced levels of agricultural sustainable development.

6.2. Implications

Although China’s agricultural sustainable development is generally improving, significant regional disparities remain. Moreover, rural population aging demonstrates a nonlinear and positive effect on the level of agricultural sustainable development. With regard to these findings, the following recommendations are proposed to promote agricultural sustainable development in the context of the ongoing transfer of rural labor to urban areas, which exacerbates rural aging:
First, promote the scale-up of agricultural operations and increase farmers’ income. As labor transfer increases, the positive effect of rural population aging on agriculture sustainable intensifies. This is primarily because the outflow of rural labor accelerates aging, resulting in a shortage of surplus rural labor. On one hand, this encourages farmers to lease out their land, promoting large-scale agricultural operations. On the other hand, the lack of labor and rising aging levels drive the development of agricultural mechanization, which further supports agricultural sustainable development. In this context, it is crucial to actively promote the expansion of agricultural scale. The government should strengthen the regulatory framework for land transfer, optimize the pricing and durations of land leases, and protect the rights and interests of both land transferees and transferors. Additionally, efforts should be made to increase farmers’ income, encourage the adoption of mechanized farming, and foster a virtuous cycle between income growth and mechanization to advance agricultural sustainable development.
Second, adopt region-specific strategies and implement targeted sustainability initiatives. Although ASDI levels have generally increased across China’s 31 provinces and municipalities from 2002 to 2021, disparities in natural resources and the level of economic development persist. To advance more targeted models for agricultural sustainable development, it is essential to formulate localized development plans that tackle unique regional challenges. While maintaining and improving the relatively high levels of agricultural sustainable development in main grain-consuming areas, greater emphasis should be placed on enhancing agricultural sustainable development in grain production and consumption balance areas and main grain-producing areas.
Third, strengthen diversified training and education to cultivate a new generation of professional farmers. As economic development progresses, there is a great demand for low-cost labor in the cities, and the higher income levels in the cities attract a large number of young and relatively educated rural workers to the cities. This outflow not only exacerbates rural aging but also reduces the overall educational level among rural residents, hindering the development of skilled professional farmers. To address this, enhancing human capital in the agricultural labor force is urgent, requiring industry–academia-research cooperation, rural-based training programs, and dedicated training institutions. These efforts should focus on cultivating a new type of professional farmer equipped with modern agricultural knowledge and skills. Meanwhile, to tackle the root causes of rural aging, more young laborers should be encouraged to participate in agricultural production and operations to revitalize rural agricultural development. Promoting agriculture through technology should be vigorously advanced, integrating technology as a production factor into agriculture, improving resource recycling efficiency, enhancing agricultural productivity, and driving agricultural sustainable development.

Author Contributions

Methodology, X.S.; Validation, X.S.; Resources, M.X.; Writing—original draft and editing, Y.L.; Writing—review & editing, S.H. For this paper, each author made different contributions. All authors have read and agreed to the published version of the manuscript.

Funding

Key Project of the National Social Science Fund of China (Research on the Social Mechanism of Rural Environmental Protection (project number: 24ASH010)).

Institutional Review Board Statement

Not applicable.

Informed Consent Statement

Not applicable.

Data Availability Statement

The data presented in this study are available on request from the corresponding author.

Conflicts of Interest

The authors declare no conflicts of interest.

References

  1. Brown, L.R. Building a Sustainable Society; WW Norton & Co: New York, NY, USA; London, UK, 1981. [Google Scholar]
  2. Sachs, J.D.; Schmidt-Traub, G.; Mazzucato, M.; Messner, D.; Nakicenovic, N.; Rockström, J. Six Transformations to achieve the Sustainable Development Goals. Nat. Sustain. 2019, 2, 805–814. [Google Scholar] [CrossRef]
  3. Zhou, J. Evaluation of Agricultural Green Development in the Yangtze River Economic Belt, Analysis of Regional Differences, and Optimization Pathways. Rural. Econ. 2021, 12, 99–108. [Google Scholar]
  4. Luo, P. Resource-saving and Environment-friendly Society Construction and Urban Agriculture Development. Res. Agric. Mod. 2009, 30, 655–658+677. [Google Scholar]
  5. Zhu, D.L. Farmers are Getting Ever More Distant from the Land—Land Transfer and the “Three Rights Separation” System. Soc. Sci. China 2020, 7, 123–144+207. [Google Scholar]
  6. Miao, J.Q.; Zhao, M.; Huang, G.Q. Comprehensive Evaluation and Empirical Analysis of Agricultural Sustainable Development in Southern Hilly and Mountainous Area. Chin. J. Agric. Resour. Reg. Plan. 2021, 42, 163–172. [Google Scholar]
  7. Tang, J.F.; Liu, J.L. Evaluation and Coupling Coordination Analysis of Provincial Agricultural Sustainable Development:A Case of 11 Provinces in the Yangtze River Economic Belt. Econ. Geogr. 2022, 42, 179–185. [Google Scholar]
  8. Cao, Y.P. Evaluation of Sustainable Development of Agriculture in Guangxi Based on Ecological Footprint Model. Chin. J. Agric. Resour. Reg. Plan. 2020, 41, 35–42. [Google Scholar]
  9. Wang, W.S.; Gao, Y.; Liu, H.Y.; Xing, L.; Yang, S.Q. Evaluation on the Agricultural Sustainable Development of Chengdu Based on Euclidean Distance Theory. Chin. J. Agric. Resour. Reg. Plan. 2019, 40, 209–215. [Google Scholar]
  10. Zhang, L.G.; Bao, B.F.; Yang, S.S. Spatial Exploratory Analysis of Agricultural Sustainable Development in China. Econ. Geogr. 2019, 39, 159–164. [Google Scholar]
  11. Zhao, D.D.; Liu, C.M.; Bao, B.F.; Xu, B. Agricultural Sustainable Development Ability Evaluation and Subsystem Coordination Degree Analysis—Take the Major Grain-Producing Areas of China as an Example. Econ. Geogr. 2018, 38, 157–163. [Google Scholar]
  12. Sun, Z.Y.; Wang, L.; Li, X.F. Population Aging, Socialized Agricultural Services and Agricultural High Quality Development. J. Guizhou Univ. Financ. Econ. 2022, 3, 37–47. [Google Scholar]
  13. Li, L.; Xu, W.X. Change of Agricultural Ecological Efficiency under Effect of Rural Population Aging. J. South China Agric. Univ. 2021, 20, 14–29. [Google Scholar]
  14. Wang, J.X.; Li, C.Z. Effect Mechanism of Rural Population Aging on Agricultural Production. J. South China Agric. Univ. 2020, 19, 60–73. [Google Scholar]
  15. Ma, Y.T.; Gao, Q.; Yang, X.D. Aging of Rural Labor Force and the Upgrading of Agricultural Industrial Structure:Theoretical Mechanism and Empirical Test. J. Huazhong Agric. Univ. 2023, 2, 69–79. [Google Scholar]
  16. Yan, A.Q.; Luo, X.F.; Huang, Y.Z.; Yu, W.Z.; Tang, L. Research on the Popularization of Green Production Technology Based on the Background of Aging—A Case Study of Biological Pesticide and Soil Testing Formula Fertilizer. Chin. J. Agric. Resour. Reg. Plan. 2021, 42, 110–118. [Google Scholar]
  17. Wei, J.S.; Song, H.Y. Does Ageing of Agricultural Labor Force Affect Grain Total Factor Productivity? Analysis Based on Fixed Observation Points in Rural Areas. J. Nanjing Agric. Univ. 2022, 22, 22–33. [Google Scholar]
  18. Wei, J.S.; Gao, M. How Does the Aging of Agricultural Labor Force Affect the Growth of Total Factor Productivity of Wheat? Chin. Rural Econ. 2023, 2, 109–128. [Google Scholar]
  19. Jiang, C.Y.; Zhang, Y. Rural Population Aging, Agricultural Producer Services and Agricultural Technical Efficiency. World Agric. 2022, 6, 90–100. [Google Scholar]
  20. Liu, C.K. Rural Population Aging and Regional Heterogeneity of Agricultural Total Factor Productivity. J. South China Agric. Univ. 2021, 20, 46–55. [Google Scholar]
  21. Peng, W.Z.J. The Influence of the Rural Aging Workforce on the Technology Selection and Technical Efficiency of Farmers. Econ. Geogr. 2021, 41, 155–163. [Google Scholar]
  22. Qiu, J.J.; Ren, Q.; Yu, J. Aging of Agricultural Labor, Agricultural Capital Investment and Land Use Efficiency: Based on A Longitudinal Survey of Farmers in Shandong, Henan and Anhui. Resour. Sci. 2019, 41, 1982–1996. [Google Scholar] [CrossRef]
  23. Tang, X.P.; Jiang, J. lmpact of Rural Population Aging on High-Quality Agricultural Development. J. South China Agric. Univ. 2023, 22, 45–56. [Google Scholar]
  24. Jin, S.R.; Wang, P.P. Population Aging, Farmland Transfer and Agricultural Green Total Factor Productivity. Macro Econ. 2023, 1, 101–117. [Google Scholar]
  25. Chen, C.; Wu, W.C. Analysis on the Influence Mechanism of Population Aging on Agricultural Technological Progress. Chin. J. Agric. Resour. Reg. Plan. 2021, 42, 231–238. [Google Scholar]
  26. Li, Q.; Li, G.; Gao, X.; Yin, C. Analysis of Regional Gap and Spatital Convergence of Agricultural Total Factor Productivity Growth. Chin. J. Agric. Resour. Reg. Plan. 2019, 40, 28–36. [Google Scholar]
  27. Wu, H.; Huang, H.; He, Y.; Chen, W. Measurement, spatial spillover and influencing factors ofagricultural carbon emissions efficiency in China. Chin. J. Eco-Agric. 2021, 29, 1762–1773. [Google Scholar]
  28. Li, J.P.; Feng, Z.C.; Wu, Q.H. Does the Aging of Labor Hinder Agricultural Production? Empirical Analysis Based on Spatial Measurement Method. J. Nanjing Audit Univ. 2018, 15, 103–111. [Google Scholar]
  29. Skeldon, R. Ageing of Rural Populations in South-East and East Asia; FAO/SDWP: Rome, Italy, 1999. [Google Scholar]
  30. Liao, L.L.H.; Gao, X.; Ma, E. Effects of land use transitions and rural aging on agricultural production in china’s farmingarea: A perspective from changing labor employing quantity in the planting industry. Land Use Policy 2019, 88, 104152. [Google Scholar] [CrossRef]
  31. Zhou, H. The Pattern of Age-specific Migration Rate of Floating Population and Its Changes in China. J. East China Norm. Univ. 2023, 55, 185–201+206. [Google Scholar] [CrossRef]
  32. Meng, X.J.; Jiang, K.D. The Impact of Urbanization on China’s Future Rural and Urban Age Structure. Popul. Res. 2018, 42, 39–53. [Google Scholar]
  33. Lu, J.H.; Guo, R.R. Aging of Rural Labor Force in the Context of Rural Revitalization:Development Trends, Mechanism Analysis, and Response Paths. J. China Agric. Univ. 2023, 40, 5–21. [Google Scholar] [CrossRef]
  34. Xie, L.H. Employment of Rural Labor Force in the 14th Five-year Plan Period: Situation Outlook, Structure Forecast and Thought Countermeasure. Issues Agric. Econ. 2021, 3, 28–39. [Google Scholar] [CrossRef]
  35. Li, M.; Zhao, L.G. The Impact of Rural Labor Migration on the Formation of Agricultural Labor Force Aging: An Em-pirical Analysis Based on Liaoning Province. Chin. Rural Econ. 2010, 9, 68–75. [Google Scholar]
  36. Zhou, H. The Stability of Migration Pattern in China and Related lssues: Consideration Based on the Data of Seventh National Census Bulletin. Chin. J. Popul. Sci. 2021, 3, 28–41+126–127. [Google Scholar]
  37. Fan, D.J.; Zhu, Y.Z. An Inquiry of Rural Labor Force Outflow on the Aging’s Effects of Agricultural Labor Force. Northwest Popul. J. 2012, 33, 104–109. [Google Scholar] [CrossRef]
  38. Kang, J.J.; Wu, F.W. The Impact of Steady Flow of Rural Labor Force in China on Rural Aging:Empirical Analysis Based on the Data from 2009–2021 Thousand-village Survey. J. Financ. Econ. 2024, 50, 78–92. [Google Scholar]
  39. Policy Research Institute, Agricultural Trade Promotion Center, Ministry of Agriculture and Rural Affairs of China; Division of International Intelligence Research, Institute of Agricultural Information, Chinese Academy of Agricultural Sciences. Sustainable agriculture, along with food security and nutrition, is critical to achieving the 2030 Sustainable Development Goals (SDGs). World Agric. 2015, 11, 236–237. [Google Scholar]
  40. Xie, M.J. Challenges and Countermeasures for the Development of Agricultural Industry under the Background of Population Aging: A Case Study of Guizhou Province. China South. Agric. Mach. 2022, 53, 93–95+99. [Google Scholar]
  41. Zhang, S.; Tian, X.; Wang, S. Impact of aging agricultural labor on mechanization and technical efficiency in wheat production: A perspective analysis based on landforms. J. China Agric. Univ. 2018, 23, 174–182. [Google Scholar]
  42. Yang, Y.L.R. Labor transfer, factor substitution and constraints. J. Nanjing Agric. Univ. Soc. Sci. Ed. 2015, 15, 44–50. [Google Scholar]
  43. Lu, Q.P. Study on the Influence of the Aging of Rural Population on Agricultural Economy in China. Reform. Strategy 2016, 32, 88–91. [Google Scholar] [CrossRef]
  44. Zhang, H.S. The Impact of Rural Population Aging on Sustainable Agricultural Development in China. Agric. Econ. 2022, 4, 83–85. [Google Scholar]
  45. Zhou, Y.B.; He, K.; Zhang, J.B.; Cheng, L.L. Growth, Structural and Distribution Effects of Agricultural Mechanization on Farmers’ Income. J. Sichuan Agric. Univ. 2019, 37, 723–733. [Google Scholar]
  46. Li, Z.; Wang, W.F.; Feng, L.T. The Impact of Land Transfer Policies on Food Security. Financ. Econ. 2021, 3, 94–105. [Google Scholar]
  47. Cheng, X.; Xin, G.; Chen, R.; Li, C. lmpact of farmland transfer on agro-ecosystem. Chin. J. Eco-Agric. 2016, 24, 335–344. [Google Scholar]
  48. Charnes, A.; Cooper, W.W.; Rhodes, E. Measuring the efficiency of decision making units. Eur. J. Oper. Res. 1978, 2, 429–444. [Google Scholar] [CrossRef]
  49. Li, B.; Zhang, W.Z.; Yu, J.H. Decomposition and Influence Factors of District Difference of China Agricultural Production Efficiency Under the Constraint of Carbon Emission. Econ. Geogr. 2016, 36, 150–157. [Google Scholar]
  50. Diakoulaki, D.; Mavrotas, G.; Papayannakis, L. Determining Objective Weights in Multiple Criteria Problems: The CRITIC Method. Comput. Oper. Res. 1995, 22, 763–770. [Google Scholar] [CrossRef]
  51. Zhang, L.J.; Zhang, X. A weighted clustering method based on the CRITIC method. Stat. Decis. 2015, 22, 65–68. [Google Scholar]
  52. Fu, W.; Chu, L. Research on the Evaluation of High Quality Development of Manufacturing Industry From the Perspective of lntegration of theYangtze River Delta—TOPSIS Evaluation Model Based on lmproved CRITICAL-Entropy Weight Method. J. Ind. Technol. Econ. 2020, 39, 145–152. [Google Scholar]
  53. Wu, Z.; Guan, J.; He, J. An Empirical Study on the Calculation of Minimum Wage Standard—Dynamic Combination Calculation Based on Objective Weight of CRITIC-Entropy Weight Method. Mod. Econ. Sci. 2019, 41, 103–117. [Google Scholar]
  54. Tzeng, O.S.G.H. Compromise solution by MCDM methods: A comparative analysis of VIKORand TOPSIS. Eur. J. Oper. Res. 2004, 156, 445–455. [Google Scholar]
  55. Yao, Y.; Luo, P.; Li, J.L.; Chang, J.B.; Zhao, F. Comprehensive assessment on soil quality in Jiamakou Yellow Irrigation District using VIKOR method. J. Arid Land Resour. Environ. 2023, 37, 133–140. [Google Scholar]
  56. Hansen, B. Threshold effects in non–dynamic panels: Estimation, testing and inference. J. Econom. 1999, 93, 345–368. [Google Scholar] [CrossRef]
  57. Brown, B.J.; Hanson, M.E.; Liverman, D.M.; Merideth, R.W. Global Sustainability: Toward Definition. Environ. Manag. 1987, 11, 713–719. [Google Scholar] [CrossRef]
  58. He, Y.; Wu, J.; Zhou, G.; Zhou, B. Discussion on Rural Sustainability and Rural Sustainability Science. Acta Geogr. Sin. 2020, 75, 736–752. [Google Scholar]
  59. Zhang, C.; Yang, Y.Z.; Feng, Z.M.; Lang, T.T.; Liu, Y. Spatio-temporal Patterns of the Land Carrying Capacity in the Belt and Road Region Based on Human-Cereals Relationship. J. Nat. Resour. 2022, 37, 616–626. [Google Scholar] [CrossRef]
  60. Wang, Y.F.; Wang, J.X.; Li, Y. Study on Temporal and Spatial Evolution Pattern of Land Resources Carrying Capacity in Shaanxi Province. J. Northwest Univ. 2023, 53, 541–553. [Google Scholar]
  61. Xu, X.Y.; Dong, H.Z.; Pang, M. Analysis on the Spatio-Temporal Evolution Characteristics and Driving Factors of Agricultural Carbon Emission Efficiency in Three Northeastern Provinces of China. Chin. J. Environ. Manag. 2023, 15, 86–97. [Google Scholar]
  62. Tian, Y.; Zhang, J.B. Regional Differentiation Research on Net Carbon Effect of Agricultural Production in China. J. Nat. Resour. 2013, 28, 1298–1309. [Google Scholar]
  63. IPCC. Climate Change 2013: The Physical Science Basis. Contribution of Working Group I to the Fifth Assessment Report of the Intergovernmental Panel on Climate Change; Cambridge University Press: Cambridge, UK, 2013. [Google Scholar]
  64. Tong, Y.F. Changes and Challenges of Labor Supply in China in the Context of Population Ageing. Popul. Res. 2014, 38, 52–60. [Google Scholar]
  65. Wu, S.L. The Contribution of Agricultural Labor Migration to Economic Growth in China. Econ. Res. J. 2016, 51, 97–110. [Google Scholar]
  66. Xu, J.G.; Zhang, X. The Progress of Agricultural Productivity, the Transfer of Labor and the Linkage Development of Industry and Agriculture. J. Manag. World 2016, 7, 76–87+97. [Google Scholar]
  67. Wu, J.Q.; Liu, T.; Mao, Z.G.; Wang, H.J. Toward Common Prosperity in the Flow: An Analysis of Spatial Spillover Effect of Rural-to-Urban Labor Transfer. Financ. Trade Econ. 2023, 44, 108–125. [Google Scholar]
  68. Gao, J.S.; Song, G. lmpact of Rural Labor Transfer Scale on Farmland Transfer. Econ. Geogr. 2020, 40, 172–178. [Google Scholar]
  69. Fu, L.L.; Mao, X.B.; Mao, X.H.; Li, H.T.; Wang, J. Comprehensive Evaluation on Sustainable Development Level of Agriculture and Regional Difference in Zhejiang Province: Based on High-Quality Development Perspective. Acta Agric. Zhejiangensis 2020, 32, 1880–1889. [Google Scholar]
  70. Ding, W.G.; Ye, W.F.; Mi, X.; Wei, Y.L. A Quantitative Research of Coupled Relationship between Disasters and Poverty in Different Geographic Regions in Gansu Province. Econ. Geogr. 2013, 33, 28–35. [Google Scholar]
Figure 1. Time-series evolution of the Agricultural Sustainability Index (ASI). Note: In 2001, China classified its 31 provinces into three major functional zones, including main grain-producing areas, main grain-consuming areas, and grain self-sufficient areas, based on the overall characteristics of grain production and consumption in each province, while also considering differences in resource endowments and historical traditions of grain production. Main grain-producing areas include 13 provinces: Heilongjiang, Jilin, Liaoning, Inner Mongolia, Hebei, Henan, Shandong, Jiangsu, Anhui, Jiangxi, Hubei, Hunan, and Sichuan. Grain self-sufficient areas consist of 11 provinces: Shanxi, Ningxia, Qinghai, Gansu, Tibet, Yunnan, Guizhou, Chongqing, Guangxi, Shaanxi, and Xinjiang. Main grain-consuming areas comprise 7 provinces: Beijing, Tianjin, Shanghai, Zhejiang, Fujian, Guangdong, and Hainan.
Sustainability 17 04738 g001
Figure 2. Cross-analysis of rural labor transfer, population aging, and agricultural sustainable development.
Sustainability 17 04738 g002
Table 1. Evaluation system of agricultural sustainable development.
SubsystemsIndicatorFormulaUnitWeightsAttribute
EcologicalArable Land Area Per CapitaTotal crop sown area/rural population ha/
person
0.050493forward
Disaster RateAffected area/crop sown area%0.009766negative
Forest Cover Rate %0.048741forward
Agricultural Plastic Film Usage IntensityPlastic film usage/crop sown area t/ha0.008589negative
Pesticide Usage IntensityPesticide usage/crop sown areat/ha0.008975negative
Intensity of Fertilizer UseFertilizer usage/sown areat/ha0.013594negative
Agricultural Water Usage Per Unit AreaCubic meters/hectare 0.012235negative
Land Carrying Capacity Index (LCCI)See Equations (4) and (5) 0.120633forward
Agricultural Carbon Emission Efficiency (ρ)See Equation (1) 0.0227forward
EconomicLand ProductivityTotal grain output/grain crop sown area t/ha0.027647forward
Agricultural Output Value per Unit AreaTotal agricultural output/crop sown areaYuan/
ha
0.055188forward
Per Capita Agricultural Production ValueTotal output value of farming, forestry, animal husbandry, and fishery/rural populationYuan/
person
0.057245forward
Total Mechanical Power Per Unit AreaTotal mechanical power/crop sown area kW/ha0.05031forward
Grain Output per Capita kg/
person
0.058564forward
Share of Value Added of the Primary Sector in Regional GDP %0.035402forward
Proportion of Intermediate Agricultural Consumption in Output ValueValue of intermediate agricultural consumption/agricultural added value%0.020173negative
SocialRural electricity consumption per capitaElectricity consumption/rural populationkWh/
person
0.228688forward
Proportion of Workforce in Farming, Forestry, Animal Husbandry, and FisheryEmployed in agriculture, forestry, animal Husbandry, and fisheries (in 10,000 persons)/total rural population%0.024004forward
Per Capita Disposable Income Of Rural Households Yuan/
person
0.061523forward
Engel’s Coefficient For Rural Households %0.015603negative
Number Of Rural Doctors And Health Workers Per 1000 Rural Population Rural doctors and health workers/rural populationman0.035016forward
Urban–rural Income Comparison (Rural = 1) Yuan/
person
0.009797negative
Human Resources for AgricultureRural population/total population%0.025114forward
Table 2. Indicator system for measuring agricultural carbon emission efficiency.
Indicator TypeSpecific IndicatorsUnit
InputLabor ForceNumber of Employees in Agriculture, Forestry, Animal Husbandry, and Fisheriespeople
MachineryTotal Power of Agricultural MachinerykW
FertilizerAgricultural Fertilizer Usage (calculated as pure) (on a depreciated basis)t
Water SourceWater Use in Agriculturem3
LandTotal Crop Sown Area hm2
OutputDesired outputEconomic OutputGross Agricultural Output ValueYuan
Ecological OutputCrop Carbon Absorption (S)t
Undesired outputEnvironmental ConsumptionTotal Carbon Emissions (E)t
Table 3. Economic coefficients and carbon absorption rates for major crops.
VarietyEconomic CoefficientMoisture Content (%)Carbon Absorption RateVariety Economic CoefficientMoisture Content (%)Carbon Absorption Rate
Rice0.45120.414Cotton0.180.45
Wheat0.4120.485Tubers0.7700.423
Corn0.4130.471Sugarcane0.5500.45
Legumes0.34130.45Beet0.7750.407
Rapeseed0.25100.45Vegetables0.6900.45
Peanuts0.43100.45Tobacco0.55850.45
Table 4. Spatial and temporal evolution of agricultural sustainable development.
YearQi′ ≤ 0.60.6 < Qi′ ≤ 0.8Qi′ > 0.8
2006Hebei, Shanxi, Nei Mongol, Liaoning, Jilin, Heilongjiang, Jiangsu, Anhui, Fujian, Jiangxi, Shandong, Henan, Hubei, Hunan, Guangdong, Guangxi, Hainan, Chongqing, Sichuan, Guizhou, Yunnan, Tibet, Shaanxi, Gansu, Qinghai, Ningxia, and Xinjiang.Beijing, Tianjin, Shanghai, Zhejiang
2011Shanxi, Nei Mongol, Anhui, Jiangxi, Hubei, Hunan, Guangxi, Hainan, Chongqing, Sichuan, Guizhou, Yunnan, Tibet, Shaanxi, Gansu, Qinghai, Ningxia, Xinjiang.Beijing, Tianjin, Shanghai, Zhejiang, Hebei,
Liaoning, Jilin, Heilongjiang, Jiangsu, Fu
Jian, Shandong, Henan, Guangdong
2016Shanxi, Nei Mongol, Hubei, Hainan, Gansu, Qinghai, Ningxia, XinjiangBeijing, Tianjin, Zhejiang, Hebei, Liaoning, Jilin, Heilongjiang, Fujian, Shandong, Henan, Guangdong, Anhui, Jiangxi, Hunan, Guangxi, Chongqing, Sichuan, Guizhou, Yunnan, Tibet, ShaanxiShanghai, Jiangsu
2021Shanxi, Gansu, Ningxia, ShanghaiBeijing, Tianjin, Zhejiang, Hebei, Liaoning, Jilin, Fujian, Shandong, Henan, Guangdong, Anhui, Jiangxi, Hunan, Guangxi, Chongqing, Sichuan, Guizhou, Yunnan, Tibet, Shaanxi, Nei Mongol, Jiangsu, Hubei, Hainan, Qinghai, Xinjiang.Heilongjiang
Table 5. Threshold effect test for full sample.
Threshold VariablesThreshold NatureF-Statistics Valuep-Value10% Critical Value5% Critical Value1% Critical Value
laborsingle threshold27.980.006714.423617.898523.9845
double threshold210.0114.334216.388720.6246
triple threshold19.080.626752.175358.108978.5464
Table 6. Panel threshold regression model estimation results for full sample.
Variables and ParametersModel (1)Variables and ParametersModel (2)
lnx (labor ≤ 37.621)0.0816991 *** (0.0181755)lnx (labor ≤ 37.621)0.1107976 *** (0.0227035)
lnx (37.621 < labor ≤ 58.1616)0.1225365 *** (0.0145868)lnx (37.621 < labor ≤ 58.1616)0.1519046 *** (0.0184511)
lnx (labor > 58.1616)0.1467804 *** (0.0138183)lnx (labor > 58.1616)0.1754522 *** (0.0176342)
control variables
control the years of 2020 and 2021
Have
Not have
control variables
control the years of 2020 and 2021
Have
Have
R20.6705R20.6753
N620N620
Note: *** is significant at the significance level of 0.01; there are robust standard errors in brackets.
Table 7. Regional distribution of rural labor transfer in China, in 2006, 2011, 2016, and 2021.
YearLow Transfer
(Labor ≤ 37.621%)
Medium Transfer
(37.621% < Labor ≤ 58.1616%)
High Transfer
(Labor > 58.1616%)
2006Guizhou, Yunnan, GansuHebei, Nei Mongol, Jilin, Heilongjiang, Anhui, Henan, Hubei, Hunan, Guangxi, Hainan, Chongqing, Sichuan, Shanxi, Tibet, Ningxia, Qinghai, XinjiangBeijing, Tianjin, Shanxi, Liaoning, Shanghai, Jiangsu, Zhejiang, Fujian, Jiangxi, Shandong, Guangdong
2011Guizhou Nei Mongol Jilin, Henan, Hubei, Hunan, Guangxi, Hainan, Sichuan, Tibet, Ningxia, Xinjiang, Yunnan, Gansu.Beijing, Tianjin, Shanxi, Liaoning, Shanghai, Jiangsu, Zhejiang, Fujian, Jiangxi, Shandong, Guangdong, Hebei, Heilongjiang, Anhui, Chongqing, Shanxi, Qinghai
2016not haveNei Mongol, Guangxi, Xinjiang, Yunnan, Gansu, GuizhouBeijing, Tianjin, Shanxi, Liaoning, Shanghai, Jiangsu, Zhejiang, Fujian, Jiangxi, Shandong, Guangdong, Hebei, Heilongjiang, Anhui, Chongqing, Shanxi, Qinghai, Jilin, Henan, Hubei, Hunan, Hainan, Sichuan, Tibet, Ningxia.
2021not haveYunnan, GansuBeijing, Tianjin, Shanxi, Liaoning, Shanghai, Jiangsu, Zhejiang, Fujian, Jiangxi, Shandong, Guangdong, Hebei, Heilongjiang, Anhui, Chongqing, Shanxi, Qinghai, Jilin, Henan, Hubei, Hunan, Hainan, Sichuan, Tibet, Ningxia, Tibet, Guangxi, Guizhou, Xinjiang.
Disclaimer/Publisher’s Note: The statements, opinions and data contained in all publications are solely those of the individual author(s) and contributor(s) and not of MDPI and/or the editor(s). MDPI and/or the editor(s) disclaim responsibility for any injury to people or property resulting from any ideas, methods, instructions or products referred to in the content.

