Article

Effectiveness of Municipal Waste Collection and Management Policy in Lithuania

by
Viktorija Bobinaite
* and
Gediminas Naujokas
Lithuanian Energy Institute, Breslaujos Str. 3, LT-44403 Kaunas, Lithuania
*
Author to whom correspondence should be addressed.
Sustainability 2025, 17(10), 4623; https://doi.org/10.3390/su17104623
Submission received: 13 March 2025 / Revised: 10 May 2025 / Accepted: 12 May 2025 / Published: 18 May 2025

Abstract

:
This article addresses the scientific gap relating to the limited representation of municipal waste policies in quantitative assessments, as well as their goal to “catch up” economies in the context of SDG 12. The novelty of the paper is defined by the guidelines developed for the consistent logical research of the effectiveness of municipal waste collection and management policies. Herein, a Lithuanian case is considered, with the period of analysis ranging from 2012 to 2023. A review of the scientific literature, an analysis of waste policy, and statistical data analysis methods were applied. The statistical data analysis showed that, while waste generation was historically increasing in parallel with the growth in national income and was therefore inconsistent with the long-term goal to reduce waste, municipal waste, which remains present in a significant amount and makes up one-fifth of the waste structure, is decreasing by 2.0% a year, which is conducive to achieving the goal. An analysis of the municipal waste treatment structure revealed that the priority order of waste management is maintained, as ready-to-reuse and recycling are dominant (accounting for half of all municipal waste management activities), followed by incineration, which accounts for a third of all municipal waste management activities. The requirement to reduce municipal waste disposal in landfills is being successfully implemented. From 2012 to 2023, the proportion of municipal waste disposal in landfills significantly decreased, and it presently accounts for 8.0%, while the target value is 5% by 2030. Difficulties arise in implementing requirements to sort municipal waste and increase the share of ready-to-reuse and recycled waste. In 2023, 66% of municipal waste was mixed, and the share of sorted municipal waste is slowly increasing. A decrease in recycled and ready-to-reuse municipal waste has been observed since 2017. Food waste is a particular issue. A total of 100.9 kilotons of food was wasted in 2023; however, this value is 12.3% less than that of 2020. Other indicators are also analyzed in this article. The results show changes in unsustainable consumption habits and a shift towards responsible consumption in relation to the implemented municipal waste collection and management policy. In the future, it will be necessary to conduct research into the problems that are identified in this article in order to propose scientifically sound and responsible consumption solutions in the areas responding to SDG 12; this will increase the effectiveness of municipal waste collection and management policies.

1. Introduction

Resources are running out, but their prices are increasing. A significant amount of waste is produced every year, which negatively impacts the environment and human health. In response to this, the Member States of the United Nations (UN) reached an agreement regarding their Sustainable Development Goals (SDGs), particularly in relation to a change in unsustainable consumption habits towards responsible consumption (SDG 12), which has drawn particular attention to the waste sector [1]. Within SDG 12, eleven targets were announced, including achieving sustainable management; halving per capita global food waste; reducing waste generation through prevention, reduction, recycling, and reuse; saving and efficiently using natural resources; tailoring sustainable practices in business; providing people with relevant information; and increasing the awareness of sustainable development. National and local governments were called upon to implement and enforce related municipal waste management policies and establish monitoring systems, while scientists were made responsible for carrying out diverse research with the aim of identifying issues with municipal waste policies and finding solutions that contribute to achieving SDG 12 and its related targets. As a result, this paper focuses on assessing municipal waste management policies that are oriented towards the implementation of SDG 12 and the achievement of related targets; this assessment will be made with regard to a particular set of effectiveness criteria.
It has to be acknowledged that SDG 12 is essentially diverse in its prominent topics. In detail, it includes community-supported agriculture, local food systems, plastic waste, and greenhouse gas (GHG) and soil emissions, which were identified as emerging or declining topics by the authors of [2]. Additionally, it also discusses environmental pollution, medical waste, COVID-19, anaerobic digestion, biofuels, methane production, electric cars, and alternative-fuel vehicles, which are referred to as niche topics that show growth potential [2]. Furthermore, the municipal waste and waste management topics, which have been described as being older and well-researched topics that lack sufficient visibility and scientific attention [2], and the circular economy and sustainable development topics, which were categorized as the fastest-growing topics that have received requests for additional evaluations, are explored [2]. SDG 12 has been said to influence various SDGs, ranging from 4 of them to all 17 SDGs [3]. This is in line with the findings of the authors of [2], who found significant synergies between SDG 12 and other SDGs, including SDG 13 (climate action), SDG 7 (affordable and clean energy), SDG 11 (sustainable cities and communities), and SDG 15 (life on land).
In relation to municipal waste policy and SDG 12, the literature review (Section 2) allowed us to identify several scientific gaps. Specifically, it remained unclear how the factors of [4,5,6] and barriers to [7] municipal waste were reflected and linked to historical amounts of municipal waste. These questions suggest a need to carry out a retrospective analysis of municipal waste policies, comparing them to established SDG 12 and national targets. Secondly, scientists have applied sophisticated research methods to analyze municipal waste policies and their causal links with the economy and the environment [8,9,10,11,12,13]. Some methods are difficult to understand and use for wider groups of stakeholders, including policymakers; as such, simpler but accurate assessment methods based on indicator analysis are appreciated. Thirdly, due to differences in municipal waste policies and economic development in different countries, a regional approach to analysis became relevant [14]. Fourthly, municipal waste policies in developed and developing countries have been addressed in the global literature [11]. Due to the small sample size, the insignificant global impacts, and the lack of examples of good practice, rapidly developing European Union (EU) “catching up” economies [14,15] have rarely been separately investigated or have only been studied in the context of EU Member States (MSs). Fifthly, municipal waste policy was studied in the context of various SDGs [2,3]; however, when it comes to national studies and SDG 12, the amount of research is limited.
The identified research gaps were filled by studying the case in Lithuania. This is a special case because Lithuania is considered to be a “catching up” economy in the EU [15] or an economically developing EU country that is characterized by a small amount of generated municipal waste and by the low ecological efficiency of the functioning of its management system [14]. Its municipal waste management system is under development and is in need of improved efficiency [14]; therefore, a comprehensive assessment of its current state is of high importance.
Lithuania’s vision for the future—“Lithuania 2050” [16]—has recently been approved. It primarily focuses on an ecocentric approach and calls for the restoration of a sustainable relationship between humanity and the environment. Within the scope of this vision, a sound, sustainable development direction is planned to be implemented. At the local level, climate change mitigation and adaptation solutions are foreseen and adjusted to the targets determined by the National Climate Change Management Agenda [17]. In the field of waste, by 2030, it is expected to reduce GHG emissions by at least 65% compared to 2005, if food waste, landfill disposal, and recycling issues are solved. “Lithuania 2050” is supported by the National Progress Plan “Lithuania 2030” [18], which requests to ensure the environmental quality and sustainable use of natural resources, protect biological diversity, mitigate the country’s impact on climate change, and increase resilience. Its strategic objective is to develop Lithuania’s territory sustainably, while reducing the regional divide. Thus far, no data are available on the achievements of SDG 12 [18] in Lithuania; little is known about the achievements relating to the implementation of the waste management policy. Notably, there is a lack of analysis of municipal waste generated by households, which is widespread and is a socially significant contributor to waste. This is in line with the global findings of the authors of [19,20], who stated that there is an under-representation of quantitative assessments of waste and municipal policies in the literature.
Taking into account the diversity of the literature and its limitations when it comes to Lithuania’s “catching up” economy, this paper aims to answer the following scientific question: How can we assess the flourishing and improved sides of municipal waste collection and management policies from the perspective of SDG 12 by taking into account the national specificity of the “catching up” economy?
This paper aims to assess the municipal waste collection and management policy, considering a set of effectiveness criteria, in order to identify effective processes and a prosperous and changed policy outcome by analyzing the Lithuanian case from 2012 to 2023. The aim of this paper was formed in response to the established methods for the implementation of the SDG 12 targets, which are to strengthen scientific capacity and develop tools to monitor sustainable development impacts.
The assessment is carried out by applying methods such as a systematic review of the scientific literature, an analysis of the critical state of municipal waste policy regulations, and statistical data analysis.
The novelty of this paper is to develop a set of guidelines for consistent and logical research into the effectiveness of municipal waste collection and management policies. Firstly, additional indicators are supplemented by municipal waste policy indicators, which are monitored by the Lithuanian State Waste Prevention and Management Plan [21]. This allows us to look more closely at the relationship between policy goals and practice. Secondly, we cover the latest available historical data in our research. Thirdly, structural and trendline analysis methods are applied to highlight the significance of the issues of the municipal waste policy and its retrospective tendency, presenting ideas for progress or areas that need to be corrected.
The remainder of this paper is organized as follows. Section 2 discusses the global literature and details the gaps that are present. Section 3 describes the object of research, the data used, the period analyzed, the assessment criteria, the assessment approach applied, the effects assessed, and the indicators and biases, as well as proposing two-step guidelines for research performance. Section 4 introduces pre-research results, including policies, goals, and outcome indicators, as well as presenting the results of key research. Section 5 briefly discusses these results. Finally, Section 6 presents the conclusions.

2. Literature Review

Worldwide, the literature relating to the analysis and assessment of municipal waste management policies is increasing. It is divided into research categories, which assess existing policies that are dedicated to reshaping or searching for alternative solutions relating to waste management. Furthermore, it is diverse in relation to the sustainability or circularity aspects that are discussed, the municipal waste treatment process or particular types of waste researched, the approaches and methods applied, the territorial and organizational level assessed, and the period covered, among other aspects. The following literature review aims to disclose a variety of studies.
The first group of papers focuses on understanding the factors of municipal waste for the formation of an effective municipal waste policy [4,5,6] and related policy barriers [7]. In [4], various factors affecting waste generation behavior across individuals, households, and communities were considered. Specifically, scientists stated that income, education, demographics, health, ethnicity, economic activity, and financial factors were relevant explanatory variables. In [5], various factors relating to municipal waste generation were analyzed and an effective municipal waste management policy at different territorial levels in Czech was proposed. Among the factors studied, only age was found to be a common significant factor at all territorial levels. This led to the conclusion that no single municipal waste policy would be effective at all territorial levels. Thus, effective policies are territorial in nature. In [6], the factors of a specific kind of municipal waste were systematically reviewed. In detail, routine food waste practices and factors that promote and inhibit the generation of food waste in the household were reviewed. This included socio-demographic and psycho-social factors playing a relevant role in food waste generation. The results were relevant when designing food waste prevention strategies, including information campaigns, taxes and fees on food, educational programs, communication campaigns, smart fridges, reducing the amount of packaging, sharing food, etc. In [7], the barriers to a waste management policy in the capital of Mozambique were reviewed. Scientists found that deficient institutional frameworks, political interferences, and weak stakeholder relationships were essential barriers. The results were relevant from the perspective of the outcomes of addressing any of the identified barriers. Although the results were significant for the design of an effective municipal waste policy, they do not yet determine a direct link between the policy being in place and the targeted amount of municipal waste collection and treatment.
The second group of papers sets causality relationships between economy, waste, socio-demographic conditions, and the environment by applying various advanced scientific techniques that require specific knowledge [8,9,10,11,12,13,14,22,23]. While these methods were understood by certain groups of individuals, particularly scientists, policymakers, and the general public, they demanded the selection and application of simpler methods. Many years of experience working with different stakeholders have demonstrated that indicator analysis is well tolerated by stakeholders and is valuable for policymakers in relation to decision-making. Furthermore, the findings of the research were contradictory; no direct links were established between indicators. Therefore, clear statements cannot be made about which variables are the causes and which are the effects. Additionally, the strength of the causality was estimated to be different. This appealed to the fact that countries and regions are very unique in terms of municipal waste policy and research findings. Therefore, a municipal waste policy in each country or region should be individually implemented. This should be backed up with some examples of scientific research. Specifically, in [8], waste generation, incineration, recycling, and landfill dynamics concerning income, taking into account data from EU-25, were analyzed. Scientists found that, thus far, there is no clear de-linking tendency between waste generation and income; however, at the time of analysis, the waste elasticity-to-income ratio was set at a value lower than its previous values. The waste policy was effective because landfill disposal decreased, while recycling increased in the EU-25. EU-10 and EU-15 countries provided slightly different waste trends. This was in line with the findings of [14], where it was observed that the unequal level of economic development “gave birth” to contradictory trends in the management of generated municipal waste in the EU; therefore, the EU should be studied as a multi-region area. Case studies are of high importance. In [22], the STIRPAT model was applied to understand links between GDP, renewables, trade openness, tourism, and municipal waste generation across EU countries from 1995 to 2021. The results revealed that while GDP per capita was positively correlated with municipal waste generation, renewable energy, trade openness, and tourism demonstrated a negative impact on municipal waste. In [9], the relationship between municipal waste, economic growth, and GHG emissions in Switzerland was analyzed. The Dynamic Auto-Regressive Distributed Lags and Fuzzy Cognitive Maps approaches were applied. Scientists found a bidirectional causality between municipal waste and economic growth, as well as a unidirectional causality between municipal waste and GHG emissions, with the latter being the effect of the former. In addition, they found that education and awareness campaigns are the most relevant policy drivers of the relationship. In [10], the Granger causality between municipal waste generation, R&D, and economic growth in the EU was studied at a regional level. Scientists have set a bidirectional relationship between municipal waste generation and economic growth, as well as a causal relationship between municipal waste generation and R&D intensity. Scientists argued that conventional economic development policies are insufficient to reduce municipal waste generation in EU regions. Incentive and innovation policies should be implemented to facilitate the EU regions to move towards a circular economy model. An environmental assessment of municipal waste policies was carried out by the authors of [11], who analyzed the long-term dynamic effect of municipal waste per capita, as well as other policy instruments, on GHG emissions in ten OECD countries from 1994 to 2020 using a non-parametric quantile regression approach. Scientists found that municipal waste had a significant positive effect on GHG emissions in lower-quantile OECD countries. However, its effect on GHG emissions was insignificant in higher-quantile OECD countries. They concluded that higher-quantile countries with large amounts of municipal waste reached the efficient municipal waste management threshold, but lower-quantile OECD countries caused a deterioration to the environment. They suggested that the latter countries adopted circular economy principles and transformed municipal waste into value-added products. In [12], the relationship between municipal waste generation and economic and socio-demographic indicators was researched in Bulgaria and other EU countries, and strategies for sustainable waste management were suggested. Scientists found that economic growth was associated with increased levels of municipal waste, while the correlation between municipal waste and the presence of a circular economy indicator was diverse. In detail, the circular material use rate increased, which reduced the levels of municipal waste. The results showed a need for integrated waste management and demonstrated support for adopting circular economic policies. This includes expanding or sorting collection and recycling systems, promoting the circular economy, and raising awareness and education in this area. In [23], data envelopment analysis (DEA) using the FEAR R package (https://www.r-project.org/, accessed on 12 March 2025) and the Benchmarking package (https://cran.r-project.org/web/packages/Benchmarking/index.html, accessed on 12 March 2025) was applied to build and assess three quantitative models addressing the technical, economic, and sustainable dimensions of municipal waste management in the EU; the results were compared with scores of recently established circular economy indicators. It was found that the Netherlands, Slovenia, France, Italy, Germany, and Sweden demonstrated a superior performance for both circular economy outcomes and sustainable performance. In [13], the anti-food waste-related policies in China were reviewed at the national and regional levels. Scientists proposed reducing food waste and its related emissions by improving ecological agricultural production models, promoting waste sorting and systems for resource utilization, improving consumer awareness of food purchasing and utilization, etc.
The third group of papers analyzed the progress and effects of existing municipal waste policies in cities, countries, and regions, as well as providing policy suggestions. In [24], the current municipal waste policies and new trends in municipal waste management systems were highlighted. Scientists found that “public awareness drivers are required to be carried out for efficient waste management policies”. In addition, countries that have had poor performance in relation to municipal waste management should adopt the policies and strategies launched by world-leading countries. In [25], it was observed that the municipal waste management policies and programs in India failed to achieve their objectives. Scientists argued that the policies were unclear and that there was a lack of awareness among the stakeholders, as well as poor enforcement by the regulators. Furthermore, it was stated that policies should focus on the behavioral changes in citizens, policy representatives, and decision-makers in order to minimize wastage and littering and to maximize reuse and recycling. Additionally, it was observed that people management was a crucial issue, and technological solutions were overrated. In [26], the municipal waste deficiencies regarding related policies in India were researched. Scientists found the existing services and future plans to be inadequate. In response to this, the authors proposed the adoption of resource recovery strategies, such as composting and incineration, as substitutes for landfill disposal in the country. In [27], the effect of the new mandatory municipal waste sorting policy in Shanghai was systematically assessed. Scientists found that household food waste was effectively separated, and the heating value of residual waste increased. In [19], the effect of waste management policies, focusing on the measures of the landfill ban, landfill tax, and deposit refund scheme, on the amount of waste treated in landfill, incineration, energy recovery, and recycling was studied; a panel dataset of 14 European countries from 1996 to 2018 was used. The regression analysis showed that the landfill ban correlated with decreased amounts of landfill waste and increased levels of incineration, energy recovery, and recycling waste. The landfill tax resulted in an increase in energy recovery and a reduction in incineration and recycling waste. Due to the deposit refund scheme, the amount of landfill waste decreased. Finally, the results showed that the landfill tax and the deposit refund scheme contributed to reduced levels of generated waste. In [20], the consistency of the historical municipal solid waste policy with the demand for the current waste management system was analyzed. Scientists applied the Policy Modelling Consistency Index approach, as well as text mining technology, to assess the consistency level of 26 municipal waste policies in China. The authors found a good level of policy consistency in the country. Policy deficiencies arose in policy timeliness, policy instruments, and policy release agencies. The authors of [28] analyzed the introduction of waste reduction policies at the municipal level in Belgium, investigating whether they improved or deteriorated the cost-efficiency of municipal waste collection services. The authors found that a weight-based pricing system does not impact cost efficiency. Municipalities that are members of a waste collection joint venture or participate in a voluntary agreement are required to ambitiously cut municipal waste collection and process municipal waste more efficiently than other municipalities. In [29], the differences between waste management policy goals and progress in Romania were analyzed and compared with related data from the EU. In 2016, semi-structured interviews with stakeholders were organized, and statistical data analysis was performed. The results showed that the recycling amounts were high in EU countries, which apply high environmental taxes. However, in countries with less emphasis on environmental protection, the amount of recycled waste was low. However, landfill disposal was high, which was the case in Romania. For an efficient waste management policy, it was necessary to gradually change the mentality of the environmentally conservative population, starting with personal efforts, reducing bureaucracy, and increasing the transparency of authorities in the country. The authors of [30] analyzed the effectiveness of municipal waste accumulation in Poland from the perspective of changing the municipal waste management system from 2012 to 2017. For this purpose, the scientists researched several economic and waste indicators that were divided into separate waste categories. They found that GDP growth was accompanied by increased levels of municipal waste, and waste management was unsatisfactory because of the country’s high share of mixed waste. In [31], the progression of municipal waste toward a circular economy was assessed in a sample of EU-24 countries. DEA and the fractional regression model were employed. The findings suggested that orienting policies toward education could improve environmental awareness and the de-linking of economic growth from environmental damage. Particular emphasis should be placed on urban areas. In [32], a new sustainability point system was constructed with the purpose of assessing and comparing various municipal waste management strategies in EU MSs. The results revealed that, within the EU, Germany, the Netherlands, and Sweden had the most sustainable municipal waste policies, which were characterized by low levels of municipal waste generation, high recycling rates (>35%), minimal levels of landfilling (<1%), and significant levels of incineration. Meanwhile, the sustainability of municipal waste policies was found to be the lowest in Cyprus, Malta, and Greece, which relied on landfill disposal. In terms of content, these are the studies that are closest to our work. However, these studies clearly focused on an analysis of and relevant trend establishment in developed and developing countries. In countries that have undergone significant transformations in economic systems and have considerable deficiencies but are “catching up”, there is a knowledge gap in this area.
The fourth group of papers explores a perspective analysis of municipal waste policies. The authors of [33] analyzed the impact of municipal waste sorting policies on the demand for landfill disposal from 2010 to 2035. Scientists found that, due to sorting, the demand for landfill disposal could decrease, but the demand for food waste treatment facilities would increase in Shanghai. In [34], the development of municipal waste in the EU, via the application of machine learning techniques and a set of indicators representing energy, economy, and its circularity, was forecasted. The findings suggested that waste reduction policies should be implemented to decouple economic growth from increased waste; energy efficiency and renewable energy policies should be adopted, as they were indirectly associated with waste reduction. Finally, policies facilitating circular economic practices, such as material recycling and reuse, were crucial. The authors of [35] performed a comparative analysis of the prospective performance of compulsory municipal waste classification policies that penalized violations, as well as advocative policies that were based on incentives, in China by applying a Polynomial Distributed Lag model. Scientists found that the compulsory policy performed significantly better than the advocacy policy.
The fifth group of papers analyzed the methods for improving municipal waste policies [36,37]. In [36], several preferential policies and regulations were proposed to encourage the expansion of municipal solid waste to energy in China by focusing on municipal waste incineration. Scientists found that in the context of sustainable development, municipal waste incineration demonstrates a possibility for growth and has significant market potential with governmental support. In [37], the eco-efficiency of municipal waste treatment scenarios based on Malaysia’s existing and future policy targets was investigated. For this purpose, scientists have developed a relative quadrant life cycle eco-efficiency indicator. They found that scenarios focused on high recycling rates demonstrated their good economic viability and environmental superiority compared to business-as-usual scenarios, which were based on high landfill disposal rates. Seeking to improve the eco-efficiency of municipal waste treatment scenarios, home and centralized composting solutions should be implemented, and feed-in tariffs should be increased. Thus, this group of scientific studies included advanced prospective assessment studies. These studies were necessary; however, their need arose when it was clear what effectiveness issues the municipal waste collection and management policy faced and what the strengths of that policy were. Only after conducting a retrospective analysis and identifying the persistent challenges will it be relevant to conduct prospective studies in the future to propose responsible consumption strategies that increase the effectiveness of municipal waste collection and management policies.
The municipal waste policy in Lithuania has rarely been investigated. Several reports and studies were found in the field, e.g., in 2023, the Public Audit published a report on municipal waste management in Lithuania [38], which called for the municipal waste collection system to be improved, to follow priorities, and to provide recommendations to the Ministry of Environment and the Environmental Protection Agency. In [39], an exponential smoothing method to forecast the amount of municipal waste in Lithuania was proposed. Scientists found that the amount of municipal waste will increase in the country in the future, driven by municipal waste growth in the most prominent Lithuanian regions. A regional approach should be applied to reduce waste. The authors of [40] forecast municipal waste in Lithuania by applying a hybrid k-nearest neighbors (H-kNN) approach and using small and incomplete datasets. Population density, GDP per capita, private property, foreign investment per capita, and tourism were forecast factors. The forecast error (MAPE) was found to be 11.05%. Moreover, the authors of [41] assessed the impact of the landfill tax on landfill disposal in the Baltic States from 2004 to 2014 by applying the regression analysis method. The authors found that the landfill tax reduced the amount of municipal waste in landfills. Seeking to increase the efficiency of emerging municipal waste management systems, a comprehensive assessment of the current state is of high importance [14].

3. Materials and Methods

3.1. Object of Research

In [42], several kinds of policies were identified for assessment. In the paper, the “implemented policy” is selected instead of the “planned policy” or the “field experiment”. The “implemented policy” refers to an ongoing waste collection and management policy that was introduced in Lithuania in 1998.

3.2. Data and Period

After choosing the “implemented policy” assessment, the data quality, adequacy, and time conditions should be met [42]. Responding to these conditions is not easy; however, we believe that we have considered them since we collected data from official sources and databases. The Lithuanian Statistics [43], the Environmental Protection Agency [44], and the State Waste Collection and Management Plan [21] are the most relevant of these data sources. We chose the most extended possible period—from 2012 to 2023. The period’s beginning and end correspond to the earliest and the latest year for which data are available for comparison.

3.3. Criteria

The policy is usually assessed considering criteria of equity [45], efficiency [46], Pareto optimality [47], adequacy [48], public acceptance [49], or effectiveness [50]. In agreement with [51], the waste collection and management policy was assessed with the aim of understanding whether the effects (results achieved) correspond to the policy goals, as well as to identify obstacles and outline strategies for its implementation.

3.4. Approach

Several approaches are applied to assess policy effectiveness. In [52], two approaches are distinguished with advantages and application objectives. While the top–down approach is found to be suitable for identifying policies that could be selected as “good practices” and can therefore be implemented elsewhere in the world, the bottom–up approach is recommended to identify policies that are needed for actions. As emphasized by the authors of [52], the former assessment is based on the case studies and the effectiveness evaluation against a set of criteria, but does not quantify the aggregate effects. The latter assessment is based on analyzing policy-relevant indicators and quantifying policy effects. In this paper, the bottom–up assessment is chosen as it allows for an analysis of the progress made in achieving the clarified policy goals, quantifying policy effects, and, thus, identifying where further actions are needed.

3.5. Effects

In [52], three effects that could be assessed are discussed. These are output, outcome, and impact, which take place differently from the short-term to the long-term, respectively. In [53], it is stated that it is sometimes difficult to find differences in adjacent effects. Nonetheless, while the output refers to what a policy produces with the inputs provided and the outcome indicates why a policy produces this output, an output assessment is carried out to describe the efficiency of the policy, while an outcome assessment is performed to define the effectiveness of the policy [54]. In this paper, an outcome assessment was conducted. It relates to the short-term to medium-term real-world changes brought about by waste collection and management legislation. Presently, an impact assessment is out of scope because it refers to the assessment of long-term effects, such as improved living standards or the slowing of climate change.

3.6. Indicators

A group of outcome indicators is relevant for the determination of what data needs to be collected. A set of outcome indicators is created to assess the progress of the policy and whether it is on track to achieve its goals. Quantitative indicators are taken into account instead of qualitative indicators; these are used in the form of absolute or relative indicators. In agreement with [52], when selecting an indicator, several aspects are considered, including their scope, measurement, and causality with the policy. In line with [55], realistic, measurable, and achievable indicators are relevant because it is only these indicators that contribute to assessing trends and identifying data gaps [56]; if well designed, they ensure transparency and accountability. In the EU, waste-related indicators are used to measure and track trends in waste generation and different aspects of EU waste management [57]. The municipal waste indicator is calculated in the area. It shows trends in the amounts of such waste generated and the amounts recovered and disposed of through material recycling, recycling through composting and digestion, energy recovery, incineration, landfill, and other disposal methods [57]. It is expressed in kg per capita and is published annually. The Lithuanian State Waste Prevention and Management Plan [21] foresees the observation of the following five outcome indicators:
  • Index of utilization (circularity) of Lithuanian secondary raw materials, %;
  • Total waste per unit of GDP, kg/1000 EUR;
  • Total municipal waste per capita (kg/person) compared to the EU average, %;
  • Share of municipal waste disposed of in landfills, %;
  • Share of municipal waste ready-to-reuse and recycle, %.
In response to the SDG 12 targets, a number of indicators are proposed [58,59]. In relation to waste policy, it includes food loss index, food waste index, hazardous waste generated per capita, proportion of hazardous waste treated by type of treatment, and national recycling rate in tons of material recycled, among others [58]. In the scientific literature, many indicators are applied to show different aspects of waste and municipal waste policies. The recycling rate in terms of the percentage of municipal waste generated and circular material use rate as a percentage of the total material use are the indicators that are used to decide on the circularity aspects of the municipal waste policy [23]. The amount of municipal waste generated, the bottom of the waste hierarchy disposal, and GHG emissions are considered to assess the technical efficiency of the policy [23]. The economic efficiency of the municipal waste policy is assessed by considering the indicators of private investment related to the circular economy [23]. The sustainability performance of the policy is evaluated, considering private investment, people employed in the circular economy, and GHG emissions [23]. The management aspects of municipal waste are discussed in relation to studying the amounts and shares of municipal waste treatment, including landfill disposal, recycling, recovery, and others [60]. The significance of economic levers to meet SDG 12 was researched by calculating the municipal waste per capita and the percentage of sorted waste [61]. The efficiency of food waste recycling was investigated by applying indicators of food waste generation according to the economic sector and type of recycling [62].
This paper prepares a set of outcome indicators that are adjusted for municipal waste collection and management policy goals. It is not limited to Eurostat [57] and Lithuanian State Waste Prevention and Management Plan [21] indicators and is more detailed. A set of outcome indicators is developed in the pre-research phase, as described below.

3.7. Guidelines for Consistent and Logical Research

The effectiveness of the municipal waste collection and management policy is assessed by considering the self-prepared guidelines for consistent and logical research (Figure 1). Within them, research is divided into two parts—pre-research and research phases.
The essence of the guidelines’ pre-research phase is that the legislation review is initially carried out to identify the most relevant municipal waste collection and management policy goals. Later on, the policy goals are prescribed with outcome indicators according to expert judgment, where the authors of the paper are the experts. Furthermore, statistical data on indicators are collected or calculated for the defined time period. During the research phase, a tendency and structure analysis of the outcome indicators over the defined time period is carried out, and the trends in outcome indicators are clarified and compared to the expected policy-targeted values. The findings of the pre-research and research phases are presented in the text below.

3.8. Research Biases and Their Control

In [63,64], the definition and the scope of bias are provided. Referring to this, research biases and the ways in which they might be avoided are identified (Table 1).
Table 1. Research biases and ways to avoid them (created by the authors).
Type of BiasHow to Avoid
Study design bias refers to a systematic error when the study favors certain outcomes, including certain limitations in the design or methodology.Study design bias was avoided by preparing guidelines for consistent and logical research (Figure 1) and strictly following them. The guidelines for consistent and logical research were developed considering the results of the literature review, which weighed the pros and cons of the approach, effect, criteria, or indicators.
Selection bias occurs when certain data points are selectively included or excluded.Only official data sources were used to calculate indicators. Country-level data were studied for all Lithuanian regions; types of waste and municipal waste were considered to calculate indicators, i.e., indicators were calculated based on the full set of data. They were presented in natural units (million tons) and relative (%) to show their weight in the total set.
Researcher bias occurs when a researcher believes or expects a certain influence on the research design or data collection process.Bias was reduced by studying the literature, which broadened the horizons of the subject of study and left less room for beliefs and expectations, having explored the gaps in the literature and checked for information in various databases.
Expert judgment bias could be involved in defining policy goalsOnly policy goals, as defined by law, that are quantitative and measurable were assessed by experts. Expert opinion was not collected on policy goals for assessment.
Citation biasThe cited articles were published in journals and databases. The requirement for accuracy in citation was imposed regardless of whether we want to substantiate or refute our findings.
Reporting biases involve selectively reporting findings and neglecting unfavorable results.Reporting bias was avoided in a structured way by clearly separating the positive, neutral, and negative developments in relation to the indicators in Table 2. Long-term trends were observed, and conclusions were drawn by studying the long-term data.
Table 2. Municipal waste collection and management policy goals and adjusted indicators (created by the authors).
Policy GoalAdjusted Outcome IndicatorReference
1. To reduce the amount of waste generated while achieving a climate-neutral economyTotal waste and municipal waste, million tons;[22]
Change in total waste, municipal waste, and GDP, %;[65]
Gross waste and municipal waste intensity, kg/1000 EUR of GDP;[21]
Total waste and municipal waste per capita, kg/person.[23,60,61]
2. To properly sort, reuse, recycle, and dispose of as little waste as possible in landfills. Follow the priority order of waste prevention and management: prevention, ready-to-reuse, recycling, incineration, landfill disposalTotal waste and municipal waste treated by activity, including:
Ready-to-reuse and recycled, tons;
Incineration, tons;
Landfill disposal, tons;
Other, tons.
[23,60]
Structure of waste and municipal waste treatment, including:
Ready-to-reuse and recycled, %;
Incineration, %;
Landfill disposal, %;
Other, %.
[60]
3. Municipal waste must be sorted at the place of its generationTotal sorted and mixed municipal waste, million tons;
Share of sorted and mixed municipal waste, %.
[61]
4. By 2025 and by 2030, the amount of municipal waste prepared for reuse and recycling should be increased to at least 55% and 60% of the total generated municipal waste (by weight), respectivelyShare of municipal waste ready-to-reuse and recycled, % (calculated from total collected municipal waste).[21,23,60]
5. By 2030, the amount of municipal waste disposed of in landfills should be reduced to no more than 5% of the total generated municipal wasteShare of municipal waste disposed of in landfills, % (calculated from total collected municipal waste).[21]
6. By 2030, food waste per capita at the retail and consumer levels should be reduced by 50%, to reduce food losses throughout the food production and supply chainFood waste per capita, kg/person.[66]

4. Results

4.1. Policy, Its Goals, and Adjusted Outcome Indicators

The Law on Waste Management [67] is a critical legal act that determines the state regulation of various types of waste management, the basic principles of the organization and planning of waste management systems, the requirements for waste owners and waste managers, and the economic and financial measures of waste management and the critical targets in Lithuania. This law [67] is supported by the Rules on Waste Management [68] and the State Waste Prevention and Management Plan from 2021 to 2027 [21]. The former establishes the requirements for waste sorting, temporary storage, collection, transportation, and treatment. The latter defines the principles of waste prevention and management and the order of priorities, sets waste prevention and management goals up until 2027, indicates the development directions of waste prevention and management, and determines the monitoring indicators. This paper takes the above legislation into account. It is primarily focused on municipal waste collection and management goals. Seeking to respond to the requirements held for outcome indicators, in this paper, the chosen indicators are selected from the database of the Environmental Protection Agency [44] or are based on a literature review [11]. Policy goals with adjusted outcome indicators are summarized in Table 2.
As shown in Table 2, in some cases, the policy goal has a target value, e.g., landfill disposal should be 5% of the current amount collected by 2030. Thus, there is no room left for the selection of alternative indicators, and the share of landfill disposal in relation to the total collected amount of municipal waste was estimated and monitored from 2012 to 2023. When the policy goal does not have a quantitative value, the closest indicators to the policy goal are proposed. For example, policy goal 1 is assessed against absolute amounts of waste and municipal waste, as well as the indicators of waste and municipal waste intensities, which themselves are linked to social and economic dimensions of sustainability. In response to the social dimension, the conventional indicator of waste per capita is calculated, but in response to real economic growth, waste per EUR 1000 of GDP (chain-linked) is estimated. GDP is considered in chain-linked volumes as it better expresses the long-term national economic performance since it uses constant EUR [22]. We are limited by the available data; as such, indicators are proposed in relation to the officially managed dataset.
Research is conducted taking into consideration the created set of policy goal-adjusted outcome indicators. These specific indicators were chosen over others as they are directly linked to the policy goals and have the ability to be calculated from publicly available data of national importance. Thus, the challenges and progress made in relation to policy are measurable. This also reduces the time costs of the assessment. The research findings are presented below according to the policy goal.

4.2. Policy Goals Assessment

4.2.1. Policy Goal 1

Policy goal 1 requires a reduction in the amount of waste generated in line with the aspiration of a climate-neutral economy, which is not only characterized by the absence of GHG emissions but also by economic growth. Figure 2 shows that under the conditions of economic growth, collecting a significant amount of waste was inevitable in Lithuania.
As shown in Figure 2, with GDP increasing by 3.3% a year, the country’s economy grew by more than a third from 2012 to 2023. The amount of collected waste increased from 2012 to 2021, but at a lower rate—2.8% a year. In 2021, 6.9 million tons of waste were collected. This is 1.5 million tons more than in 2012. Since 2021, the amount of waste has been decreasing by 14.3% a year; in 2023, it accounted for 5.1 million tons. Municipal waste accounted for 20.8% of waste in 2023, and its comparative weight slightly decreased (25.2% in 2012). The amount of municipal waste collected decreased from 1.31 million tons in 2012 to 1.05 million tons in 2023. The decrease rate was 2.7% a year from 2012 to 2020; however, later on, it started increasing by 1.2% a year. Developments in indicators demonstrated that the SDG 12 target regarding waste reduction is being achieved through a reduction in waste. Changes were impacted by developments in municipal waste formation by inhabitants, as shown in Figure 3.
Figure 3 shows that, from 2012 to 2021, the collected amount of waste per capita increased as the economy grew, i.e., 3.6% a year, from 1790.6 tons to 2454.7 tons, respectively. This revealed dominating, unsustainable population habits in relation to consumption and production. From 2021, it decreased by 15.2% per year. During this period, the inhabitants’ capacity for municipal waste was reduced by 16%—equivalent to a 1.6% annual reduction—which is in line with the SDG 12 target regarding reductions in waste according to the type of waste and the population’s habits changing towards more responsible municipal waste collection and formation. In 2023, municipal waste per capita accounted for 366.5 tons (21% of the total waste) compared to 438.5 tons in 2012.
When assessing the policy goal with the indicator of waste intensity, it can be observed that waste and municipal waste decrease, as is required by the goal (Figure 4).
From 2012 to 2023, waste intensity decreased by 3.7% a year. The Lithuanian economy’s capacity for waste generation was 86.7 kg per EUR 1000 of GDP in 2023, compared to 131.8 kg per EUR 1000 of GDP in 2012. The country’s economy can reduce the generation of municipal waste even more, i.e., by 5.2% a year. Presently, 18.0 kg of municipal waste is collected when generating EUR 1000 of GDP.
Thus, the results demonstrate that historically, economic growth was positively associated with the collected amount of waste but gradually decoupled from the collected amount of municipal waste. The gap between the indices of GDP and municipal waste widened, which is consistent with de-linking economic growth from the significant amount of municipal waste collected, as well as the reduction in municipal waste. Furthermore, the results revealed that, while the social dimension of waste sustainability is discussable and should be corrected (Figure 3), the relationship between the economic dimension (the economic performance of a business) of sustainability and waste (Figure 4) was required for sustainable development.

4.2.2. Policy Goal 2

Policy goal 2 follows the priority order of waste prevention and management. Priority is given to ready-to-reuse and recycling, followed by incineration. Landfill disposal is the last option. Figure 5, Figure 6, Figure 7 and Figure 8 show changes in the amount and shares of waste and municipal waste according to the type of treatment, respectively.
Figure 5 reveals that during the studied period, the amount of recycled waste doubled, i.e., increased from 0.74 million tons in 2012 to 1.46 million tons in 2023. The amount of incinerated waste increased sixfold from 0.11 million tons in 2012 to 0.62 million tons in 2023, and processed waste also increased by 17% a year. Meanwhile, the amount of waste disposed of in landfills reduced drastically from 3.12 million tons to 0.35 million tons over the studied period.
Figure 6 shows that, in 2023, only 6.9% of waste was disposed of in landfills in comparison to 60.0% in 2012. The share of incinerated waste increased from 2% in 2012 to 12.3% in 2023, while the share of recycled waste more than doubled. In 2023, this accounted for 28.8% of the total waste treatment. The results suggest that the waste management priority order is maintained in Lithuania, and the situation is improving in the area.
Figure 7 demonstrates that, from 2012 to 2017, the amounts of ready-to-reuse and recycled municipal waste doubled and accounted for 0.70 million tons in 2017. However, since 2017, this value has started decreasing. In 2023, 0.51 million tons of municipal waste were ready-to-reuse and recycled, which was one-third less than its historical peak. Since 2018, municipal waste has started being incinerated. Over the last six years, the amount of incinerated municipal waste has tripled to 0.38 million tons in 2023, while the landfill disposal of municipal waste has significantly reduced. In 2023, 0.08 million tons of municipal waste were disposed of in landfills compared to 0.92 million tons in 2012. In 2020, 0.1 million tons of municipal waste were temporarily stored for up to six months. The results reveal that trends in the treatment of municipal waste according to type of treatment are favorable for establishing a priority order of waste prevention and management, except for waste that is ready to reuse or can be recycled.
Seeking to clarify if the order has been established, structural analysis is performed. The results are presented in Figure 8.
Figure 8 shows that, at the beginning of the period, the priority order was not maintained, as 70% of municipal waste was disposed of in landfills, while only 30% was ready-to-reuse and recycle. Since 2012, the country has sought to introduce a priority order by reducing the importance of landfills and increasing the importance of ready-to-reuse and recycling activities. A breakthrough happened in 2016, when 61% of municipal waste was ready-to-reuse and recycled, while landfill disposal accounted for only 39%. However, from 2017, ready-to-reuse and recycling activities have been shrinking, but they remain at the top of the priority order with a share of 52% in 2023. Evidence shows that ready-to-reuse and recycling activities are shrinking due to incineration, which is becoming essential. In 2023, incineration accounted for 39% of the total waste structure. The relevance of landfill disposal was significantly reduced to 16% in 2021 and 9% in 2023, although it remains a considerable type of municipal waste treatment. Landfill disposal is significantly reduced due to incineration activities. In 2012, 12% of municipal waste was temporarily stored.

4.2.3. Policy Goal 3

Policy goal 3 specifies that municipal waste should be sorted at the place of its generation. Data about where municipal waste was sorted were unavailable; therefore, we analyzed the waste that was sorted in the country. Moreover, information on municipal waste according to its type is limited in relation to the period from 2020 to 2023 (Figure 9).
Figure 9 shows that a significant amount of municipal waste is mixed. In 2023, 0.69 million tons of municipal waste were collected in the form of mixed waste, while 0.36 million tons were collected in the form of sorted waste. In 2023, the amount of mixed municipal waste collected was moderately reduced by 5.0%, while the amount of sorted municipal waste increased by 26% in comparison to 2020 values. Garden and park waste, packaging, plastic, wood, electrical and electronic equipment, glass, and paper are sorted, but in small amounts. From the perspective of SDG 12, increasing the amount of sorted municipal waste and reducing the amount of mixed municipal waste is appropriate and desirable in order to meet municipal waste treatment priorities, including increasing the recycling rate in favor of waste incineration.
In Figure 10, the structure of municipal waste is presented to clarify the most relevant types.
As shown in Figure 10, two-thirds of municipal waste is mixed municipal waste, and there are few structural changes present. Garden and park waste, packaging, plastic, wood, electrical and electronic equipment, glass, and paper are sorted, but their structural shares are small. Sorted municipal waste accounted for 33.9% of the total structure in 2023, which significantly improved recycling rates, as requested by SDG 12. Furthermore, research on the structure of mixed municipal waste conducted in 2023 [44] demonstrated that by sorting biodegradable food and kitchen waste, as well as other biodegradable municipal waste, the amount of mixed municipal waste in the country could be reduced by as much as 34%. Changing habits towards sorting biodegradable waste could increase composting amounts in Lithuania in the future, which corresponds to targets denoted in SDG 12.

4.2.4. Policy Goal 4

Policy goal 4 expects an increase in the amount of municipal waste that is ready-to-reuse and recycled compared to the total amount of collected municipal waste to 55% by 2025 and 60% by 2030. The changes in the share of municipal waste that is ready-to-reuse and recycled are presented in Figure 11.
As shown in Figure 11, policy goal 4 was achieved from 2016 to 2018; however, later on, the share of ready-to-reuse and recycled municipal waste started decreasing and moved away from the target. In 2022, 44.2% of the collected municipal waste was ready-to-reuse and recycled, compared to 61.5% in 2017. Following this trend, it was expected that this share would decrease in the future. However, in 2023, an increase in the share to 49% was observed. After the positive developments in the share of municipal waste that is ready-to-reuse and recycled, the two-period moving-average trendline suggests that the share should increase in the near future. This can be achieved by increasing the amounts of sorted municipal waste, including plastic and biodegradable waste, whose shares in mixed municipal waste were 11% and 34% in 2023. Taking into account the fact that infrastructure for municipal waste sorting is established in Lithuania, policies and measures are requested that can shape the unsustainable habits of Lithuanians in order to increase their awareness.

4.2.5. Policy Goal 5

Policy goal 5 claims to reduce the amount of municipal waste disposed of in landfills to no more than 5% of the total amount of municipal waste generated. Figure 12 reveals the share of municipal waste that was disposed of in landfills.
As shown in Figure 12, municipal waste disposal in landfills significantly decreased from 70% in 2012 to 8% in 2023. Thus far, the 5% policy target has not been achieved; however, significant progress has been made, and the policy is on track to meet its target by 2030, as demonstrated by the two-period moving-average trendline. Significantly reducing the landfill disposal of municipal waste in the context of a moderate reduction in the amount of municipal waste is favorable. This allows us to gain an insight into the amount of collected municipal waste, wherein there are fewer and fewer products that are being returned to the economy for reuse, which allows us to save natural resources, and which is what SDG 12 aims to achieve.

4.2.6. Policy Goal 6

The UN’s call for halving food waste by 2030 is discussed in policy goal 6. In response, the Lithuanian municipal waste collection and management policy seeks to reduce food waste by 50% by 2030. In Figure 13, the historical changes in food waste are presented.
As shown in Figure 13, food waste is an increasingly relevant issue, as it tended to increase by 3.4% annually up to 2021. In 2021, 41.2 kg of food was wasted per year compared to 34.8 kg in 2016. However, positive signs are observed from 2022, when this value starts decreasing. In 2023, Lithuanian inhabitants wasted 35.2 kg of food. Food waste is only minimally sorted. However, from 2024, food waste sorting has become mandatory in Lithuania. Considering this, it is likely that the separate collection of food waste will increase significantly. Alytus is the only region where separate food waste collection has already been applied. According to the report of the Alytus Region Waste Management Center [69], in 2022, 2749.61 tons of food waste were collected, in comparison to 2586.76 tons in 2021. In agreement with [70], “public education and infrastructural investment can enhance the limited adoption of sustainable food waste practices through composting, thereby enhancing food waste sorting and resource recovery and supporting the circular economy goals”, as well as supporting SDG 12.

5. Discussion

In this paper, the Lithuanian municipal waste collection and management policy was assessed by considering a set of effectiveness criteria. In Table 3, the results (the expected policy changes and historical developments in outcome indicators) are summarized and compared. Considering these, the authors made expert judgment relating to the progress of the Lithuanian municipal waste prevention and management policy and whether it is on track to meet its goals (Table 3).
As shown in Table 3, Lithuania has progressed in some municipal waste collection management areas. Progress has been made in reducing municipal waste in terms of the total amount of municipal waste, the amount of municipal waste per capita, or the municipal waste intensity in conditions of economic growth in Lithuania. In line with the findings of [71], this meets the definition of an effective municipal waste management policy, which focuses on reducing the amount of municipal waste. Our results substantiate the correctness of the decoupling theory in the case of Lithuania, where the literature is scarce. Usually, scientists determine the partial correctness of the theory, such as municipal waste generation stabilizing as income increases [72], or do not support it at all, arguing that with every increase in GDP per capita, municipal waste increases [12] and economic growth accompanied this in a waste-intensive nature [34]. As shown in Table 3, the incorrectness of the decoupling theory is revealed in the relationship between waste and economic growth, which goes hand-in-hand in Lithuania. In [9], it is observed that higher living standards and economic growth foster waste production. Seeking to de-link the relationship, it is necessary to increase the volume of information about waste prevention to create conditions for households and other waste owners to conveniently dispose of sorted waste. However, the claim regarding the decoupling of GDP and waste generation is made cautiously, as the correlation could be influenced by short-term or exogenous factors that were not investigated in this paper.
Lithuania made progress in municipal waste treatment and has maintained the globally recognized priorities in waste management, as achievements relating to policy goal 2 have shown (Table 3). In Lithuania, the amount of municipal waste disposed of in landfills significantly reduces over the investigated time period, but the amount of ready-to-reuse and recyclable waste increases; this is also observed in environmentally conscious countries, which are more advanced in this area than other countries, including Romania, where due to low environmental concern, the amount of waste that is recycled remains low. However, landfill disposal was high in Romania [29]. In [73], a significant difference was found in relation to recycling in EU MSs. The results revealed that only Germany, Austria, Slovenia, the Netherlands, Belgium, Denmark, Luxembourg, and Italy recycled more than 50% of the total amount of municipal waste generated in 2020 [73]. Thirteen countries, including Lithuania, recycled between 45% and 30% of their municipal waste [73]. Six countries (Estonia, Portugal, Greece, Cyprus, Romania, and Malta) recycled less than 20% of their municipal waste [73]. As is the case in China [36], the municipal waste resulting from energy in Lithuania demonstrates increasing growth and scale. In agreement with the authors of [71], who stated that effective waste management prioritizes energy recovery from waste, in Lithuania, we found that waste incineration for energy production is the second most-relevant treatment method after ready-to-reuse and recycling. It should be noted that the incineration of waste for heat production damages the achievement of higher goals. Although this solution avoids waste disposal in landfills, it does not encourage the possible secondary use of waste. From this perspective, our findings confirm the doubts of the authors of [41], who state that the “availability of waste incineration capacities is the main driver for landfill diversion, but there are concerns that incineration treatment availability could diminish application of recycling”. Since 2018, there has been a tendency to dispose of ready-to-reuse and recyclable waste by incineration, meaning that there is a possibility of prioritizing violation. The issue will be acute after the third waste incineration plant in Vilnius starts operating. It will compete for calorific waste with the Klaipeda and Kaunas incineration plants. In agreement with the authors of [74], although waste incineration has its rationale in a circular economy, as it serves as a sink for pollutants by removing environmentally hazardous substances from the cycle, it should not be used where the high-quality recycling of waste is possible. However, energy from waste incineration covers a large part of the heat and energy needs of a city [14], i.e., that waste is returned to the economy in the form of energy; therefore, natural resources are saved, which is the target of SDG 12. However, it is relevant to understand that energy from waste should not be treated equally to renewable energy.
The amount of sorted waste in Lithuania is increasing, which is a prerequisite for an effective municipal waste policy that aims to reduce waste disposal in landfills through waste sorting [33]. In line with [12], the sorted collection of municipal waste, including food waste, should become a priority in the country. In future research, Lithuanian households’ behavior regarding the sorted collection of municipal waste will be investigated to propose methods and establish policy measures (for example, raising awareness) to increase the amounts of collected municipal waste that is sorted in the country.
As in many other countries, the amount of food waste is increasing in Lithuania. On the one hand, it is an issue because a large share of it is mixed municipal waste that is disposed of in landfills. On the other hand, it is an issue because instead of decreasing its amount, inhabitants dispose of an increasing amount of food waste. Lithuania should address this issue using the several measures proposed by the authors of [13].
According to the existing statistics [75], Lithuania reaches the EU average regarding the amount of municipal waste generated per capita. However, it still does not reach the world average. In the case of the EU, Lithuania lags far behind in terms of recycling waste. Lithuania recycles about 94 kg per capita, while the EU average is 153 kg per capita [57]. This is mainly related to Lithuania’s choice to incinerate waste for energy production. Meanwhile, when it comes to composting waste, Lithuania is ahead of the EU average—about 100 kg per capita of municipal waste is composted in Lithuania; in comparison, the EU average is 96 kg per capita. An important indicator by which Lithuania performs better than the EU average relates to waste disposal in landfills. A total of 74 kg per capita of waste is disposed of in landfills in Lithuania, while the EU average is 118 kg per capita. In the context of the Baltic States’ “catching up” economies, historically, Lithuania had the highest capacity of its population to generate municipal waste (Figure 14).
As shown in Figure 14, in 2014, Lithuanian residents generated 432 kg of municipal waste, in comparison to Latvia and Estonia, which reported 15.7% and 17.4% less, respectively. Latvia had the fastest growth rates of municipal waste generation at 4.6% a year, reaching the Lithuanian capacity (480 kg per capita) to generate municipal waste in 2020. Estonians’ capacity to generate municipal waste remained the lowest. In 2020, it was 383 kg per capita. What is common across these countries is that municipal waste generation has decreased after the COVID-19 pandemic by 2.4% a year in Lithuania, 1.5% a year in Latvia, and 0.8% a year in Estonia. This is evidenced by the noticeable progress that has begun in countries in the move towards a more sustainable consumption by reducing municipal waste generation.
The “catching up” economies have significant differences in municipal waste treatment, as shown in Figure 15, Figure 16 and Figure 17.
While Lithuania and Estonia have very strong municipal waste landfilling strategies that allow for a significant reduction in the amount of municipal waste disposed of in landfills, Latvia’s strategy is still very focused on municipal waste landfilling. In 2022, 202 kg per capita of municipal waste, or 44% of the total municipal waste generated, was disposed of in landfills in Latvia, while only 63 kg per capita (14%) were disposed of in Lithuania and only 49 kg per capita (14%) in Estonia, with a tendency to further reduce and refuse the disposal of waste in landfills, since this is as an unsustainable waste treatment method with no circularity.
In Estonia and Lithuania, municipal waste treatment has a significant focus on incineration (Figure 16), which is a more sustainable treatment method than landfilling.
Figure 16 presents a significant increase in the amount of municipal waste incinerated in Lithuania from 38 kg per capita in 2014 to 180 kg per capita in 2023, i.e., by 18% per year. In Estonia, 159 kg per capita of municipal waste was incinerated in 2023. Observing that the amount of municipal waste incinerated is decreasing by 0.8% a year, it is likely that Estonian residents are rethinking the priority of waste treatment and its reorganization, as the latest developments in recycling amounts have demonstrated (Figure 17).
As presented in Figure 17, in 2023, the recycling amount increased by 43.5% to 178 kg per capita in Estonia. However, the recycling rates in Estonia remain the lowest across the Baltic States. From 2014 to 2023, Lithuania had the highest amounts of recycled municipal waste, from which composting and digestion account for up to half. Since 2019, Latvia has made a great jump in relation to municipal waste recycling, especially in recycling materials. For the past five years, municipal waste recycling in Latvia has exceeded the amounts in the other Baltic States.

6. Conclusions

Lithuania’s municipal waste collection and management policy was assessed based on a set of effectiveness criteria. Based on the results, the following conclusions were drawn:
  • By understanding the links between waste and its various types, as well as the environment and human health, Lithuania is continuously improving its waste collection and management policy to ensure that the amount of collected waste of all types decreases and can be managed according to globally recognized priorities. Lithuania has made significant progress in municipal waste collection and management during the decade from 2012 to 2023, but some areas require more in-depth attention.
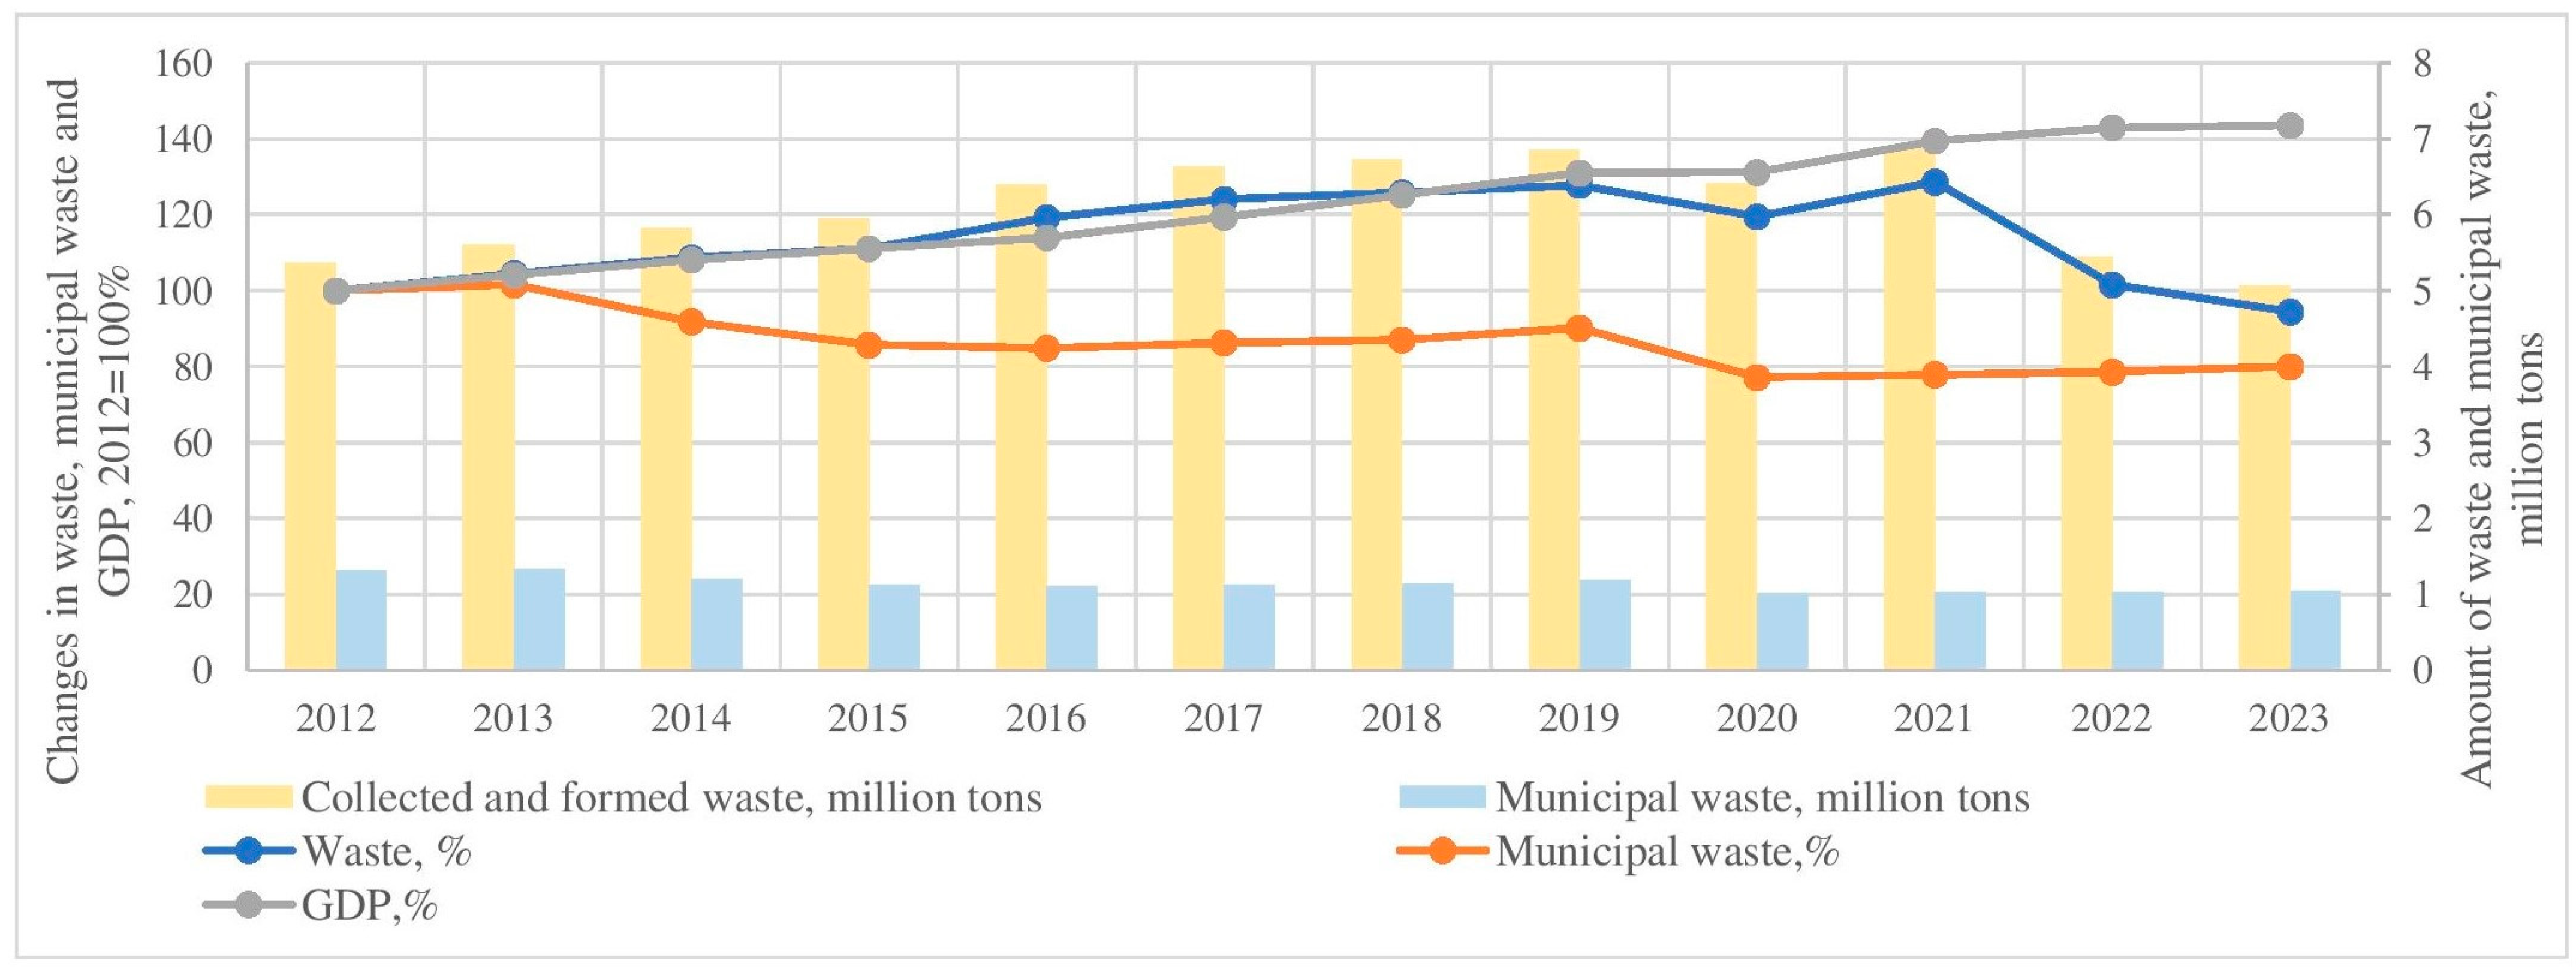
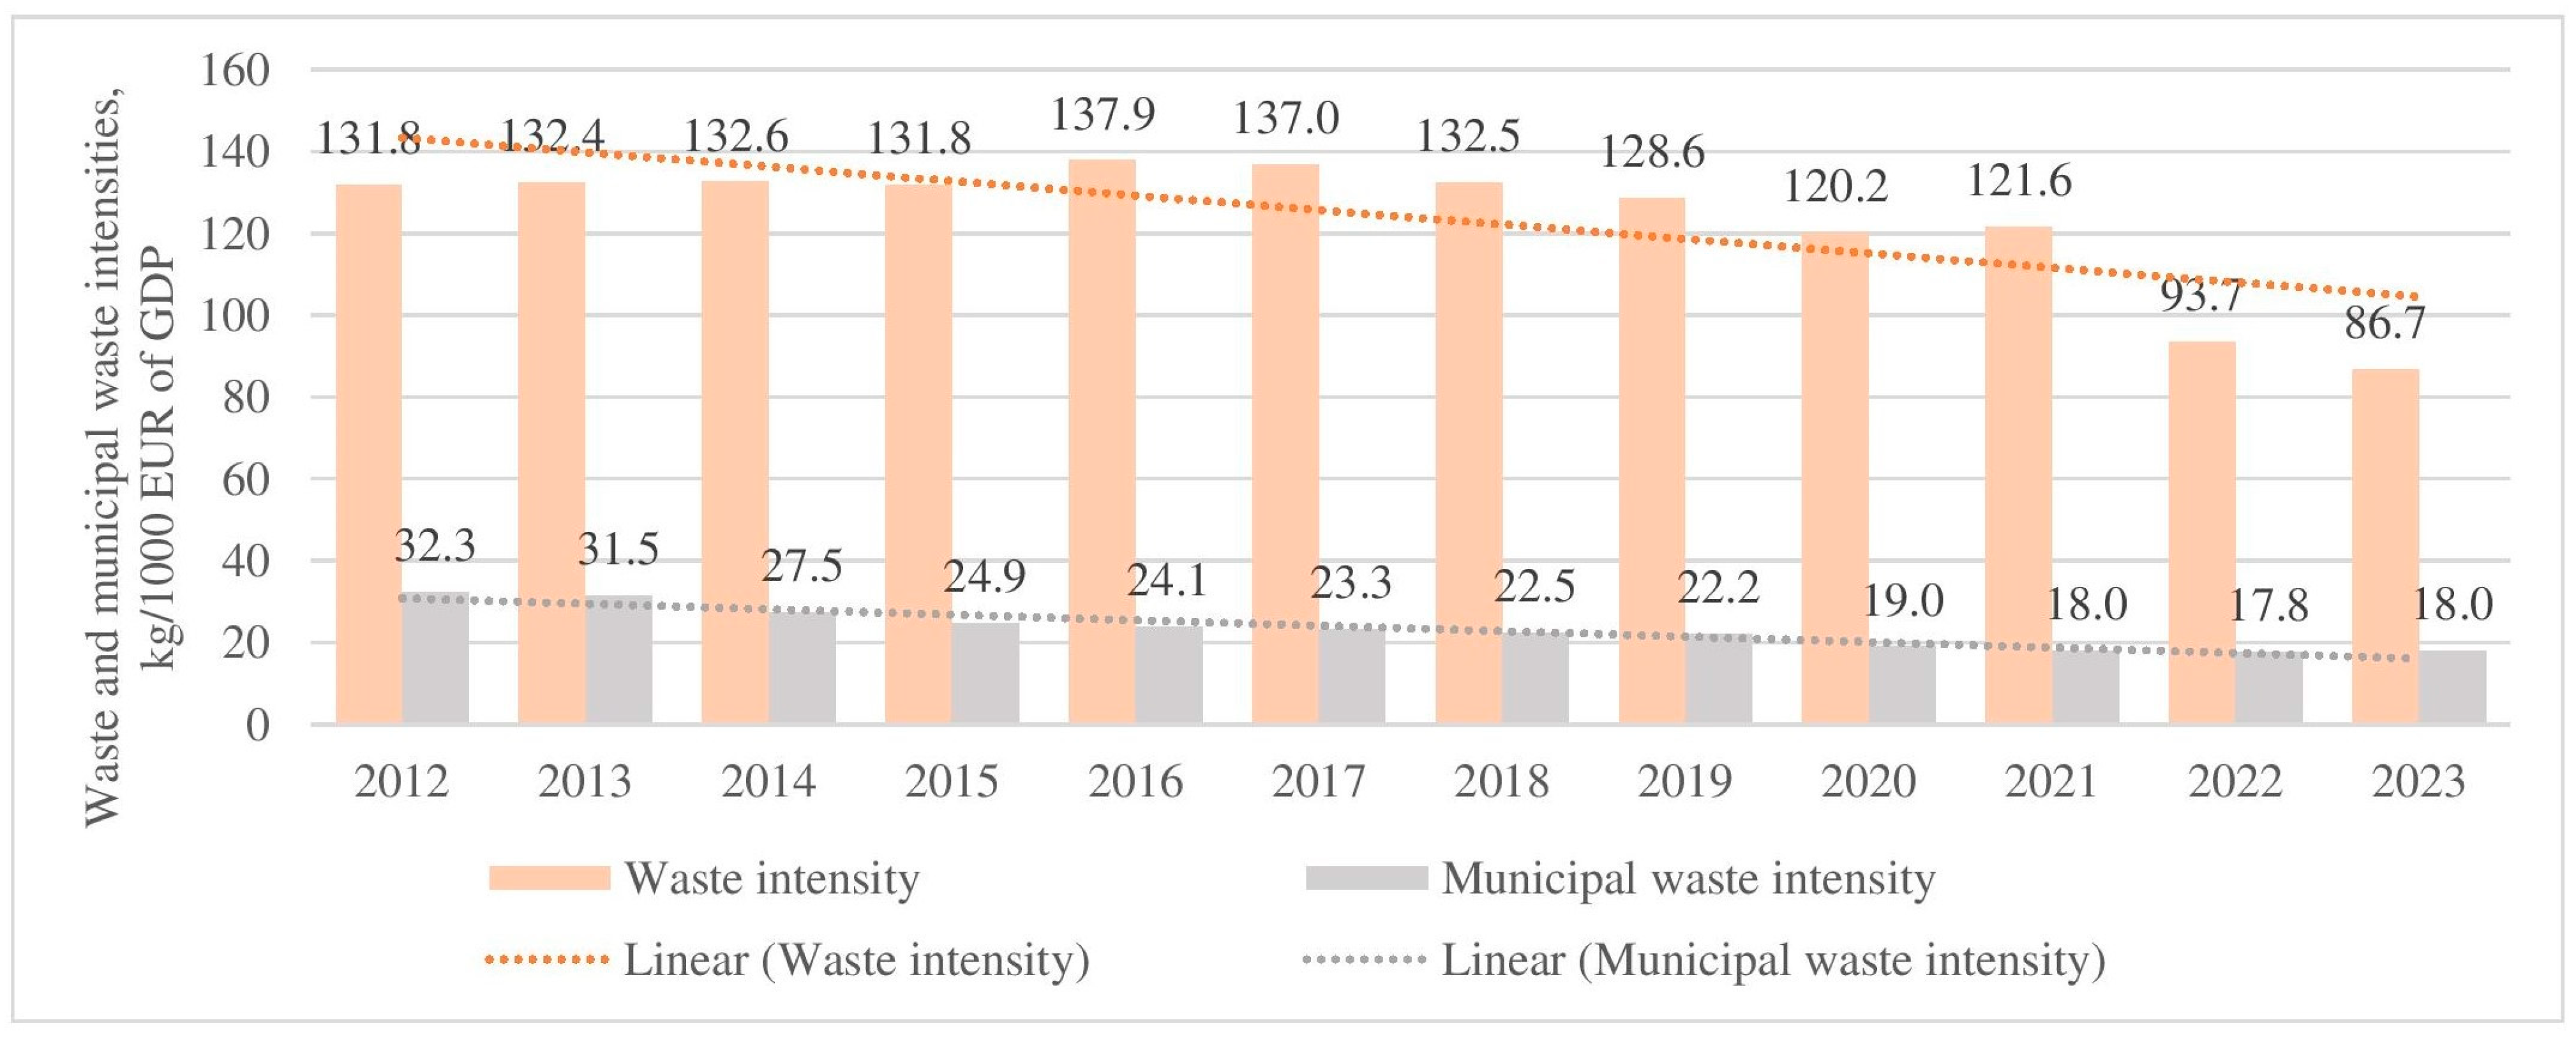
  • The results of the research on the implementation of the municipal waste reduction goal concerning a climate-neutral economy showed that, in Lithuania, under the conditions of economic growth from 2012 to 2023, progress was made in the area of municipal waste. In detail, the amount of municipal waste decreased and contributed to the slowing down of the total waste growth rate, which historically corresponded to the economic growth rate. In 2023, municipal waste accounted for 366.5 kg per capita, which was 16.4% lower than that in 2012. In 2012, municipal waste per capita comprised 20.8% of the total waste per capita, while its share was 24.5%. From 2012 to 2016, the waste intensity increased in Lithuania from 131.8 kg/EUR 1000 to 137.9 kg/EUR 1000; however, later on, it started reducing and accounted for 86.7 kg/EUR 1000 in 2023. Municipal waste intensity decreased every year and was reduced by 44% from 2012 to 2023; in 2023, it accounted for 18.0 kg/EUR 1000.
  • The research results relating to the implementation of the priority order of waste prevention and management revealed some progress. Thus far, the priority order is maintained in the country. Although the ready-to-reuse and recycling activity significantly improved from 2012 to 2017, it began declining due to the development of municipal waste incineration in 2018. In 2023, 0.51 million tons of municipal waste were ready-to-reuse and recycled, and 0.38 million tons were incinerated. Landfill disposal significantly reduced from 0.92 million tons in 2012 to 0.08 million tons in 2023; this accounted for 8.6% of the structure of municipal waste treatment in 2023.
  • The results of municipal waste sorting disclosed a persistent challenge. In detail, municipal waste was rarely sorted in Lithuania. In 2023, 66% of the municipal waste was mixed, which is equivalent to 0.69 million tons. Garden and park waste, packaging, plastic, wood, electrical and electronic equipment, glass, and paper were sorted in small amounts, leading to a total of 0.36 million tons in 2023.
  • The results of the analysis focused on the country’s aspiration to increase ready-to-reuse and recycled municipal waste compared to the total amount of collected municipal waste, which showed a challenge and an opposite tendency. Since 2017, the share of ready-to-reuse and recycled municipal waste has decreased. In 2022, it accounted for 44.2%, but this value increased to 49% in 2023.
  • The analysis of landfill disposal showed a significant improvement in reducing waste disposal in landfills, favoring the achievement of the goal. From 2012 to 2023, landfill disposal decreased from 70% to 8%.
  • The analysis of food waste indicated an increase in food waste from 2016 to 2021 to 41.2 kg of food per capita. This type of waste is rarely sorted and is a recognized issue in the country. In 2023, 35.2 kg of food was wasted per year compared to 34.8 kg seven years ago.
  • Taking into account that the infrastructure for municipal waste sorting is fairly developed in Lithuania, policymakers should adapt policies and measures to change unsustainable Lithuanian sorting habits in order to increase their awareness in the area. Thanks to these measures, it would be possible to increase municipal waste recycling rates and achieve the preferred priorities of municipal waste treatment.
  • Although weaknesses in the Lithuanian municipal waste policy are evident and call for improvements, the progress in the policy towards its effectiveness is noticeable. Improvements in the effectiveness of the national municipal waste policy positively correlate with SDG 12 and are in line with its targets, addressing the implementation of sustainable consumption and production practices, although this happens slowly in Lithuania.
This paper provides a relevant contribution to international waste policy research. Specifically, it provides guidelines for the consistent and logical research of the effectiveness of municipal waste collection and management policies, focusing on the historical analysis of various policy goal-adapted indicators, therefore identifying observed progress and persistent challenges in the area.

Author Contributions

Conceptualization: V.B. and G.N.; methodology: V.B. and G.N.; investigation: V.B. and G.N.; supervision: V.B.; writing and review: V.B. and G.N. All authors have read and agreed to the published version of the manuscript.

Funding

This study received no external funding.

Institutional Review Board Statement

Not applicable.

Informed Consent Statement

Not applicable.

Data Availability Statement

Data are available in a publicly accessible repository that does not issue DOIs. Publicly available datasets were analyzed in this study. These data are found here: https://ec.europa.eu/eurostat/; https://aaa.lrv.lt/lt/veiklos-sritys/atliekos/atlieku-apskaita/atlieku-apskaitos-duomenys/; https://data.oecd.org/waste/municipal-waste.htm; https://osp.stat.gov.lt/statistiniu-rodikliu-analize#/ (accessed on 15 June 2024); and https://ec.europa.eu/eurostat/statistics-explained/index.php?title=Municipal_waste_statistics#Municipal_waste_treatment (accessed on 30 April 2025).

Conflicts of Interest

The authors declare no conflicts of interest.

References

  1. United Nations. Sustainable Development Goals. Goal 12: Ensure Sustainable Consumption and Production Patterns. 2015. Available online: https://www.un.org/sustainabledevelopment/sustainable-consumption-production/ (accessed on 26 May 2023).
  2. Raman, R.; Lathabai, H.; Nedungadi, P. Sustainable development goal 12 and its synergies with other SDGs: Identification of key research contributions and policy insights. Discov. Sustain. 2024, 5, 150. [Google Scholar] [CrossRef]
  3. Kopecká, R.; Hrad, M.; Huber-Humer, M. The role of the waste sector in the sustainable development goals and the IPCC assessment reports. Österr. Wasser-Und Abfallw. 2024, 76, 300–307. [Google Scholar] [CrossRef]
  4. Torrente-Velásquez, J.M.; Chifari, R.; Ripa, M.; Giampietro, M. Robust information for effective municipal solid waste policies: Identifying behaviour of waste generation across spatial levels of organization. Waste Manag. 2020, 103, 208–217. [Google Scholar] [CrossRef] [PubMed]
  5. Rosecký, M.; Šomplák, R.; Slavík, J.; Kalina, J.; Bulková, G.; Bednář, J. Predictive modelling as a tool for effective municipal waste management policy at different territorial levels. J. Environ. Manag. 2021, 291, 112584. [Google Scholar] [CrossRef]
  6. Schanes, K.; Dobernig, K.; Gözet, B. Food waste matters—A systematic review of household food waste practices and their policy implications. J. Clean. Prod. 2018, 182, 978–991. [Google Scholar] [CrossRef]
  7. dos Muchangos, L.S.; Tokai, A.; Hanashima, A. Analyzing the structure of barriers to municipal solid waste management policy planning in Maputo city, Mozambique. Environ. Dev. 2015, 16, 76–89. [Google Scholar] [CrossRef]
  8. Mazzanti, M.; Zoboli, R. Waste generation, waste disposal and policy effectiveness: Evidence on decoupling from the European Union. Resour. Conserv. Recycl. 2008, 52, 1221–1234. [Google Scholar] [CrossRef]
  9. Magazzino, C.; Falcone, P.M. Assessing the relationship among waste generation, wealth, and GHG emissions in Switzerland: Some policy proposals for the optimization of the municipal solid waste in a circular economy perspective. J. Clean. Prod. 2022, 351, 131555. [Google Scholar] [CrossRef]
  10. Gardiner, R.; Hajek, P. Municipal waste generation, R&D intensity, and economic growth nexus—A case of EU regions. Waste Manag. 2020, 114, 124–135. [Google Scholar] [CrossRef]
  11. Su, M.; Yang, Z.; Abbas, S.; Bilan, Y.; Majewska, A. Toward enhancing environmental quality in OECD countries: Role of municipal waste, renewable energy, environmental innovation, and environmental policy. Renew. Energy 2023, 211, 975–984. [Google Scholar] [CrossRef]
  12. Blagoeva, N.; Georgieva, V.; Dimova, D. Relationship between GDP and Municipal Waste: Regional Disparities and Implication for Waste Management Policies. Sustainability 2023, 15, 15193. [Google Scholar] [CrossRef]
  13. Liu, C.; Shang, J.; Liu, C. Exploring Household Food Waste Reduction for Carbon Footprint Mitigation: A Case Study in Shanghai, China. Foods 2023, 12, 3211. [Google Scholar] [CrossRef]
  14. Ginevičius, R. The efficiency of municipal waste management systems in the environmental context in the countries of the European Union. J. Int. Stud. 2022, 15, 63–79. [Google Scholar] [CrossRef]
  15. Miškinis, V.; Galinis, A.; Konstantinavičiūtė, I.; Bobinaitė, V.; Niewierowicz, J.; Neniškis, E.; Norvaiša, E.; Tarvydas, D. Key Determinants of Energy Intensity and Greenhouse Gas Emission Savings in Commercial and Public Services in the Baltic States. Energies 2025, 18, 735. [Google Scholar] [CrossRef]
  16. Parliament of Lithuania. Lithuanian Future Vision “Lithuania 2050”. 2023. Available online: https://lrv.lt/media/viesa/saugykla/2023/12/pkvNdKVl0fk.pdf (accessed on 15 January 2024).
  17. Parliament of Lithuania. National Climate Change Management Agenda. 2021. Available online: https://e-seimas.lrs.lt/portal/legalAct/lt/TAD/7eb37fc0db3311eb866fe2e083228059?positionInSearchResul (accessed on 15 January 2024).
  18. Government of Lithuania. National Progress Plan “Lithuania 2030”. 2020. Available online: https://e-seimas.lrs.lt (accessed on 15 January 2024).
  19. Malek, W.; Mortazavi, R.; Cialani, C.; Nordstrom, J. How have waste management policies impacted the flow of municipal waste? An empirical analysis of 14 European countries. Waste Manag. 2023, 164, 84–93. [Google Scholar] [CrossRef]
  20. Fan, H.; Chu, Z.; Chu, X.; Wang, S.; Huang, W.C.; Chen, J. Quantitative evaluation of the consistency level of municipal solid waste policies in China. Environ. Impact Assess. Rev. 2023, 99, 107035. [Google Scholar] [CrossRef]
  21. Government of Lithuania. Lithuanian State Waste Prevention and Management Plan 2021–2027, No 519. 2022. Available online: https://e-seimas.lrs.lt/portal/legalAct/lt/TAD/TAIS.164386/asr (accessed on 15 January 2024).
  22. Akther, F.T.; Liton, C.V.; Esquivias, M.A.; Pattak, D.C. Municipal solid waste dynamics: Economic, environmental, and technological determinants in Europe. Clean. Eng. Technol. 2025, 24, 100877. [Google Scholar] [CrossRef]
  23. D’Adamo, I.; Daraio, C.; Di Leo, S.; Gastaldi, M.; Rossi, E.N. Driving EU sustainability: Promoting the circular economy through municipal waste efficiency. Sustain. Prod. Consum. 2024, 50, 462–474. [Google Scholar] [CrossRef]
  24. Sondh, S.; Upadhyay, D.S.; Patel, S.; Patel, R.N. A strategic review on Municipal Solid Waste (living solid waste) management system focusing on policies, selection criteria and techniques for waste-to-value. J. Clean. Prod. 2022, 356, 131908. [Google Scholar] [CrossRef]
  25. Mani, S.; Singh, S. Sustainable Municipal Solid Waste Management in India: A Policy Agenda. Procedia Environ. Sci. 2016, 35, 150–157. [Google Scholar] [CrossRef]
  26. Meena, D.; Dotaniya, M.L.; Meena, B.L.; Rai, P.K.; Antil, R.S.; Meena, H.S.; Meena, L.K.; Dotaniya, C.K.; Meena, V.S.; Ghosh, A.; et al. Municipal solid waste: Opportunities, challenges and management policies in India: A review. Waste Manag. Bull. 2023, 1, 4–18. [Google Scholar] [CrossRef]
  27. Wang, Y.; Shi, Y.; Zhou, J.; Zhao, J.; Maraseni, T.; Qian, G. Implementation effect of municipal solid waste mandatory sorting policy in Shanghai. J. Environ. Manag. 2021, 298, 113512. [Google Scholar] [CrossRef] [PubMed]
  28. De Jaeger, S.; Eyckmans, J.; Rogge, N.; Van Puyenbroeck, T. Wasteful waste-reducing policies? The impact of waste reduction policy instruments on collection and processing costs of municipal solid waste. Waste Manag. 2011, 31, 1429–1440. [Google Scholar] [CrossRef] [PubMed]
  29. Nastase, C.; Chașovschi, C.E.; State, M.; Scutariu, A.L. Municipal waste management in Romania in the context of the EU. A stakeholders’ perspective. Technol. Econ. Dev. Econ. 2019, 25, 850–876. [Google Scholar] [CrossRef]
  30. Przydatek, G. Assessment of changes in the municipal waste accumulation in Poland. Env. Sci. Pollut. Res. 2020, 27, 25766–25773. [Google Scholar] [CrossRef]
  31. Marques, A.C.; Teixeira, N.M. Assessment of municipal waste in a circular economy: Do European Union countries share identical performance? Clean. Waste Syst. 2022, 3, 100034. [Google Scholar] [CrossRef]
  32. Tsimnadis, K.; Kyriakopoulos, G.L. Investigating the Role of Municipal Waste Treatment within the European Union through a Novel Created Common Sustainability Point System. Recycling 2024, 9, 42. [Google Scholar] [CrossRef]
  33. Xiao, S.; Dong, H.; Geng, Y.; Tian, H.; Liu, C.; Li, H. Policy impacts on Municipal Solid Waste management in Shanghai: A system dynamics model analysis. J. Clean. Prod. 2020, 262, 121366. [Google Scholar] [CrossRef]
  34. Chen, C.C.; Chang, Y.S. Leveraging Circular Economy Metrics for Data-Driven Forecasting of Solid Waste Production in Europe. Sustainability 2024, 16, 1017. [Google Scholar] [CrossRef]
  35. Chu, X.; Chu, Z.; Wang, H.; Huang, W.C.; Ni, Y. Comparative analysis on the performances of implementing compulsory and advocative policies in municipal solid waste classification. Environ. Impact Assess. Rev. 2023, 99, 106982. [Google Scholar] [CrossRef]
  36. Zheng, L.; Song, J.; Li, C.; Gao, Y.; Geng, P.; Qu, B.; Lin, L. Preferential policies promote municipal solid waste (MSW) to energy in China: Current status and prospects. Renew. Sustain. Energy Rev. 2014, 36, 135–148. [Google Scholar] [CrossRef]
  37. Chin, M.Y.; Lee, C.T.; Woon, K.S. Policy-driven municipal solid waste management assessment using relative quadrant eco-efficiency: A case study in Malaysia. J. Environ. Manag. 2022, 323, 116238. [Google Scholar] [CrossRef]
  38. Public Audit. Municipal Waste Management, 17 April 2023, VAE-2. Available online: https://www.valstybeskontrole.lt (accessed on 15 January 2024).
  39. Stankevičienė, J.; Bužinskė, J. Trends of municipal waste flows, composition, treatment in Lithuania and its regions. In Proceedings of the International Scientific Conference on Contemporary Issues in Business, Management and Economics Engineering, Vilnius, Lithuania, 13–14 May 2021. [Google Scholar] [CrossRef]
  40. Paulauskaite-Taraseviciene, A.; Raudonis, V.; Sutiene, K. Forecasting municipal solid waste in Lithuania by incorporating socioeconomic and geographical factors. Waste Manag. 2022, 140, 31–39. [Google Scholar] [CrossRef]
  41. Klavenieks, K.; Blumberga, D. Common and distinctive in municipal solid waste management in Baltic States. In Proceedings of the International Scientific Conference “Environmental and Climate Technologies”, CONECT 2016, Riga, Latvia, 12–14 October 2016; Energy Procedia. Volume 113, pp. 319–326. Available online: https://etalpykla.lituanistika.lt/object/LT-LDB-0001:J.04~2017~1520863842154/J.04~2017~1520863842154.pdf (accessed on 15 January 2024).
  42. European Labour Authority. Measuring the Effectiveness of Policy Approaches and Performance of Enforcement Authorities: Output Paper from Plenary Thematic Discussion. 2022. Available online: https://www.ela.europa.eu/sites/default/files/2023-02/Output-paper-from-plenary-thematic-discussion-measuring-the-effectiveness-of-policy-approaches-and-performance-of-enforcement-authorities-%282022%29.pdf (accessed on 15 January 2024).
  43. Lithuanian Statistics. Lithuanian Statistics Database. 2024. Available online: https://osp.stat.gov.lt/statistiniu-rodikliu-analize#/ (accessed on 15 January 2025).
  44. Environmental Protection Agency. Waste Accounting Database. 2024. Available online: https://aaa.lrv.lt/lt/veiklos-sritys/atliekos/atlieku-apskaita/atlieku-apskaitos-duomenys/ (accessed on 15 January 2025).
  45. Shi, Y.; Pyne, K.; Kulophas, D.; Bangpan, M. Exploring equity in educational policies and interventions in primary and secondary education in the context of public health emergencies: A systematic literature review. Int. J. Educ. Res. 2022, 111, 101911. [Google Scholar] [CrossRef]
  46. Svidroňová, M.M.; Meričková, M.M. Efficiency of waste management in municipalities and the importance of waste separation. J. Mater. Cycles Waste Manag. 2022, 24, 2644–2655. [Google Scholar] [CrossRef]
  47. Jiang, W.; Hong, H.; Ren, J. Pareto-optimal reinsurance policies with maximal synergy. Insur. Math. Econ. 2021, 96, 185–198. [Google Scholar] [CrossRef]
  48. Gunfaus, M.T.; Waisman, H. Assessing the adequacy of the global response to the Paris Agreement: Toward a full appraisal of climate ambition and action. Earth Syst. Gov. 2021, 8, 100102. [Google Scholar] [CrossRef]
  49. Spandagos, C.; Reaños, M.A.T.; Lynch, M.A. Public acceptance of sustainable energy innovations in the European Union: A multidimensional comparative framework for national policy. J. Clean. Prod. 2021, 340, 130721. [Google Scholar] [CrossRef]
  50. Jiang, S.; Chen, H.; Liu, X.; Yang, S.; Huang, H. A methodology to assess the effectiveness of policies for food waste reduction: Application on Chinese policies from 1961 to 2021. Resour. Conserv. Recycl. 2023, 194, 106983. [Google Scholar] [CrossRef]
  51. Cetrulo, T.B.; Marques, R.C.; Cetrulo, N.M.; Pinto, F.S.; Moreira, R.M.; Mendizábal-Cortés, A.D.; Malheiros, T.F. Effectiveness of solid waste policies in developing countries: A case study in Brazil. J. Clean. Prod. 2018, 205, 179–187. [Google Scholar] [CrossRef]
  52. Jacob, K.; King, P.; Labajos, B.R. Approach to Assessment of Policy Effectiveness Chapter 10. Available online: https://wedocs.unep.org/bitstream/handle/20.500.11822/27663/GEO6_CH10.pdf?sequence=1 (accessed on 15 January 2024).
  53. Intrac. Outputs, Outcomes and Impacts. 2017. Available online: https://www.intrac.org/wpcms/wp-content/uploads/2017/01/Outputs-outcomes-and-impact.pdf (accessed on 15 January 2024).
  54. Schumann, A. Using Outcome Indicators to Improve Policies: Methods, Design Strategies and Implementation; OECD Regional Development Working Papers 2016/02; OECD Publishing: Paris, France, 2016. [Google Scholar] [CrossRef]
  55. Bohaconova, K. How to Develop Input, Activity, Output, Outcome and Impact Indicators. 2023. Available online: https://www.researchtoaction.org/2023/03/how-to-develop-input-activity-output-outcome-and-impact-indicators/ (accessed on 15 January 2024).
  56. Montalvo, D. Assessing the Effectiveness of European Waste Management Policies Within Circular Economy Under the EU Green Deal. 2021. Available online: https://unece.org/sites/default/files/2021-03/2.1_EEA_Daniel%20Montalvo_presentation%20_workshop.pdf (accessed on 15 January 2024).
  57. Eurostat. Waste-Related Indicators 2024. Available online: https://ec.europa.eu/eurostat/statistics-explained/index.php?title=Waste_management_indicators&oldid=658527 (accessed on 15 January 2024).
  58. United Nations. Sustainable Development Goals. SDG Indicators. Available online: https://unstats.un.org/sdgs/metadata/?Text=&Goal=12&Target (accessed on 10 May 2025).
  59. Ram, M.; Bracci, E. Waste Management, Waste Indicators and the Relationship with Sustainable Development Goals (SDGs): A Systematic Literature Review. Sustainability 2024, 16, 8486. [Google Scholar] [CrossRef]
  60. Óskarsson, G.K.; Agnarsson, S.; Davíðsdóttir, B. Evaluating municipal solid waste management efficiency in Iceland: A data envelopment analysis of socioeconomic and geographic influences. Environ. Sustain. Indic. 2025, 26, 100676. [Google Scholar] [CrossRef]
  61. Beccarello, M.; Di Foggia, G. Sustainable Development Goals Data-Driven Local Policy: Focus on SDG 11 and SDG 12. Adm. Sci. 2022, 12, 167. [Google Scholar] [CrossRef]
  62. Okayama, T.; Watanabe, K. Performance of the Food Waste Recycling Law in Japan with Reference to SDG 12.3. Recycling 2024, 9, 18. [Google Scholar] [CrossRef]
  63. Pedada, S. How to Avoid Bias in Research: Navigating Scientific Objectivity? Uncover the Secrets to Unbiased Research. Learn How to Avoid Bias in Research, Its Methodologies, and Approaches. 2023. Available online: https://mindthegraph.com/blog/how-to-avoid-bias-in-research/ (accessed on 27 April 2025).
  64. Pannucci, C.J.; Wilkins, E.G. Identifying and Avoiding Bias in Research. Plast. Reconstr. Surg. 2010, 126, 619–625. [Google Scholar] [CrossRef] [PubMed]
  65. Environmental Protection Agency. Lithuania’s National Inventory Report. Greenhouse Gas Emissions 1990–2020. 2024. Available online: https://aaa.lrv.lt/media/viesa/saugykla/2024/4/wBsrNs5-LtU.pdf (accessed on 10 May 2025).
  66. European Commission. Food Waste: 132 kg per Inhabitant in the EU in 2022. 2024. Available online: https://ec.europa.eu/eurostat/web/products-eurostat-news/w/ddn-20240927-2 (accessed on 9 May 2025).
  67. Parliament of Lithuania. Law on Waste Management, VIII-787. 1998. Available online: https://e-seimas.lrs.lt/portal/legalAct/lt/TAD/TAIS.59267/asr (accessed on 15 January 2024).
  68. Environmental Ministry of Lithuanian. Rules on Waste Management, No 217. 1999. Available online: https://e-seimas.lrs.lt/portal/legalAct/lt/TAD/TAIS.84302/asr (accessed on 15 January 2024).
  69. Alytus Region Waste Management Center. Company Activity Report. 2022. Available online: https://www.aratc.lt/uploads/Veiklos%20ataskaitos/ARATC%20ataskaita%202022.pdf (accessed on 15 January 2024).
  70. Nazibudin, N.A.; Sabri, S.A.M.; Manaf, L.A. Aligning with sustainable development goals (SDG) 12: A systematic review of food waste generation in Malaysia. Clean. Waste Syst. 2025, 10, 100205. [Google Scholar] [CrossRef]
  71. Kwon, Y.; Lee, S.; Bae, J.; Park, S.; Moon, H.; Lee, T.; Kim, K.; Kang, J.; Jeon, T. Evaluation of Incinerator Performance and Policy Framework for Effective Waste Management and Energy Recovery: A Case Study of South Korea. Sustainability 2024, 16, 448. [Google Scholar] [CrossRef]
  72. Jaligot, R.; Chenal, J. Decoupling municipal solid waste generation and economic growth in the canton of Vaud, Switzerland. Resources. Conserv. Recycl. 2018, 130, 260–266. [Google Scholar] [CrossRef]
  73. Pronti, A.; Zoboli, R. Institutional Quality, Trust in Institutions, and Waste Recycling Performance in the EU27. Sustainability 2024, 16, 892. [Google Scholar] [CrossRef]
  74. IFAT. The Role of Waste Incineration in a Circular Economy. Available online: https://ifat.de/en/industry-insights/detail/waste-incineration.html (accessed on 27 April 2025).
  75. OECD. Municipal Waste Data. 2024. Available online: https://data.oecd.org/waste/municipal-waste.htm (accessed on 15 January 2024).
  76. EUROSTAT. Municipal Waste Statistics. 2024. Available online: https://ec.europa.eu/eurostat/statistics-explained/index.php?title=Municipal_waste_statistics#Municipal_waste_treatment (accessed on 30 April 2025).
Figure 1. Guidelines for consistent and logical research (created by the authors).
Sustainability 17 04623 g001
Figure 2. Developments in the amount of waste and municipal waste and volume of GDP from 2012 to 2023 in Lithuania (own estimations based on [43,44]).
Sustainability 17 04623 g002
Figure 3. Amounts of waste and municipal waste per capita in Lithuania from 2012 to 2023 (own estimations based on [43,44]).
Sustainability 17 04623 g003
Figure 4. Waste and municipal waste intensities in Lithuania from 2012 to 2023 (own estimations based on [43,44]).
Sustainability 17 04623 g004
Figure 5. Waste treatment by type in Lithuania from 2012 to 2023 [44].
Sustainability 17 04623 g005
Figure 6. Structure of waste treatment in Lithuania from 2012 to 2023 [44].
Sustainability 17 04623 g006
Figure 7. Municipal waste treatment by type in Lithuania from 2012 to 2023 [44].
Sustainability 17 04623 g007
Figure 8. Structure of municipal waste treatment in Lithuania from 2012 to 2023 [44].
Sustainability 17 04623 g008
Figure 9. Total sorted and mixed municipal waste in Lithuania in 2020 and 2023 [44].
Sustainability 17 04623 g009
Figure 10. Share of mixed and sorted municipal waste in Lithuania in 2020 (a) and 2023 (b) [44].
Sustainability 17 04623 g010
Figure 11. Share of municipal waste ready-to-reuse and recycled in Lithuania from 2012 to 2023 [44].
Sustainability 17 04623 g011
Figure 12. Share of municipal waste disposed of in landfills in Lithuania from 2012 to 2023 [44].
Sustainability 17 04623 g012
Figure 13. Food waste in Lithuania from 2016 to 2023 (own estimation, based on the amounts of biodegradable kitchen and canteen waste, edible oil and fat, and the amount of mixed municipal waste in relation to the total amount of municipl waste, which is derived from annual research into the determination of the composition of mixed municipal waste [44]).
Sustainability 17 04623 g013
Figure 14. Municipal waste generated from 2014 to 2023 in the Baltic States, kg per capita [76].
Sustainability 17 04623 g014
Figure 15. Municipal waste disposal in landfills in the Baltic States from 2014 to 2023 [76].
Sustainability 17 04623 g015
Figure 16. Municipal waste incinerated in the Baltic States from 2014 to 2023 [76].
Sustainability 17 04623 g016
Figure 17. Municipal waste prepared for reuse and recycling in the Baltic States from 2014 to 2023 [76].
Sustainability 17 04623 g017
Table 3. Comparison of expected policy changes to historical data changes (created by the authors).
Policy GoalAdjusted Outcome IndicatorExpected Change Historical Change
(2012–2021)
Is Policy on Track to Meet Its Goal?
1Total waste, million tons Sustainability 17 04623 i003
Total municipal waste, million tons Sustainability 17 04623 i001
Changes in total waste, % Sustainability 17 04623 i003
Changes in total municipal waste, % Sustainability 17 04623 i001
Total waste per capita, kg/person Sustainability 17 04623 i003
Total municipal waste per capita, kg/person Sustainability 17 04623 i001
Waste intensity, kg/1000 EUR Sustainability 17 04623 i001
Municipal waste intensity, kg/EUR 1000 Sustainability 17 04623 i001
2Total municipal waste treated by activity:
  Ready-to-reuse and recycled, tons
  Incineration, tons
  Landfill disposal, tons


,
,

Sustainability 17 04623 i002
Sustainability 17 04623 i001
Structure of municipal waste treatment:
  Ready-to-reuse and recycled, %
  Incineration, %
  Landfill disposal, %


,


Sustainability 17 04623 i002
Sustainability 17 04623 i001
3Total sorted municipal waste, kg Sustainability 17 04623 i003
Total mixed municipal waste, kg Sustainability 17 04623 i003
Share of sorted municipal waste, % Sustainability 17 04623 i003
Share of mixed municipal waste, % Sustainability 17 04623 i003
4Share of municipal waste ready-to-reuse and recycled, % , Sustainability 17 04623 i002
5Share of municipal waste disposed of in landfills, % Sustainability 17 04623 i001
6Food waste per capita, kg/person Sustainability 17 04623 i003
Sustainability 17 04623 i001—yes, progress was made, it is on track; Sustainability 17 04623 i002—it is not clear; Sustainability 17 04623 i003—no observable progress.
Disclaimer/Publisher’s Note: The statements, opinions and data contained in all publications are solely those of the individual author(s) and contributor(s) and not of MDPI and/or the editor(s). MDPI and/or the editor(s) disclaim responsibility for any injury to people or property resulting from any ideas, methods, instructions or products referred to in the content.

