Abstract
The utilisation of hydrogen is being explored as a viable solution for reducing carbon emissions in port operations, with potential applications in cargo handling, transportation, and shipping vessel operations. To comprehensively list the decarbonisation options in ports, this study conducted a Systematic Literature Review to identify and then survey twelve highly cited review papers. Initially, a typology approach was used to categorise the decarbonisation options by activities and technologies. Subsequently, the study introduced a novel Port Energy Map to reveal the energy system pathways and their interconnections. Each pathway was then converted into a simpler linear sequence of activities, shown as a Port Energy System Taxonomy, which outlines the energy supply and energy-using activities. By utilising this taxonomy and map, the study identified opportunities and research gaps for integrating hydrogen technologies into port energy systems, which serves as a valuable tool for assessing port decarbonisation options.
1. Introduction
The role of hydrogen, alternative fuels, and renewable electricity in port decarbonisation is becoming increasingly important as the industry seeks to reduce its carbon footprint. This decarbonisation transition is being driven by codes for best practice and new regulatory directives that seek to limit and progressively reduce the carbon emissions from the port sector, with these initiatives based on concerns for carbon emissions’ role in driving the Earth’s climate change mechanisms [1,2].
Hydrogen, termed ‘Green Hydrogen’ when produced by renewable energies, is a versatile, potentially zero-emission fuel that can be used to power ships, as well as a range of port equipment and vehicles [3,4,5]. However, most hydrogen is currently produced from non-renewable energies using the steam reforming of natural gas, as this is the cheapest production approach.
While ‘Green Hydrogen’ costs are currently high, it has the potential to significantly reduce greenhouse gas (GHG) emissions from port activities and to support the transition towards a more sustainable and energy-resilient sector. As such, port authorities and industry stakeholders around the world are exploring the potential of hydrogen as a key component of their decarbonisation strategies [6].
The total GHG emissions from the global energy usage of ports are significant, and although these data are not globally aggregated, their magnitude can be inferred from the reporting from some large ports. For example, the Port of Long Beach, California, USA, reported Carbon Dioxide Equivalent (CO2e) emissions of 1,188,800 (metric) tonnes for 2021 from the handling of 9.4 million containers (Twenty-Foot Equivalent Units (TEU)) [7]. Frequently, though, global shipping emissions are referenced to also include the emissions of the port industry [8]. For global shipping, this is estimated at “2.89% of global emissions” or “1056 million (metric) tonnes of CO2e per year for 2018” [9]. However, these aggregated emissions also omit emissions from each port’s connected infrastructure, adjacent industrial hinterlands, and land transport networks.
Therefore, both the shipping and port sectors are being targeted to attain significant reductions in their emissions. For international shipping, the International Maritime Organisation (IMO) has a stated aim “to reduce CO2 emissions per transport work, as an average across international shipping, by at least a 40% by 2030 compared to 2008”. This target was later amended in 2023 “to peak GHG emissions from international shipping as soon as possible and to reach net-zero GHG emissions by or around, i.e., close to, 2050, taking into account different national circumstances⋯” [10]. However, for ports, the emission regulations and associated reduction targets are dependent on their location, as applied by their respective country and economic zone jurisdictions.
The GHG emissions associated with a port’s activities come from burning natural gas and coal to generate and distribute electricity and to produce and combust carbon-containing fuels. The energy-associated GHG emissions of a port depend on its energy supply chains and consumption across its land-side operations, visiting ship types, fuel types, cargoes, and ship berthing schedules. These emissions are categorised under defined scope types that characterise a port’s ‘carbon footprint’, and emissions reporting is then allocated by the activity’s ownership and responsibilities across the port [11,12,13].
A reduction in a port’s GHG emissions not only assists in mitigating the atmospheric drivers of climate change but also has the potential to decarbonise activities associated with the port, such as connected supply chains and marine and land transport corridors, together with industrial regions, as well as improve air quality. These connected economic activities are also termed ‘hard-to-abate’ energy sectors due to the relative immaturity of the currently available substitute clean fuels and technologies. Ports, as key logistics nodes, can potentially act as clean-energy change agents not just for their activities but also for connected sectors, together with providing the supply, import, and export infrastructure needed for this transition. ‘Green Hydrogen’ is potentially usable in many of these ‘hard-to-abate’ sectors, with ports then becoming the enablers of clean-energy transitions. Therefore, ports can play a positive role as both decarbonisation and hydrogen hubs [14,15].
Ports are complex hubs of activity designed for the transfer of various types of cargo, such as containers, vehicles, and bulk materials, which are interconnected by sea and land supply chains. The handling of these goods requires the provision of multiple energy supplies and types at various scales. A port’s activity zones can be categorised into five areas: (1) wharf-side, (2) yard-side, (3) services-side, (4) ship-side, and (5) land-side, as depicted in Figure 1 and Figure 2. Detailed descriptions of the port activities within each of these areas are discussed in Section 4.2. These areas can be summarised by the movement and handling operations required for the port’s cargoes and goods. Ships carry materials from the ship-side, with ships berthing at the port and their materials loading and unloading at the wharf-side. These materials are then carried to the yard-side for temporary storage in the open or within warehouses or containers. From the yard-side, the stored materials are then ready for movement from the port area to the land-side. Facilitating materials’ movement and their storage to and from the ship-side and land-side requires the port to supply energy, power, and infrastructure from the services-side.
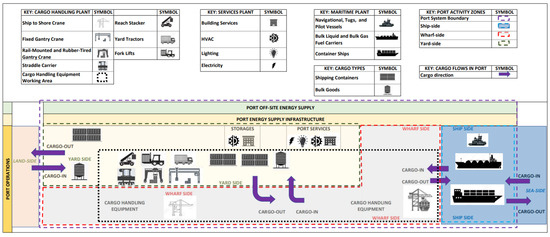
Figure 1.
A schematic of a port’s cargo movements, activity zones, and typical cargo handling equipment.
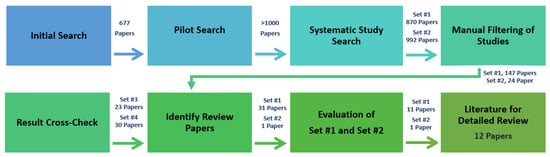
Figure 2.
A summary of the Systematic Literature Review (SLR) study selection.
All port activities require reliable and secure energy supplies together with the infrastructure and handling plant to ensure both the time- and cost-efficient movement of goods. A port’s cargo handling plant typically utilises a fixed electric motor drive or a diesel internal combustion engine drive plant for the high-volume transfer of heavy goods onto and off ships [8]. Goods are then transported from the wharf and deposited into temporary storage areas on the yard-side, as illustrated in Figure 1. Haulage to and around yard-side storage areas is then typically undertaken by a mobile internal combustion engine plant using a range of fuels (e.g., diesel, petrol, Liquefied Petroleum Gas (LPG), Compressed Natural Gas (CNG), Liquefied Natural Gas (LNG), and electric batteries), depending on the cargo handling activities [16]. Further electricity supplies are used to power and condition the berthed ships, for Heating Ventilating and Air Conditioning (HVAC) services in buildings and warehouses, for containers’ cold storage, and as general power across multiple work areas. Port-sited fuel storage areas with bunkering also provide key regional facilities for the refuelling of berthed ships (e.g., “by heavy fuel oil (Heavy Fuel Oil (HFO)), low sulphur fuel oil (Low-Sulphur Fuel Oil (LSFO)), marine gas oil (MGO), marine diesel oil (Marine Diesel Oil (MDO)), and marine fuel oil (Marine Fuel Oil (MFO))” [17]). These are complemented by terminal fuel storage facilities for use by the port-side plant and vehicles and connected land-side transport supply chains (e.g., for diesel and petrol). Consequently, port facilities provide energy supplies and infrastructure for a wide range of activities and equipment for both transport and stationary applications, as shown in Figure 1.
There are two decarbonisation pathways for ports. The first is to use electrification with automation for fixed and mobile plants and alternative cleaner fuels such as hydrogen for mobile plants [8,18]. When these energy pathways use lower- or zero-GHG-emission-based electricity and chemical fuel feed-stocks such as hydrogen, then a port can be partially or totally decarbonised. These pathways are presented as being achievable in the future for a ‘net-zero port’ and are in either their planning stages or are progressing towards full commercial operation [19]. However, both decarbonisation pathways for new ports rely on there being future available and price-competitive low- and zero-emissions electricity and clean fuels. For existing ports, a time-stepped and incremental decarbonisation approach is a more likely pathway. This second approach can manage the risks from implementing new energy supplies and technologies into the existing infrastructure whilst also minimising the changes to existing operations. A stepped decarbonisation approach is slower but can ensure that a port’s operational activities and business margins are maintained through a planned energy transition.
An electrification path is already established in semi-autonomous and autonomous container ports, although the wider use of renewable electricity from either port-sited or grid-connected generation is not common [18,20,21].
However, the direction for using Alternative Clean Fuels is still emerging. Several options can be considered, from low- and zero-carbon-sourced hydrogen and synthesised clean fuel chemicals (e.g., ammonia and methanol), which can be derived from hydrogen, to Liquefied and Compressed Natural Gas (LNG and CNG). These various fuel options can be considered for both port activities and shipping [8,22,23].
There are commercially emerging hydrogen technologies using equipment for both niche heavy transport and stationary energy applications, which may also be suitable for a range of port activities (Figure 1) [4]. A key requirement will be hydrogen availability, cost competitiveness, and safety for use in these applications [3]. Therefore, hydrogen and its derived chemicals, when produced from either low- or zero-carbon feed-stocks, have strong potential for decarbonising ports. The opportunities for using hydrogen technologies in ports are the review focus of this paper.
However, each alternative clean fuel type has unique properties and characteristics that determine its applications and GHG emissions [3]. These need to be diligently considered for each fuel, together with the associated risks across the required supply chain infrastructure, based on the technology maturity level. Consequently, there is not yet a commonly accepted clean fuel for use in all ports. However, the shipping sectors’ future decarbonisation directions may have a strong influence on the directions also undertaken by ports, as ports will most likely provide the regional fuel bunkering facilities [3].
In essence, the energy-intensive activities of ports are highly complex and require their infrastructure to be flexible, reliable, durable, and cost-effective across a range of operational timeframes, together with many logistical interfaces. As a result, identifying and implementing decarbonisation strategies for ports can be challenging.
An extensive literature review published in 2023 collated global port case study data and reported that the average potential port emissions reduction is estimated at “20 to 60% for applications in the land area”, with “25–70% for ships in port” and “30 to 50% for optimised ships operations” [6]. These figures highlight both the port and shipping sectors’ significant overall potential for decarbonisation. However, there is not yet an overall guiding structure for how and where to deploy these potential decarbonisation technologies other than by using the reported activities and example case studies deployed across independent sub-systems that are located within and across different ports [6].
There is a significant body of academic journal articles that explore and review the various decarbonisation technologies available for ports. However, it remains unclear how much of this knowledge has been disseminated and implemented across the port sector, as the “literature is largely constrained to a set of large, front-runner ports⋯” [24]. This contrasts with a large volume of grey literature that is regularly and currently being published from the port sector reporting on the range of ongoing decarbonisation projects and initiatives, which include those for using hydrogen [24,25].
Therefore, an objective of this paper is to identify and summarily review the academic literature to provide a full listing of the reported options to decarbonise ports. The approach used three sequential tasks. The first was to identify and understand the range of decarbonisation technologies available. The second was to separate these technologies and unravel ports connecting energy pathways into a structure that presents the information omissions and gaps for using hydrogen. Then, the third task is to use this approach and results as a guide for identifying and clarifying the opportunities for hydrogen in ports. These tasks are summarised by the following Research Questions (RQs) posed in this paper:
- RQ #1: What are the port decarbonisation technology options reported in the academic review papers?
- RQ #2: What are the hydrogen technology options and gaps identified in the port decarbonisation review papers?
- RQ #3: How do the technology gaps clarify the opportunities for deploying low-emission hydrogen technologies in ports?
To answer these RQs, this paper’s main contributions are as follows:
- An extensive and concise technology categorisation of the decarbonisation options for ports;
- An overview of the multiple energy supply pathways utilised by the various energy-intensive activities in a port, studied through a proposed novel Port Energy Map;
- An analysis to develop a novel Port Energy System Taxonomy of the electrification and hydrogen decarbonisation options for ports;
- Within this new structure, the identification of specific content gaps that indicate opportunities for hydrogen technologies.
The rest of this paper is structured as follows: Section 2 describes a Systematic 180 Literature Review (SLR) that is based on [26] and was conducted to identify the key review papers that cover decarbonisation options for ports. Section 3 is divided into two parts: Section 3.1 compares the methodologies and key contents of the review papers, while Section 3.2 presents the results of a comprehensive survey of the review papers for the categorisation of the subject coverage. Section 4 offers a discussion with an additional analysis as a response to the three RQs. The review papers’ coverage is interpreted and summarised in a Port Energy Map that illustrates a port’s multiple energy pathways. This mapping forms the basis for a proposed Port Energy System Taxonomy that identifies the gaps in hydrogen technologies across the port’s operations. The approach used in this paper reveals the port’s energy system, the referenced decarbonisation opportunities, and the identified opportunities for deploying hydrogen technologies in ports. Section 5 concludes the paper and highlights future directions.
2. Systematic Literature Review Methodology
This section introduces the rationale for the used review approach, followed by a description of the review methodology.
2.1. Rationale for the Review Approach
As discussed in Section 1, there is an extensive literature body covering the decarbonisation of ports. The common reporting challenge across this literature is that ports are not simple systems, as they comprise complex temporally and spatially coincident activities that are linked within energy-technology pathways. This complexity, together with the volume of the literature available, may be a barrier to considering alternative cleaner technologies. A different interpretation of the literature may provide new perspectives for assessing the decarbonisation options.
Three review approaches are usually considered: A ‘Literature Review’, ‘Scoping Review’, and ‘Systematic Literature Review’; each has a different methodology and focus [27]. A ‘Literature Review’ aims to provide a general subject search and results discussion without using a peer-reviewed search strategy. Alternatively, a ‘Systematic Literature Review’ is more detailed and uses a peer-reviewed explicit search process to thoroughly and explicitly examine all the literature. The focus is on primary papers for an in-depth assessment of the coverage to find the knowledge gaps and an interpretation that maybe used as the basis for decision making. The approach results in a highly detailed, extensive analysis, with an examination of the risk of bias. Finally, a ‘Scoping Review’ aims to provide a broad subject overview by also using a peer-reviewed explicit process to find the key concepts with a mapping of the subject extent to identify the knowledge gaps. The resources and time available for each approach are key considerations, with Systematic Literature Reviews requiring greater resources and a longer duration, whilst Scoping and Literature Reviews offer a spectrum of approaches, requiring reduced resources over shorter periods for contained studies. An objective for all three types is to produce results that clearly summarise, define, and present future research opportunities, which is specifically relevant to the current literature covering port decarbonisation.
A 2020 Scoping Review assessed the use of Systematic Literature Reviews (SLRs) in engineering and found that SLRs are applied across a range of disciplines [28]. The paper stated that software engineering and computer science “have a history of using the SLR and have disciplinary guidelines for SLRs”, citing [26]. As this paper’s authors are familiar with this discipline’s SLR approach, this was selected and is described next in Section 2.2 [26].
2.2. The Review Methodology
To identify the range of decarbonisation technology options for ports, an SLR approach was conducted [26,29]. The methodology involved an initial web search using the Google Scholar search engine (http://scholar.google.com (accessed on 1 September 2022)) to identify documents for the decarbonisation subjects, together with a first set of exploratory keywords. From this search, the identified keywords were ‘Green Hydrogen’ AND ‘Hydrogen Technologies’ AND ‘Ports’.
This ‘Initial Search’ resulted in 677 files of academic papers and grey literature, which were briefly read and categorised under 50 broad category labels after a brief review. The literature contained common topic labels, such as ‘Green Ports’, ‘Green Seaports’, ‘Greening of Ports’, ‘Greener Seaports’, ‘Green Smart Ports’, ‘Net Zero (Energy) Ports’, ‘Nearly Zero Energy Ports’, ‘Sustainable Ports’, ‘Port Sustainability’, and the ‘Decarbonisation of Ports’. Furthermore, this initial search helped identify the key high-ranking publishers of the academic journals that covered the subject matter.
Subsequently, a second ‘Pilot Search’ using the aforementioned topic labels uncovered a vast number of documents related to ports and their associated supply chains, adjacent industrial hinterlands, and connected transport systems, encompassing decarbonisation technologies such as hydrogen and electrification, together with hybrid options.
To manage the overwhelming number of search results to a manageable size for review, a filtering criterion was employed, focusing only on the port activities between the ports’ boundaries for the cargo supply and exit locations. Consequently, this approach excluded off-site clean fuel production and chemical feed-stocks derived from both the ports and chemical supply chains, adjacent hinterlands, co-located industries, connected transport corridors, cargo distribution and export corridors, and end-users. Nevertheless, even with this filtering strategy, the resulting data-set still comprised thousands of listed papers per search, rendering it unfeasible for review. Therefore, to reduce the number of papers and minimise method bias in the results, an SLR approach was employed, using refined keywords and transparent filtering criteria for the search.
The SLR methodology [26] used the Publish or Perish software (www.harzing.com/resources/publish-or-perish accessed on 1 September 2022) to conduct a search in the Google Scholar (https://scholar.google.com accessed on 1 September 2022) database. The search criteria used were (1) Set #1, with the keyword ‘Green Ports’ only, and separately, Set #2, with ‘Green Ports’ AND ‘Decarbonisation’; these keywords were searched in the titles, abstracts, and body texts of papers (2) published from 2017 to 2022 and (3) published in English only. This resulted in 870 and 992 papers for Set #1 and Set #2, respectively.
The resulting software-automated listings were then manually filtered using the ‘Inclusion Criteria’ for (5) only academic papers, (6) only titles with ‘Ports’ plural (as ‘Port’ was often used for singular case studies; however, content checks were made on the excluded papers), and (7) articles only from peer-reviewed academic publishers, which were ACP-Copernicus (www.atmospheric-chemistry-and-physics.net accessed on 1 September 2022), Elsevier (www.elsevier.com/ accessed on 1 September 2022), IEEE (www.ieee.org accessed on 1 September 2022), MDPI (www.mdpi.com accessed on 1 September 2022), Nature (www.nature.com accessed on 1 September 2022), Springer (www.springer.com accessed on 1 September 2022), Taylor & Francis (www.taylorandfrancis.com accessed on 1 September 2022), and Wiley (www.wiley.com accessed on 1 September 2022).
Next, the literature list underwent manual filtering using the ‘Exclusion Criteria’ to remove (8) duplicates, (9) grey literature (i.e., not peer-reviewed journal articles), (10) citations, records, and patents, then (11) articles with zero citations (but checking for recent relevant articles with no citations), and (12) non-reviewed documents (e.g., Conference proceedings and white papers). In the final step, the search listings were sorted based on each paper’s total citations, indicating the level of interest in the content as of September 2022 from Google Scholar listings.
The SLR methodology identified two smaller, more relevant data-sets for detailed review. Set #1 ‘Green Ports’ yielded 147 papers and Set #2 ‘Green Ports’ AND ‘Decarbonisation’ yielded 24 papers after removing 1691 papers. These final sets of papers were then ranked by each paper’s total citations (as of September 2022 from Google Scholar). In both final sets, the most-cited papers were all identified as subject-type review papers. These review papers comprehensively covered the decarbonisation options for ports and shipping, including clean fuels and electrification technologies. Therefore, the SLR-identified review papers were selected as the basis for the detailed review in this paper. A cross-check of the search and filtering criteria was conducted by using keywords for Set #3 ‘Seaports’ AND ‘Ports’ AND ‘Port’ AND ‘Decarbonisation’ and, separately, Set #4 ‘Seaports’ OR ‘Ports’ OR ‘Port’ AND ‘Decarbonisation’. These searches yielded 23 and 30 papers, respectively. A detailed inspection of the results in the ‘Ports’ versus ‘Port’ filter content check (see criterion 6 above) identified an extra review paper [4]. This paper used similar publisher-defined keywords and content to this study’s and so was accepted for manual inclusion in the results. A comparison of the results from Set #1 and Set #2 versus Set #3 and Set #4 showed that the former set had a wider subject coverage and a greater number of overall review papers. Thus, Set #1 and Set #2 were selected for the next steps, confirming that the keywords and filtering criteria had successfully identified the required literature body of 31 papers.
The papers from Set #1 and Set #2 were combined and ranked by citation count, and duplicates were removed. The resulting list was then subjected to a first-pass content review and classified into two groups based on a second set of inclusion and exclusion criteria. Papers claiming to be overall literature reviews (review papers) that covered a broad range of decarbonisation options for ports were included. Those papers that were not review papers (i.e., papers not claiming to be overall reviews or reviews that were intended as an introduction to each paper’s specific focus) were excluded. This review yielded 11 review papers and removed 21 papers. During this step, another relevant paper [30] was identified, which used a similar approach and criteria to this paper and was manually included in the results.
The SLR approach was followed as far as practical, as shown in Figure 2, resulting in 10 review papers with 2 manually inserted [26]. These final 12 review papers are listed in Table 1. The 21 excluded papers are shown in References [31,32,33,34,35,36,37,38,39,40,41,42,43,44,45,46,47,48,49,50,51].

Table 1.
The twelve review papers identified from the Systematic Literature Review (SLR).
Among the 12 included review papers, the citations for the top three papers are heavily skewed, with [8] at 186 (2019), [30] at 134 (2015), and [24] at 94 (2019). The total citations of each of these three papers are at least double those of the next set of nine papers, indicating that these are strong journal references covering the searched subject content.
The publisher-presented keywords for each of the reviewed papers were also compared (see Table 1). The highest occurrences, shown in brackets, were for ‘Smart Energy Management’ (5) and ‘Energy Efficiency’ (5) and ‘Electrification & Automation’ (2), followed by ‘Port Micro-grids’ (2) and ‘Renewable Energy’ (2). Notably, though, labels covering Alternative Fuels or Clean Fuels were omitted, although these subjects potentially overlap with the presented keyword ‘Fuel Cells’ (1). This listing indicates the port sector academic papers’ topical themes at the time of their publication.
To summarise, this study utilised an SLR methodology to efficiently and transparently filter through a vast body of literature and identify selected review papers that provide a comprehensive overview of the decarbonisation options for ports. The analysis of the content of these review papers will be discussed in detail in the following sections.
3. Systematic Literature Review Results
The review papers resulting from the SLR methodology described in Section 2 were compared for their reported literature review approaches and key content (Section 3.1 and Table 2); then, our proposed approach was used to review and categorise the review papers’ content coverage (Section 3.2). A summary of the papers’ content by category and by occurrence for this paper’s approach is shown in Table 3.
Table 2.
A summary of the review papers and methodology comparison with this paper.
3.1. Comparison of the Review Papers’ Approaches and Key Content Results
The methodologies of each review paper are listed and summarised for comparison in Table 2. Four (4) of the review papers’ results were based on using referenced SLR approaches. The remaining eight (8) were based on non-SLR approaches, although they undertook ‘Systematic Reviews’ based on their own defined, or unstated, methods. Overall, the review papers processed over 1299 papers (including between paper duplicates), mostly from 2003 to 2021. Notably, [30] was an outlier, covering the period from 1975 to 2014. Overall, for the review papers, the collated content provided a comprehensive coverage of the search subject (Table 2).
All the review papers used a survey approach to summarise and list their key papers’ contents (Table 2). This common step was followed by subject categorisation into a structure that grouped the key reviewed papers’ concepts by a typology labelling approach. This has the advantage that a large and complex subject can be flexibly sub-grouped into multiple concepts to align with a focus. It also enables the efficient survey and summarisation of the extensive literature available.
This paper also initially used a similar typology approach to categorise the review papers’ contents. This is shown in Table A4, Table A5, Table A6 and Table A7, which provide a summary of each of the review paper’s technology coverage based on three levels of categories under three row headings. These headings are Category Levels 1 and 2, which were devised by this paper for a typology hierarchy. The Category 1 heading uses three labels, ‘Port Operations’, ‘Shipping Operations’, and ‘Administrative Operations’, and then Category 2 uses 15 port activity sub-groups. Then, the Category 3 labels shown are unchanged, as far as practical, from those shown in the review papers to provide 68 technology niches. Table A4, Table A5, Table A6 and Table A7 also show the Category 3 labels’ occurrence counts for each technology niche. The most common are ‘Renewable Energy’ (9), ‘Alternative Clean Fuels’ (8), ‘Micro Grids’ (7), ‘Onshore Power Supply’ (7), ‘Electrification’ (6), ‘Smart Grids’ (6), and ‘Energy Management Plans’ (5).
However, Table A4, Table A5, Table A6 and Table A7 also show the low-occurrence-category labels. There are 56 labels under ‘Port’ and ‘Shipping’ with counts less than 5, together with 18 ‘Port’ and 15 ‘Shipping’ labels with a count of 1. The low counts for ‘Shipping’ and ‘Administration’ are likely due to these subjects interfacing with ‘Port’ technology activities, but these are not the papers’ main focuses. The low counts imply that further content categories maybe required if this detail was within each review paper, and the categorisation approaches had insufficient resolution. Alternatively, these subjects may be inadequately covered in this literature, which then indicates content gaps across the publications.
Therefore, the next steps for this paper were to re-assess the review papers and to use a greater number of classification labels for their contents. The approach and expanded number of category labels used in this paper compared to the review papers are shown at the top of Table 2.
3.2. Assessment of the Review Papers’ Content Coverage
The review papers [8,20,21,24] explicitly listed and [4,52] implicitly presented the port decarbonisation options by activity location, allocated to the port-side (or wharf-side), ship-side, services-side, and out-side. This format quickly presented the technology options within a typical port layout. However, when using this approach, the Category 1 to 3 labels shown in Table A4, Table A5, Table A6 and Table A7 present the broad content but with minimal detail. For example, specific types of Alternative Clean Fuels that are currently available are unlisted. Therefore, further categorisation was required for the review papers’ contents to provide further details on the decarbonisation niches. To extract this detail, a more comprehensive survey approach was applied by this paper. A Survey Framework Map was devised for noting the review papers’ contents, which were grouped into four classification levels. The labels used were Category 1, covering 4 port location activities (Wharf-side, Yard-side, Services-side, and Ship-side), then Category 2 for port operations in 5 groupings (Energy Controls, Energy Supply, Energy Infrastructure, Equipment Activities, and Marine Activities), then Category 3 with 20 energy-using activities, and then a new Category 4 containing 106 technology niches. Each paper’s content was subjectively interpreted by this paper’s reviewer into the four classification levels. (Note that contents for Administrative, Policy and Regulatory, Incentive and Penalty Schemes, Port Out-side, and Logistics were excluded, as this paper’s focus was only on port energy decarbonisation technologies.) On reviewing the four classifications’ results, the Category 1 labels were simplified into three port activity zones for (1) Port Operations that use energy, (2) Port Energy Supply Infrastructure that transfers, stores, conditions, and converts energy, and (3) the Port Off-site Energy Supply for energy supplies. The set of Category 2 labels was not required and was deleted. The resulting structure and survey results are shown in Table A1, Table A2 and Table A3 for the 106 technology niches. These niches were grouped into the three port activity zones (Category 1 labels) in the first left-hand column of Table A1, Table A2 and Table A3. The approach and framework in Table A1, Table A2 and Table A3 allow for further technology niches, for example, the inclusion of renewable energies by generator type, such as hydro-electric, wind, and solar photovoltaics, and specific clean fuels for use in both cargo handling equipment and mobile plants. However, as the categories increased, the energy supply pathways to the technology niches became harder to interpret and to clearly present. Therefore, the results in Table A1, Table A2 and Table A3 present a manageable limit that sufficiently identifies the subject content and also provides references for further information.
Table A1, Table A2 and Table A3 also show the occurrence counts for each technology niche. The highest occurrences (in brackets) are for Onshore Power Plants/Cold Ironing (11), Haulage Transport Power Drive (11), Local Renewable Energy (10), Electrification (10), Automation (10), Shipping Vessel Speed Reduction (10), Cargo Handling Electrification Options (9), and Ship LNG Refuelling (9), as shown in the blue text and summarised in Table 3.
Four energy supply types have high occurrences (at seven or above), with three of these being mature technologies, namely, electrification, natural gas (CNG/LNG), and alcohols (methanol, ethanol, and biofuels), as specified in Table A1, Table A2 and Table A3 and summarised in Table 3 in the red text. The developing hydrogen technology is shown for specific applications.
However, most of the Alternative Clean Fuel listings have varied occurrence counts for their supply, infrastructure, and operational activities, which indicates the content gaps across the review papers. Notably, the general ‘Alternative Fuels’ Supply’ category has a high count (7), indicating that this subject is a key issue for these fuels, as shown in the red text. Specifically, ammonia has lower occurrences across Table A1, Table A2 and Table A3, potentially reflecting the review papers’ (and sectors’) uncertainties and lower interest levels in its application for both ports and shipping.
This contrasts with the counts for alcohols (methanol and ethanol), which have high to moderate occurrence counts for ‘Ship Refuelling’ (7) (see the red text) but with generally low counts for port-side activities (see the black text). CNG and LNG have consistent mid-range occurrences for applications across both the port and ship refuelling activities. Hydrogen technologies’ potential for use across port operations is represented, but again with lower content shown in the energy supply and infrastructure categories, although high content is shown for port- and ship-side transport and plants (see the highlighted black and red text with yellow background in Table 3).
In summary, the electrification of ports, together with renewable power generation, have strong coverage, contrasting with the lower counts for Alternative Clean Fuels, across port activity zones (Table A1, Table A2 and Table A3). Related to both energy types is the recognition of their combined use (termed Hybrid Loads, with a count of 8) for the port’s cargo handling plant and vehicles, as well as the provision of combined power–heat–cooling services for Buildings and Warehousing (count of 7). Hydrogen in Table 3 and in Table A1, Table A2 and Table A3 is presented to have potential for both stationary and mobile energy loads across the port infrastructure and operations.
These updated categories provide more detailed results compared to those in Section 3.1. However, it is noted that detailed alignment checking for each of the review paper’s contents against their source literature contents was not undertaken. This is a limitation of the methodology and results, as the identified review papers will have overlooked topics within their sources, and this paper may have also unintentionally biased the subject categorisation shown in these results. However, the approach used in this paper has successfully identified and summarised the key academic papers for the subject coverage from the very large and diverse literature body that is available. It is important to highlight that publications issued after September 2022 will present further technologies for inclusion.
Typically, SLRs should result in a large number of papers, but only 12 review papers from the literature body passed the filtering process. This is a study limitation but also implies that a large number of review papers do not align with the subject enquiry’s keywords. Alternatively, if these 12 papers represent the subject enquiry, they may then provide a basis for new interpretations. This perspective is applied and discussed in Section 4.
There are also study limitations from the two decisions that were made to manage and filtering results from the large volume of literature (Section 2.2). Firstly, this paper’s literature is sourced from the largest, but only one, search engine, potentially leading to results bias. The second decision to review only academic review papers also introduces potential bias from their approaches and results. However, the quantification of the level of bias is not feasible without a significant expansion of the review scope based on the use of multiple literature databases.
However, the resulting 12 papers have provided broad and concise results without the significant loss of detail or overview, which has allowed new interpretations (Section 4). Consequently, this paper’s approach and results are a hybrid between Scoping and Systematic Reviews (Section 2.1). The approach is a ‘review of review papers’, which is termed a tertiary review paper [26,69]. Tertiary reviews are defined in [70], with examples in [71,72]. They are not commonly used across engineering disciplines, but they are effective at summarising large literature bodies.
In summary, the approach taken by this paper has resulted in a comprehensive categorisation of the decarbonisation technology options for ports and indicates the content gaps in Table 3 and Table A1, Table A2 and Table A3. These were not easily identifiable in the individual review papers. It is worth noting that there are consistent content gaps across all Alternative Clean Fuels, including hydrogen. The identified and grouped energy decarbonisation options for ports are further analysed in the next sections to provide responses to the RQs in this paper.
4. Discussion of Results
This section discusses the results from Section 3 from different perspectives, covering a Survey Framework Map (Section 4.1), a Port Energy Map (Section 4.2), and a Port Energy System Taxonomy (Section 4.2). This progresses to showing how these perspectives have identified opportunities for hydrogen to decarbonise ports (Section 4.3), together with new research directions in Section 4.4.
4.1. A Survey Framework Map Perspective
The Survey Framework Map results in Table 3, Table A1, and Table A3 summarise the decarbonisation options for ports and the content gaps across the reviewed papers. This responds to RQs #1 and #2. However, this survey approach has its limitations. The results are influenced by subjective categorisations by the reviewers and paper authors, which can lead to content overlaps and duplications. Moreover, the presentation format can also mask content omissions, and the coverage can be uneven. To address these issues, an alternative format is needed.
Additionally, while Table 3, Table A1, and Table A3 are useful in assessing the ‘what’ and ‘where’ for decarbonisation technologies, they fall short in showing ‘how’ this information can be applied to identify opportunities for hydrogen, a key focus of RQ #3. Therefore, again, a different format for presenting the results is needed, which is discussed in the next section.
4.2. A Port Energy Map Perspective
Three of the review papers [8,20,52] summarised their decarbonisation technology options using schematics to present indicative and individual energy flow paths within an idealised port layout. Papers [4,6] go further and present schematics for multiple types of energy paths through the port’s key infrastructure and onto the multiple energy-using activities. These summary schematics quickly convey the subject and support the presentation of the technology options. However, this format does not easily reveal the connections between the multiple energy pathways, nor the potential for using alternative pathways that could decarbonise port activities.
Both the Survey Framework Map in Table 3, Table A1, and Table A3 and the review papers use a ‘top-down’ assessment approach. This starts with port activity zones (e.g., energy supply points to infrastructure and then to operations), uses activity groupings, and then uses technology niche groupings. This direction is similar to a port’s energy supply pathway, from the supply points to the infrastructure and then to the energy-using activities. However, the focus for decarbonising ports is on reducing the GHG emissions associated with operational energy loads. These operational energy loads are positioned at the base of the ‘top-down’ approach.
An energy management perspective for assessing a port’s activities is to measure, and then quantify, all of the energy users, usages, and inefficiencies, plus the associated emissions by source and scope type within the activity boundary [11,73,74]. This enables a magnitude ranking for comparisons between activity loads. This outcome can then be used as a guide as to where to prioritise initiatives for reducing energy and GHG emissions. This is a ‘bottom-up’ approach based on an energy pathway analysis, which starts at the energy users and goes back to the supply points.
The results in Table 3, Table A1, and Table A3 are shown to be linked by three activity areas: (1) ‘Port Operations’, (2) ’Port Energy Supply Infrastructure’, and (3) ‘Port Off-site Energy Supply’ (see Section 3.2). By applying a ‘bottom-up’ approach to the results in Table 3, Table A1 and Table A3, which map and connect the energy loads back to their energy supply points, the individual energy pathways and their connections are revealed. The port’s activity areas can then be superimposed back onto this map. This interpretation of the ‘Survey Framework Map‘ results is shown in Figure 3 as a Port Energy Map. The format allows either a top-down or bottom-up perspective to reveal the port as a multi-energy system with its key activities and interfaces.
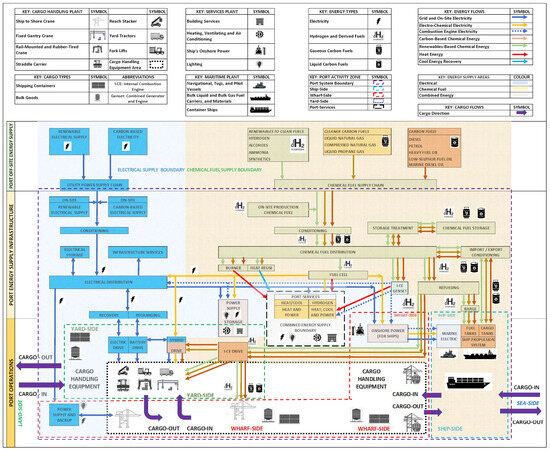
Figure 3.
Port Energy Map.
The port operations are connected by the cargo flow paths (purple arrows) through the activity areas, from the ship-side (blue dashed box) to the wharf-side (red dashed box) and then to the yard-side (green dashed box), with services required for buildings, warehouses, and working areas (services-side, the central black dashed box). The cargo handling plants are shown within the black dotted line box overlapping the wharf-side (red dashed box) and yard-side (green dashed box) areas.
The Port Energy Map has three sections shown vertically on the left side to divide the energy system (starting on the bottom left) into (1) ‘Port Operations’, (2) ‘Port Energy Supply Infrastructure’, and (3) ‘Port Off-site Energy Supply’. Within these three sections are the key components assigned using labels based on the contents of Table A1, Table A2 and Table A3 from the review papers’ contents. In Figure 3, the energy supplies start at the top of the schematic; they are shown on the top left for the ‘Port Supply’ of electricity and on the right side for chemical fuels.
The electrical supply, as shown in Figure 3, may be sourced from the utility grid as either carbon-based or renewable-based feed-stock, as shown in the ‘Port Off-site Energy Supply’ section. Alternatively, both electricity sources can be generated within the port system, as shown within the ‘Port Energy Supply Infrastructure’.
The electricity sourced from the grid in ports may require conditioning to ensure power quality, including power factor and harmonic corrections, at the utility connection point. It is then distributed through the ‘Port Energy Supply Infrastructure’.
This electricity serves various port services, providing general power and lighting in the wharf-side (red dashed box), yard-side (green dashed box), and services-side (black dashed box) activity zones. Within these zones, cargo handling equipment (black dotted box) utilises the electrical supply directly or through battery drive systems to vertically lift (e.g., wharf and fixed gantry cranes) and horizontally haul transport cargo throughout the port (e.g., rubber- and rail-mounted gantry cranes, yard tractors, straddle carriers, and forklifts) [8]. Some lifting equipment incorporates kinetic electrical energy recovery during lowering motions, and battery-powered machinery requires periodic recharging, with both having the potential for reverse power flows into the electrical distribution system. The electrical supply also powers HVAC services in buildings and warehouses, supports onshore supply for berthed ships (e.g., cold ironing), facilitates the recharging of battery electric small marine craft, and enables the cooling of reefer containers stored in the yard-side.
The electrical supply system boundary is indicated by light blue shading and blue boxes on the left side of Figure 3, with linkages to the ‘wharf-side’ services on the right side. The flow of electricity is represented by dark-blue arrows connecting various port activities.
On the top right side of Figure 3 is the Chemical Fuel Supply. This schematic can represent the current usage of carbon fuels (e.g., diesel, petrol, heavy and marine fuels), shown as dark-brown arrows and the oil-drum symbol; cleaner fuels (e.g., CNG, LNG, and LPG), shown as light-brown arrows with the gas cylinder symbol; and newer clean fuels from renewable sources (although they may also be sourced from carbon-based fuels), shown as green arrows with the hydrogen fuel (H2) bowser symbol (e.g., for hydrogen and hydrogen-containing fuels, covering alcohols (methanol and ethanol), ammonia, and other synthetic fuels). There may be more than one chemical fuel in use by the port, for example, diesel for the port-side transport plant and heavy fuel oil for ships. The ‘Chemical Fuels’ in Figure 3 are sourced from a supply chain, as shown in the ‘Port Off-site Energy Supply’ section. Alternatively, they may also be generated within the port system boundary, which is shown within the ‘Port Energy Supply Infrastructure’ section (e.g., hydrogen sourced using water electrolysis).
The chemical fuel is conditioned for quality, such as purity or appropriate physical form for handling, at the supply connection point before being distributed through the ‘Port Energy Supply Infrastructure’. The chemical fuels are then supplied to various port services across the ‘wharf-side’ (red dashed box), ‘yard-side’ (green dashed box), and ‘services-side’ (black dashed box) activity zones. The cargo handling equipment within these zones (the black dotted box) can use either internal combustion engines or a hybrid electrical drive plant to lift vertically (e.g., wharf and fixed gantry cranes) and haul horizontally through the port areas (e.g., rubber- and rail-mounted gantry cranes, yard tractors, reach stackers, straddle carriers, and forklifts) [8]. Additionally, chemical fuels are supplied to refuel berthed ships or transferred as a ship’s cargo for import or export through ‘wharf-side’ activities. The ‘Chemical Fuel Supply’ system boundary is indicated by light-brown shading with green boxes across the entire right side of Figure 3, with its linkages to the ‘wharf-side’ services displayed on the left side. The chemical fuel flows are shown with green, light-brown, and dark-brown arrows. The utilisation of chemical fuels is not limited to cargo handling equipment; they can also be utilised as a heating source in burners and boilers. Furthermore, they can be used in internal combustion engines that power generators to supply electricity as local services and for onshore power. Gaseous fuels like hydrogen, CNG and LNG, and LPG also have the potential for heat recovery through their depressurised gas expansion, which can be utilised as a coolant. Low-emission fuels, such as hydrogen, alcohols (methanol and ethanol), and ammonia, can also be utilised as input to fuel cells, which generate electricity through electrochemical processes. This electricity can potentially power stationary services and the transportation equipment required across various port activities. This technology is shown in the centre of Figure 3, with the energy flows depicted by orange arrows to centralised stationary facilities or for individual mobile equipment and vehicles.
The utilisation of Combined Energy Systems is also depicted at the centre of Figure 3, which includes the technologies of Combined Heat and Power (CHP), Combined Cooling, Heat, and Power (CCHP), and Combined Cooling, Heat, Power, and Hydrogen (CCHPH) when using a methanol feed. These systems can employ supplied chemical fuels for either internal combustion engines or fuel cell technologies to offer a variety of energy services for the stationary power applications in the port.
To address the temporal variations and uncertainties in energy supply and demand within the port energy system, it is probable that both the Electrical and Chemical Fuel Pathways will require energy storage technologies to balance input and output energy flows over various time scales. These energy storage systems are depicted on the left and right sides of Figure 3 within the corresponding energy supply boundaries.
The resulting Port Energy Map summarises the review papers’ contents to present the role of chemical fuels (including hydrogen) with electricity in decarbonising ports. The map unravels the energy pathways and their connections across the port, which are not quickly deduced from the labelling approach used in Table 3, Table A1, and Table A3. The mapping also results in a similar supply–distribution–storage–demand engineering schematic layout for both the ‘Electrical and Chemical Fuel Pathways’. The port energy system boundary is also defined, which can be used as a basis for the scoping of techno-economic studies.
Therefore, the Port Energy Map provides an overview of the required decarbonisation technologies, their deployment locations, and how different energy pathways may be implemented within the port system. However, it only addresses the first part of RQ #2 by presenting the decarbonisation options for hydrogen, without identifying technology gaps or specific opportunities. Therefore, a further presentation format is needed to answer RQs #2 and #3. The following sections discuss the approach used to address these questions.
4.3. A Port Energy System Taxonomy Perspective
The Port Energy Map provides an overview of all the energy pathways within a port energy system, which are now distinguishable in comparison to the results presented in Table 3, Table A1, and Table A3. However, this map is still complicated and does not illustrate how the various pathways are linked to the same port activities, which is crucial for evaluating the decarbonisation opportunities for hydrogen. To address this, Figure 4 offers a further interpretation of the Port Energy Map by featuring two linear pathways for supplied electricity and hydrogen fuel, which progress through the same three groups of port activities depicted in Figure 3. These pathways are represented by the ‘Port Off-Site Energy Supply’ points at the top of Figure 4, with separate paths on the left and right sides leading down to the ‘Port Energy Supply Infrastructure’ (also in Figure 4), and finally, the ‘Port Operations’ containing energy-using loads, shown in Figure 5. The central icon boxes illustrate the port’s energy-using activities, which are connected to supply technologies on both the central left and right sides of Figure 4 and Figure 5, which, in turn, are then linked to the main trunks for the respective energy supply types. On the left side, the blue-coloured pathways and arrows represent the energy flows for electricity, and on the right side, the green pathways and arrows are for hydrogen fuel. This framework utilises the same hierarchy and heading labels for both pathways.
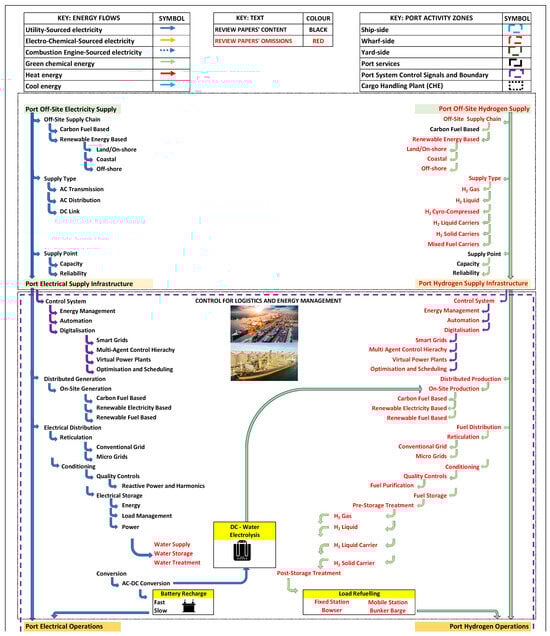
Figure 4.
The Port Energy System Taxonomy—Part 1: Port Off-Site Energy Supply and Port Energy Supply Infrastructure. The taxonomy legend above also applies to Figure 5 below.
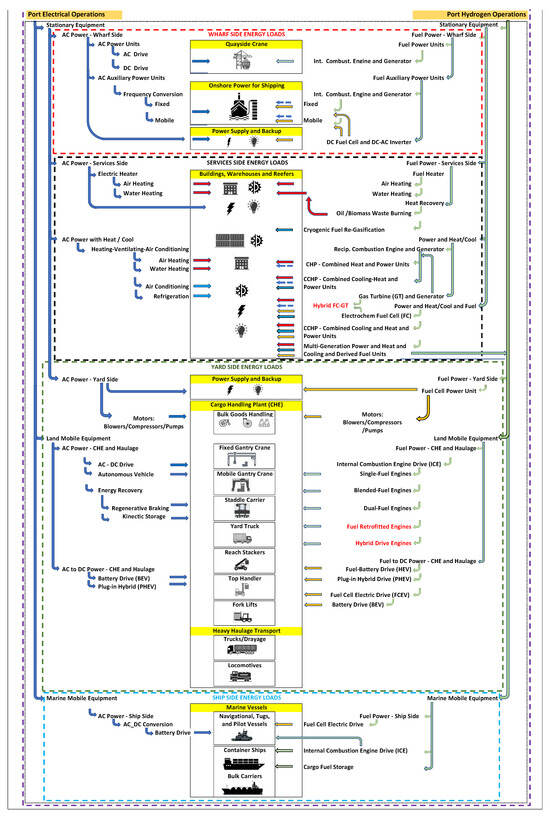
Figure 5.
The Port Energy System Taxonomy—Part 2: Port Operations. For the schematic’s legend, see Figure 4.
The schematic in Figure 4 shows that both main trunks have several side branches with sub-branches. The contents of these side branches are categorised based on the energy transfer, conversion, and usage technologies. The sub-branches provide a list of equipment types used across port activities, which are displayed in the centre of Figure 4. An exception to this description is shown at the top of Figure 4 by using purple arrows to represent the type of energy ‘Control System’ (as listed from the 12 review papers), which may be applied to manage the energy flows within the ’Port Supply Infrastructure’. The two energy pathways are uniquely characterised and comprehensively classified using a proposed framework known as the Port Energy System Taxonomy.
The review papers’ contents from Table A1, Table A2 and Table A3 were selectively inserted into the side and sub-branches in black text, as shown in Figure 4. This framework also allows more energy paths, as the main trunks, and technologies in the side and sub-branches to be inserted. The contents of Figure 4 and Figure 5 would then represent a ‘Multi-fuel Port’ [75,76].
The lower half of Figure 4 illustrates where the electricity and hydrogen supply paths converge at the energy-using activities shown in the schematic centre. This convergence presents opportunities for using either energy supply type. By examining the central right side of Figure 4, it becomes apparent that there are more potential options for implementing hydrogen technologies compared to those for electricity across the ‘Port Operations’ category. The convergence points within the framework represent the identified opportunities for using hydrogen technologies in ports for each of the operational activities.
Therefore, the proposed Port Energy System Taxonomy depicted in Figure 4 and Figure 5 is a format that clearly illustrates how energy pathways can be linearly traced, along with the available decarbonisation technology options for almost all ‘Port Operations’ using hydrogen. This format provides a clear understanding of both the requirements and potential deployment areas for hydrogen technologies, which is the first part of the response to RQ #2.
4.4. The Identified Opportunities for Hydrogen to Decarbonise Ports
The Port Energy System Taxonomy presented in Figure 4 and Figure 5 shows that electrification has the potential to decarbonise almost all of the port activities, as indicated by the black text along the left main trunk of the taxonomy hierarchy. The review papers analysed in the study mainly focused on renewable electricity generation on or off the port site, which is reflected in the extensive coverage of electrification technologies. The extensive black-text coverage across the port activities reflects the commercial maturity for deploying electrification technologies.
In contrast, there are content gaps in the review papers for hydrogen technologies, as evidenced by the red-text coverage in the Hydrogen Supply Path, mainly in Figure 4, but also in Figure 5. However, some of these gaps may be filled by commercially available and near-commercial hydrogen technologies that are not considered viable for port use and are consequently omitted from the review papers.
In Figure 4 and Figure 5, the black-text coverage for the ‘Hydrogen Supply Path’ is concentrated in the ‘Port Operations’ category, indicating a focus on hydrogen technologies available for the port’s energy-using activities. However, the lack of coverage in the ‘Off-Site Supply’ and ‘Infrastructure’ categories in the red text suggests that hydrogen technologies are potentially available for port deployment but lack off-site supply chains, on-site production elements, and supply infrastructure. This result aligns with the coverage of the ‘Alternative Clean Fuels’ content shown in Table A1, Table A2 and Table A3, revealing the technology barriers and operational risks for hydrogen as an energy supply for ports.
Figure 6, Figure 7 and Figure 8 extract these content gaps in hydrogen technologies, as shown in the red text in Figure 4 and Figure 5. These represent the technology adoption barriers that are primarily in the ‘Port Fuel Supply’ (Figure 6) and ‘Port Infrastructure’ (Figure 7) categories, but with fewer gaps in the ‘Port Operations’ (Figure 8) category.
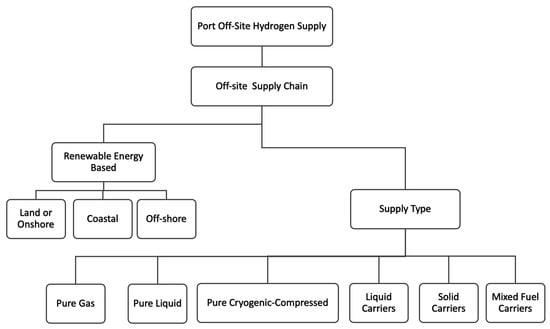
Figure 6.
The hydrogen technology content gaps identified within the Port Energy System Taxonomy—Grouping: Port Off-site Hydrogen Supply.
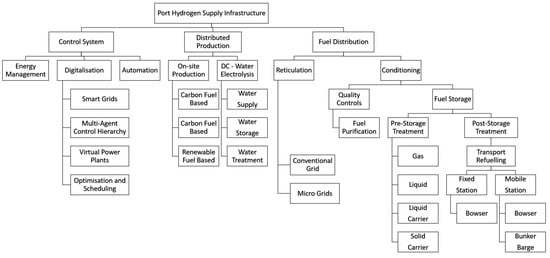
Figure 7.
The hydrogen technology content gaps identified within the Port Energy System Taxonomy—Grouping: Port Hydrogen Supply Infrastructure.
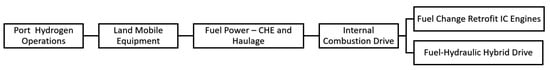
Figure 8.
The hydrogen technology content gaps identified within the Port Energy System Taxonomy—Grouping: Port Hydrogen Operations.
The main content gaps for the ‘Off-site Hydrogen Supply’ are shown in Figure 6, which highlights the requirements for available renewable energy feed-stocks in the supply chain, as well as the physical form of hydrogen to be determined for its supply and distribution. A real-world example of this opportunity is the Port of Hamburg, which is developing its infrastructure for importing green ammonia for use as the hydrogen energy carrier into the adjacent regional economy for both industry and transport sectors [77].
The largest content gap listings, as shown in Figure 7, are for the Port Infrastructure, which highlights the following:
(1) Control Systems are required to manage hydrogen fuel through the port’s infrastructure and control interfaces with the electricity supply and automated plant. The use of emerging digital technologies for the electrical supply side is also applicable to the hydrogen side for providing integrated fuel controls and energy management systems. These energy controls are required for smart grids and virtual power plants, comprising both on- and off-site renewable energies, and for the optimisation and scheduling of the port’s multiple energy demands [78,79].
(2) There is potential for the ‘On-site Production of Hydrogen’ based on local renewables or low-carbon energies, together with the water supplies required for on-site electrolysis plants. The feed-stock water will also require on-site handling, purity treatments, and storage facilities. Again, a key consideration will be the hydrogen fuel’s physical form for its local supply and distribution with storage facilities for users across ‘Port Operations’ [80]. Valenciaport provides a development example with the installation of on-site hydrogen production and supply to support its hydrogen vehicle trials [81].
(3) On-site ‘Fuel Distribution’ systems may utilise conventional pipeline reticulation or micro-gas (grid) layouts or potentially use only localised storage facilities. These different systems will need fuel conditioning, purity controls, pre- and post-storage treatments, storage facilities, and refuelling stations for stationary and mobile plants [82]. The Port of Rotterdam has an extensive decarbonisation plan requiring a hydrogen network to be installed across the port’s economic zone for its energy transition [83].
For the ‘Port Operations’ in Figure 8, a key hydrogen opportunity is its potential for direct use in retrofitted internal combustion engines, or as a blended fuel mixture, to power mobile plants [84,85,86]. This decarbonisation pathway may then avoid, or minimise, the conversion of the large number of cargo handling plant types used in ports, from combustion engine drive to fuel cell power drive systems (Figure 3). For example, Valenciaport is trialling Reach Stackers and Yard Tractors using hydrogen-powered fuel cells instead of diesel-fuelled ICEs [87]. Alternatively, emerging hybrid power drive systems that can use a combination of an electric motor, an electrical battery, and hydrogen fuel cells may provide increased operational reliability and flexibility with a reduced dependency on one fuel type. The Port of Vancouver and DP World are scheduling trials for a prototype dual-powered hydrogen fuel cell–diesel RTG [88]. This hybrid energy pathway for the port’s mobile plant potentially provides a managed approach to reducing carbon emissions by enabling stepped decreases in the carbon content of the energy supplies. This, in turn, requires stepped increases in the renewable energy content within the hydrogen and electricity supplies.
A supply exception for both electricity and hydrogen energies is shown at the base of Figure 5 for the powering of large marine vessels (‘Marine Mobile Equipment’), which are the bulk of the world’s shipping fleet [9]. For large vessels, currently, electric battery technologies are not viable for this application due to their greater mass and volume requirements compared with Alternative Clean Fuels [3]. However, hydrogen is also potentially not viable due to its lower energy density, which requires larger storage tanks, and it has higher supply costs and a lower technical maturity when compared to the competing clean fuels of methanol, ammonia, CNG, and LNG [3]. However, a notable development is the Lloyd’s Register-type approval for BeHydro’s dual diesel–hydrogen internal combustion engines (ICEs) for ships [89]. For small marine vessels, the use of hydrogen fuel cells is being progressed at the Port of Amsterdam [90], and the Port of Antwerp-Bruges has an operating hydrogen-fuelled ICE tugboat [91].
Notably, the shipping sector’s fuel decarbonisation directions will need supporting port services, which will require investments in new refuelling and storage facilities. Therefore, the shipping sector’s decisions on using clean fuels are likely to influence the fuels that are adopted and used by ports. An example of this development is the ‘Green Shipping Corridors’ initiative based on ports supplying clean fuels and storage facilities for ships traversing defined inter-port routes, with a recent example being the plan announced between the Ports of Los Angeles, Long Beach, and Shanghai for a trans-Pacific green shipping corridor [92,93].
In Figure 5, the nodes where the electricity and hydrogen pathways converge for the same ‘Port Operations’ are potential opportunities for deploying hydrogen technologies. These opportunities are the potential to use hydrogen as follows:
- Directly or indirectly connect to, displace, or complement the use of network-supplied electricity, which is either grid-sourced or on-site generated, for the port’s stationary and mobile plant applications. For example, the Port of Leith is trialling the use of hydrogen for PlusZero’s combustion engine to generate onshore electricity for tugboats when they are in port instead of using network electricity [94].
- Use it to ‘blend with’ or ‘drop-in’ replace existing carbon fuels across the port’s stationary and mobile plant applications [84,85,86]. An example is the Port of Gothenburg ‘Tranzero Initiative’ with the building of hydrogen refuelling infrastructure for land-side heavy vehicles and machinery [95,96].
- Provide a range of combined energy services for powering, heating, and cooling, potentially with fuel production, to match those services individually provided by either procured electricity or carbon-based fuels (e.g., by using CHP, CCHP, or CCHPH technologies). An example is the Duisport development, which will use hydrogen fuel cells with hydrogen combustion engines to meet the port’s respective peak and base-load energy requirements [97].
- Progressively decarbonise the port activities by incrementally changing the equipment types and fuel usage. An example is the trigeneration system at the Port of Long Beach operated and serviced by FuelCell Energy that converts renewable biogas into a combined output of electricity, Green Hydrogen, and usable water, with the hydrogen being supplied to Toyota’s fuel cell vehicles and truck operations within the port [98].
Most ports have opportunities for procuring or investing in off-site energy supply chains or on-site energy production, which may also include off- and on-site renewable energies, as shown in Figure 4. These options can provide a port with a portfolio of technical and economic pathways for managing and reducing its emissions. Therefore, the taxonomy shown in Figure 4 and Figure 5 clarifies the following:
- The opportunities for using hydrogen technologies in a port, which is a response to RQ #2;
- The content gaps, which are the technology barriers and research opportunities.
For hydrogen deployment in ports, this requires (1) a zero- or low-emission fuel supply chain, located off- or on-site, (2) the infrastructure for managing and controlling the fuel itself, which can (3) integrate with the other energy supplies and energy-using activities, with (4) the use of efficient fuel distribution, together with storage technologies. This is a response to RQ #3.
Therefore, for assessing the port decarbonisation options, the Port Energy System Taxonomy shows ‘what’ is required, ‘where’ to deploy hydrogen technologies, and ‘how’ the hydrogen energy pathways interface with the other energy supplies across the port’s energy system. Therefore, the proposed taxonomy presents the identified opportunities for deploying hydrogen technologies in ports.
4.5. Research Directions for the Port Energy System Taxonomy
The proposed Port Energy System Taxonomy provides a simplified and connected view of a port’s complex energy system by breaking it down into linear supply pathways. This taxonomy can easily accommodate additional pathways and can be enriched with information and metrics related to energy usage, losses, emissions, costs, and life-cycle analysis. The taxonomy’s unique definition for each pathway enables the clear definition of the scope for techno-economic studies.
The structure presented in Figure 4 and Figure 5 is a hybrid between a taxonomy and an energy map (Figure 3), which also defines the infrastructure for an energy hub that characterises a port’s multi-energy system [51,74,99]. This structure can be expanded to encompass all energy pathways, including water as a hydrogen fuel feed-stock. The resulting structure merges an energy hub model with a hydrogen (and electricity) supply chain model and also provides the basis for a superstructure framework [80,100,101].
Thus, the Port Energy System Taxonomy is envisioned as a tool for defining and evaluating the decarbonisation options with hydrogen and other energies used in ports.
4.6. Limitations of the Review
Finally, this review has limitations arising from an approach scoped to contain both the breadth and depth of the results. The primary and secondary academic papers, plus the grey literature, available for the subject enquiry are extensive and have expanded further since the search period’s end in September 2022. This paper’s results have a risk of bias from using only one, albeit extensive, web search engine’s database. Additionally, the review papers’ authors’ and this paper’s reviewer’s biases, omissions, and subjective categorisations in interpreting and presenting the results from only 12 source papers will have bias. However, the risk of results bias is difficult to quantify without significantly expanding the subject enquiry to multiple literature databases and checking each review paper’s contents against their source literature. Therefore, it is recommended that this paper’s results be used to provide a clearer overview and framework and the starting points for progressing opportunities. However, despite these limitations, the approach has condensed the subject into key categories with two new analysis tools for interpreting a port energy system. These tools can be improved and adapted in future reviews that are devised to reduce bias, and they are also expandable to undertake broader and deeper reviews of the literature.
5. Conclusions
This paper presents an SLR that aimed to identify and filter a large body of literature on the decarbonisation options for ports. The SLR identified key journal-sourced review papers published between 2015 and 2022. These review papers used a survey approach to summarise their source papers’ contents and categorised them using a typology. However, the typological categories used by the review papers were insufficient to unravel the complexities of a port energy system.
To address this limitation, this paper used a tertiary review approach and devised a Survey Framework Map using a top-down typology approach with an expanded list of categories. The review papers’ contents were further categorised in this paper based on port energy supply types, energy supply infrastructure, and port operations that use energy. The resulting Port Energy Map reveals the port’s energy system and its pathways to provide an overview of the decarbonisation options for ports.
The Port Energy Map was then transformed into a structure comprising two parallel linear pathways to represent the electricity and hydrogen energy paths through a port system. Each pathway progressed through three sequential activity groups, starting at the Port Fuel Supply points, leading to the Port Infrastructure and then to the port activities’ energy loads. Both pathways used a series of side and sub-branches for inserting the review papers’ contents. This resulting structure and content are a proposed Port Energy System Taxonomy to present the role of hydrogen and electricity in decarbonising ports.
The devised Port Energy System Taxonomy provides an assessment of the decarbonisation options for ports, including ‘what’ is required, ‘where’ to deploy hydrogen technologies, and ‘how’ the energy pathways are and potentially could be connected. The taxonomy results provide the identified opportunities for deploying hydrogen technologies in ports. Across port operations, hydrogen technologies are shown to have the potential to connect to, displace, or complement utility- and off-grid-sourced electricity supplies and replace current carbon fuels.
The taxonomy approach can identify and separate each energy pathway, highlight its characteristics, and provide each with a unique definition. Therefore, the taxonomy provides a framework for use in techno-economic studies for operational ports through the inclusion of their energy supply chains and the energy hub infrastructure, together with the stationary plant and transport energy-using activities. The framework defines the energy paths and technologies as a basis for comparing port decarbonisation options. The envisioned research direction for the Port Energy System Taxonomy and the Port Energy Map is their use as tools to unravel the multiple energy pathways within a port system.
Funding
This research received no external funding.
Acknowledgments
D. Holder has received PhD scholarship from the Australian Governments Research Training Program (RTP). All figure inserted icons and photos shown in this paper are sourced from the Adobe Creative Cloud stock items under an Education Licence with Swinburne University of Technology for use under professional and academic activities (https://stock.adobe.com/au/enterprise-conditions (accessed on 1 May 2023)).
Conflicts of Interest
The authors declare that they have no conflict of interest.
Appendix A
Appendix A presents further details from the review papers identified by the SLR methodology, as described in Section 2.
Appendix A.1
Table A1, Table A2 and Table A3 present the second approach to categorising the review papers’ contents, as discussed in Section 3.2.
Appendix A.2
Table A4, Table A5, Table A6 and Table A7 present the first approach to categorising the review papers’ contents into three subject levels, as discussed in Section 3.1. This first approach and its results led to the categorisation discussed in Section 3.2, with the summarised results shown in Table 3 and full details in Table A1, Table A2 and Table A3.
Table A1.
The Survey Framework Map results (Section 3.2) presenting the review papers’ coverage for Port Off-Site Energy Supply. Note: The table excludes tools for Modelling and Simulation, Administrative, Policy and Regulatory, and Incentive/Penalty Schemes.
Table A1.
The Survey Framework Map results (Section 3.2) presenting the review papers’ coverage for Port Off-Site Energy Supply. Note: The table excludes tools for Modelling and Simulation, Administrative, Policy and Regulatory, and Incentive/Penalty Schemes.
| Activity | Electrical Supply | CNG and LNG | CNG and LNG | Alcohol/Biofuel | Hydrogen | Biomass and Waste to Fuels | Electrical Supply | Fuel Supply | Hydrogen | Alcohol/Biofuel | Electrical Supply | Electrical Supply | Fuel Supply | Electrical Supply |
|---|---|---|---|---|---|---|---|---|---|---|---|---|---|---|
| Technology Niche | Grid Low-Carbon-Based Electricity | Reliable External Supply | Development Considerations and Timeframes | Development Considerations and Timeframes | Development Considerations and Timeframes | Development Considerations and Timeframes | Virtual Power Plants | Alternative Fuel Bunkering | Reliable External Supply | Blended Alcohols with Diesel Fuels | Grid Renewable Energy | Local Renewable Energy—Coastal/ Offshore-Sited | Alternative Fuels’ Supply | Local Renewable Energy—Land/ Onshore-Sited |
| Reference | [20] | [8] | [22] | [22] | [22] | [22] | [20,53] | [18,20] | [18,22] | [4,8,20,24] | [4,8,20,22,23,24] | [4,8,21,24,52,53] | [8,18,20,21,22,23,24] | [4,8,20,21,22,23,24,52,53,54] |
| Count | 1 | 1 | 1 | 1 | 1 | 1 | 2 | 2 | 2 | 4 | 6 | 6 | 7 | 10 |
Table A2.
The Survey Framework Map results (Section 3.2) presenting the review papers’ coverage for Port Energy Supply Infrastructure. Note: The table excludes tools for Modelling and Simulation, Administrative, Policy and Regulatory, and Incentive/Penalty Schemes.
Table A2.
The Survey Framework Map results (Section 3.2) presenting the review papers’ coverage for Port Energy Supply Infrastructure. Note: The table excludes tools for Modelling and Simulation, Administrative, Policy and Regulatory, and Incentive/Penalty Schemes.
| Activity | Energy Management | Energy Efficiency | Energy Efficiency | Electrical Supply | Electrical Distribution | Ammonia | Ammonia | Alcohol/Biofuel | Alcohol/Biofuel | Alcohol/Biofuel | LPG | LPG | Biomass and Waste to Fuels | ||
| Technology Niche | Development Considerations and Timeframes | Multi-Agent System (MAS) Energy Control Hierarchy | Plant Upgrade and Maintenance | Integrated Power Supply Systems | Smart Energy Management | On-Site Production | Bunkering Storage for Refuelling (Fixed or Mobile Plant) | On-Site Production | Internal Distribution | Power Generation | Bunkering Storage for Refuelling (Fixed or Mobile Plant) | Internal Distribution | Power Generation | ||
| Reference | [22] | [52] | [20] | [52] | [8] | [20] | [24] | [23] | [24] | [4] | [54] | [54] | [21] | ||
| Count | 1 | 1 | 1 | 1 | 1 | 1 | 1 | 1 | 1 | 1 | 1 | 1 | 1 | ||
| Activity | Ship Arrival | Ship Berthing | Energy Optimisation | Energy Optimisation | CNG and LNG | Energy Management | Energy Optimisation | Electrical Supply | CNG and LNG | Alcohol/Biofuel | Hydrogen | Biomass Waste to Fuels | Energy Management | Hydrogen | Hydrogen |
| Technology Niche | Midstream Operations | Ship Scheduling | Smart Port Internet of Things | Plant Resource Flow Scheduling | Internal Distribution | Energy Cost Optimisation | Digitalisation | Distributed Generation/ Power Systems | Power Generation | Bunkering Storage for Refuelling (Fixed or Mobile Plant) | Internal Distribution | On-Site Production | Integrated ICT Energy Monitoring Controls | On-Site Production | Power Generation |
| Reference | [20,23] | [20,53] | [52,53] | [8,52] | [8,24] | [8,53,54] | [20,52,53] | [4,53,54] | [4,20,22] | [20,23,24] | [18,21,22] | [8,21,22] | [8,20,22,23] | [4,20,22,54] | [4,20,22,52] |
| Count | 2 | 2 | 2 | 2 | 2 | 3 | 3 | 3 | 3 | 3 | 3 | 3 | 4 | 4 | 4 |
| Activity | Ship Berthing | Electrical Supply | Ship Arrival | Electrical Distribution | Hydrogen | Ship Berthing | Ship Berthing | Energy Management | Energy Management | Energy Efficiency | Electrical Distribution | CNG and LNG | Energy Management | Electrical Distribution | Ship Arrival |
| Technology Niche | Ship Yard Allocation | Upgraded Grid Supply, Reliability Power Quality | Virtual Arrival Just-in-Time Berthing | Bulk Energy Power Storage | Bunkering Storage for Refuelling (Fixed or Mobile Plant) | Ship Berth Allocation | Automated Mooring Systems (AMS) | Energy Info Systems (Measuring, SCADA, Forecasting) | Energy Load Management | Energy Efficiency Energy Savings | Smart Grids | Bunkering Storage for Refuelling (Fixed or Mobile Plant) | Energy Management Practices | Microgrids | Vessel Speed Reduction |
| Reference | [8,20,23,52] | [4,8,18,21,52] | [8,20,21,22,23,24] | [4,8,20,22,52,53] | [18,21,22,23,52,54] | [8,20,22,23,24,30,52] | [8,20,21,22,23,24,53] | [8,20,21,22,23,24,53] | [4,8,18,20,22,23,52] | [8,20,21,22,23,52,53] | [8,20,21,22,52,53,54] | [8,20,21,22,23,24,52] | [8,20,21,22,23,24,52,53] | [4,8,18,20,21,22,52,53] | [8,20,21,22,23,24,30,52,53,54] |
| Count | 4 | 5 | 6 | 6 | 6 | 7 | 7 | 7 | 7 | 7 | 7 | 7 | 8 | 8 | 10 |
Table A3.
The Survey Framework Map results (Section 3.2) presenting the review papers’ coverage for Port Operations. Note: The table excludes tools for Modelling and Simulation, Administrative, Policy and Regulatory, and Incentive/Penalty Schemes.
Table A3.
The Survey Framework Map results (Section 3.2) presenting the review papers’ coverage for Port Operations. Note: The table excludes tools for Modelling and Simulation, Administrative, Policy and Regulatory, and Incentive/Penalty Schemes.
| Activity | Ammonia | Ammonia | Ammonia | LPG | LPG | Fuel Loads | Service Loads | Service Loads | Load Recovery | Electrical Loads | Electrical Loads | Load Recovery | Load Recovery | Ship Refuelling |
| Technology Niche | Transport—Maritime | Transport Plant—Land-side | Power Generation | Dual Fuel with Diesel | Onshore Power Plant Supply (Cold Ironing) | Eco-driving Cargo Handling Equipment Vehicles | Services Hot Water Heating | Trigeneration (Power–Heat–Hydrogen) | Oily-Waste Disposal Heat Recovery | Bulk Materials Handling (Conveyor Belts Buckets) | Bulk Liquids Solids Pipes Storage/Silo Facilities Insulation | Cryogenic Fuel Heat Recovery | Biofuels/ Biomass/ Waste for Heating Hot Water | LPG |
| Reference | [20] | [20] | [20] | [54] | [52] | [21] | [22] | [4] | [22] | [8,20] | [8,20] | [8,20] | [8,21] | [4,54] |
| Count | 1 | 1 | 1 | 1 | 1 | 1 | 1 | 1 | 1 | 2 | 2 | 2 | 2 | 2 |
| Activity | Alcohol/Biofuel | LPG | Service Loads | Ship Refuelling | Ship Refuelling | Alcohol/Biofuel | Energy | Electrical Loads | Electrical Loads | CNG LNG | Energy Efficiency | Electrical Loads | Fuel Loads | Energy Efficiency |
| Technology Niche | Transport Plant—Land-side | Transport—Maritime | Reefer Container Plug-in Cool/Temp. Control/Shading Sealing | Ammonia | Synthetic Fuels | Transport—Maritime | Energy Efficiency HVAC | Cargo Handling Scheduling Options | Cargo Handling Plant Energy Power Storage | Transport—Maritime | Load Management (Shifting/ Sharing/ Shedding) | Cargo Handling Plant Kinetic Regeneration/Braking | Fuel Cells (Stationary Mobile Power Units) | Energy-Efficient Lighting |
| Reference | [4,8,22] | [4,52,54] | [4,8,21] | [20,23,54] | [23,24,54] | [4,8,22,52] | [20,21,22,54] | [8,20,30,52] | [8,18,20,52] | [4,8,20,21,22] | [8,20,22,30,52] | [8,20,21,30,52] | [4,18,21,53,54] | [8,20,21,22,23,52] |
| Count | 3 | 3 | 3 | 3 | 3 | 4 | 4 | 4 | 4 | 5 | 5 | 5 | 5 | 6 |
| Activity | Fuel Loads | Fuel Loads | Service Loads | CNG LNG | Hydrogen | Service Loads | Ship Refuelling | Ship Refuelling | Electrical Loads | CNG LNG | Hydrogen | Hybrid Loads | Hybrid Loads | Fuel Loads |
| Technology Niche | Cargo Handling Equipment Fuel Cells | Modal Shift/Split | Building—Air Heating | Transport Plant—Land-side | Transport—Maritime | Building Warehousing Services CHP CCHP (Power–Heat Cool/Air Conditioning) | Electric Ships (Fuel Cells, Batteries, Hybrids) | Methanol, Ethanol (Biofuel equiv.) | Battery-Charging Stations Charging Controls | LNG-Onshore Power Plants (Cold Ironing) | Transport Plant—Land-side | Cargo Handling Hybridisation Options | Vehicle Hybridisation (Fuel/ Electric Systems) | Cargo Handling Alternative Fuel Options |
| Reference | [4,8,18,20,21,22] | [8,18,20,21,24,54] | [4,8,20,21,22,52] | [4,8,20,21,22,54] | [4,8,20,22,24,52,53] | [4,8,20,21,22,52,53] | [4,8,20,21,23,52,54] | [4,20,22,23,24,52,54] | [4,8,18,20,21,52,54] | [4,8,20,21,23,24,52,54] | [4,8,18,20,21,22,24,52] | [4,8,18,20,21,22,24,52] | [4,8,18,20,21,22,24,52] | [4,8,18,20,21,22,24,53] |
| Count | 6 | 6 | 6 | 6 | 7 | 7 | 7 | 7 | 7 | 8 | 8 | 8 | 8 | 8 |
| Activity | Ship Refuelling | Ship Refuelling | Electrical Loads | Electrical Loads | Electrical Loads | Electrical Loads | Fuel Loads | |||||||
| Technology Niche | Hydrogen | LNG | Cargo Handling Electrification Options | Electrification | Automation | Onshore Power Plants’ Supply (Cold Ironing) | Haulage Transport Power Drives (Trucks, Trains) | |||||||
| Reference | [4,8,20,22,23,24,52,54] | [4,8,20,21,22,23,24,52,54] | [4,18,20,21,22,23,24,30,52] | [4,8,18,20,21,22,24,30,52,54] | [4,8,18,20,21,22,23,24,30,52] | [4,8,20,21,22,23,24,30,52,53,54] | [8,20,21,22,24,30]¸ [4,18,52,53,54] | |||||||
| Count | 8 | 9 | 9 | 10 | 10 | 11 | 11 |
Table A4.
Reviewed papers’ contents categorised into the three subject levels discussed in Section 3.1 for Port Operations—Part 1.
Table A4.
Reviewed papers’ contents categorised into the three subject levels discussed in Section 3.1 for Port Operations—Part 1.
| Category Level | ||||||||||||||||||||
| 1 | PORT OPERATIONS—PART 1 | |||||||||||||||||||
| 2 | Emissions | Energy Management Measurement | Optimisation | Energy Efficiency | ||||||||||||||||
| 3 | Port Type | Emissions | Carbon Reduction: Case Study, Modelling Framework | Carbon Reduction: Case Study, Analysis Method | Best-Practice Green Practices | Energy Management Plans | Energy Information Systems | Real-Time Energy Monitoring | Measuring and Estimating Energy | Energy-Aware Operations | Equipment Measures | Digitalisation | Smart Port Internet of Things | Energy Efficiency Measures | Energy-Efficient Lighting | Crane Scheduling | Multi-Agent System (MAS) Energy Controls | Load Management | Equipment Maintenance | |
| Ref. | [8] | X | X | X | X | X | X | |||||||||||||
| [30] | X | X | ||||||||||||||||||
| [24] | ||||||||||||||||||||
| [20] | X | X | X | X | X | X | X | |||||||||||||
| [22] | X | X | X | |||||||||||||||||
| [21] | X | X | X | |||||||||||||||||
| [52] | X | X | X | X | X | X | ||||||||||||||
| [23] | X | |||||||||||||||||||
| [53] | X | X | X | X | X | X | ||||||||||||||
| [54] | X | X | ||||||||||||||||||
| [4] | ||||||||||||||||||||
| [18] | ||||||||||||||||||||
| Count | 1 | 1 | 1 | 1 | 1 | 5 | 2 | 2 | 1 | 2 | 1 | 3 | 2 | 4 | 2 | 1 | 1 | 4 | 1 | |
Table A5.
Reviewed papers’ contents categorised into the three subject levels discussed in Section 3.1 for Port Operations—Part 2.
Table A5.
Reviewed papers’ contents categorised into the three subject levels discussed in Section 3.1 for Port Operations—Part 2.
| Category Level | |||||||||||||||||||||||||
| 1 | PORT OPERATIONS—PART 2 | ||||||||||||||||||||||||
| 2 | Power Supply | Power Distribution | Fuel Supply | Operations | Equipment | ||||||||||||||||||||
| 3 | Power Supply | Integrated Power Supply Concept | Renewable Energy | Virtual Power Plants | Distributed Generation/ Power Systems | Smart Energy Management | Microgrids | Smart Grids | Energy Power Storage | Alternative Clean Fuels | Alternative Fuel Bunkering | Electrification | Automation | Hybridisation | Cargo Handling Electrification Options | Cargo Handling Plant Fuel Options | Cargo Handling Plant Hybridisation Options | Eco-driving of Terminal Equipment | Onshore Power Supply | Fuel Cells | Charging Stations | Building Services (Power–Heat–Cooling) | Reefer Container Cooling | Truck Emissions | |
| Ref. | [8] | X | X | X | X | X | X | X | X | X | X | ||||||||||||||
| [30] | |||||||||||||||||||||||||
| [24] | |||||||||||||||||||||||||
| [20] | X | X | X | X | X | X | X | X | X | X | X | X | |||||||||||||
| [22] | X | X | X | X | X | X | X | ||||||||||||||||||
| [21] | X | X | X | X | X | X | X | X | X | X | X | ||||||||||||||
| [52] | X | X | X | X | X | X | X | X | X | ||||||||||||||||
| [23] | X | X | |||||||||||||||||||||||
| [53] | X | X | X | X | X | ||||||||||||||||||||
| [54] | X | X | X | X | X | X | |||||||||||||||||||
| [4] | X | X | X | X | X | X | X | X | X | ||||||||||||||||
| [18] | X | X | X | X | X | X | X | X | |||||||||||||||||
| Count | 1 | 1 | 9 | 2 | 3 | 1 | 7 | 6 | 4 | 8 | 2 | 6 | 4 | 2 | 3 | 2 | 1 | 1 | 7 | 4 | 1 | 2 | 1 | 1 | |
Table A6.
Reviewed papers’ contents categorised into the three subject levels discussed in Section 3.1 for Shipping Operations.
Table A6.
Reviewed papers’ contents categorised into the three subject levels discussed in Section 3.1 for Shipping Operations.
| Category Level | |||||||||||||||||||||
| 1 | SHIPPING OPERATIONS | ||||||||||||||||||||
| 2 | Emissions | Ship Design | Operations | Logistics | |||||||||||||||||
| 3 | Evaluation of Emissions | Ships’ Carbon Intensity Indicators (CIIs) | Planning for Zero Emissions | Exhaust Emissions | Emissions Modelling | Exhaust Emissions Capture | Ship Design | Ship Propulsion Systems | Low-Carbon Shipping | Ship Energy Efficiency | Ship Mobility | Bunker Consumption | Automated Mooring Systems | Logistics: Speed Optimisation | Logistics: Ship Routing and Scheduling | Logistics: Berth Allocation | Logistics: Yard Allocation | Modal Shift/Split | Truck Congestion reduction | Logistics: Supply Chain | |
| Ref. | [8] | ||||||||||||||||||||
| [30] | X | X | X | X | X | X | X | X | X | X | X | X | |||||||||
| [24] | |||||||||||||||||||||
| [20] | X | X | X | X | X | X | X | ||||||||||||||
| [22] | X | X | X | ||||||||||||||||||
| [21] | X | ||||||||||||||||||||
| [52] | |||||||||||||||||||||
| [23] | X | X | |||||||||||||||||||
| [53] | |||||||||||||||||||||
| [54] | X | X | |||||||||||||||||||
| [4] | |||||||||||||||||||||
| [18] | X | ||||||||||||||||||||
| Count | 1 | 1 | 1 | 1 | 1 | 1 | 1 | 1 | 1 | 1 | 1 | 1 | 2 | 4 | 2 | 3 | 1 | 1 | 2 | 1 | |
Table A7.
Reviewed papers’ contents categorised into the three subject levels discussed in Section 3.1 for Administrative Operations.
Table A7.
Reviewed papers’ contents categorised into the three subject levels discussed in Section 3.1 for Administrative Operations.
| Category Level | |||||||
| 1 | ADMINISTRATIVE OPERATIONS | ||||||
| 2 | Management | Policy | |||||
| 3 | Port Green Policies | Port Incentives | Bunker Levies | Port–City Integration | Climate Change Policy, Regulation, Carbon Tax | ||
| Ref. | [8] | ||||||
| [30] | X | X | |||||
| [24] | |||||||
| [20] | X | X | |||||
| [22] | |||||||
| [21] | X | ||||||
| [52] | X | ||||||
| [23] | X | ||||||
| [53] | X | ||||||
| [54] | |||||||
| [4] | |||||||
| [18] | |||||||
| Count | 2 | 1 | 1 | 1 | 3 | ||
References
- World Port Sustainability Program. Ports Carbon Footprinting. 2010. Available online: https://sustainableworldports.org/carbon-footprinting (accessed on 13 March 2024).
- EU Directorate-General. Inclusion of Maritime Emissions in the EU Emissions Trading System. 2023. Available online: https://climate.ec.europa.eu/eu-action/transport/reducing-emissions-shipping-sector_en (accessed on 13 March 2024).
- Gray, N.; McDonagh, S.; O’Shea, R.; Smyth, B.; Murphy, J.D. Decarbonising ships, planes and trucks: An analysis of suitable low-carbon fuels for the maritime, aviation and haulage sectors. Adv. Appl. Energy 2021, 1, 100008. [Google Scholar] [CrossRef]
- Kinnon, M.M.; Razeghi, G.; Samuelsen, S. The role of fuel cells in port microgrids to support sustainable goods movement. Renew. Sustain. Energy Rev. 2021, 147, 111226. [Google Scholar] [CrossRef]
- Chen, P.S.L.; Fan, H.; Enshaei, H.; Zhang, W.; Shi, W.; Abdussamie, N.; Miwa, T.; Qu, Z.; Yang, Z. A review on ports’ readiness to facilitate international hydrogen trade. Int. J. Hydrog. Energy 2023, 48, 17351–17369. [Google Scholar] [CrossRef]
- Wang, B.; Liu, Q.; Wang, L.; Chen, Y.; Wang, J. A review of the port carbon emission sources and related emission reduction technical measures. Environ. Pollut. 2023, 320, 121000. [Google Scholar] [CrossRef]
- Port of Long Beach. Port of Long Beach 2021 Air Emissions Inventory. 2021. Available online: https://polb.com/environment/air/#emissions-inventory (accessed on 13 March 2024).
- Iris, C.; Lam, J.S.L. A review of energy efficiency in ports: Operational strategies, technologies and energy management systems. Renew. Sustain. Energy Rev. 2019, 112, 170–182. [Google Scholar] [CrossRef]
- International Maritime Organization. Fourth IMO Greenhouse Gas Study 2020 Full Report. 2020. Available online: https://www.imo.org/en/ourwork/Environment/Pages/Fourth-IMO-Greenhouse-Gas-Study-2020.aspx (accessed on 13 March 2024).
- International Maritime Organization. 2023 IMO Strategy on reduction of GHG Emissions from Ships: Resolution MEPC.377(80). 2023. Available online: https://www.imo.org/en/OurWork/Environment/Pages/2023-IMO-Strategy-on-Reduction-of-GHG-Emissions-from-Ships.aspx/ (accessed on 13 March 2024).
- Azarkamand, S.; Ferré, G.; Darbra, R.M. Calculating the Carbon Footprint in ports by using a standardized tool. Sci. Total Environ. 2020, 734, 139407. [Google Scholar] [CrossRef]
- WPCI. World Ports Sustainability Program: Carbon Footprinting Guidance Document. 2010. Available online: https://sustainableworldports.org/wp-content/uploads/Carbon_Footprinting_Guidance_Document.pdf (accessed on 13 March 2024).
- Cammin, P.; Brüssau, K.; Voß, S. Classifying maritime port emissions reporting. Marit. Transp. Res. 2022, 3, 100066. [Google Scholar] [CrossRef]
- Det Norske Veritas. Port: Green Gateways to Europe. 10 Transitions to Turn Ports into Decarbonization Hubs. 2020. Available online: https://www.dnv.com/publications/ports-green-gateways-to-europe-179372 (accessed on 13 March 2024).
- Arup, Sydney, Australia. Australian Hydrogen Hubs Study Technical Study-Issue 2, COAG Energy Council Hydrogen Working Group; Arup: Sydney, Australia, 2019. Available online: https://www.dcceew.gov.au/sites/default/files/documents/nhs-australian-hydrogen-hubs-study-report-2019.pdf (accessed on 13 March 2024).
- Argonne National Laboratory. Cargo Handling Equipment at Ports. 2022. Available online: https://www.anl.gov/sites/www/files/2022-03/Cargo%20Handling%20Equipment%20At%20Ports%20FINAL%203-23-22b%5B75%5D.pdf (accessed on 14 February 2024).
- Spectra Fuels. Types of Fuels Used in Ships (Bunker, Bunkering). 2023. Available online: https://livebunkers.com/types-fuels-used-ships-bunker-bunkering#:~:text=Ships%20generally%20use%203%20types,ship%20is%20at%20that%20place (accessed on 13 March 2024).
- Densberger, N.L.; Bachkar, K. Towards accelerating the adoption of zero emissions cargo handling technologies in California ports: Lessons learned from the case of the Ports of Los Angeles and Long Beach. J. Clean. Prod. 2022, 347, 131255. [Google Scholar] [CrossRef]
- MPA Tuas Port. Tuas Port—A Smarter and Greener Port. 2023. Available online: https://www.mpa.gov.sg/maritime-singapore/port-of-the-future (accessed on 13 March 2024).
- Alamoush, A.S.; Ballini, F.; Ölçer, A.I. Ports’ technical and operational measures to reduce greenhouse gas emission and improve energy efficiency: A review. Mar. Pollut. Bull. 2020, 160, 111508. [Google Scholar] [CrossRef] [PubMed]
- Sdoukopoulos, E.; Boile, M.; Tromaras, A.; Anastasiadis, N. Energy efficiency in European ports: State-of-practice and insights on the way forward. Sustainability 2019, 11, 4952. [Google Scholar] [CrossRef]
- Sifakis, N.; Tsoutsos, T. Planning zero-emissions ports through the nearly zero energy port concept. J. Clean. Prod. 2021, 286, 125448. [Google Scholar] [CrossRef]
- Alamoush, A.S.; Ölçer, A.I.; Ballini, F. Ports’ role in shipping decarbonisation: A common port incentive scheme for shipping greenhouse gas emissions reduction. Clean. Logist. Supply Chain. 2022, 3, 100021. [Google Scholar] [CrossRef]
- Bjerkan, K.Y.; Seter, H. Reviewing tools and technologies for sustainable ports: Does research enable decision making in ports? Transp. Res. Part D Transp. Environ. 2019, 72, 243–260. [Google Scholar] [CrossRef]
- Port Technology International. Port Technology International. 2023. Available online: https://www.porttechnology.org/?s=hydrogen/ (accessed on 13 March 2024).
- Kitchenham, B.; Charters, S. Guidelines for Performing Systematic Literature Reviews in Software Engineering. 2007. Available online: https://www.researchgate.net/publication/302924724_Guidelines_for_performing_Systematic_Literature_Reviews_in_Software_Engineering/, (accessed on 13 March 2024).
- Purdue University. Systematic Reviews. 2021. Available online: https://guides.lib.purdue.edu/c.php?g=894874&p=6449662 (accessed on 13 March 2024).
- Reed, J.; Phillips, M.; Van Epps, A.S.; Zwicky, D. An Early Look at a Scoping Review of Systematic Review Methodologies in Engineering. In Proceedings of the 2020 IEEE Frontiers in Education Conference (FIE) 2020, Uppsala, Sweden, 21–24 October 2020; pp. 1–4. [Google Scholar] [CrossRef]
- Yavari, A. Internet of Things Data Contextualisation for Scalable Information Processing, Security, and Privacy. 2019. Available online: https://researchrepository.rmit.edu.au/esploro/outputs/9921864057601341 (accessed on 13 March 2024).
- Davarzani, H.; Fahimnia, B.; Bell, M.; Sarkis, J. Greening ports and maritime logistics: A review. TRansportation Res. Part D Transp. Environ. 2016, 48, 473–487. [Google Scholar] [CrossRef]
- Philipp, R.; Prause, G.; Olaniyi, E.O.; Lemke, F. Towards Green and Smart Seaports: Renewable Energy and Automation Technologies for Bulk Cargo Loading Operations. Environ. Clim. Technol. 2021, 25, 650–665. [Google Scholar] [CrossRef]
- Li, L.; Zhu, J.; Ye, G.; Feng, X. Development of green ports with the consideration of coastal wave energy. Sustainability 2018, 10, 4270. [Google Scholar] [CrossRef]
- Gerlitz, L.; Meyer, C. Small and medium-sized ports in the ten-t network and nexus of europe’s twin transition: The way towards sustainable and digital port service ecosystems. Sustainability 2021, 13, 4386. [Google Scholar] [CrossRef]
- Bergqvist, R.; Monios, J. Green Ports in Theory and Practice. In Green Ports: Inland and Seaside Sustainable Transportation Strategies; Elsevier: Amsterdam, The Netherlands, 2019; pp. 1–17. [Google Scholar] [CrossRef]
- Iris, C.; Lam, J.S.L. Optimal energy management and operations planning in seaports with smart grid while harnessing renewable energy under uncertainty. Omega 2021, 103, 102445. [Google Scholar] [CrossRef]
- Kizielewicz, J.; Skrzeszewska, K. Identifying actions to prepare electricity infrastructure in seaports for future power supplying cruise ships with energy from land. Energies 2021, 14, 8173. [Google Scholar] [CrossRef]
- Alexandropoulou, V.; Koundouri, P.; Papadaki, L.; Kontaxaki, K. New Challenges and Opportunities for Sustainable Ports: The Deep Demonstration in Maritime Hubs Project. In The Ocean of Tomorrow: The Transition to Sustainability–Volume 2; Springer: Cham, Switzerland, 2021; pp. 173–197. [Google Scholar]
- Satta, G.; Parola, F.; Vitellaro, F.; Morchio, G. LNG Bunkering Technologies in Ports: An Empirical Application of the SWOT Analysis. Kmi Int. J. Marit. Aff. Fish. 2021, 13, 1–21. [Google Scholar] [CrossRef]
- Krämer, I.; Czermański, E. Onshore power one option to reduce air emissions in ports. Sustain. Manag. Forum| NachhaltigkeitsManagementForum 2020, 28, 13–20. [Google Scholar] [CrossRef]
- Twrdy, E.; Zanne, M. Improvement of the sustainability of ports logistics by the development of innovative green infrastructure solutions. Transp. Res. Procedia 2020, 45, 539–546. [Google Scholar] [CrossRef]
- Styhre, L.; Winnes, H.; Black, J.; Lee, J.; Le-Griffin, H. Greenhouse gas emissions from ships in ports—Case studies in four continents. Transp. Res. Part D Transp. Environ. 2017, 54, 212–224. [Google Scholar] [CrossRef]
- Lim, S.; Pettit, S.; Abouarghoub, W.; Beresford, A. Port sustainability and performance: A systematic literature review. Transp. Res. Part D Transp. Environ. 2019, 72, 47–64. [Google Scholar] [CrossRef]
- Aregall, M.G.; Bergqvist, R.; Monios, J. A global review of the hinterland dimension of green port strategies. Transp. Res. Part D Transp. Environ. 2018, 59, 23–34. [Google Scholar] [CrossRef]
- Colarossi, D.; Lelow, G.; Principi, P. Local energy production scenarios for emissions reduction of pollutants in small-medium ports. Transp. Res. Interdiscip. Perspect. 2022, 13, 100554. [Google Scholar] [CrossRef]
- Nikishin, A.J.; Kharitonov, M.S. Modernization of marine ports electrical power supply systems in the framework of zero-emission strategy. In IOP Conference Series: Earth and Environmental Science; IOP Publishing Ltd.: Bristol, UK, 2021; Volume 689. [Google Scholar] [CrossRef]
- Vichos, E.; Sifakis, N.; Tsoutsos, T. Challenges of integrating hydrogen energy storage systems into nearly zero-energy ports. Energy 2022, 241, 122878. [Google Scholar] [CrossRef]
- Seddiek, I.S. Application of renewable energy technologies for eco-friendly sea ports. Ships Offshore Struct. 2020, 15, 953–962. [Google Scholar] [CrossRef]
- Sadek, I.; Elgohary, M. Assessment of renewable energy supply for green ports with a case study. Environ. Sci. Pollut. Res. 2020, 27, 5547–5558. [Google Scholar] [CrossRef]
- Zhen, L.; Zhuge, D.; Murong, L.; Yan, R.; Wang, S. Operation management of green ports and shipping networks: Overview and research opportunities. Front. Eng. Manag. 2019, 6, 152–162. [Google Scholar] [CrossRef]
- Poulsen, R.T.; Ponte, S.; Sornn-Friese, H. Environmental upgrading in global value chains: The potential and limitations of ports in the greening of maritime transport. Geoforum 2018, 89, 83–95. [Google Scholar] [CrossRef]
- Blanco, H.; Leaver, J.; Dodds, P.E.; Dickinson, R.; García-Gusano, D.; Iribarren, D.; Lind, A.; Wang, C.; Danebergs, J.; Baumann, M. A taxonomy of models for investigating hydrogen energy systems. Renew. Sustain. Energy Rev. 2022, 167, 112698. [Google Scholar] [CrossRef]
- Sadiq, M.; Ali, S.W.; Terriche, Y.; Mutarraf, M.U.; Hassan, M.A.; Hamid, K.; Ali, Z.; Sze, J.Y.; Su, C.L.; Guerrero, J.M. Future Greener Seaports: A Review of New Infrastructure, Challenges, and Energy Efficiency Measures. IEEE Access 2021, 9, 75568–75587. [Google Scholar] [CrossRef]
- Alzahrani, A.; Petri, I.; Rezgui, Y.; Ghoroghi, A. Decarbonisation of seaports: A review and directions for future research. Energy Strategy Rev. 2021, 38, 100727. [Google Scholar] [CrossRef]
- Barberi, S.; Sambito, M.; Neduzha, L.; Severino, A. Pollutant emissions in ports: A comprehensive review. Infrastructures 2021, 6, 114. [Google Scholar] [CrossRef]
- Tranfield, D.; Denyer, D.; Smart, P. Towards a Methodology for Developing Evidence-Informed Management Knowledge by Means of Systematic Review. Br. J. Manag. 2003, 14, 207–222. [Google Scholar] [CrossRef]
- Saunders, M.N.K.; Lewis, P.; Thornhill, A. Research Methods for Business Students; Oxford University Press: Oxford, UK, 2019; ISBN 9781292208787. [Google Scholar]
- Rowley, J.; Slack, F. Conducting a literature review. Manag. Res. News 2004, 27, 31–39. [Google Scholar] [CrossRef]
- Seuring, S.; Gold, S. Conducting content-analysis based literature reviews in supply chain management. Supply Chain. Manag. 2012, 17, 544–555. [Google Scholar] [CrossRef]
- Hsieh, H.F.; Shannon, S.E. Three approaches to qualitative content analysis. Qual. Health Res. 2005, 15, 1277–1288. [Google Scholar] [CrossRef]
- Charmaz, K. Constructing Grounded Theory. A Practical Guide through Qualitative Analysis; Sage Publications: Southend Oaks, CA, USA, 2006. [Google Scholar]
- Petticrew, M.; Roberts, H. Systematic Reviews in the Social Sciences: A Practical Guide; John Wiley & Sons: Hoboken, NJ, USA, 2008. [Google Scholar] [CrossRef]
- Wohlin, C.; Mendes, E.; Felizardo, K.R.; Kalinowski, M. Guidelines for the search strategy to update systematic literature reviews in software engineering. Inf. Softw. Technol. 2020, 127, 106366. [Google Scholar] [CrossRef]
- Snyder, H. Literature review as a research methodology: An overview and guidelines. J. Bus. Res. 2019, 104, 333–339. [Google Scholar] [CrossRef]
- Mayring, P. Qualitative Inhaltanalyse—Grundlagen und Techniken (Qualitative Content Analysis); Deutscher Studienverlag: Beltz, Ukraine, 2008. [Google Scholar]
- Mayring, P.; Qualitative Content Analysis. Sourced from Hyperlink Reference in the Review Paper. 2000. Available online: https://www.qualitative-research.net/index.php/fqs/article/view/1089 (accessed on 13 March 2024).
- Jaakkola, E. Designing conceptual articles: Four approaches. AMS Rev. 2020, 10, 18–26. [Google Scholar] [CrossRef]
- Yadav, M.S. The Decline of Conceptual Articles and Implications for Knowledge Development. J. Mark. 2010, 74, 1–19. [Google Scholar] [CrossRef]
- Seuring, S.; Müller, M. From a literature review to a conceptual framework for sustainable supply chain management. J. Clean. Prod. 2008, 16, 1699–1710. [Google Scholar] [CrossRef]
- Florida Atlantic University Libraries. Guide to Science Information Resources. 2024. Available online: https://libguides.fau.edu/science-resources/publications, (accessed on 13 March 2024).
- Wikipedia. Tertiary Review. 2024. Available online: https://en.wikipedia.org/wiki/Tertiary_review (accessed on 13 March 2024).
- Kotti, Z.; Galanopoulou, R.; Spinellis, D. Machine Learning for Software Engineering: A Tertiary Study. ACM Comput. Surv. 2023, 55, 1–39. [Google Scholar] [CrossRef]
- Bano, M.; Zowghi, D.; Ikram, N. Systematic reviews in requirements engineering: A tertiary study. In Proceedings of the 2014 IEEE 4th International Workshop on Empirical Requirements Engineering (EmpiRE), Karlskrona, Sweden, 25 August 2014; pp. 9–16. [Google Scholar] [CrossRef]
- International Standard Office. ISO 50001: 2018, Energy Management Systems—Requirements with Guidance for Use. 2018. Available online: https://www.iso.org/standard/69426.html (accessed on 13 March 2024).
- Boile, M.; Theofanis, S.; Sdoukopoulos, E.; Plytas, N. Developing a port energy management plan: Issues, challenges, and prospects. Transp. Res. Rec. 2016, 2549, 19–28. [Google Scholar] [CrossRef]
- World Ports Sustainability Program. Ports Need to Proactively Prioritize Spatial Safety for Future Fuels: Port of Amsterdam Report Published. 2021. Available online: https://sustainableworldports.org/ports-need-to-proactively-prioritize-spatial-safety-for-future-fuels-port-of-amsterdam-report-published (accessed on 13 March 2024).
- Snyder, J. Port of Singapore Gears up for Multi-Fuel Future of 2030. 2023. Available online: https://www.rivieramm.com/news-content-hub/news-content-hub/port-of-singapore-gears-up-for-multi-fuel-future-of-2030-75399#:~:text=As%20shipping’s%20largest%20refuelling%20hub,zero%2Dcarbon%20fuels%20by%202030 (accessed on 13 March 2024).
- Port of Hamburg. Full Speed Ahead for Green Hydrogen. 2024. Available online: https://www.hafen-hamburg.de/en/port-of-hamburg-magazine/gateway-hamburg/leinen-los-fuer-gruenen-wasserstoff (accessed on 12 March 2024).
- Sadeghi, H.; Rashidinejad, M.; Moeini-Aghtaie, M.; Abdollahi, A. The Energy Hub: An Extensive Survey on the State-of-the-Art. Appl. Therm. Eng. 2019, 161, 114071. [Google Scholar] [CrossRef]
- Mohammadi, M.; Noorollahi, Y.; Mohammadi-ivatloo, B.; Yousefi, H. Energy hub: From a model to a concept—A review. Renew. Sustain. Energy Rev. 2017, 80, 1512–1527. [Google Scholar] [CrossRef]
- Li, L.; Manier, H.; Manier, M.A. Hydrogen supply chain network design: An optimization-oriented review. Renew. Sustain. Energy Rev. 2019, 103, 342–360. [Google Scholar] [CrossRef]
- Valenciaport. The Port of Valencia Now Has Its Hydrogen Plant. 2022. Available online: https://www.valenciaport.com/en/the-port-of-valencia-now-has-its-hydrogen-plant (accessed on 12 March 2024).
- Hassan, I.A.; Ramadan, H.S.; Saleh, M.A.; Hissel, D. Hydrogen storage technologies for stationary and mobile applications: Review, analysis and perspectives. Renew. Sustain. Energy Rev. 2021, 149, 111311. [Google Scholar] [CrossRef]
- Port of Rotterdam. Hydrogen in Rotterdam. 2024. Available online: https://www.portofrotterdam.com/en/port-future/energy-transition/ongoing-projects/hydrogen-rotterdam (accessed on 12 March 2024).
- Liu, X.; Seberry, G.; Kook, S.; Chan, Q.N.; Hawkes, E.R. Direct injection of hydrogen main fuel and diesel pilot fuel in a retrofitted single-cylinder compression ignition engine. Int. J. Hydrogen Energy 2022, 47, 35864–35876. [Google Scholar] [CrossRef]
- Yip, H.L.; Srna, A.; Yuen, A.C.Y.; Kook, S.; Taylor, R.A.; Yeoh, G.H.; Medwell, P.R.; Chan, Q.N. A review of hydrogen direct injection for internal combustion engines: Towards carbon-free combustion. Appl. Sci. 2019, 9, 4842. [Google Scholar] [CrossRef]
- Boretti, A. Advantages and Disadvantages of Diesel Single and Dual-Fuel Engines. Front. Mech. Eng. 2019, 5, 64. [Google Scholar] [CrossRef]
- Valenciaport. Hydrogen Is Already Moving Containers in the Port of València. 2023. Available online: https://www.valenciaport.com/en/hydrogen-is-already-moving-containers-in-the-port-of-valencia (accessed on 12 March 2024).
- DPWorld. DP World Pioneers Hydrogen-Powered Port Operations in Push for Sustainability. 2023. Available online: https://www.csrwire.com/press_releases/785691-dp-world-pioneers-hydrogen-powered-port-operations-push-sustainability (accessed on 12 March 2024).
- BeHydro. LR awards Type Approval to BeHydro for its Hydrogen Dual-Fuel Engine. 2023. Available online: https://www.behydro.com/news-events/lr-type-approval-df-engines (accessed on 12 March 2024).
- World Ports Sustainability Program. Port of Amsterdam-Neo Orbis Hydrogen Vessel. 2024. Available online: https://sustainableworldports.org/project/port-of-amsterdam-neo-orbis-hydrogen-vessel/ (accessed on 12 March 2024).
- Port of Antwerp Bruges. Hydrotug 1: The Very First Hydrogen-Powered Tug. 2024. Available online: https://www.portofantwerpbruges.com/en/hydrotug-1-very-first-hydrogen-powered-tug (accessed on 12 March 2024).
- Maersk Mc-Kinney Moller Centre. Green Corridors: Feasibility Phase Blueprint Introduction to the Green Corridor Feasibility Phase Blueprint. 2022. Available online: https://www.zerocarbonshipping.com/publications/green-corridors-feasibility-phase-blueprint/ (accessed on 13 March 2024).
- The Port of Long Beach & Port of Los Angeles Clean Air Action Plan. Ports Of Los Angeles, Long Beach, and Shanghai Unveil Implementation Plan Outline for First Trans-Pacific Green Shipping Corridor. 2023. Available online: https://cleanairactionplan.org/2023/09/22/san-pedro-bay-ports-give-quarterly-clean-air-action-plan-update-2-2/ (accessed on 14 March 2024).
- Forth Ports Group. Innovative Green Hydrogen Shore Power Trial Launched at the Port of Leith. 2024. Available online: https://www.forthports.co.uk/media-releases/innovative-green-hydrogen-shore-power-trial-launched-at-the-port-of-leith (accessed on 12 March 2024).
- Gothenburg Port Authority. Tranzero Initiative-Fossil-Free Freight by Sea, Port and Land. 2024. Available online: https://www.portofgothenburg.com/about/projects-at-the-port/tranzero-initiativ/#:~:text=Named%20the%20%E2%80%9CTranzero%20Initiative%E2%80%9D%2C,includes%20electrification%20of%20sea%20transport (accessed on 14 March 2024).
- Nilsson Energy. Project Hydrogen Filling Station in Gothenburg. 2024. Available online: https://nilssonenergy.com/news-media/project-hydrogen-filling-station-in-gothenburg (accessed on 14 March 2024).
- Duisport. Energy Transition—Europe’s First Climate-Neutral Container Terminal Based on Hydrogen Technology Is Being Built in the Port of Duisburg. 2024. Available online: https://www.duisport.de/energy-transition-europes-first-climate-neutral-container-terminal-based-on-hydrogen-technology-is-being-built-in-the-port-of-duisburg/?lang=en (accessed on 12 March 2024).
- FuelCellEnergy. FuelCell Energy and Toyota Announce Completion of World’s First “Tri-gen” Production System. 2023. Available online: https://investor.fce.com/press-releases/press-release-details/2023/FuelCell-Energy-and-Toyota-Announce-Completion-of-Worlds-First-Tri-gen-Production-System/default.aspx?__hstc=24013477.92184fa54e50ea29f3aac1a7fbfb9c9e.1710216223617.1710216223617.1710216223617.1&__hssc=24013477.1.1710216223617&__hsfp=1093194124/ (accessed on 12 March 2024).
- Son, Y.G.; Oh, B.C.; Acquah, M.A.; Fan, R.; Kim, D.M.; Kim, S.Y. Multi Energy System with an Associated Energy Hub: A Review. IEEE Access 2021, 9, 127753–127766. [Google Scholar] [CrossRef]
- Thiem, S.; Danov, V.; Metzger, M.; Schäfer, J.; Hamacher, T. Project-level multi-modal energy system design—Novel approach for considering detailed component models and example case study for airports. Energy 2017, 133, 691–709. [Google Scholar] [CrossRef]
- Luise, R.; Brisse, A.; Azzaro-Pantel, C. Review: Analysis of superstructures for hydrogen supply chain modeling. In Hydrogen Economy; Elsevier: Amsterdam, The Netherlands, 2023; pp. 165–181. [Google Scholar] [CrossRef]
Disclaimer/Publisher’s Note: The statements, opinions and data contained in all publications are solely those of the individual author(s) and contributor(s) and not of MDPI and/or the editor(s). MDPI and/or the editor(s) disclaim responsibility for any injury to people or property resulting from any ideas, methods, instructions or products referred to in the content. |
© 2024 by the authors. Licensee MDPI, Basel, Switzerland. This article is an open access article distributed under the terms and conditions of the Creative Commons Attribution (CC BY) license (https://creativecommons.org/licenses/by/4.0/).