2.1. The Impact of Uncertain Factors on Vietnam’s Dragon Fruit Industry
Price factor: Due to China’s status as the primary market for Vietnamese agricultural products, the onset of the COVID-19 epidemic in China in January posed significant challenges for the procurement and exportation of agricultural goods, including dragon fruits, to the border. Shipments destined for the border are currently experiencing congestion due to insufficient customs processing procedures, compounded by the suspension of sea exports. Prior to the commencement of the Lunar New Year, the prevailing market rate for white dragon fruit exceeded USD 1 per kilogram. However, subsequent to the Lunar New Year, the price experienced a significant decrease, plummeting to a mere USD 0.1 per kilogram. Consequently, no traders have shown interest in procuring the aforementioned commodity [
14].
Furthermore, the domestic selling price of dragon fruit has a paradoxical nature. An illustrative instance can be observed in the case of dragon fruit with yellow skin, which represents one of the three primary varieties of dragon fruit available in the Vietnamese market. In 2004, the Southern Horticultural Research Institute (SOFRI), Vietnam conducted an experiment including the importation and cultivation of Hylocereus costaricensis, a kind of dragon fruit characterized by its yellow peel and white flesh. However, the outcomes did not align with the anticipated expectations. The growth of the plants was suboptimal, characterized by thin and slender branches, as well as the production of little fruits weighing less than 200 g of each. Furthermore, the yield was found to be low, with an average of 2–3 kg per pole every season for 3-year-old plants. In order to satisfy the significant domestic demand and cater to the curiosity of consumers, the fruit is imported from Malaysia and retailed at a price that is up to 20 times greater than that of the red skin and white meat variants [
15].
Given the perceived market potential of this novel fruit, numerous horticulturists engage in self-propagation and undertake planting endeavors, commencing in 2018 [
16]. Nevertheless, because of the lack of prior knowledge in tree care, the trees exhibit a phenomenon wherein they produce flowers but fail to yield any fruit. Alternatively, there exist fruits that possess unattractive physical characteristics, rendering them unsuitable for commercial transactions. According to a dragon fruit garden owner, there was a significant demand for this fruit in the past due to its high price. As a result, farmers expressed interest in cultivating it. However, the unsuitability of the climate, soil, and cultivation practices for this variety, as opposed to the red skin dragon fruit, hindered their ability to achieve the intended outcomes. Growers face the challenge of declining pricing when they possess knowledge of the methods for cultivating yellow-skin dragon fruits, with prices often ranging from equal to or twice that of red meat dragon fruits, provided the fruit exhibits substantial size and an aesthetically pleasing appearance.
Furthermore, the exportation of the Vietnamese yellow-skin dragon fruit remains unfeasible. The underlying cause is that major consumer markets for dragon fruit from Vietnam, such as China, the European Union, and North America, exhibit a lack of preference for this product. China, being the primary consumer of dragon fruit from Vietnam, exhibits a notable preference for red dragon fruits, whether in terms of their skin or flesh.
Impact of climate change: Climate change can potentially affect multiple facets of crop water demand, crop growth and production, irrigation water supply, as well as the occurrence of floods, droughts, and heat waves.
The Global Climate Risk Index 2020 indicates Vietnam to be the sixth nation globally in terms of its exposure to climate change and extreme weather events throughout the period spanning from 1999 to 2018. It can be foreseen that climate change will lead to a more frequent occurrence of natural disasters and extreme heat waves in the majority of Vietnam [
17].
According to a report by the Asian Development Bank [
18], the risks associated with climate change have been found to impact various socioeconomic aspects in Vietnam including water management, pricing, allocation, access to finance, labor cost, and market price.
Binh Thuan Province is situated in the southeastern region of Vietnam, characterized by an extensive coastline and a monsoon-influenced tropical climate, resulting in well-defined wet and dry seasons. The wet season is typically observed between the months of May and October, whilst the dry season spans from November to April. The region has experienced a range of impacts as a result of climate change, including elevated sea levels, heightened temperatures, and alterations in precipitation patterns.
Binh Thuan, being situated in a coastal area, is susceptible to the consequences of escalating sea levels, encompassing coastal erosion, inundation, and the infiltration of saline water into freshwater reservoirs. The available data indicate that there has been a consistent annual increase in the sea level of approximately 3 mm during the period from 1993 to 2008. Projections suggest that, by the year 2050, the sea level is expected to climb within the range of 28 cm to 33 cm [
19].
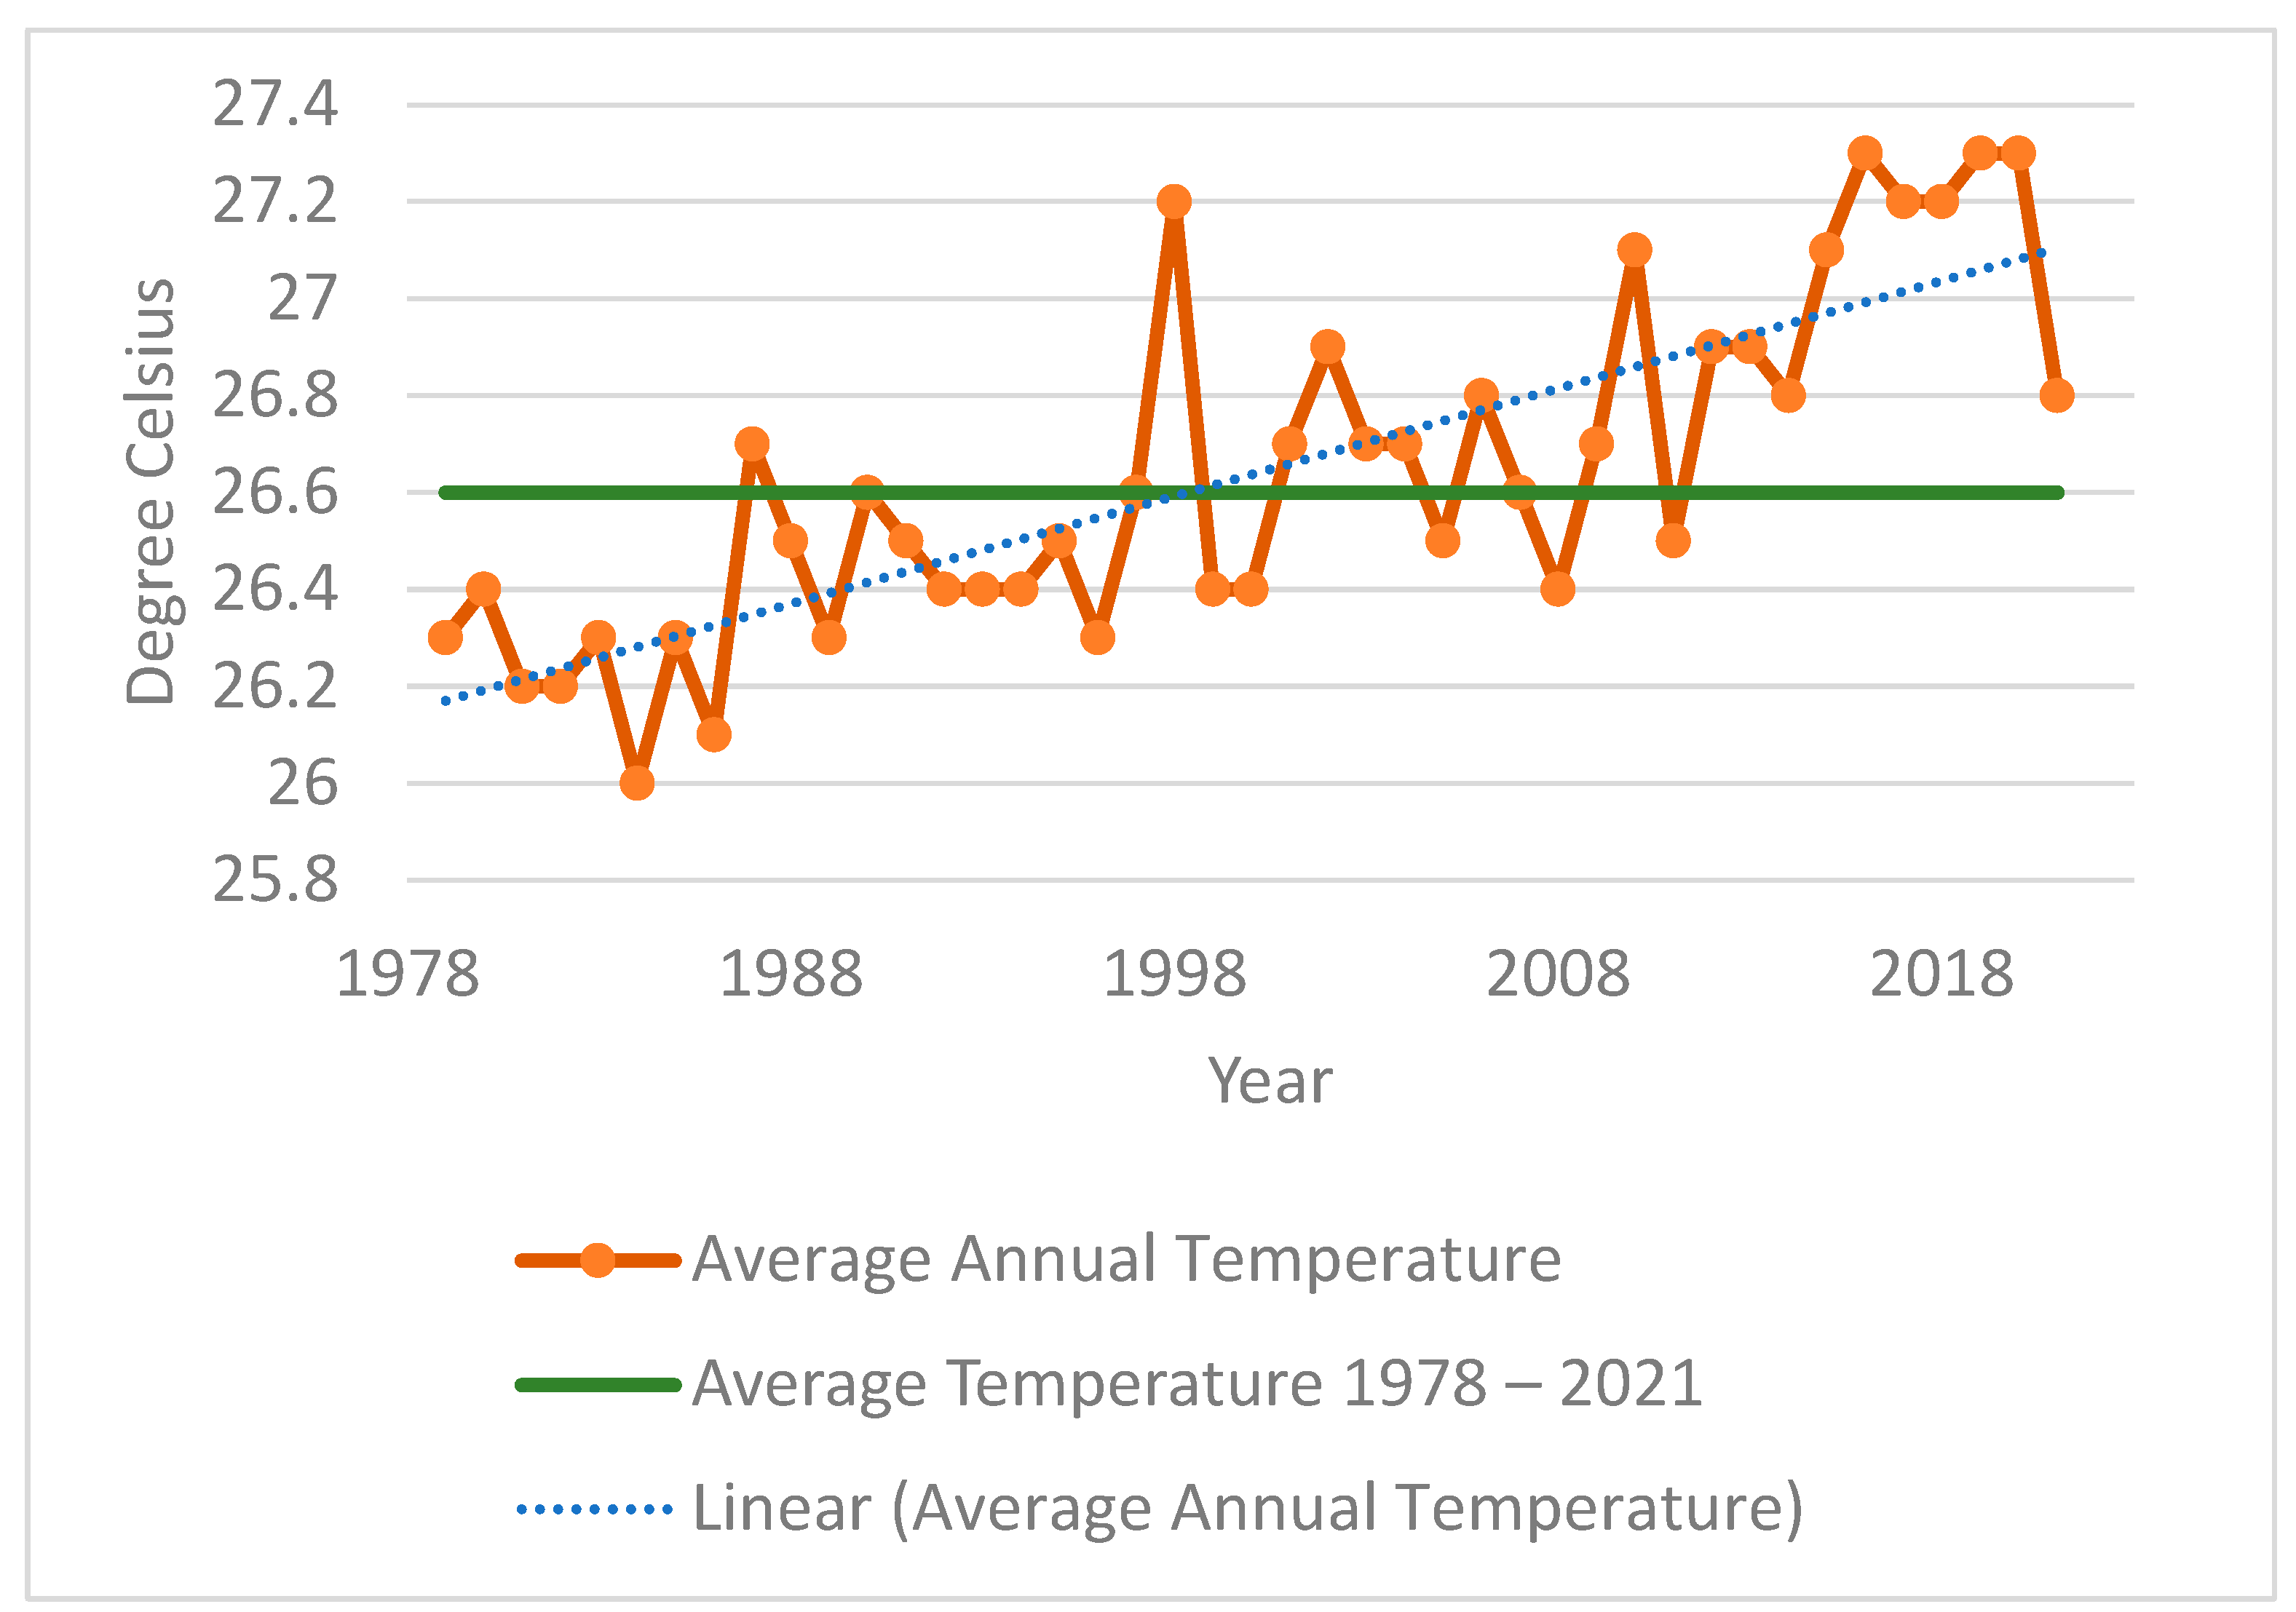
The region, like other parts of the globe, has encountered a rise in average temperatures under the climate change effect. The potential consequences of this phenomenon extend to various aspects, including ecology, agriculture, and human health. The mean temperature had a gradual increase ranging from 0.5 to 0.7 degrees Celsius during the period from 1958 to 2007. It is projected that the average temperature in 2050 will experience a further increase of 0.4 degrees Celsius compared to the average temperature observed in 2020 [
19].
The occurrence of soil erosion, desertification, and drought in Binh Thuan can be attributed to a confluence of factors, including rising temperatures, an upsurge in the frequency of sunny days, and intensified hot winds originating from the mainland during the dry season [
20].
The average annual temperature data for Phan Thiet, Binh Thuan, as recorded and compiled by Meteoblue [
21] from 1979 to 2021 (
Figure 1), indicates a discernible trend towards increasing temperatures, with consistently higher values observed since 2010. In addition, the years 1998, 2016, 2019, and 2020 exhibited the highest average temperatures, accompanied by the occurrence of severe and protracted drought conditions [
20,
22].
The phenomenon of climate change has caused modifications in precipitation patterns, hence giving rise to heightened occurrences of severe weather events including intense rainfall, storms, and periods of drought. Based on the analysis conducted by Doutreloup et al. [
23], it is anticipated that the duration of the dry season will be extended due to the projected shift at the beginning and conclusion of the wet season within the time frame of 2046–2065. While there may be alterations in the seasonal patterns of rainfall, it is expected that the overall annual precipitation will remain constant. Similar findings can be drawn for the period spanning from 2081 to 2100. Consequently, the climatic conditions in Binh Thuan Province would undergo alterations characterized by an extended period of aridity, intensified summer precipitation, and heightened occurrences of heavy rainfall.
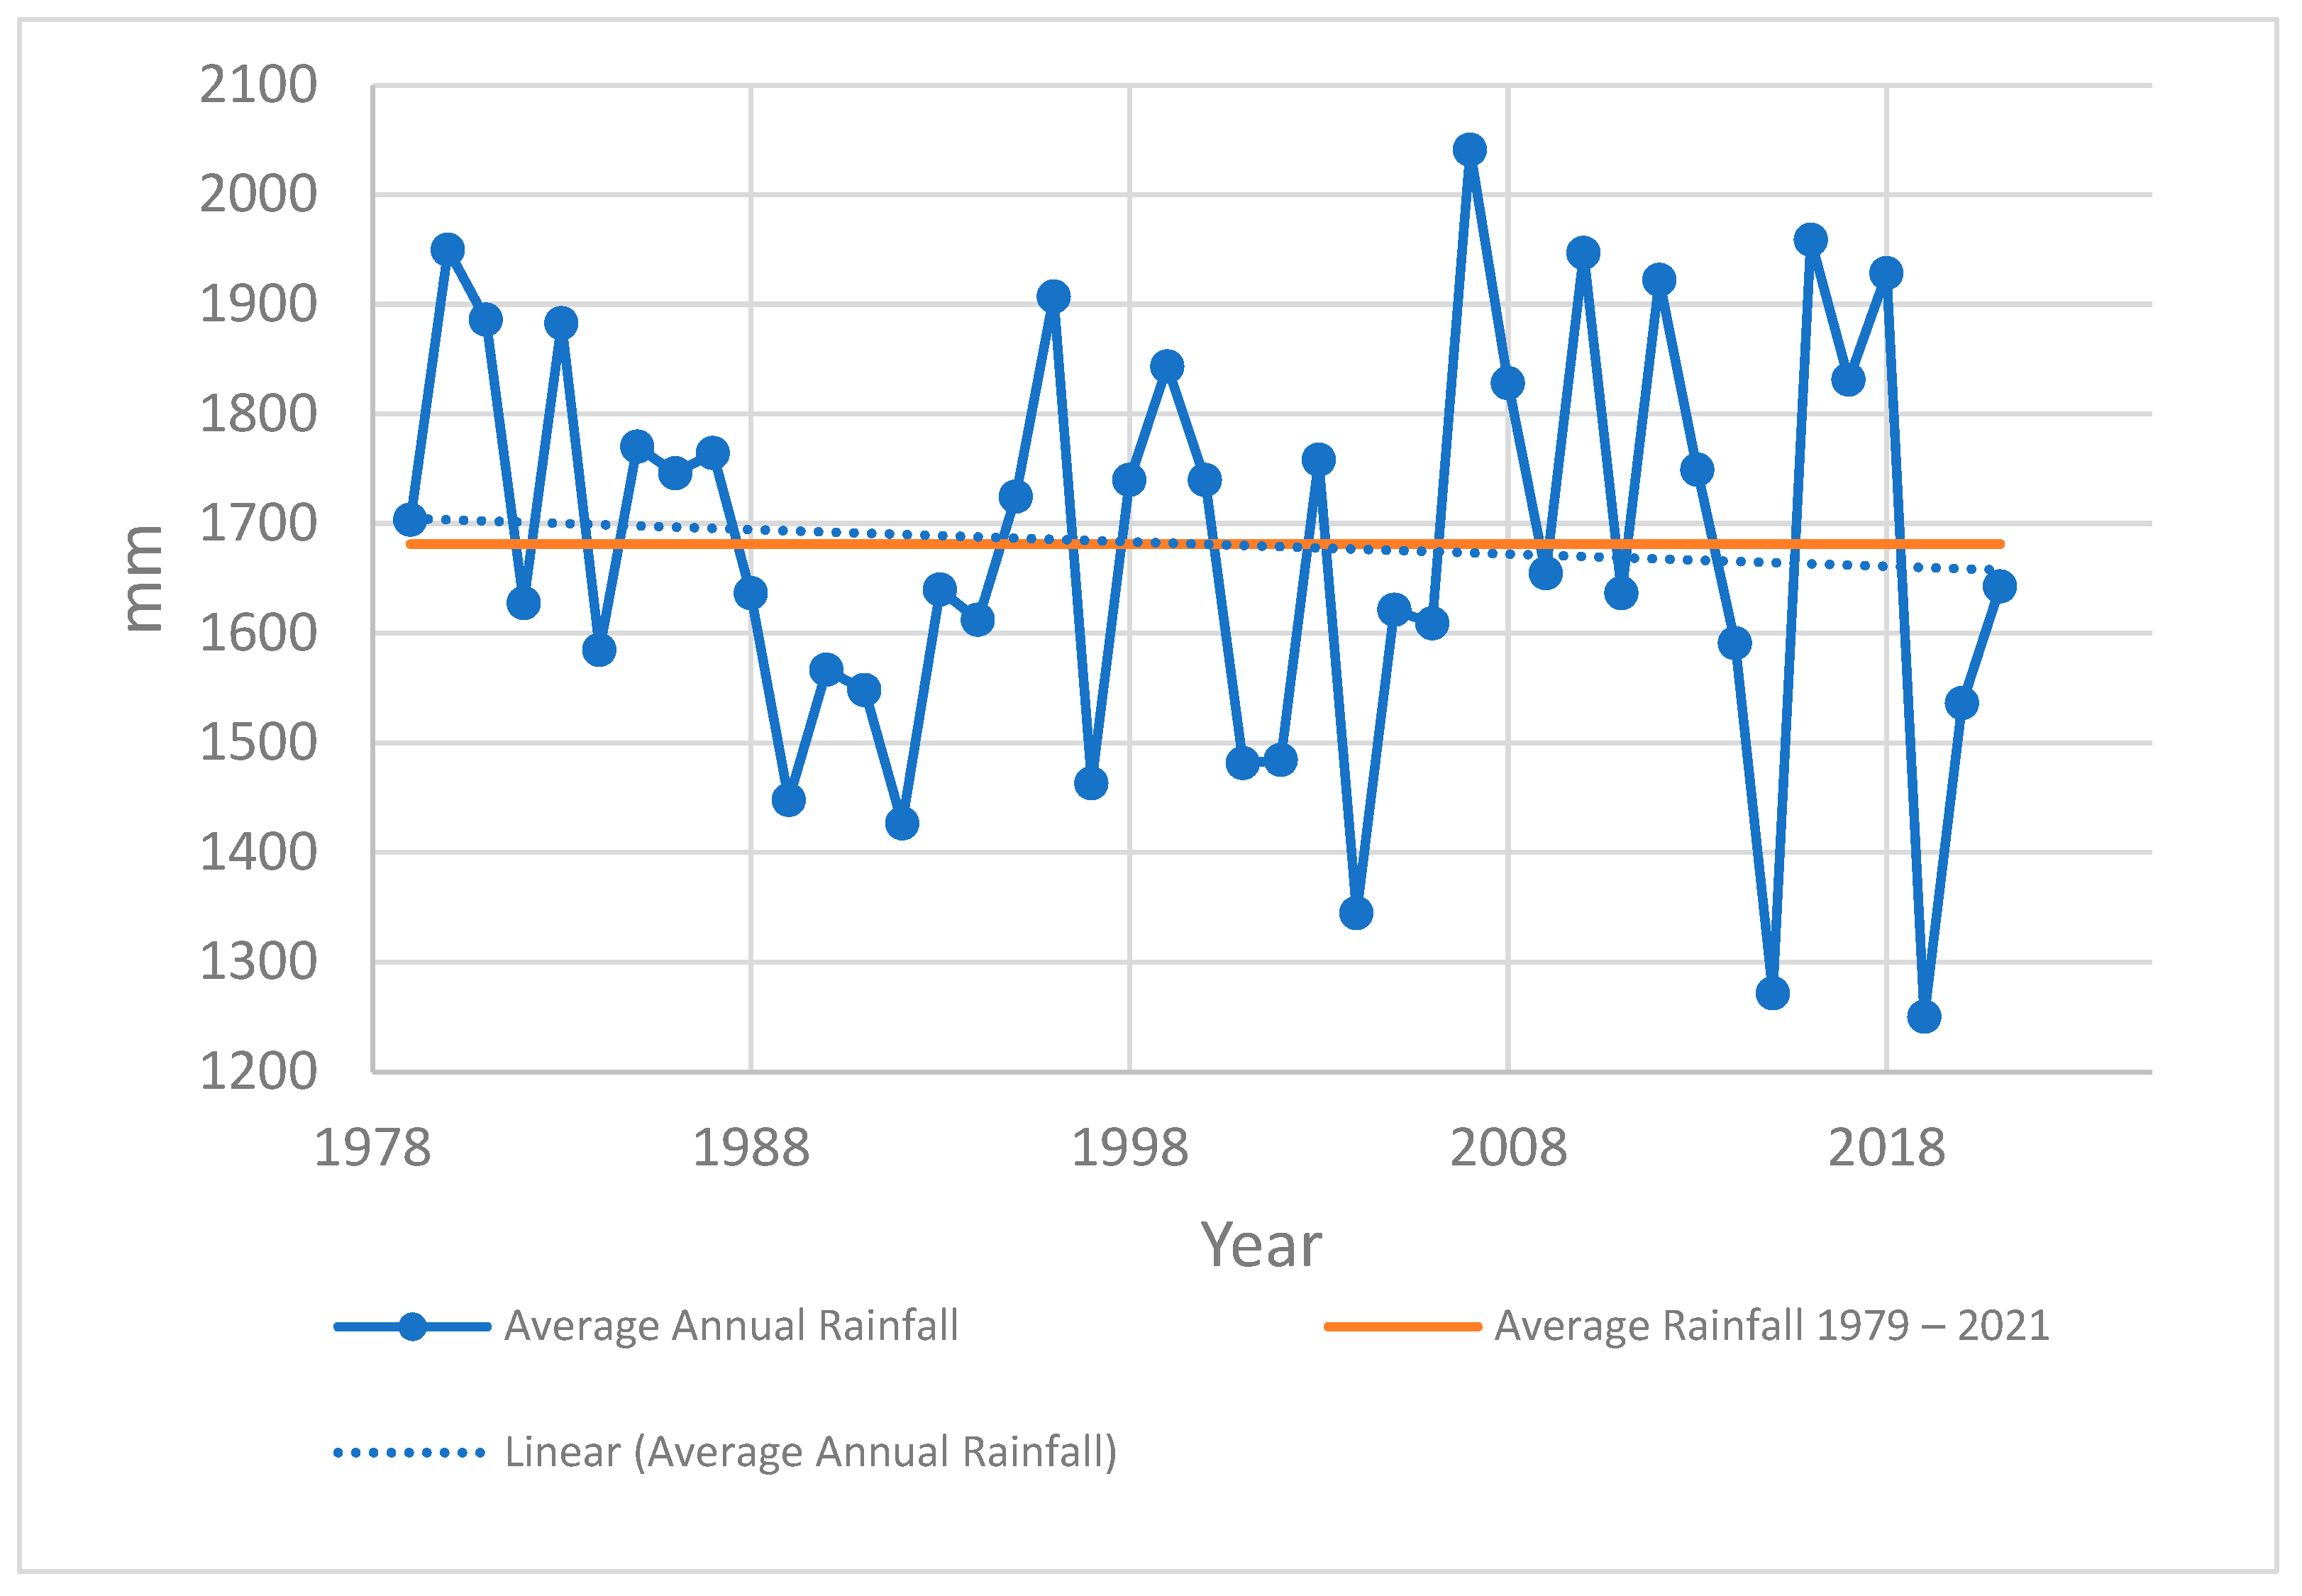
In recent years, the south–central region has experienced significant rainfall fluctuations attributed to the influence of the El Niño–Southern Oscillation (ENSO) phenomenon. This phenomenon, characterized by the simultaneous occurrence of El Niño and La Niña, has resulted in an increased variability in rainfall patterns. Specifically, the region has witnessed a higher frequency of years with below-average precipitation, leading to a substantial reduction in total annual rainfall. In some instances, the total annual rainfall has been observed to be more than 20% lower than the long-term average, with certain years experiencing reductions exceeding 30% [
24]. In additionally, according to research by Vinh and Huong [
25] combined with forecasting models proposed by the Ministry of Natural Resources and Environment of Vietnam [
26], drought and water shortage will become more and more serious; specifically, by 2050, there will be no shortage of water. There is still a significant drought area; by 2100, there will be only severe drought in Binh Thuan.
Figure 2 below shows a decreasing trend in average annual rainfall between 1979 and 2021 [
21].
Despite the diminishing duration of the rainy season, the heightened occurrence and magnitude of intense precipitation events can give rise to flash floods and landslides, presenting a significant risk to human lives and assets. Furthermore, an abundance of precipitation has the potential to cause harm to infrastructure and have adverse effects on agricultural productivity. The occurrence of these events can exert substantial impacts on the agricultural sector, water supplies, and infrastructure within the region [
27].
The agricultural sector in Binh Thuan Province is susceptible to the impacts of climate change, particularly in relation to crop production. Changes in temperature and precipitation patterns can have detrimental effects on agricultural productivity. Extended periods of drought and severe weather phenomena have the potential to diminish agricultural yields and alter established farming methodologies.
The agricultural sector in Binh Thuan Province is likely to see substantial effects as a result of increasing temperatures. According to the World Economic Forum, the adverse effects of climate change, such as elevated temperatures and intensified precipitation patterns, are causing detrimental impacts on land quality and leading to a decline in soil production. The negative impact on crop production is a consequence of the depletion of organic matter and soil nutrients [
28]. Moreover, it is worth noting that alterations in temperature, atmospheric carbon dioxide (CO
2) levels, and the occurrence and severity of extreme weather events may exert substantial effects on agricultural productivity [
29].
The occurrence of pests and illnesses that have the potential to impact fruit output is being influenced by climate change. For example, alterations in temperature and precipitation patterns have the potential to establish conducive environments for the proliferation and dissemination of pests and diseases, which can inflict harm upon fruit trees, fruits, and foliage.
In summary, the phenomenon of climate change is exerting various effects on the production of fresh fruit in Binh Thuan. These effects encompass alterations in temperature and precipitation patterns, the incidence of extreme weather events, as well as shifts in the prevalence of pests and illnesses. The aforementioned repercussions have the potential to lead to decreased agricultural production, diminished fruit quality, and financial losses for both farmers and the surrounding community.
2.2. Emerging Trends of Modelling Frameworks for Uncertainty and Climate Effects
Managers have been utilizing and developing decision-support systems in response to the uncertainties associated with fresh fruit production/distribution. The persistence of uncertainty and the challenges associated with forecasting continue to be a matter of concern [
30].
The agri-food supply chain is a multifaceted system encompassing production, distribution, and consumption. It is marked by considerable volatility arising from various causes, including weather conditions, market fluctuations, and customer preferences. Researchers have additionally presented a diverse range of mathematical models aimed at assisting managers and direct farmers in mitigating errors in decision-making within the context of risks and uncertainties prevalent in the agricultural supply chain. Nguyen et al. [
7], who aim to improve the supply chains of agricultural goods, are the main researchers that use the deterministic model. The decisions made by managers, however, may be prone to error due to the inherent nature and limitations of the deterministic model, which lacks the ability to effectively address uncertainties and risks. In recent years, there has been an emergence of stochastic programming and resilient optimization models as viable approaches to address problems characterized by uncertain aspects. The aforementioned methodologies have undergone enhancements, rendering them valuable instruments for decision-makers to promptly and efficiently tackle challenges pertaining to manufacturing, processing, transportation, and distribution.
Stochastic linear programming (SLP) is an extension of linear programming that incorporates parameters with inherent uncertainty. It has been applied in agri-food supply chain management, particularly in crop planning and animal production. Researchers like Carøe and Schultz [
31] have developed dual decomposition, a method for breaking down large stochastic integer programs into smaller subproblems. Pourmohammadi et al. [
32] created a model considering production, transportation, storage, processing, and regional demand to optimize wheat supply chains under uncertainty. The model reduced costs and improved supply chain performance. Jacquet and Pluvinage [
33] developed a discrete stochastic programming model to investigate how climatic variability affects farm management and evaluate farm strategies under different weather conditions. The model optimizes farm income and evaluates agricultural strategies in the setting of climate uncertainties. The study concluded that diversification and insurance policies may help farmers handle climatic uncertainty risks, emphasizing the importance of climate unpredictability in agriculture policy design and decision-making.
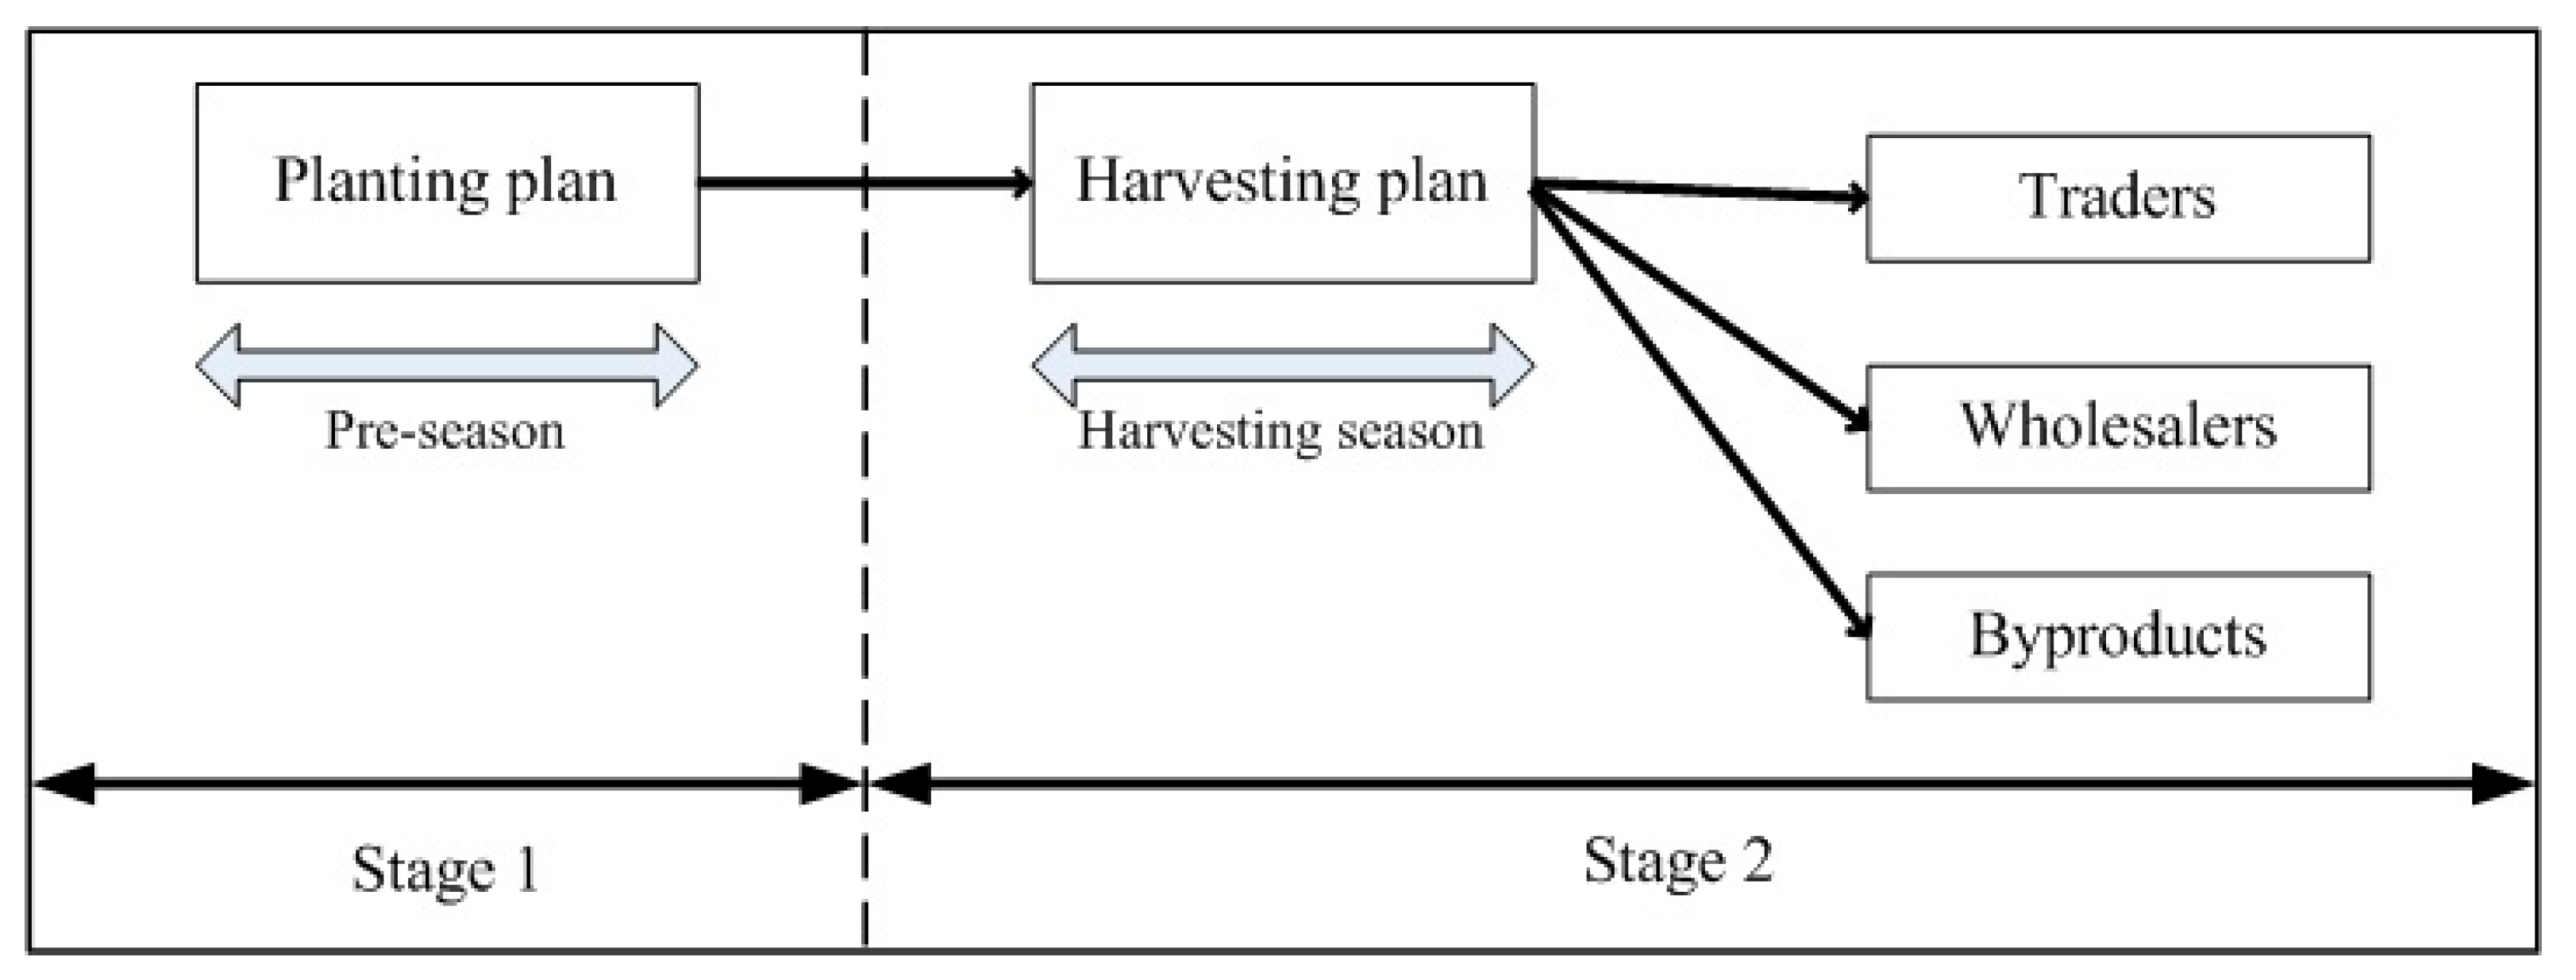
Two-stage stochastic programming (TSSP) is a widely used method in supply chain management, particularly in the agri-food industry. It helps manage the trade-off between long-term and short-term decision-making, considering uncertainty. Studies by Darby-Dowman et al. [
34], Kazaz [
35], Ahumada et al. [
36], Tan and Çömden [
37], Costa et al. [
38], Marchal et al. [
39], and Flores and Villalobos [
40] have all highlighted the importance of TSSP for managing uncertainty in supply chain management.
Darby-Dowman et al. [
34] developed a TSSP model with recourse model for horticulture planting plans, which accounts for weather and crop output variables. Kazaz’s production planning model [
35] considers yield, demand, cost, and price interdependencies to optimize production decisions. Ahumada et al. [
36] optimized production and distribution using a two-stage stochastic mixed-integer linear programming approach (SMILP), accounting for demand fluctuations, yield variability, and transportation costs. In their work, Tan and Çömden [
37] optimized yearly crop planning by addressing multiple sources of uncertainty, including variations in demand, maturation, harvest, and yield hazards. Costa et al. [
38] provided a paradigm for managing perishable vegetable crop supply chains, considering agricultural production, transportation, storage, and product perishability. Marchal et al. [
39] created a SMILP model to optimize production planning and address uncertainties. Flores and Villalobos [
40] suggested a stochastic planning framework to help agricultural stakeholders integrate different systems while considering market prices, crop yields, and weather variables. The approach optimizes land allocation, production, and resource management, maximizing predicted profit while considering land, labor, and environmental constraints.
Robust optimization (RO) is a method that considers multiple scenarios to create less uncertain solutions. Bohle et al. [
41], Munhoz and Morabito [
42], and An and Ouyang [
43] have used RO in agri-food supply chain management to improve resilience and reduce uncertainty-related risks.
A model developed by Bohle et al. [
41] optimizes harvest timing to maximize grape quality and minimize labor and equipment expenditures, improving wine grape harvesting schedule efficiency and dependability. Munhoz and Morabito [
42] created a robust citrus firm production planning optimization model using recourse actions and two-stage SMILP. The model minimizes the total estimated cost of the production plan, including supply and demand uncertainties, and meets customer demand and product quality standards in uncertain settings. In 2016, An and Ouyang [
43] introduced a resilient grain supply chain design model that accounts for post-harvest loss and harvest timing equilibrium, resolving supply–demand uncertainty and harvest timing–crop yield trade-offs. The model accurately represents the complicated harvest timing and post-harvest loss trade-offs, resulting in more robust and efficient supply chain architectures.
Multi-objective Stochastic Programming (MOSP) models have been utilized to manage the agri-food supply chain, focusing on economic, environmental, and social trade-offs. Banasik et al. [
44] developed a decision-support tool that considers demand, production yield uncertainty, and environmental factors. They used a mixed-integer linear programming (MILP) methodology to reduce production costs and environmental effects. The model allows producers to adjust their schedule based on demand and yield, resulting in more robust and eco-efficient production plans. Chavez et al. [
45] suggested a multi-objective stochastic optimization model for scheduling upstream operations in a sustainable sugarcane chain while considering growth, harvest, transportation, manpower, machinery, and vehicle scheduling. A compromise programming methodology was used to find the best harvesting method trade-offs in a Peruvian case study.
Global warming threatens natural resources, ecosystems, and human society [
46]. Climate change is worsening the impact of weather patterns on crop yields, productivity, and quality. Climate change significantly impacts agriculture, including fresh fruit production, due to temperature, rainfall, and extreme weather events [
47,
48].
Duangdai and Likasiri [
49] used mathematical modelling to study the relationship between global temperature and forest coverage, with a significant negative association found between temperature and rainfall. Lim et al. [
50] proposed a two-stage optimization model to increase oil palm plantation harvesting and transport efficiency, which reduced journey distance and improved harvesting and transportation efficiency. These findings can help plantation managers allocate resources more efficiently, increasing production and lowering costs. Sun et al. [
51] studied climate change and vegetation patterns using mathematical modelling and data analysis, highlighting the need for understanding climate change’s complex interactions with vegetation dynamics to develop effective conservation and management strategies. Ghaffari et al. [
52] used a Positive Mathematical Planning (PMP) model to evaluate drought’s economic consequences on agriculture under various climate change scenarios, emphasizing the need for effective adaptation and mitigation strategies. Kung and Wu [
53] examined how climate change influences water allocation and bioenergy output using stochastic mathematical programming. They found that water availability significantly impacts bioenergy output and that water distribution strategies may have different effects. Climate change management requires efficient water distribution, and adapting to water availability, crop yield, and unpredictability is crucial. This research highlights the importance of managing climate change sustainably to ensure sustainable development of water resources, agricultural productivity, and bioenergy.
As a matter of fact, studies on stochastic programming models for the agri-food supply chain need to include the following:
Enhanced prediction and decision-making through machine learning and artificial intelligence integration.
The development of two-stage stochastic programming (TSSP) models to enhance supply chain management.
The expansion of stochastic models to address climate change, sustainability, and circular economy.


 ,
, 


