Abstract
Energy and materials are increasingly important in industrialized countries, and they impact the economy, sustainability, and people’s future. The purpose of this work was to study the relationship between energy and the circular economy using methods such as Pearson’s correlation and a principal component analysis. Thus, 12 strong correlations were found, with 5 of them between the following relevant variables from two different subjects: the correlations of the raw material consumption, the domestic material consumption, and the material import dependency with the final energy consumption in transport (0.81, 0.92, and 0.81); the correlation of the circular material use rate with the final energy consumption in households (0.70); and the correlation of the material import dependency with the final energy consumption in industry (0.89). The time series forecast was only conclusive for the waste generated, showing that it will increase in the next 10 years.
1. Introduction
Many problems detected in recent decades still constitute challenges to be solved. The world’s population has been growing exponentially over the years, as mentioned by Paul Elrich in his book “The Population Bomb” [1], and several needs must be attended to, one of which is energy.
Energy production and consumption involve several aspects of unsustainability, beginning with the sources of energy. Energy production from fossil fuels causes air pollution, global warming, and fossil fuel depletion. This profoundly affects the legacy of future generations that will be exposed to polluted air and climate change, and will have reduced or no access to valuable mineral resources.
The sustainable development goals (SDGs) adopted by the United Nations Member States in 2015 are a framework that can be used to improve the global performance by acting in several sectors. For the energy goal (SDG 7), the aim is to provide access to affordable, reliable, and sustainable energy. However, based on current trends, in 2030, there will be 679 million people without access to electricity [2]. The annual energy intensity improvement rate for the period of 2010–2019 was only 1.9% [2], and, despite the many efforts around the world, the share of renewables in the total energy consumption was only 17.7% in 2019. The targets for this goal include universal access, affordability, and reliability for energy services; a significant increase in the share of renewable energy; and doubling the global rate of improvement in energy efficiency by 2030, using the energy intensity, calculated with the primary energy and the GDP (gross domestic product), as an indicator.
Energy is a key parameter for achieving sustainable development and, as shown, it has become a relevant policy objective on international agendas [3]. Furthermore, low-carbon and efficient energy systems have the potential to contribute to all SDGs [4]. In addition, energy efficiency reduces carbon dioxide emissions, which is linked to SDG 13 [5]. The adoption of cleaner energy vehicles can be important for achieving energy efficiency, according to the work of Xiong and Cheng [6]. Another central issue that is under analysis and discussion is the effect of the digital economy on energy efficiency [7,8]. Decarbonization, which is linked to energy consumption and energy efficiency, is vital and is a target for most countries [9,10]. Goods and products can also help improve the quality of life, but excessive production and consumption also vector unsustainability, due once again to the depletion of resources and the generation of waste that pollutes and contaminates the soil and water.
SDG 12 ensures sustainable consumption and production patterns, which are very important in this context, and sets targets concerning, for example, the sustainable management and efficient use of natural resources using indicators such as the material footprint and the domestic material consumption, which can be very useful in implementing a circular economy. A review by Barkhausen et al. [11] was carried out to analyze the use of a material flow analysis and a life cycle assessment (LCA) to evaluate circular economy requirements. Another relevant target for 2030 is a reduction, by half per capita, in food waste and food losses along with production and supply chains.
The balance between human activity and the environment is still a priority for humankind to solve. It was expected that, by 2020, the correct environmental management of chemicals and wastes would have been achieved through a reduction in emissions to the air, water, and soil, considering their life cycle and impacts on the environment and human health. By 2030, a significant reduction in wastes through prevention or reduction, reuse, and recycling is expected according to SDG 12 [2].
The effects of several variables on sustainable development and on the SDGs to be reached according to the UN agenda suggest that there may be interconnections or links among different field variables. As noted before, energy efficiency and the circular economy are very different variables and they may cause several connections. This work explores the nexus between those variables. Concerns about improving one of them require consideration of the changes in the other.
The aim of this work was to study the relationship between energy and the circular economy using statistical tools to characterize the datasets, aiming to find correlations between variables, to carry out a principal component analysis, and to forecast trends. The methods used were a descriptive analysis (the minimum, the maximum, the mean, the range, the standard deviation, and the variation coefficient), Pearson’s correlation, a principal component analysis, and a time series forecast. Compared to the existing literature, the novelty of this work is that it studies the relationship between energy and the circular economy, which can lead to better decisions, since the knowledge will be greater and, for that reason, better, and more sustainable solutions can be found and implemented.
2. Energy Efficiency and Circular Economy Concepts
2.1. Energy Efficiency Definition and Other Related Terms
Energy efficiency is related to other concepts, such as energy conservation and the energy demand, and sometimes, all these variables are mixed and used interchangeably. However, it is very important to clarify the definitions of each of these variables. Energy efficiency is the ratio between the output and the energy input—Equation (1). Thus, it is not a quantity. If there is an increase in efficiency, it means that less energy is being used for the same level of output; thus, there is an energy saving. Note that this does not always imply a reduction in energy consumption, since it could correspond to a more efficient use of energy.
The output can be related to the performance, including thermal comfort and services such as the transport of persons, information, or energy. Energy savings, on the other hand, are a reduction in energy consumption—Equation (2) [12]. The energy intensity is the energy used divided by the GDP—Equation (3). The use of energy efficiency leads to some important concerns. The energy quality and the durability of materials can be disregarded, since energy efficiency is, by definition, a relative, and not an absolute, variable, which can lead to the continuation of the use of high levels of energy. Different and deeper measures may not be implemented, which will prevent the achievement of more sustainable systems [12].
Nevertheless, in some cases, energy efficiency is increased, as mentioned, because there is a reduction in the consumption of energy to obtain the same output, which is desirable and should be promoted.
Energy efficiency, as stated by von Malmborg [10], can have five different perspectives: technological, energy systems, economic, environmental, and international. In the first one, the aim is the energy performance of a technology. The second is about demand management and energy security, and the third is related to energy productivity (reduction in energy inputs does not affect the economic outputs). In the fourth perspective, energy efficiency is seen as a means to achieve climate mitigation, and finally, in the fifth perspective it is related to the energy-to-GDP ratio, benchmarking across countries.
Energy efficiencies can be applied to many sectors, such as construction. In this sector, energy efficiency may include the materials used for construction, the glazing type, the wall construction, the roof construction, etc. [13]. Industry is also a vital sector for applying energy efficiency measures such as technology substitutions, maintenance improvements, supply chain modifications, and distance and load optimization [14]. The residential sector can also contribute to this matter by efficiently operating cooling and heating equipment, for example [15]. Transport is a crucial sector for applying energy efficiency measures, since it greatly affects environmental issues such as climate change. One measure is the promotion of low-emission mobility. Education, for example, was found to have strong relationships with energy efficiency [16], and Su [17] addressed the drivers and barriers of energy efficiency. GDP, weather, trade, and infrastructure effects can explain the energy efficiency. Quito et al. [18] studied the factors of energy efficiency in 43 countries leveraged on spatial econometrics models. The energy production was studied, and one conclusion was that energy production depends on the energy productivity, the primary energy consumption, and the energy imports [19].
2.2. Circular Economy Definition
A circular economy is an approach used to organically promote and enhance sustainability in nations, organizations, and society [20]. Entropy and sustainability are often related and are linked to resource use [21].
The linear economy model is, to date, the model that is adopted in all economies. However, this type of model that takes resources and generates waste is not sustainable and leads to resource depletion and environmental burdens. In this model, economic growth is intrinsically linked to an increase in the production and consumption, causing the depletion of resources and pollution [22].
Society needs to change its consumption patterns to be within the ecological limits [23]. The transition process towards a green economy has been studied, and these studies have emphasized that the interdependent pillars, among other things, should be addressed [24].
The Ellen MacArthur Foundation proposed a methodology based on the elimination of waste and pollution via design, the circulation of products and materials, and the regeneration of nature [25]. This type of proposal is very much in line with life cycle thinking, since waste generation is prevented. The idea is to work at the highest level of waste hierarchy as set by the European Waste Framework Directive. Renewable resources and renewable materials are keystones in the circular economy concept.
Some authors have stated that a circular policy is unlikely to be feasible and socially accepted without the support of complementary redistribution policies [26]. The definition of a circular economy can assume many different forms, as shown in the work by Kirchherr et al. [27], with 221 definitions of a circular economy, which emphasizes that this matter requires more attention to better clarify its meaning and how it can be assessed.
Material flows can be a very useful tool for assessing a circular economy. Some material indicators are often used, as presented in Table 1 and Figure 1.

Table 1.
Material flow indicators.
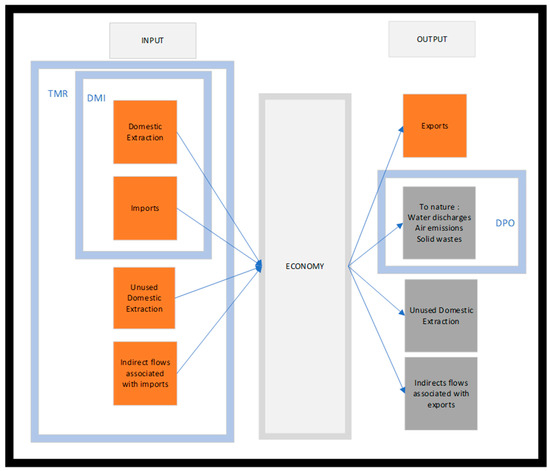
Figure 1.
Material flow.
Raw material consumption depends on the raw material equivalent (RME) imports and exports, with the RME imports being the amount of raw material required to produce the goods imported into the economy and the RME exports being the amount of raw material required to produce the goods exported from the economy.
The European Union (EU) Commission action plan considers seven key domains for achieving a circular economy. Plastics, textiles, e-waste, food, water and nutrients, packaging, batteries, vehicles, buildings, and construction are the crucial areas for promoting a circular economy. For plastics, the EU proposed a plastics strategy with a goal that, by 2030, plastic packaging can be reused or recycled. It also aims to reduce the consumption of single-use plastics.
Electronic and electrical waste is the domain that presents the highest growth in the EU, with less than 40% recycled, so there is huge potential for a circular economy. The EU will promote reusability and repairability to achieve a longer product life. The application of measures to the construction sector allows for a circular economy by increasing the lifespan of buildings, reducing the carbon footprint, and promoting the use of materials as well as a reduction of embodied energy [28].
3. Materials and Methods
3.1. Variables
As stated, this work aims to analyze the nexus between energy and the circular economy. For this purpose, a set of variables was chosen from material flow variables and energy variables, as presented in Table 2.
Table 2.
Variables considered in this analysis.
Seven variables concerning material flow may represent accountability in a circular economy, including the amount of waste generated, trading in recyclable materials, etc. The material flow variables are defined in Table 2. For the energy domain, 3 variables also presented in Table 2 were considered. The countries considered were the 27 EU countries.
3.2. Descriptive Analysis
In this preliminary analysis, for all the variables considered, the number of elements, the minimum, the maximum, the mean, the range, the standard deviation, and the variation coefficient were determined. The variation coefficient was calculated by dividing the standard deviation by the mean. High values for this coefficient meant high dispersion. A skewness and a kurtosis analysis were also carried out. Skewness is a measure of the asymmetry of a distribution. If a normal distribution is symmetric, it has a skewness value of zero. A significant positive value for skewness means a long right tail. For a normal distribution, the value of kurtosis is zero, positive numbers indicate more outliers than in a normal distribution, and, on the other hand, negative values mean that there are fewer outliers than in a normal distribution. IBM SPSS, version 28, was used for this task.
3.3. Correlations
For this work, the package corrplot in software R, version 4.3.0 (R Core Team 2023) was used [29]. This package plots Pearson’s correlation coefficients between all pairs of variables in the table, returning the correlation values and the p-values. It provides a visualization method to present the p-values and confidence intervals, validating the statistical significance of the correlation. The correlation matrix output grants a visual exploratory tool to evaluate the relationships among pairs of variables.
3.4. Principal Component Analysis
The study methodology was centered around the principal component analysis (PCA) model. This technique is used for multivariate exploratory analyses to transform a set of interrelated variables into a smaller set of independent variables or linear combinations. The main goal of this method is to simplify the complexity of the data. By using indicators known as principal components, which are the linear combinations of all the variables studied, a significant portion of information present in the original variables can be aggregated. In this work, two components (dimensions) were defined to simplify the analysis of the variables under study. This process allowed for the simultaneous quantification of categorical variables while controlling the data’s dimensionality. By reducing the dimensions, the analysis becomes more straightforward and the variables can be interpreted as some uncorrelated components rather than the numerous, loosely related variables found in the original dataset [30]. A standard principal component analysis typically assumes linear relationships between numerical variables. However, with a PCA, categorical variables can be optimally quantified based on the assumed dimensionality in the model analysis, allowing for the modeling of non-linear relationships between variables [31].
The selection of this methodology was driven by the considerable number of variables employed in this study. Its purpose extended beyond merely understanding the pairwise correlation between variables (bi-variable correlation) and aimed to comprehend the systemic outcomes that arise when exploring the relationships among all the independent variables present in the research.
3.5. Time Series Forecast
The analysis of time series is a fundamental component that plays a critical role in numerous fields, and it is utilized to forecast future trends. In addition, various strategies are implemented to conserve resources, as reported by Martínez et al. [32]. Time series forecasting is a methodology that involves the prediction of future values of a time-dependent variable based on its past values. In this work, the forecast package, which is integrated into the software R, version 4.3.0, was employed as documented by Hyndman and Khandakar [33]. The time span considered was ten years, from 2010 to 2020.
4. Exploring the Nexus of Energy Efficiency and Circular Economy
4.1. Descriptive Analysis of Variables
Table 3 presents the results of the analysis for the 10 variables. Considering the results obtained, it was possible to conclude that the range, minimum, maximum, and mean were quite different for several variables, although there was no clear distinction between the groups of variables related to materials and energy. By analyzing the values, it was possible to conclude that the variation coefficient was low, which means that the values were close to the mean, so the data presented a low dispersion.
Table 3.
Descriptive statistics: analysis of the variables.
Table 4 presents the results of the skewness and kurtosis analysis. It was possible to conclude that the sets of data did not present a high asymmetry and were close to a normal distribution because the statistical value divided by the standard error in both cases was less than 2 in absolute terms.
Table 4.
Descriptive statistics: skewness and kurtosis analysis.
4.2. Time Series Analysis
For the time series analysis, two approaches were adopted; the first approach analyzed the historical data of each variable of each of the 27 EU countries, and the second one plotted a forecast for each variable while considering the 27 EU countries. The data were taken from Eurostat [34]. In Figure 2, a graphical representation of the data is presented. Through the data analysis, the following considerations were observed for each variable:
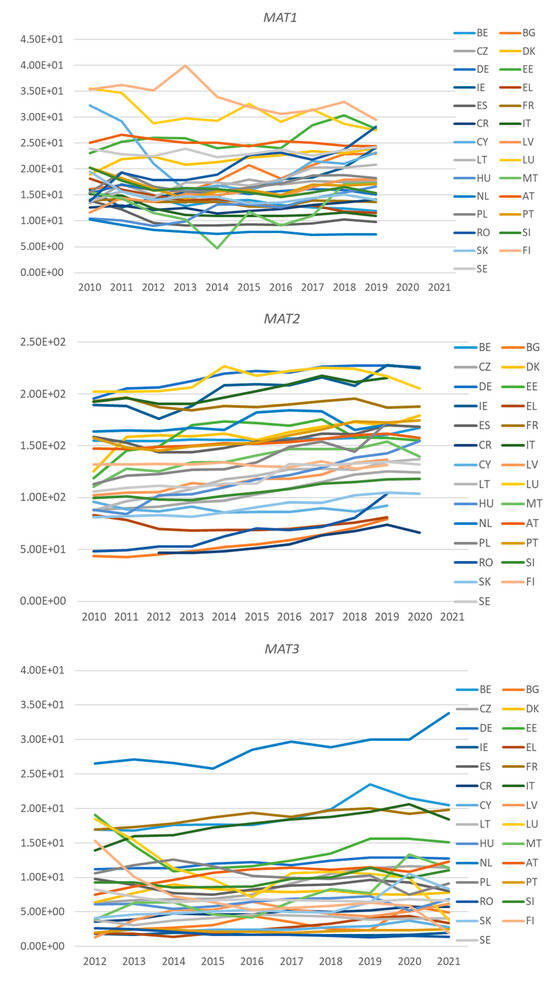
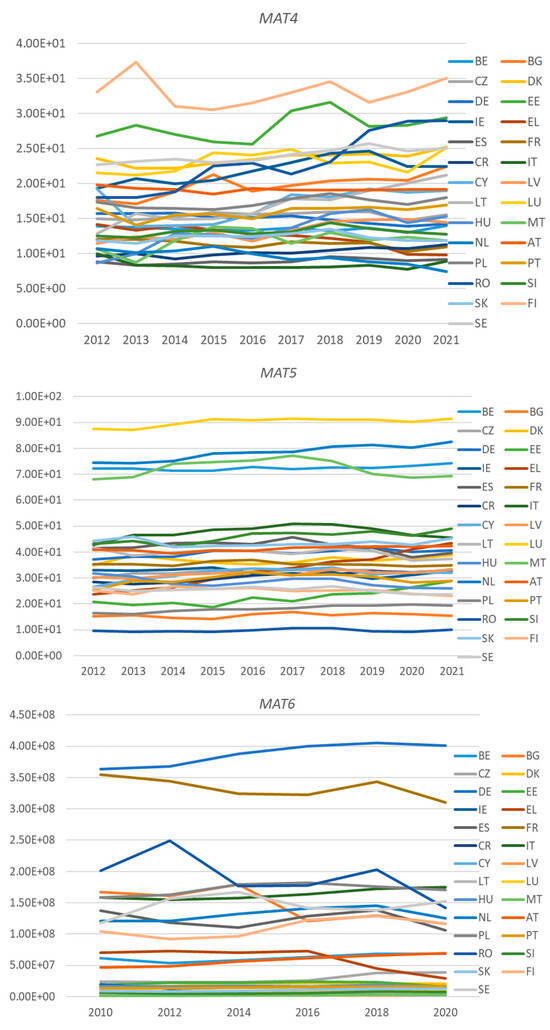
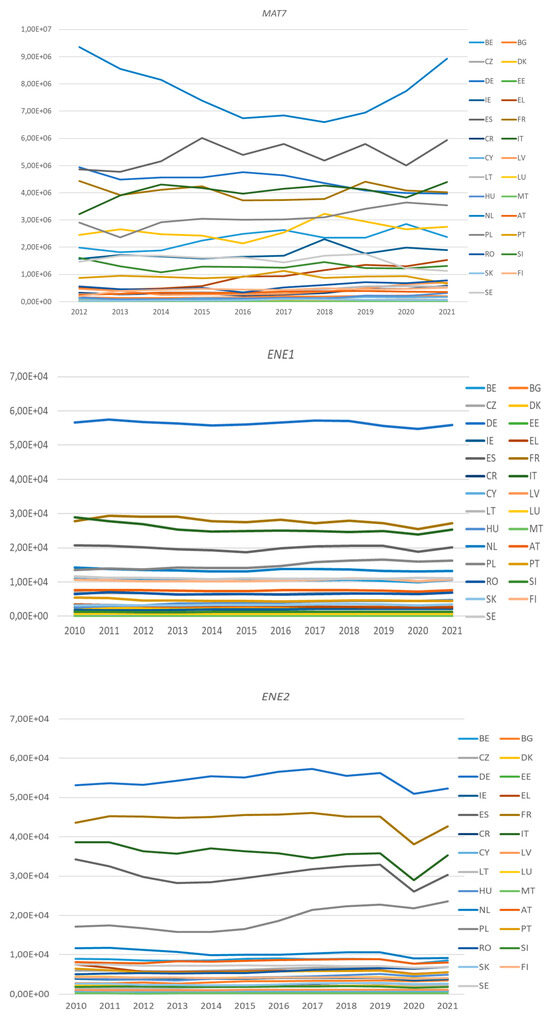
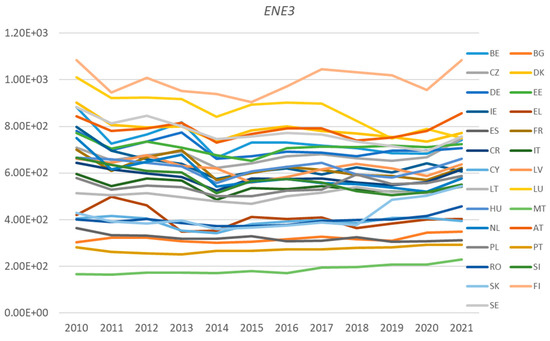
Figure 2.
Time series for each variable, considering each of the 27 EU countries individually.
- MAT1: The raw material consumption indicator quantifies the amount of material extracted, domestic and abroad, required directly and indirectly to produce the products consumed in the geographical area.
- By analyzing the plots, it was possible to conclude that Finland, Estonia, Luxembourg, Romania, and Austria presented the highest values for this indicator, all of them with values above 20 tonnes per capita. Many of the other EU countries presented a raw material consumption between 10 and 20 tonnes per capita per year. The Netherlands can be highlighted by its decreasing trend and low value for this indicator.
- MAT2: This indicator measures the quantity of packaging waste. The countries that presented the worst performance were Germany, Ireland, Italy, France, and Denmark, with values above 170 kg per capita per year. On the other hand, Croatia, Romania, and Bulgaria presented the lowest values, below 90 kg per capita per year. This means that there are significant differences in this domain in the EU.
- MAT3: The circular material use rate, also known as the circularity rate, measures the quantity of materials that come from recycled waste materials, and it is expressed as a percentage. For this indicator, the countries that presented the highest values were the Netherlands, Belgium, France, Italy, and Estonia. The Netherlands has had values between 25% and 35% since 2012. Estonia presented lower values, but since 2019, its values have been above 25%. Belgium, France, and Italy have had values above 15% and below 25% since 2013. At this point, it is important to remember the performance for the raw material consumption, because the Netherlands also presented a very good value for this indicator, and there may be a link between the two.
- MAT4: The countries that presented the highest values were Finland (between 30 and 40 tonnes per capita), Romania, Estonia, Sweden, and Denmark. There has been strong growth in this indicator in Romania since 2012. The values for Estonia, Sweden, and Denmark have been more stable, without significant variations, since 2012. All these countries have small populations and most of them are located in the north of Europe.
- MAT5: Concerning the material import dependency, it was possible to conclude that some countries from East Europe presented the lowest values, namely Romania, Bulgaria, and Poland. Smaller countries dominated this indicator, namely Luxembourg, the Netherlands, Belgium, and Malta, with values higher than 50%. Luxembourg led with more than 90%, which is an undesirable characteristic because it means that this country depends highly on other states to fulfil its needs.
- MAT6: The two countries that were the most detached were Germany and France, with values higher than 300 Mtoe for domestic material consumption, followed by Italy, Poland, and Sweden.
- MAT7: In the trade of recycled materials, the performance of the Netherlands was highlighted. It presented values as high as 8.5 million tonnes, which was very far from the values presented by the other countries that followed it, and those countries are the most industrialized in the European Union, namely Spain, Italy, France, Germany, and Poland.
- ENE1: The European countries that presented the highest energy consumption in industry were Germany, France, Italy, Spain, and Poland. By analyzing industry in the European Union, it was possible to conclude that these values were aligned with industrial production, and the following values were obtained: Germany: 27%, Italy: 16%, France: 11%, Spain: 8%, and Poland: 6%.
- ENE2: The top five countries regarding the final consumption in transport were the same as those for the energy consumption in industry.
- ENE3: The final consumption of households ranged from 100 to 1.100 kgoe, and the countries that were placed on the right side of the interval were Finland, Austria, Denmark, Luxembourg, and Sweden. This may be justified by the weather conditions, namely the very low temperature of these countries. On the other side, countries such as Malta, Portugal, Spain, and Bulgaria presented the lowest values. Considering the weather, it would be expected that countries such as Italy and Greece, for example, would also present low values, despite air conditioning, which can also contribute to a rise in the energy consumption of households.
As can be perceived from the observations in Figure 2, some values for the variables (specially MAT6, MAT7, ENE1, and ENE2) were very similar and with low variation along the years for some countries, which caused some overlapping of the curves.
4.3. Correlation Applied to Variables
Based on the existing data from the variables, an analysis of bivariate correlations was performed by using the package corrplot of the software R, version 4.3.0. Below, Figure 3 presents the overall correlations between variables, and Table 5 shows the variables with the greatest positive correlation relevance (I: strongly positive, II: positive).
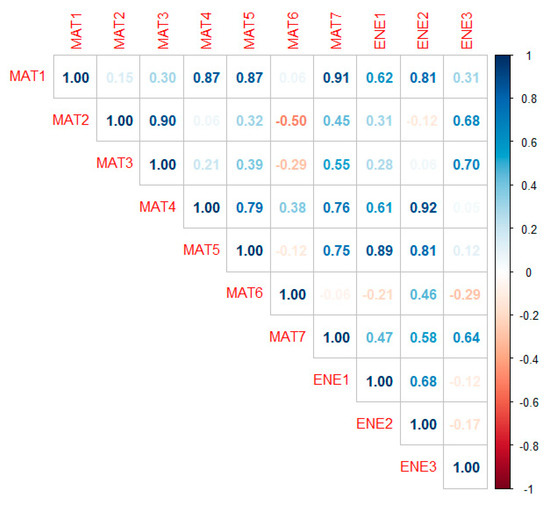
Figure 3.
Overall bi-variable correlation.
Table 5.
Bi-variables with the highest correlation weight.
By analyzing the results, it was possible to conclude that there were 12 strong correlations, with 5 of them linking material and energy variables, which is very important. These strong correlations have drawn the attention of policymakers and other stakeholders to the need for more collaborative work involving energy and circular economy measures. The decision-making process should consider these correlations in order to obtain better and more sustainable solutions.
A cluster analysis method was used to organize the variables. A cluster analysis is a statistical technique used to group similar variables together based on their data characteristics. In this study, the clustering process identified two robust grouping clusters: Cluster I (ENE3, MAT2, and MAT3) and Cluster II (ENE1, ENE2, MAT4, MAT7, MAT5, and MAT1). The plotting of the cluster analysis is presented in Figure 4.
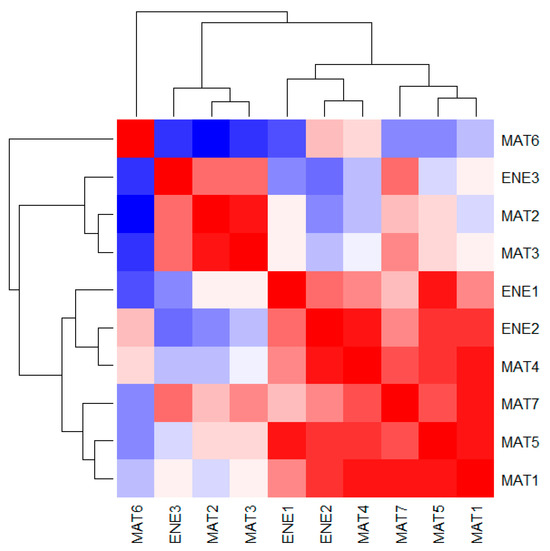
Figure 4.
Overall bi-variable cluster analysis.
4.4. Principal Component Analysis (PCA)
The output of the PCA developed in the package princomp, from software R, version 4.3.0, showed that the first component (DIM 1) had a standard deviation of 0.9142, which corresponded to 58.25% of the total proportion of variance. The second component (DIM 2) had a standard deviation of 0.7006, which corresponded to a proportion of variance of 34.21%, in which both dimensions made up a total cumulative proportion of 92.45%. The summarized model is shown in Table 6.
Table 6.
Model summary of the two components.
Considering the two components, the top five variables with the highest weight of variance were MAT2, MAT6, ENE2, ENE3, and MAT3, as shown in Figure 5.
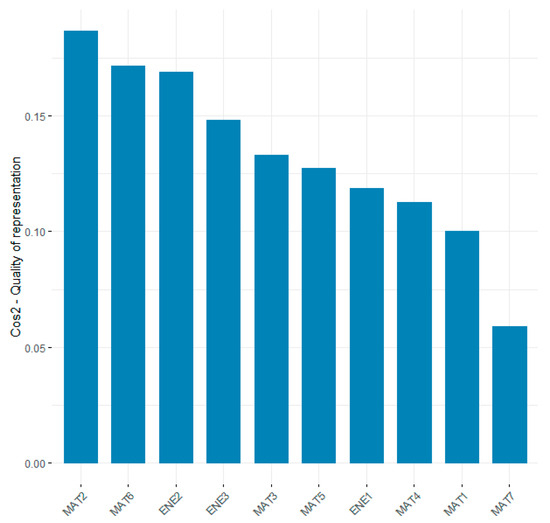
Figure 5.
Variance accounted for by components DIM 1 and DIM 2.
In the first component, the top five variables with the highest weight of variance were ENE2, MAT2, ENE3, MAT3, and MAT6, as presented in Figure 6. The top five variables with the highest weight of variance in Component 2 were MAT5, ENE1, MAT6, MAT1, and MAT7, as exhibited in Figure 7.
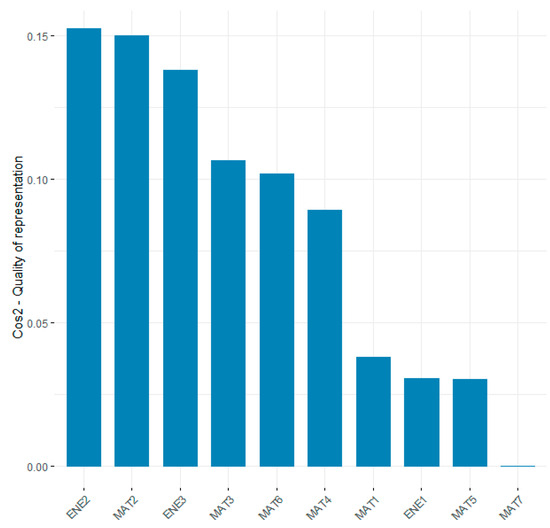
Figure 6.
Variance accounted for by component DIM 1.
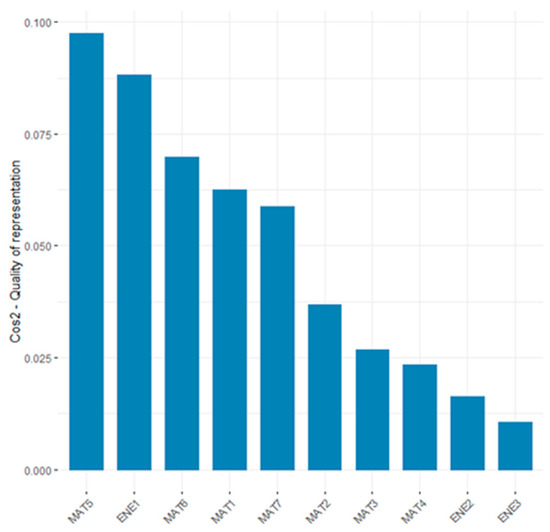
Figure 7.
Variance accounted for by component DIM 2.
Table 7 shows the weights of the studied variables in the two components, which are presented graphically in Figure 8. Based on the corresponding loading vectors, a confluence of variables was observed, defining two groups and a standalone variable. The first group was composed of the variables MAT5, ENE1, MAT7, MAT1, MAT4, and ENE2, which presented positive load values in the two components (DIM 1, DIM 2), and the second group was established by MAT2, MAT3, and ENE3 by considering the positive loading value in DIM 2 and the negative loading value in DIM 1. The standalone variable MAT6 had a positive loading value in DIM 1 and a negative loading value in DIM 2.
Table 7.
Component loadings.

Figure 8.
Biplot of the PCA.
4.5. Time Series Forecast
Through the data forecast visualization, it could only be concluded that MAT2 (waste generated) will continue to present a positive trend for the next 10 years. The results of the other variables were inconclusive due to the short time span used in the analysis. It is possible to confirm these statements using Figure 9. The black line in figures represent the evolution for variables to the present and the blue line represents the forecast evolution of the variable to 2030. Grey zone and purple zones represent 95% and 80% confidence interval respectively.
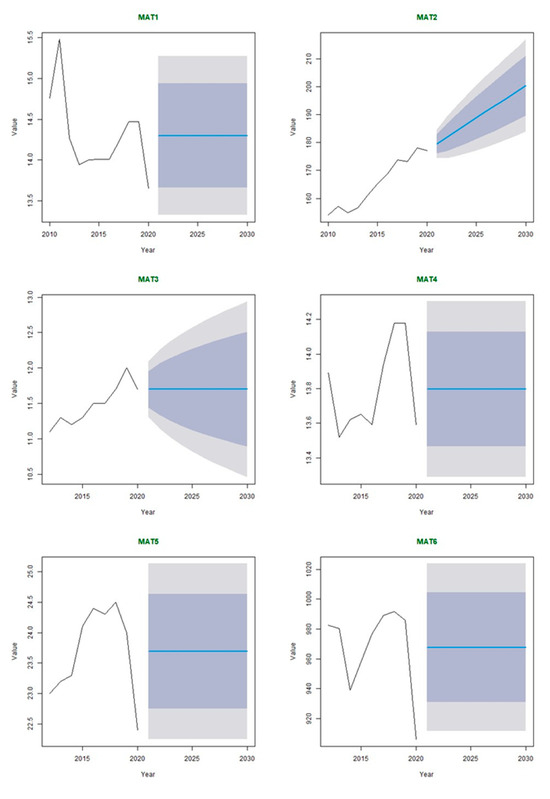
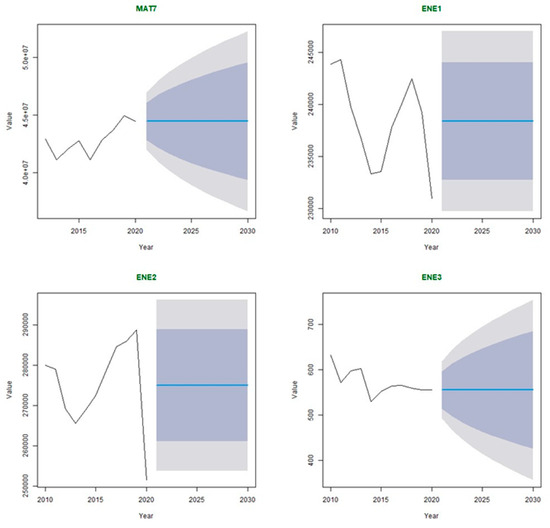
Figure 9.
Time series forecast for each variable, considering the 27 EU countries.
5. Conclusions
Energy and a circular economy are key issues to be addressed. Individually, they present many challenges to the aim of achieving sustainability by providing a good quality of life and access to sustainable energy without large amounts of pollution or the depletion of resources. Their linkage was perceived in time using a qualitative analysis and showed that, despite a common geographical area, there are still many differences; some may be due to weather characteristics, but others may be based on society’s organizational features. The relationship between them was further explored using a correlation analysis, and 12 strong correlations were found. The material import dependency (MAT5) had two strong correlations with two energy variables, the final energy consumption in industry (ENE1) and the final energy consumption in the transport sector (ENE2). MAT1 (raw material consumption) and MAT4 (domestic material consumption) had a strong correlation with the final energy consumption in the transport sector (ENE2) and a positive correlation with ENE1 (final energy consumption in industry). MAT3 (circular material use rate) was strongly correlated with the final energy consumption in households (ENE3). These results may lead to measures for the reduction in material flows or energy with a more holistic approach in order to make use of synergetic positive effects. The several strong correlations identified may provide awareness to policymakers and other stakeholders that measures concerning energy variables can affect the circular economy performance and vice versa, which leads to the need for more collaborative work. The time series forecast was only conclusive for the waste generated, showing that it will increase in the next 10 years.
Author Contributions
F.F.M.: conceptualization, methodology, analysis, and writing; H.C.: methodology, analysis, and writing; M.S.: analysis; N.C. and C.F.: writing—review and editing. All authors have read and agreed to the published version of the manuscript.
Funding
This work was supported by national funds through FCT/MCTES (PIDDAC): LEPABE, UIDB/00511/2020 (https://doi.org/10.54499/UIDB/00511/2020); UIDP/00511/2020 (https://doi.org/10.54499/UIDP/00511/2020); ALiCE, LA/P/0045/2020 (https://doi.org/10.54499/LA/P/0045/2020); CIETI UIDB/04730/2020 (https://doi.org/10.54499/UIDB/04730/2020); UIDP/04730/2020 (https://doi.org/10.54499/UIDP/04730/2020) and INESC TEC, LA/P/0063/2020.
Informed Consent Statement
Not applicable.
Data Availability Statement
Data used in this work are available from the Eurostat Database.
Conflicts of Interest
The authors declare no conflicts of interest.
References
- Williams, N. The population bomb. Curr. Biol. 2008, 18, R535–R536. [Google Scholar] [CrossRef] [PubMed]
- UN SDG. Available online: https://sdgs.un.org/goals (accessed on 1 October 2023).
- Gunnarsdottir, I.; Davidsdottir, B.; Worrell, E.; Sigurgeirsdottir, S. Sustainable Energy Development: History of the Concept and Emerging Themes. Renew. Sustain. Energy Rev. 2021, 141, 110770. [Google Scholar] [CrossRef]
- Pan, X.; Shao, T.; Zheng, X.; Zhang, Y.; Ma, X.; Zhang, Q. Energy and Sustainable Development Nexus: A Review. Energy Strateg. Rev. 2023, 47, 101078. [Google Scholar] [CrossRef]
- Zakari, A.; Khan, I.; Tan, D.; Alvarado, R.; Dagar, V. Energy Efficiency and Sustainable Development Goals (SDGs). Energy 2022, 239, 122365. [Google Scholar] [CrossRef]
- Xiong, Y.; Cheng, Q. Effects of New Energy Vehicle Adoption on Provincial Energy Efficiency in China: From the Perspective of Regional Imbalances. Energy 2023, 281, 128324. [Google Scholar] [CrossRef]
- Song, M.; Pan, H.; Vardanyan, M.; Shen, Z. Evaluating the Energy Efficiency-Enhancing Potential of the Digital Economy: Evidence from China. J. Environ. Manag. 2023, 344, 118408. [Google Scholar] [CrossRef]
- Wu, J.; Lin, K.; Sun, J. Improving Urban Energy Efficiency: What Role Does the Digital Economy Play? J. Clean. Prod. 2023, 418, 138104. [Google Scholar] [CrossRef]
- Maghrabi, A.M.; Song, J.; Markides, C.N. How Can Industrial Heat Decarbonisation Be Accelerated through Energy Efficiency? Appl. Therm. Eng. 2023, 233, 121092. [Google Scholar] [CrossRef]
- von Malmborg, F. First and Last and Always: Politics of the ‘Energy Efficiency First’ Principle in EU Energy and Climate Policy. Energy Res. Soc. Sci. 2023, 101, 103126. [Google Scholar] [CrossRef]
- Barkhausen, R.; Rostek, L.; Miao, Z.C.; Zeller, V. Combinations of Material Flow Analysis and Life Cycle Assessment and Their Applicability to Assess Circular Economy Requirements in EU Product Regulations. A Systematic Literature Review. J. Clean. Prod. 2023, 407, 137017. [Google Scholar] [CrossRef]
- Dunlop, T.; Völker, T. The Politics of Measurement and the Case of Energy Efficiency Policy in the European Union. Energy Res. Soc. Sci. 2023, 96, 102918. [Google Scholar] [CrossRef]
- Maaouane, M.; Chennaif, M.; Zouggar, S.; Krajačić, G.; Amrani, S.; Zahboune, H. Cost-Effective Design of Energy Efficiency Measures in the Building Sector in North Africa Using Building Information Modeling. Energy Build. 2023, 294, 113283. [Google Scholar] [CrossRef]
- Cagno, E.; Accordini, D.; Trianni, A.; Katic, M.; Ferrari, N.; Gambaro, F. Understanding the Impacts of Energy Efficiency Measures on a Company’s Operational Performance: A New Framework. Appl. Energy 2022, 328, 120118. [Google Scholar] [CrossRef]
- Altieri, D.; Patel, M.K.; Lazarus, J.; Branca, G. Numerical Analysis of Low-Cost Optimization Measures for Improving Energy Efficiency in Residential Buildings. Energy 2023, 273, 127257. [Google Scholar] [CrossRef]
- Zhang, Q.Y.; Best, R.; Chareunsy, A. The Impact of Globalisation and Education in Promoting Policies for Renewables and Energy Efficiency. J. Clean. Prod. 2023, 421, 138559. [Google Scholar] [CrossRef]
- Su, Y.W. The Drivers and Barriers of Energy Efficiency. Energy Policy 2023, 178, 113598. [Google Scholar] [CrossRef]
- Quito, B.; del Río-Rama, M.d.l.C.; Álvarez- García, J.; Bekun, F.V. Spatiotemporal Influencing Factors of Energy Efficiency in 43 European Countries: A Spatial Econometric Analysis. Renew. Sustain. Energy Rev. 2023, 182, 113340. [Google Scholar] [CrossRef]
- Batrancea, L.M.; Tulai, H. Thriving or Surviving in the Energy Industry: Lessons on Energy Production from the European Economies. Energies 2022, 15, 8532. [Google Scholar] [CrossRef]
- Cheffi, W.; Kaleem Zahir-ul-Hassan, M.; Omer Farooq, M.; Baqrain, A.; Mohamed Habib Mansour, M. Ethical Leadership, Management Control Systems and Circular Economy in SMEs in an Emerging Economy, the UAE. J. Bus. Res. 2023, 156, 113513. [Google Scholar] [CrossRef]
- McMahon, G.F.; Mrozek, J.R. Economics, Entropy and Sustainability. Hydrol. Sci. J. 1997, 42, 501–512. [Google Scholar] [CrossRef][Green Version]
- Khan, K.; Su, C.W.; Khurshid, A. Circular Economy: The Silver Bullet for Emissions? J. Clean. Prod. 2022, 379, 134819. [Google Scholar] [CrossRef]
- Figge, F.; Thorpe, A.S. Circular Economy, Operational Eco-Efficiency, and Sufficiency. An Integrated View. Ecol. Econ. 2023, 204, 107692. [Google Scholar] [CrossRef]
- Batrancea, L.M.; Pop, C.M.; Rathnaswamy, M.M.; Batrancea, I.; Rus, M.I. An Empirical Investigation on the Transition Process toward a Green Economy. Sustainability 2021, 13, 13151. [Google Scholar] [CrossRef]
- Ellen Macarthur Foundation. Circular Economy. Available online: https://ellenmacarthurfoundation.org (accessed on 1 October 2023).
- Boonman, H.; Verstraten, P.; van der Weijde, A.H. Macroeconomic and Environmental Impacts of Circular Economy Innovation Policy. Sustain. Prod. Consum. 2023, 35, 216–228. [Google Scholar] [CrossRef]
- Kirchherr, J.; Yang, N.H.N.; Schulze-Spüntrup, F.; Heerink, M.J.; Hartley, K. Conceptualizing the Circular Economy (Revisited): An Analysis of 221 Definitions. Resour. Conserv. Recycl. 2023, 194, 107001. [Google Scholar] [CrossRef]
- European Union Circular Economy. Available online: https://www.europarl.europa.eu/news (accessed on 1 October 2023).
- Wei, T.; Simko, V.; Leby, M.; Xie, Y.; Jin, Y.; Zemla, J.; Freidank, M.; Cai, J.; Protivinsky, T. Corrplot: Visualization of a Correlation Matrix. R Package Version 0.92. 2022. Available online: https://github.com/taiyun/corrplot (accessed on 1 October 2023).
- Santos, A.D.; Castro, H. Housing and Setting Constraints: The Portuguese Evidence. Sustainability 2022, 14, 11720. [Google Scholar] [CrossRef]
- Linting, M.; van der Kooij, A. Nonlinear Principal Components Analysis With CATPCA: A Tutorial. J. Personal. Assess. 2012, 94, 12–25. [Google Scholar] [CrossRef] [PubMed]
- Martínez, F.; Charte, F.; Frías, M.P.; Martínez-Rodríguez, A.M. Strategies for time series forecasting with generalized regression neural networks. Neurocomputing 2022, 491, 509–521. [Google Scholar] [CrossRef]
- Hyndman, R.J.; Khandakar, Y. Automatic Time Series Forecasting: The Forecast Package for R. J. Stat. Softw. 2008, 27, 1–22. [Google Scholar] [CrossRef]
- Eurostat Database. Available online: https://ec.europa.eu/eurostat/data/database (accessed on 1 October 2023).
Disclaimer/Publisher’s Note: The statements, opinions and data contained in all publications are solely those of the individual author(s) and contributor(s) and not of MDPI and/or the editor(s). MDPI and/or the editor(s) disclaim responsibility for any injury to people or property resulting from any ideas, methods, instructions or products referred to in the content. |
© 2024 by the authors. Licensee MDPI, Basel, Switzerland. This article is an open access article distributed under the terms and conditions of the Creative Commons Attribution (CC BY) license (https://creativecommons.org/licenses/by/4.0/).