Article

Profitability Model of Green Hydrogen Production on an Existing Wind Power Plant Location

by
Andrea Dumančić
1,*,
Nela Vlahinić Lenz
1 and
Lahorko Wagmann
2
1
Faculty of Economics and Business, University of Rijeka, 51000 Rijeka, Croatia
2
Croatian Energy Regulatory Agency, 10000 Zagreb, Croatia
*
Author to whom correspondence should be addressed.
Sustainability 2024, 16(4), 1424; https://doi.org/10.3390/su16041424
Submission received: 9 January 2024 / Revised: 30 January 2024 / Accepted: 2 February 2024 / Published: 8 February 2024
(This article belongs to the Special Issue Energy Economy and Sustainable Energy)

Abstract

:
This paper presents a new economic profitability model for a power-to-gas plant producing green hydrogen at the site of an existing wind power plant injected into the gas grid. The model is based on a 42 MW wind power plant, for which an optimal electrolyzer of 10 MW was calculated based on the 2500 equivalent full load hours per year and the projection of electricity prices. The model is calculated on an hourly level for all variables of the 25 years of the model. With the calculated breakeven electricity price of 74.23 EUR/MWh and the price of green hydrogen production of 99.44 EUR/MWh in 2045, the wind power plant would produce 22,410 MWh of green hydrogen from 31% of its total electricity production. Green hydrogen injected into the gas system would reduce the level of CO2 emissions by 4482 tons. However, with the projected prices of natural gas and electricity, the wind power plant would cover only 20% of the income generated by the electricity delivered to the grid by producing green hydrogen. By calculating different scenarios in the model, the authors concluded that the introduction of a premium subsidy model is necessary to accelerate deployment of electrolyzers at the site of an existing wind power plant in order to increase the wind farm profitability.

1. Introduction

A power-to-gas system at the location of an existing wind power plant is one of the promising options for utilizing green hydrogen production technology. Green hydrogen produced at the mentioned location and transported through the natural gas system can contribute to increasing the wind farm profitability and participate in the congestion management of the power grid.
The wind power plant can generate additional income through the power-to-gas system. The power-to-gas process using a polymer electrolytic membrane (PEM) electrolyzer connects the power grid and the gas grid by electrochemically transforming the electricity generated from the wind power plant into green hydrogen, with direct injecting into the gas grid. This process has demonstrated an overall efficiency of over 70%, and the first electrolytically generated hydrogen has been injected into the German gas grid [1]. One of the motivations for this research is related to the specific climate characteristics of Mediterranean countries, making this research potentially beneficial for many such countries. For instance, the wind power plants in Mediterranean countries have around 2500 equivalent full load hours, indicating relatively low utilization. Therefore, it is important to explore the possibilities of green hydrogen production at the location of an existing wind power plant to increase the profitability and utilization of the wind power plant. When the electricity price on the day-ahead market falls below a certain level, and the wind power plant is producing electricity, the hydrogen produced at the time has a higher value compared to when the electricity is delivered to the grid. There is significant economic and energy potential in such situations, which is insufficiently explored both theoretically and empirically. We believe that this research will provide new insights into increasing the utilization of wind power and will contribute to a greater production of green hydrogen in the energy transition.
This research does not consider the production of a certain amount of green hydrogen to replace a specific percentage of natural gas in the gas grid. Instead, it examines the case where competitive green hydrogen is produced at the location of the wind power plant and injected into the gas grid. This would achieve two goals: increasing the value of the wind power plant production and supporting energy transition in the form of hydrogen production and decarbonization of the gas system. To accomplish this, a universal profitability model for green hydrogen production using wind power plant electricity is defined, which can be applied to all countries with similar climatological characteristics, especially wind characteristics. The model is tested using realistically estimated input parameter values and the optimal electrolyzer capacity at the location of an existing wind power plant in the Republic of Croatia.
An economic model is proposed to determine the profitability of green hydrogen production, considering the hourly production of the wind power plant, hourly electricity prices on the day-ahead market, natural gas prices, CO2 emissions over an extended period, as well as capital and operational costs of the power-to-gas technology and gas connection. The uncertainty of future variations in hourly electricity prices and wind power plant production curve is modeled by determining hourly coefficients based on previously realized electricity prices in the day-ahead market at the Croatian Electricity Exchange (CROPEX), as well as the production curve, using a Monte Carlo simulation approach. Accordingly, the aim of this research is to test the hypothesis that green hydrogen production at a wind power plant location increases the overall income of the wind power plant. To achieve this, it is necessary to find the critical breakeven point on the curve of hourly electricity prices to produce electricity or green hydrogen.
Analyzing the green hydrogen production potential for almost every wind power plant location requires historical wind power plant production data, electricity specifics data of the day-ahead market, and the natural gas market for the location where the wind power plant is situated, as well as data on the availability and possibility of connection to the gas grid. A model that encompasses all the elements contributing to the introduction of a power-to-gas system tested on a real wind power plant case, according to the available literature, has not been created to date. The production of the wind power plant cannot be influenced, as it depends on climatic conditions, but the amount of electricity delivered to the power system and the utilization of a portion of low-market-value electricity for green hydrogen production can be controlled, thus increasing wind power plant production revenues.
The paper is structured as follows. Section 2 gives a literature review on theoretical and especially empirical results of the green hydrogen production and its integration into the gas grid. Section 3 explains the model and data used for calculations; Section 4 presents research results as well as sensitivity scenarios, a base case, and a case study. Section 5 discusses the obtained results, and Section 6 provides concluding remarks.

2. Literature Review

The production of green hydrogen and its integration into the gas grid has multiple benefits, as discussed by numerous authors who primarily highlight its contribution to achieving climate and decarbonization goals, particularly through the utilization of gas infrastructure, as well as greater efficiency and profitability of investments in renewable energy sources, especially wind power plants.
Several studies have examined the production of green hydrogen from solar and wind power at potential or existing locations. Analyses of the challenges and opportunities related to green, blue, and gray hydrogen are the basis of different perspectives on the potential hydrogen society [2]. Dinh et al. [3] presented an analysis of dedicated offshore wind power plants for hydrogen production and a hypothetical injection into the Irish gas grid. The authors believe that a minimum capacity of 100 MW is required to achieve economically viable hydrogen production from offshore wind power plants. Grimm et al. [4] and Li et al. [5], using the examples of photoelectrochemical (PEC) and photovoltaic (PV) systems, processed the techno-economic analysis of hydrogen production from solar power plants. They concluded that the photoelectrochemical system is interesting but currently not cost-effective.
Mikovits et al. [6] focused on hydrogen production based on potential wind energy production in Sweden. They stated that 46 kWh of electricity is required to produce 1 kg of hydrogen, and additional electricity for hydrogen production comes solely from wind energy. Bareiß et al. [7] mentioned that if the energy mix from German’s power system in 2017 were used for hydrogen production, 29.5 kg of CO2 would be emitted per kilogram of hydrogen produced. It is necessary to have a surplus of energy from renewable sources for at least 3000 h per year to reduce the amount of emitted CO2 to 3.3 kg of CO2 per kilogram of produced hydrogen to meet climate goals. For comparison, the production of 1 kg of hydrogen from fossil fuels results in 2 kg of CO2 emissions. Renewable electricity surplus can be used to power water electrolyzers producing green hydrogen to be injected into natural gas pipelines, with the dual effect of solving production–consumption mismatches in the electricity network and decarbonizing the natural gas system [8].
Geographical location has a significant impact on the economic and competitive production of green hydrogen. A study by Armijo and Philibert [9] analyzed locations in Chile and Argentina with abundant and affordable renewable sources where dedicated solar and wind power plants could produce green hydrogen at competitive prices through the interaction between the variability of renewable energy sources. Ioannou and Brennan [10] conducted a techno-economic analysis of costs between a grid-connected floating wind power plant and an off-grid floating wind power plant with an integrated electrolyzer. The results of the model applied to a hypothetical wind power plant in Great Britain located 200 km offshore show that neither system is profitable. For the grid-connected wind power plant, there are high grid connection costs, while for the wind power plant with an integrated electrolyzer, even the higher productivity (full load hours) is not sufficient to cover the costs of hydrogen production infrastructure. However, the investment could become sustainable with higher productivity (>60%).
Power-to-gas has become a promising technology in recent years for connecting the power and gas systems. Eveloy and Gebreegziabher [11] present a review of the power-to-gas and power-to-X technologies and European projects dealing with these technologies. A stronger integration between systems is the basis for a more efficient use of existing infrastructure and technology. Installing a power-to-gas system at renewable energy locations enables flexibility and an efficient utilization of the power and gas system. The decentralized injection of hydrogen into the natural gas grid brings the benefits of connecting two energy systems.
The results of the study by Xiong et al. [12] show a 12% reduction in renewable energy production constraints due to grid congestion using a power-to-gas system. The main application of a power-to-gas system is to inject hydrogen into the natural gas grid for renewable energy storage or fossil fuel replacement. A study by Gorre et al. [13] included the direct connection of the power-to-gas system with a renewable energy source and the occasional delivery of surplus (ancillary services to the power system) produced electricity to the grid.
To reduce CO2 emissions and decarbonize the energy system, it is necessary to integrate appropriate capacities of renewable energy sources into the power systems. Numerous studies support this idea, analyzing the maximization of variable renewable energy production such as wind and solar in the operation of power systems. The increasing operating costs for the procurement of ancillary services and congestion management in the grid to maximize the integration of renewable energy sources are the price that needs to be paid to achieve the European Union’s goals. However, there are many situations in which maximizing renewable energy production can lead to a simultaneous increase in costs and CO2 emissions. This can occur due to a frequent redispatching of generation units and congestion management in the grid, power ramping requirements, minimum operating time, or other security constraints [14].
In terms of sustainability and environmental impact, the PEM electrolyzer is the most promising technology for hydrogen production from renewable energy sources, as it only emits oxygen as a by-product without CO2 emissions. Flexible hydrogen electrolyzers can stabilize renewable market values; additional low-cost renewable supply depresses electricity prices, leading to below-average market revenues [15]. Kumar and Himabindu [16] studied and summarized different methods of hydrogen production from renewable energy sources, including the development of electrolyzer efficiency, durability, and cost-effectiveness. The PEM electrolyzer has achieved remarkable results in analyzing the processes of different hydrogen production technologies. It enables faster start-up, greater flexibility, and can operate with intermittent power sources such as renewable sources, achieving an efficiency of up to 85% [17]. Hydrogen production by water electrolysis using a PEM electrolyzer is a promising technology for reducing CO2 emissions if the electrolysis system operates solely on electricity produced from renewable energy sources. The choice of energy source has a significant impact on the results and production costs of hydrogen [7]. It is necessary to analyze all the factors affecting the production price of green hydrogen and make a case study for each of the factors in order to calculate the lowest possible price of green hydrogen [18].
Chandrasekar et al. [1] examined low- and high-temperature electrolyzers and their impact on hydrogen production. The study concluded that the operating temperature of the electrolyzer and the nature of the input electricity have a significant influence on maximizing hydrogen production. The modeling results showed that the PEM electrolyzer is more suitable for a variable renewable electricity source, while a Solid Oxide Electrolysis Cell (SOEC) has a higher efficiency when the plant operates continuously. The large capacity of the electrolyzer supporting the wind power plant operation makes the system more stable, especially during hours of reduced electricity demand and favorable wind conditions [6]. Gorre et al. [13] conducted an analysis of hydrogen production for three different electrolyzer sizes, assuming continuous plant operation for 8760 h with the average day-ahead market electricity price. Electricity for the electrolyzer operation is secured by purchase through short-term market purchases, long-term contracts, direct connections to renewable energy sources, or occasional surplus delivery.
A large volume of the literature also includes the possibility of injecting green hydrogen into the gas grid [19,20,21,22,23]. Hydrogen injection into the gas grid enables the transmission system operator to manage congestions by utilizing the flexibility of energy storage, thereby deferring the necessary investments in the transmission network. This allows for greater integration of renewable sources. Hydrogen produced at renewable energy location can be used for mobility, as well as electricity generation and injection into the natural gas grid [19]. Blending green hydrogen produced from electricity generated from wind power plants into the gas grid is possible with control so that the proportion of hydrogen does not exceed the technical limit [23]. The intertwining of the energy infrastructure through a conversion technology provides the short-term flexibility for the future energy system [24].
In a previous study by the authors [25], centralized hydrogen production in a gas-fired power plant with necessary infrastructure was analyzed, resulting in minimal investment. Centralized hydrogen production allows for a larger electrolyzer capacity and a higher amount of produced hydrogen, thereby having a significant impact on replacing natural gas in the gas grid and reducing CO2 emissions. However, hydrogen is produced from electricity taken from the power grid, and it is not categorized as renewable or green hydrogen. It is necessary to analyze the source of green electricity in order to determine the optimal technology and electrolyzer size and to achieve the lowest hydrogen price [26]. The economic objective aims to determine the minimum cost, which is composed of the capital costs in the acquisition of units, operating costs of such units, and costs of the production and transmission of energy [27].
This paper presents an economic profitability model based on scientific assumptions and principles, aimed at finding the optimal solution for achieving climate and decarbonization goals by testing renewable energy source locations as potential decentralized green hydrogen production sites.
In the above-mentioned studies, the authors did not come across a model in which the electrolyzer capacity was calculated based on the hourly production of the wind power plant. Instead, the electrolyzer capacity was predetermined or the hourly wind power plant production was predefined rather than estimated based on the actual hourly production of an existing wind power plant.

3. Description of the Model

Installing a power-to-gas system at the wind power plant location opens the possibility for using produced electricity for green hydrogen production. The green hydrogen is then integrated into the gas grid via the injection station as a substitute for natural gas, thereby additionally influencing the acceleration of the energy transition. This method of production is attractive in the case of low electricity prices on the day-ahead market, but also in cases of congestion in the network when the production of the wind power plant should be limited. Therefore, green hydrogen is produced when electricity prices are low and when there is a need for production flexibility services.
The economic profitability model presented in this paper is designed in such a way that with the historical data of the wind power plant and data from the day-ahead market, it calculates how much of the future share of electricity production can be allocated to the power-to-gas system, without affecting the economy of operating the wind power plant. The results of the model provide answers to three key questions:
  • Is green hydrogen produced from surplus electricity from renewable sources or this surplus does not exist (surplus is manifested through low/negative electricity prices on the day-ahead market)?
  • Can the green hydrogen production at the wind power plant location increase the income from the production of the wind power plant?
  • Is it possible to produce a sufficient amount of green hydrogen that will replace a significant percentage of natural gas in the gas system and, thereby, affect the reduction of CO2 emissions?
The model shows the concept of connecting the source of electricity with the gas system, so that mutually integrated systems depending on the electricity price and the optimization of the electrolyzer size, and the marginal price of electricity affect the green hydrogen production and the profitability of the production of the wind power plant.

3.1. Input Data for the Model

This paper presents an hourly price and electricity production breakdown based on which the electrolyzer size and the marginal price of electricity are calculated to align electricity and green hydrogen production. The horizon of the presented model is set to a period of 25 years (corresponding to the lifetime of the energy plant), and several key input variables (market price of electricity, natural gas, and emission units) subject to uncertainty are presented in sensitivity analysis scenarios.
Given that power-to-gas systems consist of several separate parts, the cost estimate and gas grid connection, i.e., the capital (CAPEX) and operating costs (OPEX) of the whole investment, are shown in Table 1.
The total investment cost at the wind power plant site consists of the capital costs of the power-to-gas system and gas infrastructure construction, annual fixed and variable operating costs, and the annual cost of chemical water treatment. The total capital cost of the power-to-gas system and the construction of the gas infrastructure is calculated at the level of the entire life of the plant, i.e., the period of the model, while the rest of the costs are measured on an annual basis. Fixed plant operating costs represent costs that do not depend on system output, while variable costs include costs that vary depending on the system’s output.
For the individual CAPEX values used in the model according to the literature, they are adjusted for the specific location. Specifically, the CAPEX for the power-to-gas system is 1700.00 EUR/kW. However, in this case, it is additionally increased by the amount of gas grid connection as part of the overall investment. It should be considered that installing a power-to-gas system in a different location has different costs that make up CAPEX. For the investment case presented in this paper, CAPEX consists of parts of the power-to-gas system and the gas grid connection, i.e., the measuring-reduction station, which is also a hydrogen-injection station. OPEX is the market value of the produced electricity that was used for the green hydrogen production.
The model uses a PEM electrolyzer with a perfectly flexible behavior, i.e., in real time, it follows the variable supply of electricity and maintains a constant efficiency of 74%. The efficiency of the electrolyzer is taken from Fu et al. [29] who applied an efficiency of 74%, which is in line with the achievements and progress of water electrolysis technologies [29]. It is assumed that large-scale PEM electrolyzer cost reductions should occur soon, so an amount that supports such a prediction is taken for this study. In terms of flexibility, the PEM electrolyzer technology has the most favorable characteristics and is, therefore, the most suitable for solving variable electricity inputs [12]. The total installed capacity of the electrolyzer must meet the high efficiency of green hydrogen production, that is, it must work at full capacity during the model’s predicted period.
Prices of electricity, natural gas, and CO2 emissions were estimated on the European Ten-Year Electricity and Gas grid Development Plan (TYNDP 2022), according to the basic scenario of the European Network of Transmission System Operators, ENTSO-E, and the European Network of Transmission System Operators for Gas, ENTSOG [32]. Table 2 shows estimated prices of electricity, natural gas, and CO2 emissions, which were used in the model. Certain years were chosen to display prices, although the hourly electricity prices and annual prices of natural gas and CO2 emissions were used in the model.
The forecast hourly electricity prices reflect the coefficients of the ratio of realized annual and hourly electricity prices on the day-ahead market for the historical five years, from 2018 to 2022, taken from the day-ahead market at CROPEX. The predicted hourly electricity production data were recalculated from the 15 min readings of the Zelengrad wind power plant production for the historical six years, from 2017 to 2022, taken from the report of the Croatian Energy Regulatory Agency [33].
Additionally, an assessment of the value of the power-to-gas system, together with the gas connection, were performed as the overall investment required for green hydrogen production at the wind power plant location. Since the model includes hourly input variable data for all 25 years, all parts of the model are complex and require a significant amount of data and formulas. In this study, a PEM electrolyzer was chosen for hydrogen production using water electrolysis. To calculate the size of the required electrolyzer, the selected operating hours of the wind power plant were optimized to maximize its utilization. The electrolyzer cannot be of the same size as the wind power plant, given that it does not operate at full capacity throughout the year. Therefore, the capacity of the electrolyzer is optimized to avoid excessive investment that would increase the hydrogen production price.
The application of Monte Carlo simulation to energy prices enables uncertainty modeling in such a way that the input variables are predicted through continuous probability density functions, which leads to a more realistic representation of the uncertainty of future price movements, based on collected historical data [34]. In addition to the predicted hourly electricity prices, Monte Carlo simulation was also used for electricity production so that the distribution of historical years was more realistically displayed for the entire model period. When predicting electricity prices, each of the five historical years is allocated to model years in a given ratio, while when predicting electricity production, there is no such limitation. To overlook the price of electricity in the Monte Carlo simulation, a limit of 10% was taken for the year 2020 as a specific pandemic year that is considered less likely to recur, while other historical years had an equal proportion of recurrences. The year 2020, with such a restriction, was repeated twice within the 25-year period of the model.
When calculating the coefficients for forecasting electricity prices, a period of five years of realized electricity prices at the hourly level on the day-ahead market was taken, precisely for the sake of the visibility of electricity price oscillations. In this way, the ratio of higher and lower hourly electricity prices can be seen, that is, the influence of climate conditions or other specificities of the covered historical years. By displaying the hourly production of electricity, it is possible to see in which hours of the year the wind power plant produced at maximum installed capacity, reduced capacity, or did not produce.
The hourly display of the expected market price of electricity and the expected production of electricity for a period of 25 years is important when determining the marginal price of electricity. Within the annual hourly realizations of wind power plant production and hourly realizations of electricity prices, it is necessary to determine the breakeven price of electricity based on which green hydrogen or electricity will be produced. The marginal price of electricity is optimized for each model year. It represents the limit above which the wind power plant delivers the generated electricity to the power grid, and below which green hydrogen is produced from the generated electricity in the electrolyzer. Therefore, the hours of the year when the price of electricity is favorable are determined, at the same time considering the hours in which the production of electricity is high, thus optimizing the marginal price of electricity.
The size of the electrolyzer is determined according to the hourly electricity production of the wind power plant and the market price of electricity during those hours. First, the marginal price of electricity, below which hydrogen is produced and above which the wind power plant delivers the generated electricity to the power grid, was determined. The size of the electrolyzer is based on a certain optimized annual marginal value of production in such a way as to consider the total production of electricity below the level of the marginal price of electricity for 25 years. After that, the hourly production of the wind power plant was analyzed in the hours when the price of electricity was below the marginal price, and according to these hours of production, the optimal size of the electrolyzer was calculated using the Excel solver. With this optimal size of electrolyzer, the lowest production price of hydrogen was obtained. This was performed for each individual year of the model, and based on the results for each of 25 years, the size of the electrolyzer was determined, which was closest to the result for each year. According to the realized hourly production of the wind power plant and the expected hourly prices of electricity on the day-ahead market, the optimal size of the electrolyzer was calculated, which increased the economic value of the production of the wind power plant. Therefore, for choosing the size of the electrolyzer, it is important to predict the prices and production of electricity, i.e., the marginal price of electricity.
Part or all the electricity production when the price of electricity on the day-ahead market is lower than the marginal price of electricity was used for the green hydrogen production. The price of green hydrogen consists of the market value of electricity used for the production of green hydrogen, i.e., the variable part of the cost and fixed costs, taking into account the efficiency of the electrolyzer. Finally, the production price of green hydrogen was calculated as follows:
G H P P t E U R M W h = V H P t E U R M W h + F H P t [ E U R M W h ]
where
  • GHPPt: Green hydrogen production price in year t [EUR/MWh];
  • VHPt: Variable cost of hydrogen production in year t [EUR/MWh];
  • FHPt: Fixed cost of hydrogen production in year t [EUR/MWh].
Production price of green hydrogen is an annual sum of variable and fixed hydrogen production costs divided by annual hydrogen production for year t.
The component FHPt is the capital expenditures of hydrogen production and is calculated as follows:
F H P t E U R M W h = I C t E U R + G P C C t [ E U R ] 25 H P t [ M W h ]
where
  • FHPt: Fixed cost of hydrogen production in year t [EUR/MWh];
  • ICt: Investment cost in year t [EUR];
  • GPCCt: Cost of connection to the gas pipeline in year t [EUR];
  • HPt: Annual hydrogen production in year t [MWh].
The fixed cost of hydrogen production is a sum of investment cost and the cost of connection to the gas pipeline on an annual basis divided by the hydrogen production in year t.
The component VHPt is the operating expense of hydrogen production and is calculated as follows:
V H P t E U R M W h = 0 8760 E H P t M W h H E P E M t E U R M W h + M T C t E U R + W O C t [ E U R ] H P t [ M W h ]
where
  • VHPt: Variable cost of hydrogen production in year t [EUR/MWh];
  • EHPt: Electricity consumed for hydrogen production in year t [MWh];
  • HEPEMt: Hourly expected price of electricity on the market in year t [EUR/MWh];
  • MTCt: Maintenance cost in year t [EUR];
  • WOCt: Cost of water in year t [EUR];
  • HPt: Annual hydrogen production in year t [MWh].
The variable cost of hydrogen production is a sum of electricity consumed for hydrogen production, hourly expected price of electricity on the market, maintenance cost, and cost of water divided by the hydrogen production in year t.
To be able to calculate the profitability of the production of green hydrogen, it is necessary to calculate the income from the produced amount of green hydrogen, which is calculated according to the price of natural gas. The income from the produced amount of green hydrogen is calculated as follows:
I G H P t E U R = P N G t E U R M W h H P t M W h + 0.20196 P C O 2 t E U R / t H P t M W h
where
  • IGHPt: Income from produced green hydrogen in year t [EUR];
  • PNGt: Price of natural gas in year t [EUR/MWh];
  • PCO2t: Price of CO2 emissions in year t [EUR/t];
  • HPt: Hydrogen production in year t [MWh].
The income from produced green hydrogen is calculated with the price of natural gas that is multiplied by hydrogen production, after which the CO2 emissions cost’s equivalent is added. The amount of 0.20196 is multiplied by the price of CO2 emissions per ton and by the hydrogen production because green hydrogen can be sold at the natural gas price increased by the price of CO2 emissions and still be competitive to natural gas.
The market value of electricity used to produce green hydrogen is calculated as follows:
M E H P t E U R = 0 8760 H E P E M t E U R M W h E H P t [ M W h ]
where
  • MEHPt: Market value of electricity used for hydrogen production in year t [EUR];
  • HEPEMt: Hourly expected price of electricity on the market in year t [EUR/MWh];
  • EHPt: Electricity consumed for hydrogen production in year t [MWh].
The market value of electricity used for hydrogen production is the product of the hourly expected price of electricity on the market and electricity consumed for hydrogen production. The amount of the required premium subsidy for green hydrogen production is calculated as follows:
S t = M E H P t E U R I G H P t E U R H P t M W h
where
  • St: Required premium subsidy in year t [EUR/MWh];
  • MEHPt: Market value of electricity used for hydrogen production in year t [EUR];
  • IGHPt: Income from produced green hydrogen in year t [EUR];
  • HPt: Hydrogen production in year t [MWh].
The required subsidy is calculated as the difference between the market value of electricity used for hydrogen production and the income from the produced green hydrogen divided by the hydrogen production. If the income from the produced green hydrogen is greater than the market value of electricity used for hydrogen production, no premium subsidy is required.
The market value of electricity delivered to the grid is calculated as follows:
M V D G t E U R = 0 8760 H E P E M t E U R M W h E P G t [ M W h ]
where
  • MVDGt: Market value of electricity delivered to the grid in year t [EUR];
  • HEPEMt: Hourly expected price of electricity on the market in year t [EUR/MWh];
  • EPGt: Electricity delivered to the grid in year t [MWh].
The market value of electricity delivered to the grid is the product of the hourly expected price of electricity on the market and electricity delivered to the grid.
The levelized cost of hydrogen (LCOH) is a widely accepted standard for assessing and comparing energy technologies [35]. LCOH is a sum of total CAPEX and OPEX divided by the amount of produced hydrogen. LCOH was calculated for the basic scenario as well as for all sensitivity scenarios. The formula for levelized cost of hydrogen is as follows:
L C O H [ E U R M W h ] = t = 1 n F H P t E U R M W h + V H P t E U R M W h ( 1 + d ) t t = 1 n H P t [ M W h ] ( 1 + d ) t
where
  • LCOH: The levelized cost of hydrogen [EUR/MWh];
  • n: Lifetime of power-to-gas system;
  • FHPt: Fixed cost of hydrogen production in year t [EUR/MWh];
  • VHPt: Variable cost of hydrogen production in year t [EUR/MWh];
  • HPt: Annual hydrogen production in year t [MWh];
  • d: Discount factor [%].
The rate of the discount factor was adopted from the authors Jovan and Dolanc [36], who used a discount factor of 5%, which we consider applicable in our scenarios as well. The fixed cost of hydrogen production was calculated as the sum of fixed costs, which represent costs that do not depend on system output and include costs of power-to-gas system, gas grid connection costs, and hydrogen injection station costs. The variable cost of hydrogen production was calculated using costs that vary depending on the system’s output, such as the market value of the produced electricity that was used for the green hydrogen production, electrolyzer maintenance costs, and water costs.

3.2. Structure of the Model

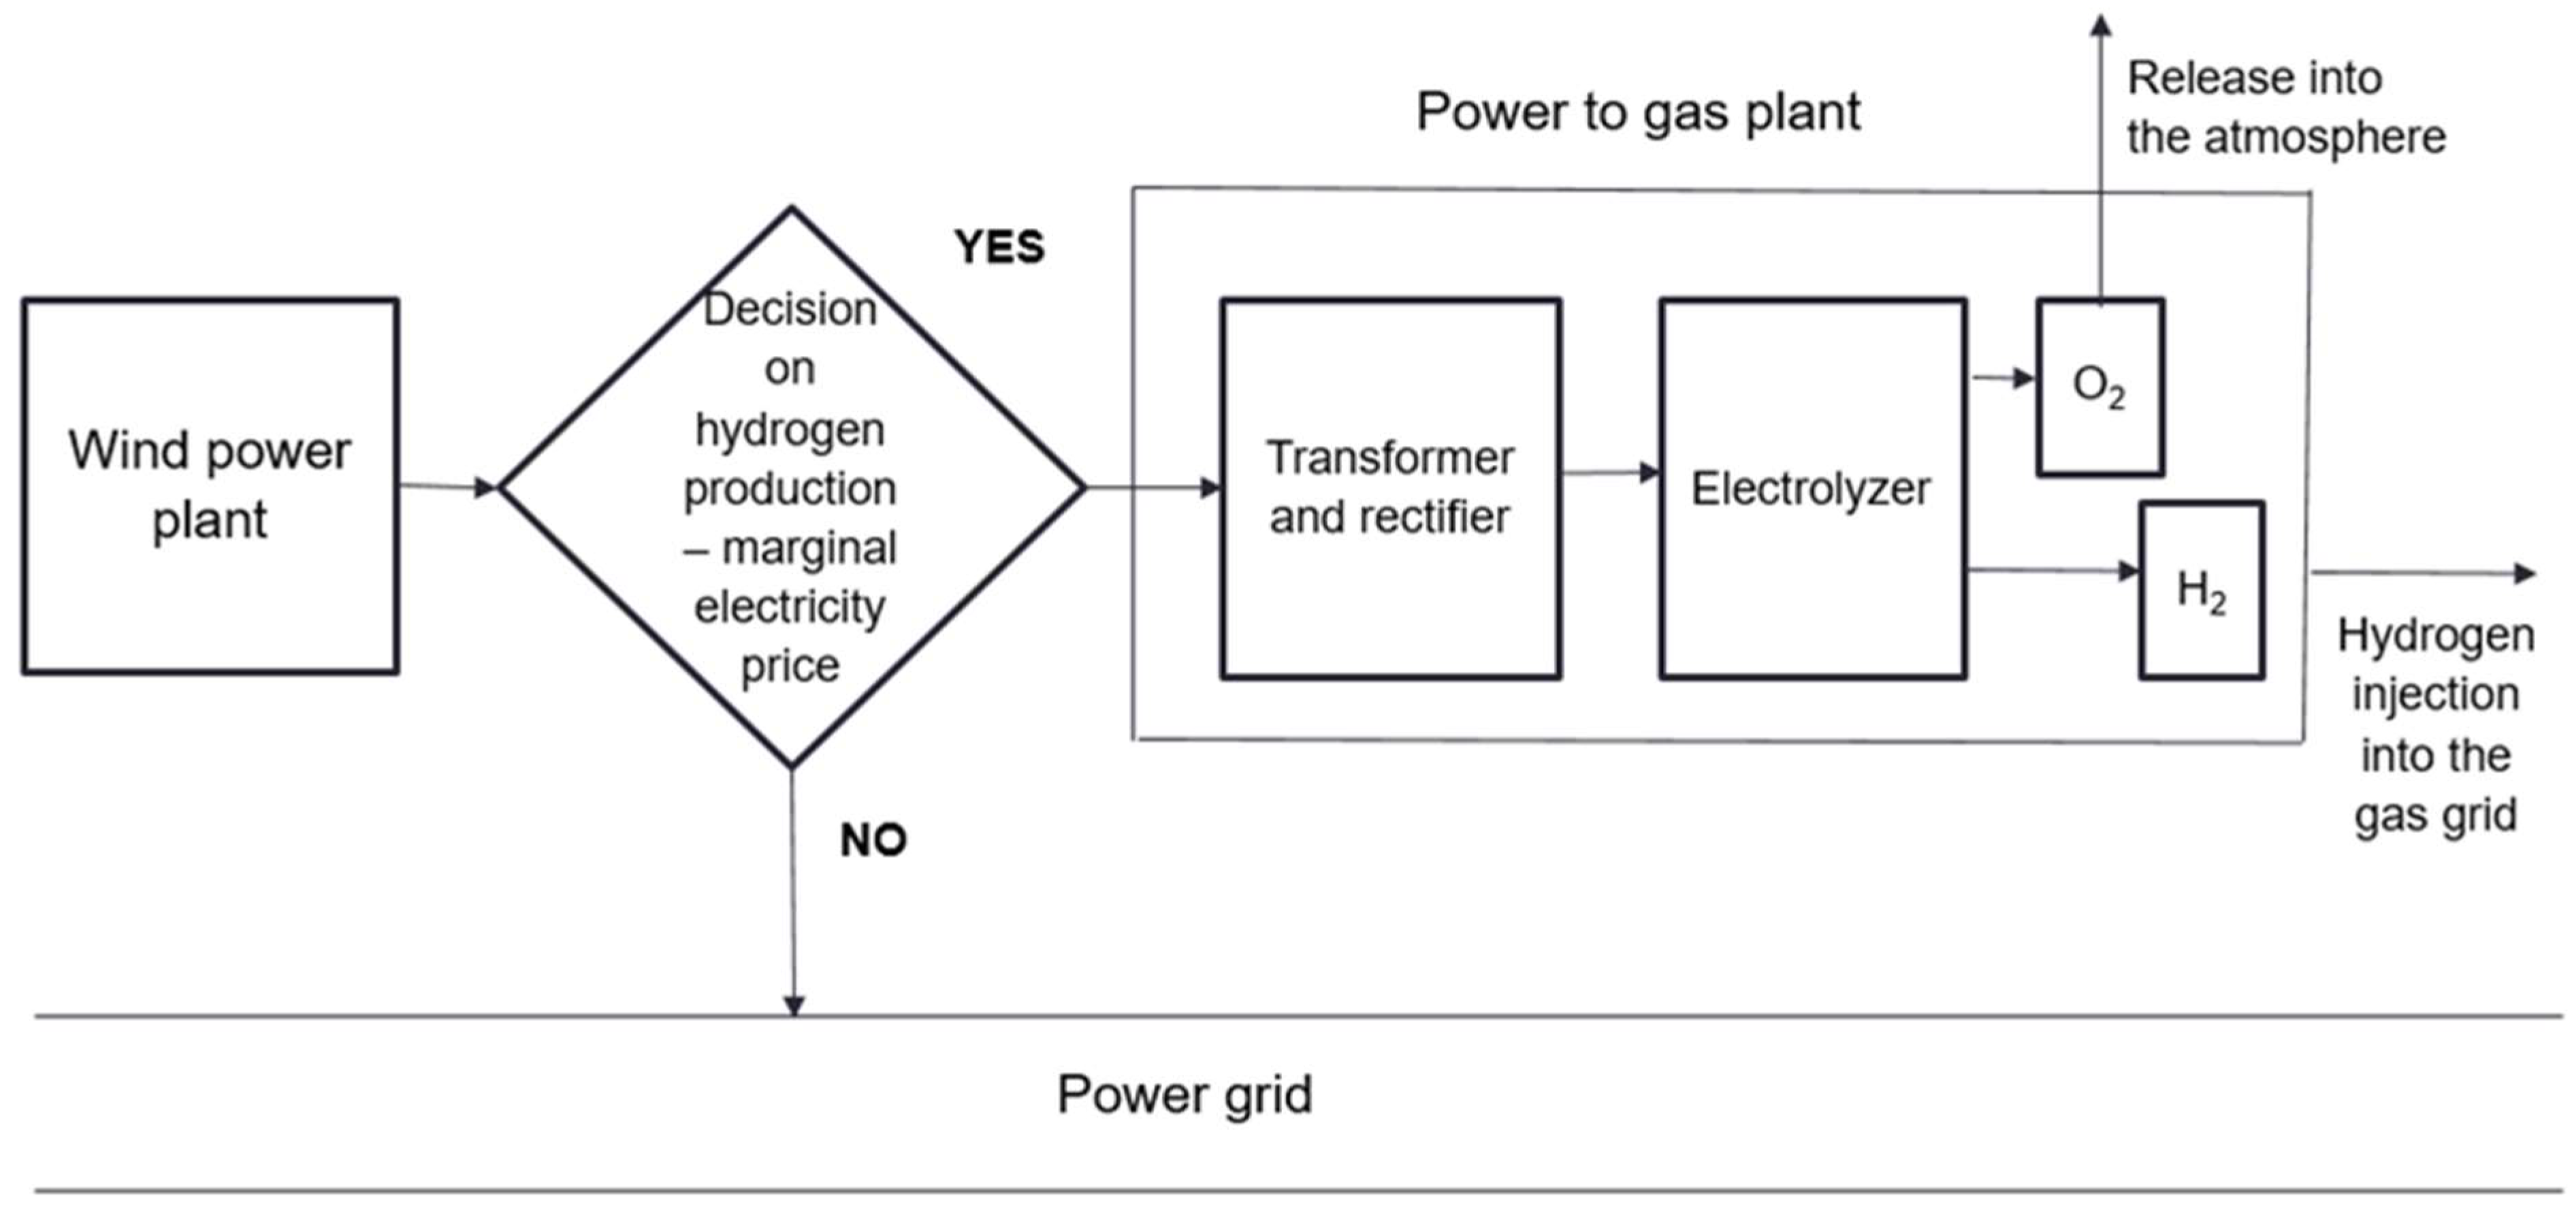
The structure of the economic model shown in Figure 1 illustrates the way in which the proposed model works.
Depending on the production of the wind power plant and the market price of electricity, the marginal price of electricity is determined, which, along with the type and capacity of the newly installed power-to-gas system, is a decision variable in green hydrogen production. With a positive decision, the green hydrogen production technology is implemented in the power-to-gas system via a PEM electrolyzer that separates water molecules into hydrogen and oxygen. Oxygen is released into the atmosphere while green hydrogen is injected into the gas grid. With a negative decision, green hydrogen is not produced, but the produced electricity from the wind power plant is transferred to the power grid.
Based on data on existing wind power plants in the Republic of Croatia, location, year of construction, installed capacity, and production curve, the Zelengrad wind power plant was selected; its data were used as input parameters of the model, and the model results were applied to it. The input parameters of the price and production of electricity are based on historical data, but their predictions of future trends are an uncertain part of this model. The inclusion of this uncertainty through the change of input variables in the scenario sensitivity analysis results in the basis needed for making an investment decision or providing incentives for investing in green hydrogen production technology at the wind power plant location.
The authors are aware of the following limitations of the model:
  • Predicted price movements of electricity, natural gas, and CO2 emissions;
  • Predicted trends in electricity production;
  • Determination of low electricity prices, i.e., marginal price of electricity;
  • Optimum electrolyzer size to achieve high efficiency;
  • Accessibility or distance of the gas grid to the renewable energy source.
The output variables of the model are the annual cost of the production price of green hydrogen, the annual consumption of electricity for the green hydrogen production, the capacity of the electrolyzer, the capital and operational cost of the investment, the cost of the chemical preparation of water, and the amount of produced green hydrogen. Based on the amount of produced hydrogen that is injected into the gas grid, the amount of CO2 emissions is also calculated, which is, thereby, reduced.

3.3. Assumptions of the Model

The assumption of the model is the use of power-to-gas technology. When the green hydrogen produced by the electrolysis of water in the power-to-gas system is mixed into the gas grid, it provides a potential solution for storing and transporting a larger amount of energy, achieving the decarbonization of the gas system, and reducing dependence on natural gas. Since the technology of producing and injecting green hydrogen into the gas grid requires considerable investment, it is important to look at the cost effectiveness and justification of the whole investment.
As the aim of this study was to assess the possibility of green hydrogen production at an existing wind power plant location, assumptions were made so that the technical and economic components of the model would contribute to the quality of the results. Below are the model assumptions:
  • The electricity production curve refers to an existing onshore wind power plant, which was selected for its size, location, and historical production data. The capacity of the wind power plant remains constant throughout the model period, and the investment in the wind power plant is amortized;
  • The volatility of the price of electricity at the hourly level for the entire model period is integrated based on five selected historical years of realized electricity prices, which are applied to the future observed period of the model through Monte Carlo simulation with the coefficients of realized prices;
  • The lifetime of the wind power plant is equal to the lifetime of the power-to-gas system, which corresponds to the total period of the developed model;
  • The production of electricity from the wind power plant as well as the green hydrogen production from the power-to-gas system have a zero rate of CO2 emissions;
  • The price of produced green hydrogen from the power-to-gas system is calculated in such a way that the market value of the produced electricity used for the green hydrogen production is increased by the efficiency of the electrolyzer and capital costs;
  • The electrolyzer at the wind power plant location will not meet a certain amount of green hydrogen that would replace a certain percentage of natural gas in the grid, but according to the day-ahead market conditions of electricity, it produces green hydrogen when it is profitable. The gas system can accept the produced green hydrogen at any time.
A summary of the basic assumptions for creating an economic model related to the capacity of the wind power plant, the lifetime and depreciation of the power-to-gas system, and the efficiency of the PEM electrolyzer are shown in Table 3.
The model considers all the costs of the power-to-gas system connected to the gas grid for the specific example of the Zelengrad wind power plant located in the southern part of Croatia.

3.4. Site Description

The location of green hydrogen production at the site of an existing wind power plant was chosen for several reasons. The repurposing or expansion of the existing energy infrastructure affects the achievement of part of the goals of the energy transition by reducing the investment intensity and increasing the additional value of the existing gas and electricity infrastructure. The authors believe that the location of the wind power plant with historical electricity production, lower initial investment costs, and the availability of gas infrastructure, in order to increase financial profitability, meet all the conditions for examining the profitability of green hydrogen production. Also, an important part of this analysis is that this model can be applied to other existing wind power plants in the region or the world where there is a similar situation of proximity to gas infrastructure and a relatively low efficiency of wind power plants.
In this study, data from the electricity and gas markets of the Republic of Croatia were used for the input parameters of the model. The installed power of all power plants connected to the transmission system in the territory of the Republic of Croatia at the end of 2022 was 5031 MW, of which wind power plants made up 885 MW. In 2022, wind power plants connected to the transmission system produced 2.1 TWh of electricity, which was 18.4% of the total electricity produced on the transmission system [33].
The model used data from the wind power plant Zelengrad, which is located within Zadar County, in the town of Obrovac. The electric power of the wind power plant is 42 MW, and it consists of 14 wind turbines V—90 with a power of 3 MW. The Zelengrad wind power plant produced 78,867 MWh in 2022, which is 3.8% of the electricity produced by wind power plants connected to the transmission system. On average, the wind power plant operates between 5500 and 6000 h per year, of which the total annual production is between 75 and 105 GWh of electricity. Converted into equivalent full load hours, the wind power plant operates between 1900 and 2500 h or about 25% per year at full load hours [37].

4. Research Results

The model results do not consider all hydrogen production technologies, but specifically green hydrogen production technology by water electrolysis in a PEM electrolyzer. Furthermore, the model does not include hydrogen storage, but only direct injection into the gas grid. The results provide an overview of the production price and production quantity of green hydrogen calculated using the input variables of electricity price uncertainty, the wind power plant production curve, and capital costs. The probabilities of changes in the input variables within the observed period are calculated separately as a scenario sensitivity analysis by modeling higher and lower initial values of the input variables. Table 4 shows the selected years of the model with the results of the income and amount of green hydrogen, the amount and the market value of electricity needed to produce green hydrogen, and the average price of electricity for hydrogen production. Also shown is the amount and average price of electricity delivered to the grid, income from the sale of electricity and total electricity produced, the amount of reduction in CO2 emissions, as well as the required premium subsidy.
Table 4 presents the results of the model according to the input data of the prices shown in Table 2 and the input data of the production of the Zelengrad wind power plant. The income from produced hydrogen in 2025 is 8.5 times lower than the income from electricity delivered to the grid. For the same total electricity produced in 2030 and 2049, the electricity delivered to the grid is 12% lower in 2049 than in 2030 due to more favorable market conditions for hydrogen production. The amount of green hydrogen produced represents how much natural gas is replaced by hydrogen in the gas grid. If we compare the amount of produced hydrogen and the annual consumption of natural gas in Croatia, it would be much less than 1% of hydrogen to replace the natural gas in the gas grid. Contrary to that, the effect of reducing CO2 emissions by replacing natural gas with green hydrogen in the mentioned amount are from 2700 to 4700 tons per year CO2 emissions. Depending on the prices of electricity, natural gas, and CO2 emissions, the amount of the required subsidy changes. For example, in 2030, the amount of the subsidy is 40.03 EUR/MWh of produced hydrogen, while in 2045, the subsidy is not required because income from green hydrogen is higher than the market value of electricity used for green hydrogen production.

4.1. Base Case

According to the basic scenario, part of the electricity produced from the wind power plant is delivered to the power grid, while part of the electricity is used in the process of water electrolysis for the green hydrogen production. By determining the marginal price of electricity, the level above which electricity is delivered to the power grid, and up to which green hydrogen is produced, is set. The marginal price of electricity is calculated separately for each year, considering that the prices and production of electricity are different every year. By increasing the marginal price of electricity, the share of fixed costs of hydrogen production decreases, while the share of variable costs increases in the price of produced hydrogen. The optimal marginal price of electricity gives the lowest possible price of produced green hydrogen, taking into account the electrolyzer size. The subject of optimization of the proposed model is shown in Table 5.
The optimal capacity of the electrolyzer for the green hydrogen production is determined according to the market hourly electricity prices and the wind power plant production curve. After the electrolyzer sizes are determined for each individual model year, one optimal electrolyzer size is calculated for the entire model period. Table 6 shows the fixed and variable amounts of green hydrogen production costs, as well as the production price of green hydrogen.
Table 6 shows the ratio between fixed and variable costs throughout the model period and the total production price of green hydrogen. Fixed costs are affected by the amount of green hydrogen produced, while the forecast movement of electricity prices on the market and the marginal price of electricity affects variable costs. The share of fixed costs in the production price of green hydrogen is 28%. The higher the price, the lower the percentage, and vice versa.
Figure 2 shows data on the produced amount of green hydrogen from Table 1 and the fixed costs of green hydrogen production from Table 5 to see their ratio.
Figure 2 shows the correlation between the fixed costs of production and the amount of green hydrogen, that is, with an increase in the production of green hydrogen, the fixed costs fall. However, the price of green hydrogen is not only affected by fixed costs, but also by variable costs that increase as fixed costs decrease. Therefore, at the optimal marginal price of electricity, the lowest possible production price of green hydrogen is achieved. Figure 3 shows a comparison of the price of produced green hydrogen and the price of natural gas increased by the price of CO2 emissions.
It should be noted that burning 1 MWh of natural gas (NCV) emits 201.96 kg of CO2. Therefore, the amount of 0.20196 is multiplied by the price of CO2 emissions per ton, which are added to the price of natural gas, as calculated in the model. Figure 3 shows that with the current input variables of the model and with the lowest possible price of green hydrogen, it is only competitive 3 out of the 25 years of the model with the price of natural gas increased by the price of CO2 emissions. In this way, the price of natural gas can be compared to the price of green hydrogen, considering that it does not emit CO2 during production.
The following figure shows a comparison of the income of produced green hydrogen and the market value of the electricity required for its production.
Figure 4 shows that the income from produced green hydrogen in most of the years is lower than the market value of the electricity used for the green hydrogen production. The rising price of CO2 emission allows for the income from the produced green hydrogen to overtake the market value of electricity used for green hydrogen production in three later years of the model: 2041, 2045, and 2048. The reason for this is the ratio of the price of electricity to the price of natural gas increased by the price of CO2 emissions, since the income from the produced green hydrogen is calculated according to Formula (4).
Figure 5 shows a comparison of the income of the wind power plant in the situation when green hydrogen is produced and when green hydrogen is not produced.
Figure 5 shows that with the construction of the power-to-gas system, the income of the wind power plant does not increase but decreases in most of the analyzed years. According to the projected prices for electricity, natural gas, and CO2 emissions used in the model, building a power-to-gas facility at the wind power plant site is not financially viable, that is, subsidies are needed for this type of investment.

4.2. Sensitivity Analysis

This chapter is dedicated to gaining a deeper insight into how the model works by testing changes in the prices of the input variables, namely, the price of electricity, natural gas, and CO2 emissions. Therefore, the values were set to a 20% lower predicted hourly price of electricity, 20% higher predicted price of natural gas and CO2 emissions, and 20% lower predicted electricity prices and simultaneous 20% higher predicted natural gas prices and CO2 emissions.
The levelized costs of hydrogen calculated for all scenarios are presented in Table 7.
Table 7 shows that the basic scenario and the scenario where natural gas and CO2 emission prices are 20% higher have the same result, since natural gas and CO2 emission prices do not affect the levelized cost of hydrogen. For the same reason, the scenario where the electricity price is 20% lower and the scenario where the natural gas and CO2 emission prices are 20% higher while electricity price is 20% lower have the same levelized costs of hydrogen.
The above results were derived under the assumption that the Monte Carlo simulation of the historical years of realized electricity prices, as well as the historical years of the wind power plant production curve, follows a normal distribution. The advantage of using Monte Carlo simulation lies in the fact that it allows for assigning a continuous distribution to the selected period of the model based on historical years of wind power plant production, but it also enables the distribution of the historical years of realized electricity prices according to the degree of probability of recurrence, for example a pandemic.
It should be noted that one of the key calculations for the input parameters of the model is precisely the combination of coefficients and Monte Carlo simulation so that each hour of each year of the observed period reflects an exact year and production, and not the average of them. On average, in historical years, major oscillations between electricity prices and production curves would not be visible, which is important when presenting predictions that are more realistic and model results.

4.3. Scenarios—Case Study

Considering the presented results of the model, which, according to the predicted prices of electricity, natural gas, and CO2 emissions, make the green hydrogen production at the tested location unprofitable, an analysis of the sensitivity to changes in the input variables of the model was made. Three price-change scenarios were created: a scenario of a 20% lower electricity price change, and then a scenario of a change in the price of natural gas and CO2 emissions to 20% more and the scenario where both price changes were made.
Figure 6 presents influence of a 20% lower predicted electricity price on income from produced green hydrogen.
A new optimization was made, and new marginal electricity prices were calculated for the entire model period. Although there is an increase in the amount of green hydrogen produced, even with the lower price of electricity on the day-ahead market, the production of green hydrogen is still unprofitable for the tested location for most of the years of model. In nine years of the model, specifically 2032, 2034, 2035, 2041, 2043, 2045, 2046, 2047, and 2048, the ratio between the natural gas price increased by CO2 emissions and the electricity price on an hourly basis was such that it was profitable to produce green hydrogen. Therefore, the subsidy is not required in the mentioned years of the model.
Figure 7 presents influence of a 20% higher predicted natural gas prices and CO2 emissions on income from produced green hydrogen.
From Figure 7, it can be concluded that the income from green hydrogen is higher because the price of natural gas increased by the price of CO2 emissions is higher. Green hydrogen is still more expensive in most of the years of the model than natural gas increased by the price of CO2 emissions, but the difference in nine years of the model is positive than in the base case without changes in natural gas and CO2 emissions prices. In those nine years, specifically, 2032, 2034, 2035, 2041, 2043, 2045, 2046, 2047, and 2048, no subsidy is needed because the income from green hydrogen is higher than the market value of the electricity required for green hydrogen production.
Figure 8 presents influence of a 20% lower predicted price of electricity and 20% higher predicted price of natural gas and CO2 emissions on income from produced green hydrogen.
New marginal electricity prices for all model years were calculated, and the amounts of green hydrogen produced were higher than the base case. In this case, in most years of the model, income from produced green hydrogen is higher than the market value of the electricity required for green hydrogen production. Only in six years of the model, specifically, 2026, 2027, 2029, 2030, 2031, and 2036, is the market value of the electricity required for green hydrogen production higher than the income of produced green hydrogen. So, it is financially justified to invest in a power-to-gas facility at the wind power plant site without subsidies. With the expected increase in the share of renewable energy sources in the future, the ratio between the price of natural gas increased by the price of CO2 emissions and electricity prices will gradually allow for the replacement of natural gas with green hydrogen.

5. Discussion

This paper presents a methodology developed, which can be applied at any location of an existing wind power plant in the world, provided reliable and realistic economic data of wind power plant production and electricity market prices are available, for calculating the costs of green hydrogen production and its integration into the gas grid. The results are primarily relevant for Mediterranean countries with similar climatological characteristics, especially wind specificities.
The study took into account how the variability of electricity production at the wind power plant location can modify the overall structure of the costs of the operation of the wind power plant and the production of green hydrogen. Therefore, special attention was paid to determining the marginal price of electricity that divides the production of electricity into the part that goes to the production of green hydrogen and the part that is delivered directly to the power grid. It is the marginal price of electricity that is important from the aspect of increasing the profitability of wind power plant production, since the calculation of the optimal marginal price of electricity results in the lowest possible production price of green hydrogen. In addition to the marginal cost of electricity, the size of the electrolyzer is also important. Based on the historical data of wind power plant production and realized market prices of electricity, the optimal electrolyzer size for the selected location is determined. It is important that there is no additional investment in an electrolyzer that would not be fully utilized. The utilization of the electrolyzer in a particular year has a great influence on the amounts of fixed costs that affect the production price of green hydrogen.
For example, in dedicated locations that have ideal conditions of wind or sun, it is possible to produce green hydrogen at a price almost competitive with alternatives to fossil fuels [9]. However, the question this paper answers is about the prices at which green hydrogen can be produced at wind power plant locations in Central Europe or the Mediterranean with a predicted production curve based on historical production data.
The results of the selected model show that the green hydrogen production has potential at the wind power plant location and that with the tested predictions of electricity and natural gas prices, the production price of green hydrogen is not yet competitive. It should be noted that the location is also affected by the availability of gas infrastructure, considering that the gas grid connection increases the investment in the construction of the power-to-gas facility, which additionally increases the production price of green hydrogen. The authors believe that the presented results are encouraging and that the price of green hydrogen is not far from being competitive with fossil alternatives, but that a premium subsidy mechanism is needed to start using green hydrogen in the gas sector. This model is a good tool that shows how green hydrogen production is achievable at the location of renewable sources and under what conditions it can affect the decarbonization of the gas system.
From the point of view of the decarbonization of the gas system, this innovative model has an important contribution regarding the realization of the possibility of the decentralized production of competitive green hydrogen at the wind power plant’s locations. A wind power plant location, which was situated relatively close to an existing gas infrastructure, was, therefore, tested, which minimized the gas grid connection costs. Only green hydrogen was produced at the wind power plant location, which did not emit harmful CO2 emissions during production and combustion, which, as renewable gas injected into the gas grid, decarbonized the gas infrastructure.
This paper contributes new knowledge about the possibility of green hydrogen production at an existing wind power plant location in a hybrid energy system. The model connects two systems, power and gas, by setting up a power-to-gas system at a renewable energy location, from which the produced green hydrogen is integrated into the gas grid, which indirectly affects Europe’s climate goals by using the existing energy infrastructure. By producing green hydrogen and replacing it with natural gas in the gas grid, CO2 emissions are also reduced, which is one of the main goals in the energy transition.

6. Conclusions

In this study, a universal model was developed for the economic analysis of the future production of green hydrogen in a country or region at the locations of wind power plants. The model considers all the costs associated with the installation of the electrolyzer and the gas grid connection so that the green hydrogen produced at the wind power plant site can be injected with natural gas to meet the energy transition goals. The model takes into account numerous limitations related to the potential of renewable energy, prices of electricity, natural gas and CO2 emissions, and the costs of building the power-to-gas system.
The model was created based on historical data on the price of electricity and historical data on the wind power plant production through a Monte Carlo simulation, and it predicts future hourly data on the price and production of electricity for a period of 25 years. Although data from the Croatian electricity day-ahead market were used to test the applicability of the model, by changing the input parameters, that is, historical data on the production price of electricity, the model can be applied to any location. The model first calculates the optimal electrolyzer size. The electrolyzer size affects the total investment costs and the amount of green hydrogen production. Then, the model determines the optimal marginal price of electricity, which indicates the limit up to which green hydrogen is produced, i.e., above which electricity is delivered to the grid. The marginal price of electricity directly affects the production price of green hydrogen, which makes its role very important. Numerous results can be obtained with the model, but the authors focused on the following, which they consider interesting to single out.
The model was applied to the base case and in a scenario sensitivity analysis to test the best possible price of green hydrogen production based on changes in the input variables. The option in which the price of electricity is predicted to be lower, the option in which the prices of natural gas and CO2 emissions are predicted to be higher, and the option in which the price of electricity is lower while the price of natural gas and CO2 emissions is higher were all tested.
Furthermore, it should be noted that according to the input data on electricity and natural gas prices used in the model, there was no visible surplus of electricity, that is, a sudden and large drop in electricity prices on the market, and for this reason, the model gave mostly negative results. At the time of writing, there was no surplus of electricity from renewable energy sources, but due to the change in the predicted electricity prices and the increase in the share of renewable energy, the authors assume that this surplus will probably occur.
The increased amount of renewable energy sources will lead to increasingly frequent situations when prices on the electricity market are low or even negative. The above would encourage owners of renewable energy systems to invest in electrolyzers in order to use such situations for the green hydrogen production and, thereby, increase the income of their plants. However, what is important from this analysis is the fact that the use of power-to-gas systems for the green hydrogen production is still unprofitable due to the ratio of market prices of electricity and natural gas price increased by the price of CO2 emissions.
According to the presented model results, taking into account the total consumption of natural gas in the Republic of Croatia and the share of the analyzed wind power plant in the total installed power of renewable energy sources in Croatia, the amount of green hydrogen produced is not significant and would not significantly affect the reduction of CO2 emissions. However, the amounts of produced green hydrogen shown by the model represent the result of only one wind power plant. If such systems were to be built at several locations of wind power plants, the effect of reducing CO2 emissions would be more significant because the effect would be multiplied. In addition, by changing the input parameters, the results of the model can be positive as shown in the scenario analysis.
The authors believe that the possible limitations of the model are the lack of technical aspects of injecting hydrogen into the gas grid, and that the analysis of the regulatory framework for the use of hydrogen and the premium subsidy model should be part of further research. Energy infrastructures are natural monopolies, and transmission and transport system operators on liberalized energy markets are regulated entities. Therefore, adjustments to the currently valid regulations regarding the use of power-to-gas systems by the operators are necessary in order to be able to produce green hydrogen without interruption. The presented model shows that the power-to-gas system at the wind power plant location solves the problem of power system congestion and the problem of low hourly electricity prices on the day-ahead market, while contributing to the decarbonization of the gas system.

Author Contributions

Conceptualization, A.D. and N.V.L.; methodology, A.D.; software, A.D.; validation, A.D., N.V.L., and L.W.; formal analysis, A.D. and L.W.; investigation, A.D.; resources, A.D. and L.W.; data curation, L.W.; writing—original draft preparation, A.D.; writing—review and editing, N.V.L. and L.W.; visualization, A.D.; supervision, N.V.L. and L.W.; project administration, A.D.; funding acquisition, N.V.L. All authors have read and agreed to the published version of the manuscript.

Funding

This research was funded by Croatian Science Foundation under the project IP-2020-02-1018 and University of Rijeka, ZIP-UNlRl-2023-3.

Institutional Review Board Statement

Not applicable.

Informed Consent Statement

Not applicable.

Data Availability Statement

The data presented in this study are available on request from the corresponding author.

Conflicts of Interest

Author Lahorko Wagmann was employed by the company Croatian Energy Regulatory Agency. The remaining authors declare that the research was conducted in the absence of any commercial or financial relationships that could be construed as a potential conflict of interest.

Abbreviations

The labels of parameters and variables are defined, together with their measurement units used as input variables of the model in the following table:
PEtPrice of electricity in year t [EUR/MWh]
PNGtPrice of natural gas in year t [EUR/MWh]
PCO2tPrice of CO2 emissions in year t [EUR/t]
HPEHydrogen production efficiency [%]
IPEtInstalled power of the electrolyzer in year t [MWh]
FHPtFixed cost of hydrogen production in year t [EUR/MWh]
VHPtVariable cost of hydrogen production in year t [EUR/MWh]
GHPPtGreen hydrogen production price in year t [EUR/MWh]
MPEtMarginal price of electricity in year t [EUR/MWh]
HPtAnnual hydrogen production in year t [MWh]
HEPWPPtHourly electricity production from the wind power plant in year t [MWh]
HEPEMtHourly expected price of electricity on the market in year t [EUR/MWh]
EHPtElectricity consumed for hydrogen production in year t [MWh]
EPGtElectricity delivered to the grid in year t [MWh]
MEHPtMarket value of electricity used for hydrogen production in year t [EUR]
MVDGtMarket value of electricity delivered to the grid in year t [EUR]
IGHPtIncome from produced green hydrogen in year t [EUR]
StNeeded premium subsidy in year t [EUR/MWh]
LCOHThe levelized cost of hydrogen [EUR/MWh]
nLifetime of power-to-gas system
dDiscount factor [%]
MTCtMaintenance cost in year t [EUR]
WOCtCost of water in year t [EUR]
ICtInvestment cost in year t [EUR]
GPCCtCost of connection to the gas pipeline in year t [EUR]

References

  1. Chandrasekar, A.; Flynn, D.; Syron, E. Operational challenges for low and high temperature electrolyzers exploiting curtailed wind energy for hydrogen production. Int. J. Hydrogen Energy 2021, 46, 28900–28911. [Google Scholar] [CrossRef]
  2. Noussan, M.; Raimondi, P.P.; Scita, R.; Hafner, M. The Role of Green and Blue Hydrogen in the Energy Transition—A Technological and Geopolitical Perspective. Sustainability 2020, 13, 298. [Google Scholar] [CrossRef]
  3. Dinh, V.N.; Leahy, P.; McKeogh, E.; Murphy, J.; Cummins, V. Development of a viability assessment model for hydrogen production from dedicated offshore wind power plants. Int. J. Hydrogen Energy 2021, 46, 24620–24631. [Google Scholar] [CrossRef]
  4. Grimm, A.; de Jong, W.A.; Kramer, G.J. Renewable hydrogen production: A techno-economic comparison of photoelectrochemical cells and photovoltaic-electrolysis. Int. J. Hydrogen Energy 2020, 45, 22545–22555. [Google Scholar] [CrossRef]
  5. Li, Z.; Fang, S.; Sun, H.; Chung, R.; Fang, X.; He, J. Solar Hydrogen. Adv. Energy Mater. 2023, 13, 2203019. [Google Scholar] [CrossRef]
  6. Mikovitz, C.; Wetterlund, E.; Wehrle, S.; Baumgartner, J.; Schmidt, J. Stronger together: Multi-annual variability of hydrogen production supported by wind power in Sweden. Appl. Energy 2021, 282, 116082. [Google Scholar] [CrossRef]
  7. Bareiß, K.; de la Rúa, C.; Möckl, M.; Hamacher, T. Life cycle assessment of hydrogen from proton exchange membrane water electrolysis in future energy systems. Appl. Energy 2019, 237, 862–872. [Google Scholar] [CrossRef]
  8. Grossi, G.; Arpino, F.; Bertone, M.; Canale, C.; Canale, L.; Cortellessa, G.; Dell’Isola, M.; Ficco, G.; Moretti, L. Natural gas system decarbonization by green hydrogen injection: A distributed approach. In IOP Conference Series: Earth and Environmental Science; IOP Publishing: Bristol, UK, 2022; Volume 1106. [Google Scholar] [CrossRef]
  9. Armijo, J.; Philibert, C. Flexible production of green hydrogen and ammonia from variable solar and wind energy: Case study of Chile and Argentina. Int. J. Hydrogen Energy 2020, 45, 1541–1558. [Google Scholar] [CrossRef]
  10. Ioannou, A.; Brennan, F. A Preliminary Techno-Economic Comparison between a Grid-Connected and Non-Grid Connected Offshore Floating Wind Power Plant; Department of Naval Architecture, Ocean & Marine Engineering University of Strathclyde: Glasgow, UK, 2019. [Google Scholar] [CrossRef]
  11. Eveloy, V.; Gebreegziabher, T. A Review of Projected Power-to-gas Deployment Scenarios. Energies 2018, 11, 1824. [Google Scholar] [CrossRef]
  12. Xiong, B.; Predel, J.; del Granado, P.C.; Egging-Bratseth, R. Spatial flexibility in redispatch: Supporting low carbon energy systems with Power-to-gas. Appl. Energy 2020, 283, 116201. [Google Scholar] [CrossRef]
  13. Gorre, J.; Ortloff, F.; van Leeuwen, C. Production costs for synthetic methane in 2030 and 2050 of an optimized Power-to-gas system with intermediate hydrogen storage. Appl. Energy 2019, 253, 113594. [Google Scholar] [CrossRef]
  14. Morales-España, G.; Nycander, E.; Sijm, J. Reducing CO2 emissions by curtailing renewables: Examples from optimal power system operation. Energy Econ. 2021, 99, 105277. [Google Scholar] [CrossRef]
  15. Ruhnau, O. How flexible electricity demand stabilizes wind and solar market values: The case of hydrogen electrolyzers. Appl. Energy 2022, 307, 118194. [Google Scholar] [CrossRef]
  16. Kumar, S.S.; Himabindu, V. Hydrogen production by PEM water electrolysis—A review. Mater. Sci. Energy Technol. 2019, 2, 442–454. [Google Scholar] [CrossRef]
  17. Al-Qahtani, A.; Parkinson, B.; Hellgardt, K.; Shah, N.; Guillen-Gosalbez, G. Uncovering the true cost of hydrogen production routes using life cycle monetization. Appl. Energy 2021, 281, 115958. [Google Scholar] [CrossRef]
  18. Muñoz Díaz, M.T.; Chávez Oróstica, H.; Guajardo, J. Economic Analysis: Green Hydrogen Production Systems. Processes 2023, 11, 1390. [Google Scholar] [CrossRef]
  19. Ferrero, D.; Gamba, M.; Lanzini, A.; Santarelli, M. Power-to-gas Hydrogen: Techno-economic Assessment of Processes towards a Multi-purpose Energy Carrier. Energy Procedia 2016, 101, 50–57. [Google Scholar] [CrossRef]
  20. Ekhtiari, A.; Flynn, D.; Syron, E. Investigation of the multi-point injection of green hydrogen from curtailed renewable power into a gas network. Energies 2020, 13, 6047. [Google Scholar] [CrossRef]
  21. Pellegrini, M.; Guzzini, A.; Saccani, C. A preliminary assessment of the potential of low percentage green hydrogen blending in the Italian Natural Gas Network. Energies 2020, 13, 5570. [Google Scholar] [CrossRef]
  22. Khan, M.H.A.; Daiyan, R.; Han, Z.; Hablutzel, M.; Haque, N.; Amal, R.; MacGill, I. Designing optimal integrated electricity supply configurations for renewable hydrogen generation in Australia. iScience 2021, 24, 102539. [Google Scholar] [CrossRef]
  23. Qiu, Y.; Zhou, S.; Chen, J.; Wu, Z.; Hong, Q. Hydrogen-Enriched Compressed Natural Gas Network Simulation for Consuming Green Hydrogen Considering the Hydrogen Diffusion Process. Processes 2022, 10, 1757. [Google Scholar] [CrossRef]
  24. Koirala, B.P.; Hers, S.; Morales-Espana, G.; Ozdemir, O.; Sijm, J.; Weeda, M. Integrated electricity, hydrogen, and methane system modelling framework: Application to the Dutch Infrastructure Outlook 2050. Appl. Energy 2021, 289, 116713. [Google Scholar] [CrossRef]
  25. Dumančić, A.; Vlahinić-Lenz, N.; Majstrović, G. Can Hydrogen Production Be Economically Viable on the Existing Gas-Fired Power Plant Location? New Empirical Evidence. Energies 2023, 16, 3737. [Google Scholar] [CrossRef]
  26. Hassan, Q.; Abdulrahman, I.S.; Salman, H.M.; Olapade, O.T.; Jaszczur, M. Techno-Economic Assessment of Green Hydrogen Production by an Off-Grid Photovoltaic Energy System. Energies 2023, 16, 744. [Google Scholar] [CrossRef]
  27. Serrano-Arévalo, T.I.; Tovar-Facio, J.; Ponce-Ortega, J.M. Optimal Incorporation of Intermittent Renewable Energy Storage Units and Green Hydrogen Production in the Electrical Sector. Energies 2023, 16, 2609. [Google Scholar] [CrossRef]
  28. Fuel Cells and Hydrogen 2 Joint Undertaking (FCH 2 JU). In Study on Early Business Cases for H2 in Energy Storage and More Broadly Power to H2 Applications; Tractebel Engineering SA: Brussels, Belgium, 2017.
  29. Fu, P.; Pudjianto, D.; Zhang, X.; Strbac, G. Integration of hydrogen into multi-energy systems optimization. Energies 2020, 13, 1606. [Google Scholar] [CrossRef]
  30. Mayer, T.; Semmel, M.; Morales, M.A.G.; Schmidt, K.M.; Bauer, A.; Wind, J. Techno-economic evaluation of hydrogen refueling stations with liquid or gaseous stored hydrogen. Int. J. Hydrogen Energy 2019, 44, 25809–25833. [Google Scholar] [CrossRef]
  31. Plinacro. Ten-Year Plan for the Development of the Gas Transportation System of the Republic of Croatia 2021–2030; Ministry of Economy and Sustainable Development of the Republic of Croatia: Zagreb, Croatia, 2022. [Google Scholar]
  32. ENTSO-E; ENTSOG. TYNDP 2022 Scenario Report. 2022. Available online: https://2022.entsos-tyndp-scenarios.eu/ (accessed on 21 April 2022).
  33. Croatian Energy Regulatory Agency. Report on the Work of the Croatian Energy Regulatory Agency for the Year 2021; Ministry of Economy and Sustainable Development of the Republic of Croatia: Zagreb, Croatia, 2022. [Google Scholar]
  34. Ioannou, A.; Fuzuli, G.; Brennan, F.; Yudha, S.W.; Angus, A. Multi-stage stochastic optimization framework for power generation system planning integrating hybrid uncertainty modelling. Energy Econ. 2019, 80, 760–776. [Google Scholar] [CrossRef]
  35. Kaplan, R.; Kopacz, M. Economic Conditions for Developing Hydrogen Production Basec on Coal Gasification with Carbon Capture and Storage in Poland. Energies 2020, 13, 5074. [Google Scholar] [CrossRef]
  36. Jovan, D.J.; Dolanc, G. Can Green Hydrogen Production Be Economically Viable under Current Market Conditions. Energies 2020, 13, 6599. [Google Scholar] [CrossRef]
  37. Croatian Transmission System Operator. Annual Report 2021; Ministry of Economy and Sustainable Development of the Republic of Croatia: Zagreb, Croatia, 2022. [Google Scholar]
Figure 1. Data flow chart.
Sustainability 16 01424 g001
Figure 2. Influence of the produced quantity of green hydrogen on unit fixed costs of production.
Sustainability 16 01424 g002
Figure 3. Comparison of the price of green hydrogen and natural gas increased by the price of CO2 emissions (NCV).
Sustainability 16 01424 g003
Figure 4. Comparison of the income of produced green hydrogen and electricity on the day-ahead market for green hydrogen production.
Sustainability 16 01424 g004
Figure 5. Comparison of wind power plant income without and with green hydrogen production.
Sustainability 16 01424 g005
Figure 6. Scenario of a 20% lower predicted electricity price.
Sustainability 16 01424 g006
Figure 7. Scenario of 20% higher predicted natural gas prices and CO2 emissions.
Sustainability 16 01424 g007
Figure 8. Scenario of 20% lower predicted price of electricity and 20% higher predicted price of natural gas and CO2 emissions.
Sustainability 16 01424 g008
Table 1. CAPEX and OPEX of power-to-gas system and gas grid connections.
Parameter Unit Price
CAPEX power-to-gasElectrolyzer1300.00 EUR/kW
Compressor400.00 EUR/kW
CAPEX gas grid connectionMeasuring-reduction station (MRS)/Hydrogen injection station660,000.00 EUR
OPEXMarket value of produced electricity used for hydrogen productionEUR/MWh
Electrolyzer maintenance
(2% of capital costs)
0.58–1.00 EUR/MWh
The cost of water2.00 EUR/m3
Source: Authors, based on data taken from several sources in the literature [13,16,28,29,30,31].
Table 2. Estimated annual prices of electricity, natural gas, and CO2 emissions.
Price202520302035204020452049
Electricity (EUR/MWh)185.44127.17113.58100.0095.0091.00
Natural gas (EUR/MWh) (NCV)83.8144.4041.6238.8536.0733.85
CO2 emissions (EUR/t)102.71127.56147.97168.37188.78205.11
Source: Authors estimated prices based on data from the TYNDP 2022 Scenario Report [32].
Table 3. Assumptions of the economic model.
Wind power plant capacity42 MW
Lifetime of power-to-gas system25 years
Straight-line depreciation25 years
Electrolyzer efficiency74%
Source: Authors [29,33].
Table 4. Presentation of model results for selected years.
Parameter202520302035204020452049
Income from produced green hydrogen (EUR)1,425,6441,199,8231,494,4871,631,7501,662,7451,780,129
Amount of green hydrogen (MWh)13,63617,10220,90122,39922,41023,648
Electricity for green hydrogen production (MWh)18,42723,11128,24430,26830,28331,957
Market value of electricity used for the production of green hydrogen (EUR)1,876,2661,884,3911,561,5562,239,7271,495,1982,190,288
Average price of electricity for hydrogen production (EUR/MWh)101.8281.5455.2974.0049.3768.54
Electricity delivered to the grid (MWh)60,44075,66875,48368,51068,49466,821
Average price of electricity delivered to the grid (EUR/MWh)204.75147.14150.39112.05122.16102.27
Income from the sale of electricity (EUR)12,374,92611,134,12111,351,6097,676,5008,366,8906,833,479
Total electricity produced (MWh)78,86798,779103,72798,77898,77898,778
Reduction of CO2 emissions (t)272734204180448044824730
Required premium subsidy (EUR/MWh)33.0540.033.2127.140.0017.34
Source: Authors.
Table 5. Optimization of the economic model.
Parameter202520302035204020452049
Breakeven price of electricity (EUR/MWh)141.12115.0781.1397.7274.2391.18
Optimum electrolyzer size10 MW
Source: Authors.
Table 6. Production price of green hydrogen.
Parameter202520302035204020452049
Fixed costs of green hydrogen production (EUR/MWh)53.4242.7135.0432.7332.7231.03
Variable cost of green hydrogen production (EUR/MWh)137.60110.1874.71100.0066.7292.62
Production price of green hydrogen (EUR/MWh) (NCV)191.02152.89109.75132.7399.44123.65
Source: Authors.
Table 7. The levelized costs of hydrogen.
ScenarioLCOH (EUR/MWh)
Basic scenario136.56
Scenario of 20% lower electricity price116.79
Scenario of 20% higher natural gas and CO2 emissions prices136.56
Scenario of 20% lower electricity price and 20% higher natural gas and CO2 emissions prices116.79
Source: Authors.
Disclaimer/Publisher’s Note: The statements, opinions and data contained in all publications are solely those of the individual author(s) and contributor(s) and not of MDPI and/or the editor(s). MDPI and/or the editor(s) disclaim responsibility for any injury to people or property resulting from any ideas, methods, instructions or products referred to in the content.

