1. Introduction
In late 2020, the European Commission (EC) presented the European Green Deal [
1] including an ambitious set of measures to achieve net-zero greenhouse gas (GHG) emissions by 2050. The Green Deal underscores the expansion of renewable energy sources (RES), including the production of clean hydrogen, as a key priority for attaining carbon neutrality. The growth of large-scale solar energy projects (ground-mounted photovoltaic facilities exceeding 1 MW) plays a pivotal role in advancing the energy transition. However, this expansion necessarily increases the demand for land resources, which could impact not only energy generation but also other land uses such as agriculture and biodiversity conservation. To address this issue, significant attention has been placed on integrated solar developments such as building-integrated photovoltaic (BIPV) panels. Currently, more innovative photovoltaic (PV) applications, such as urban PV, floating PV, solar carports, road-integrated PV, and vehicle-integrated PV, are being actively promoted. However, the installation rate of these PV applications may not be fast enough to support a rapid energy transition, for several reasons. Land-based PV farms remain a valid option to be considered to mitigate the competition for land resources between food and energy production. The development of agrivoltaic systems, which co-locate solar energy production and agricultural land uses, emerges as a promising compromise. Originally, agrivoltaics simply involved dividing a piece of land for both agriculture and energy use. In recent decades, the concept of agrivoltaics, making dual and synergistic use of land for agriculture and PV generation, has gained prominence, with a wide range of novel agrivoltaic systems.
Here, agrivoltaic systems refer to the synergistic co-location of ground-mounted PV development with specific configurations (e.g., raised PV panels, high porosity, etc.) and one or more of the following agricultural activities: crop cultivation, animal husbandry (e.g., livestock grazing, apiaries), or habitat enhancement to improve pollination services to adjacent agricultural fields and other ecosystem services on the solar site [
1,
2,
3].
Several studies have demonstrated that the synergistic land use of agrivoltaic systems allows both the crops or livestock and the PV systems to benefit from this integration [
4,
5,
6]. For example, in dry climates, the shade cast by PV systems can reduce irrigation needs by up to 20% due to altered microclimate conditions beneath them, improving soil conditions. Solar panels can also be used to collect rainwater, to be used for irrigation, especially in arid regions as well as for protecting the crops from heavy rainfall, hail, or wind. The protection can be provided by the PV panels themselves or by foil tunnels using the panel mounting structure [
5]. Then, the average photosynthetic active radiation under solar PV systems can be reduced by approximately 30%, decreasing soil temperature, soil moisture, and air temperatures in summer [
6]. At the same time, solar panels mounted over vegetation demonstrate significant surface temperature drops compared to panels mounted over bare ground. This cooling effect is shown to be a result of evapotranspiration from vegetation, which enhances heat loss from the ground relative to bare soil conditions. The implication is that solar conversion efficiency is greater when solar PV is mounted over vegetation compared to exposed soil or gravel [
5,
7].
Several demonstrations of agrivoltaic systems have shown that livestock grazing and other forms of animal husbandry can be compatible with solar energy development. Livestock, such as sheep, may be particularly suitable for solar infrastructure due to their relatively small size and docile nature compared to other livestock [
4].
Research in this field encompasses a wide range of aspects, including the solar power potential by land cover type, water conservation, water use efficiency, soil quality, erosion control, economic viability, suitability for shade-tolerant and shade-intolerant crops, as well as social acceptance and technological design [
2,
3,
4].
The aforementioned benefits of agrivoltaic systems represent only a subset of those already documented in the literature and under current research investigation. Here, we have highlighted the aspects that have most influenced the definition of site suitability criteria for planning the development of agrivoltaic systems.
Co-locating crop production with solar energy development can be implemented in various spatial configurations and integration levels. Although numerous configurations for agrivoltaic systems have been explored in the literature (relevant agrivoltaic demonstrator projects are discussed in [
3]) they can generally be categorised into three configuration types with modules raised above the ground: Type 1—inclined PV modules overhead; Type 2—inclined PV modules among the crops; Type 3—vertical PV modules among the crops (
Figure S1a–c) [
1,
8].
Agrivoltaic systems with a Type 1 configuration are often considered the next generation. In this setup, PV modules are mounted at a moderate height above the ground (4–5 m) to allow for agricultural activities, including the use of machinery. This configuration can be achieved with horizontal single-axis tracking PV systems. In Type 1, the tilt in Type 1, the azimuth angle of monofacial PV panels, mounted on a north–south axis, adjusts continuously throughout the day. The PV panels facing east in the morning move to turn west in the evening.
This dynamic shading management enhances yields for both panels and crops cultivated on the shared land. In the vertical configuration, bifacial PV modules are mounted in continuous rows facing east and west, leaving spaces between the rows for agriculture. The height can range from 1 to 3 m, and the inter-row spacing can vary from 3 to 12 m, distinguishing between dense and sparse installations. While this configuration minimises soil use and allows for dual land use, its energy efficiency potential may be lower. The Type 2 configuration is considered typical, with south-facing monofacial fixed-tilt PV modules mounted, leaving spaces between the rows for crops. Although it does not fully enable dual land use, some crops can be cultivated beneath the PV modules using automated technology.
Agrivoltaic systems have the capacity to positively impact various ecosystem services, depending on the specific priorities and goals of their implementation. These are included into the following four categories: (1) energy and economic benefits; (2) agricultural provisioning services: food production and animal husbandry; (3) biodiversity conservation; and (4) regulating ecosystem services such as carbon sequestration and water and soil conservation. More clearly, the agrivoltaic systems produce electricity and thus contribute directly to energy and economy. Incorporating natural habitats within agrivoltaic systems can foster plant and animal biodiversity, contributing to conservation objectives. Careful management can also yield favourable regulatory services, such as carbon sequestration and water and soil conservation [
2].
However, the potential extensive expansion of agrivoltaic systems has raised concerns and sparked debates, also regarding their impact on the landscape in terms of landscape transformation and ecosystem services. Italy, home to the world’s highest number of United Nations Educational, Scientific and Cultural Organization (UNESCO) heritage sites and a prominent player in Europe’s renewable energy targets, provides a dynamic testing ground for exploring the intersections and synergies between traditional landscape preservation concepts and the emerging challenges presented by the integration of agrivoltaics into the landscape.
The authors are promoters at national and European level of a new idea of agrivoltaics, termed sustainable agrivoltaics (AgrivoltaicoSostenibile@ENEA), aimed at maximising the synergies not only between energy and food but also between the latter and landscape. Sustainable agrivoltaic systems optimise, on the same unit of land, energy and agricultural achievements, making the landscape experience sustainable and harmonious, ensuring public acceptance [
9].
The broader research objective pursued by the authors is the development of tools to support the planning of sustainable agrivoltaic systems at a macro level, typically regional, and preliminary landscape design. These tools are targeted to policymakers and project developers and designers.
For achieving these objectives, the main research topics to be addressed are essentially:
- (1)
Where?—which areas are suitable for the development of the agrivoltaic systems within a country and what is the agrivoltaic potential?
- (2)
How many?—how many agrivoltaic systems have to be developed within a landscape unit (cumulative effect)?
- (3)
How porous?—how large do the PV strips have to be (scale of single patch)?
- (4)
How oriented?—how do the PV strips have to be oriented in order to match the landscape agricultural pattern?
As regards the demands (2)–(4), they are being addressed in ongoing studies [
10] of the authors through the definition of a trans-disciplinary descriptive model associated to quantitative metrics and indicators able to classify the landscape structure as well as its composition and spatial arrangement to meet a harmonious landscape integration. The defined quantitative landscape metrics will be preliminary inputs for the design of the agrivoltaic pattern to fulfil the most relevant landscape integration criteria (e.g., shape and size of the entire agrivoltaic systems, density of the systems, etc.).
Determining which areas are suitable within a country for the development of agrivoltaic systems was the objective of this research work. This is a fundamental requirement for the assessment of the agrivoltaic potential of a country on which to base the energy transition policies.
The more accurate the land eligibility analysis, the more reliable the agrivoltaic power potential estimation is. However, as shown by recent works in the research literature [
5,
9,
10], the land eligibility analysis is basically performed by selecting the land types for agricultural use from available datasets and considering essential criteria such as land topographic characteristics that can affect the solar radiation reaching the ground. In addition, exclusion criteria are considered including different types of protected areas such as protected habitats for birds and other wildlife, landscapes and parks, and natural monuments. It is evident that the higher the number of eligibility criteria involved, the higher accuracy of the land eligibility analysis. What it is also crucial is how the relevance of these criteria is evaluated in the suitability decision process. For example, the criteria are evaluated to be equally relevant in determining the land eligibility and are properly weighted on the basis of specific considerations.
The aim of this research work was to develop a methodological framework for an advanced agrivoltaic land eligibility analysis at a regional level based on a spatial multicriteria analysis. The challenging task was to identify the variety of factors that can affect the land eligibility for agrivoltaic system deployments and properly combine these factors, aiming at maximising the energy and agricultural yields while minimising the impact on the surrounding landscape.
The spatial multicriteria analysis approach, here proposed, is based on the integration of a multi-criteria decision-making (MCDM) method as the analytic hierarchy process (AHP) with geographic information systems (GIS).
This approach is increasingly being used for evaluating the potential of renewable energy sources as it is a low-cost, rapid, and reliable tool. There are several studies in the research literature that investigate the potential of solar power, wind power, hydropower, biomass and, more recently, green hydrogen, using GIS-MCDM (including AHP) methods [
11,
12,
13,
14,
15,
16,
17,
18,
19,
20,
21]. These methods allow us to take into account a wide range of factors, capture their spatial patterns, and optimise the identification of favourable elements while minimising any potential drawbacks.
Pohekar et al. (2004) [
15] and, more recently, Papathanasiou J. et al. (2023) [
16] examined a large number of papers on the application of MCDA methods for sustainable energy planning, both finding that the most commonly used method is the AHP method. The AHP method was developed in the 1970s by Thomas Saaty [
22] to solve decision problems in complex and multi-criteria situations.
While GIS enables the evaluation of the spatial relations among the several factors performed such as geographical variables, the AHP method gives an orderly and logical way of determining the relative relevance of the several factors (i.e., suitability criteria) and determining the best option. In addition, the opinion of experts in the field and stakeholders can be involved in the decision-making process.
The methodological framework here proposed for determining the available eligible lands for the agrivoltaic systems and evaluating the agrivoltaic potential was first developed for the region Campania, Italy (NUTS2—ITF3), and then applied to the entire country of Italy, region by region.
The Level 2 Nomenclature of Territorial Units for Statistics (NUTS-2) was used in order to guarantee the extension of this analysis across the entire country as well as to provide a tool able to support the local authorities in the institutional task of identifying the eligible areas on regional territory.
This approach allowed the development of a decision support tool, also targeted to the regional authorities, designed to identify the eligible areas on regional territory.
This paper is organised as follows.
Section 2 presents the proposed methodologic framework based on the spatial multicriteria analysis. The spatial sensitivity analysis is discussed in
Section 3. The results and an overview of the extension of the analysis to the country of Italy are presented in
Section 4. Finally, the main conclusions are given in
Section 5.
2. Material and Methods
2.1. Study Area
The study was first carried out in the region Campania, Italy (NUTS2—ITF3), and then extended to the entirety of Italy, region by region.
Italy lies between longitudes 6 and 18 E and latitudes 35 and 47 N. The astronomical position of Italy positively affects its mild climate. It is composed of a continental part in the north delimited by the mountain chains of the Alps, a main peninsular part, and an insular part in the south. The entire territory is crossed by the mountain chain of the Apennine. It has an area of 302.073 km
2 and a population of 59,11 million inhabitants. It is administratively divided into 20 regions [
23].
Italian territory consists mainly of hills (41.6%), mountains (35%) and plains (23.2%). The regions of Valle d’Aosta and Trentino-Alto Adige consist only of mountain territory while the regions of Lombardia, Emilia-Romagna, Pulia and Veneto consist mainly of plain territory.
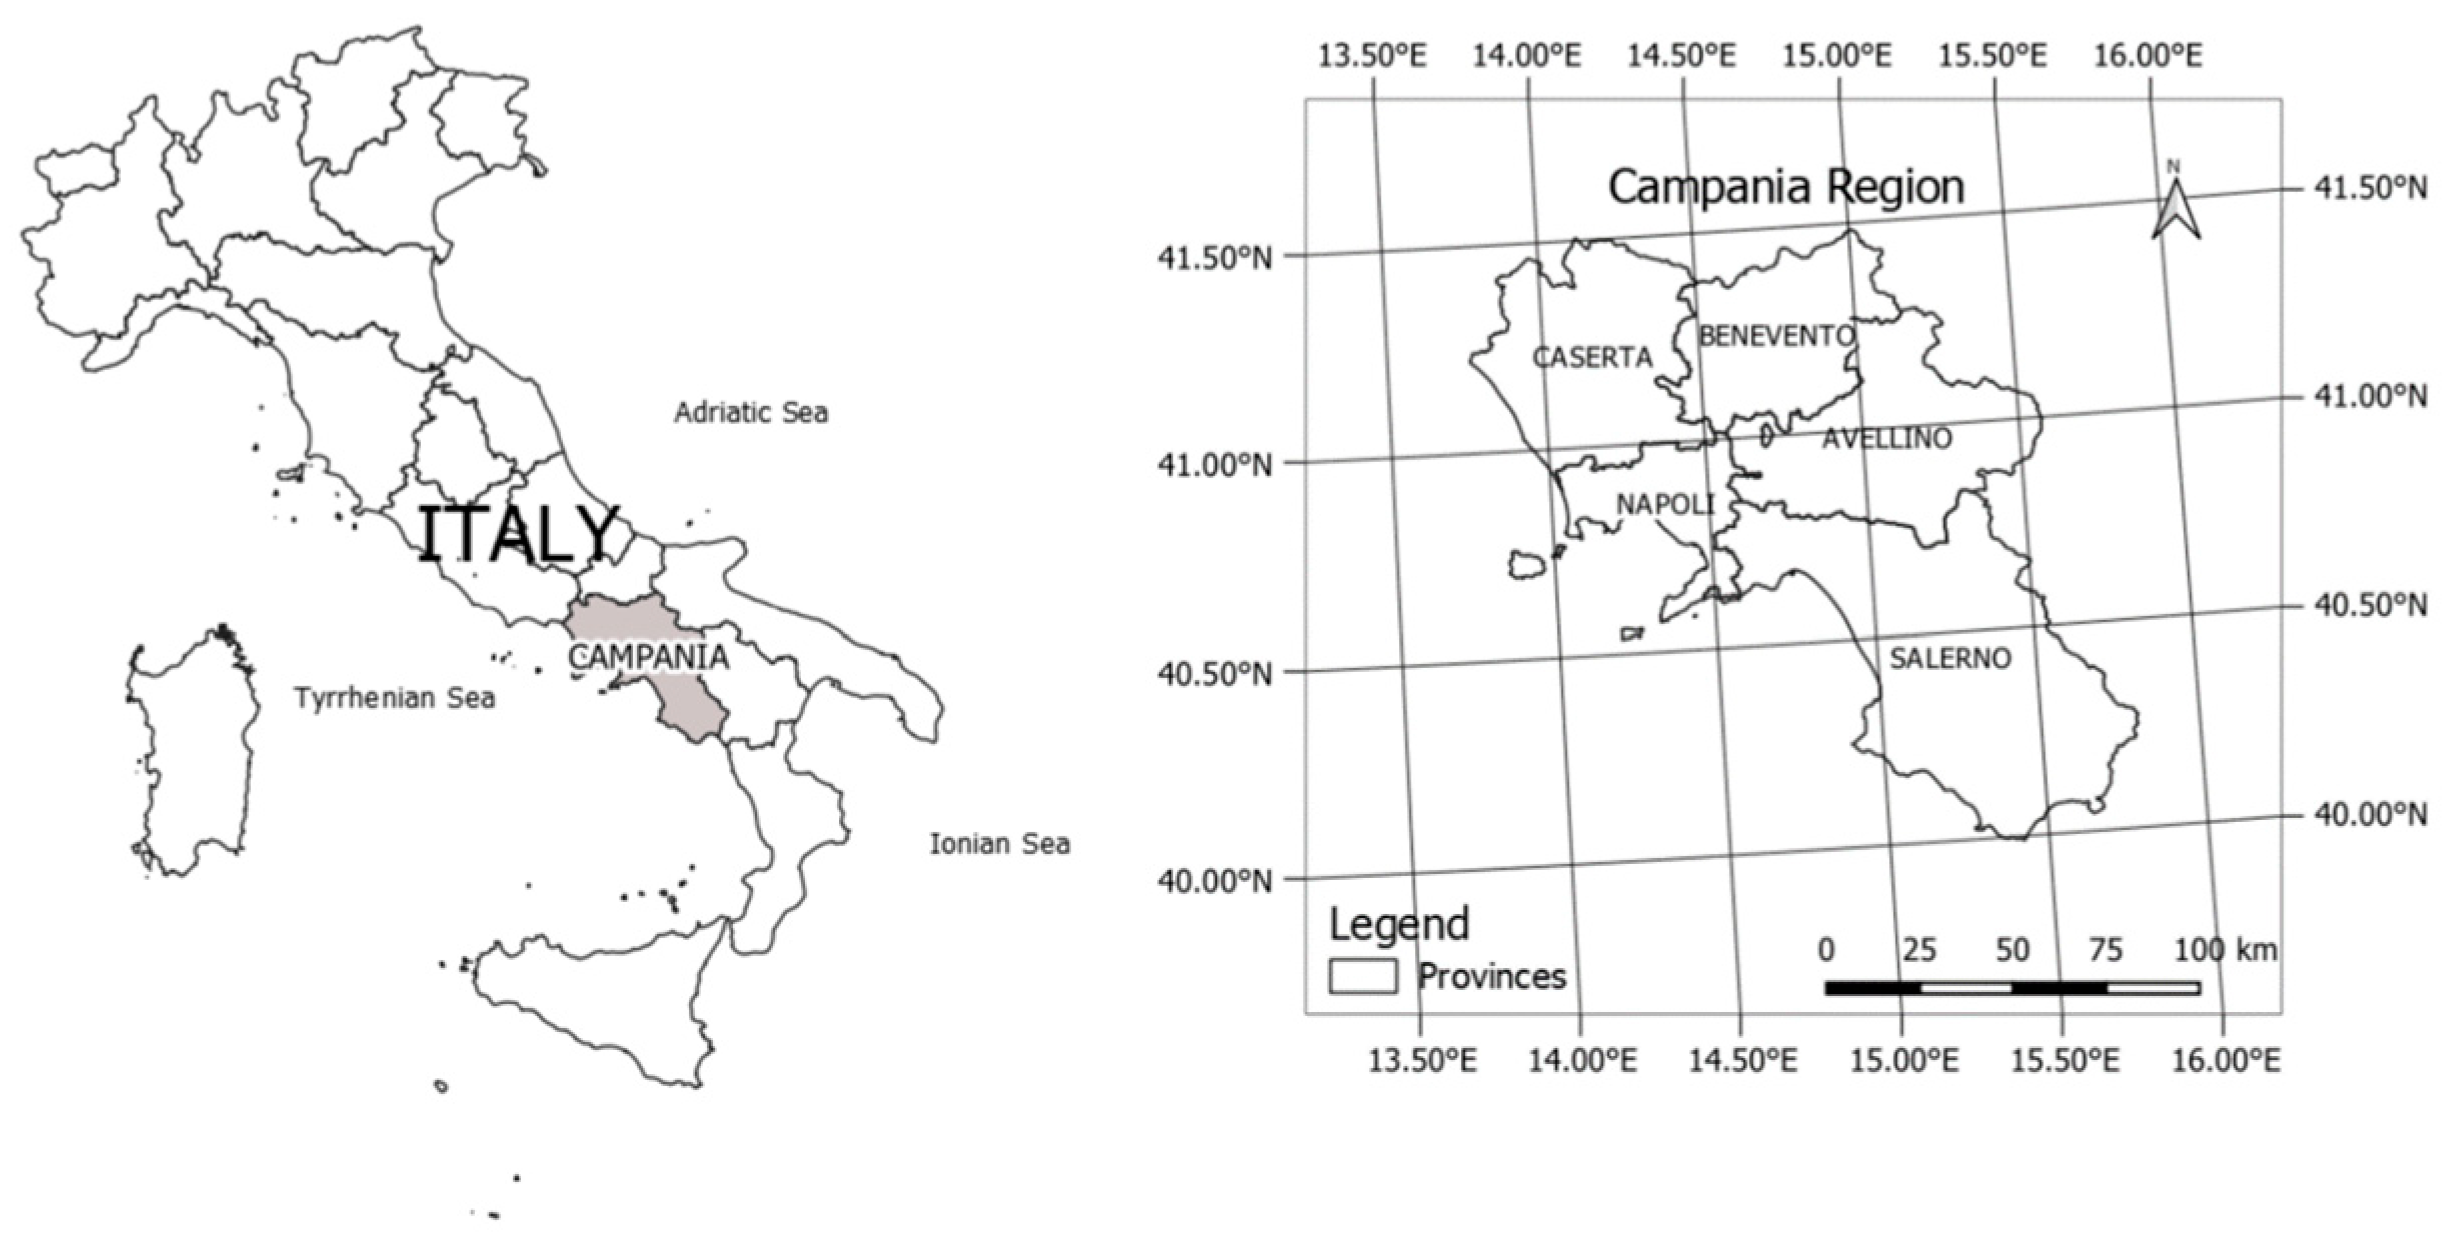
Campania is located between longitudes 13 and 16 E and between latitudes 39 and 42 N (
Figure 1). It has an area of 13,670 km
2 with a population of about 5.6 million inhabitants and a density of 424.4 inhabitants/km
2. It is administratively divided into 5 provinces—Napoli (covering as area of 1178.93 km
2), Salerno (covering a surface area of 4954.05 km
2), Avellino (covering an area of 2805.96 km
2), Caserta (covering an area of 2651.27 km
2) and Benevento (covering an area of 2080.37 km
2).
Its territory consists of 51% hills, 34% mountains and 15% plains. The highest mountain has an altitude of 1898 m above sea level while the largest flat areas are the Plain of Sele and the plain of Volturno. To the west, the coast is bath from the Tyrrhenian Sea while to the east lies the Apennine Mountains. The climate of Campania is mild. Its annual average temperature is about 5 °C in winter and 18 °C in summer with cold winters and dry summers against −13 °C in winter and 19 °C in summer at a national level. The annual average precipitation is around 1000 mm.
The annual global solar radiation value varies between 997 kWh/m2/year and 1664 kWh/m2/year against the range of 800 kWh/m2/year in the region Valle D’Aosta and 1,850,800 kWh/m2/year in the Island of Sicilia.
The annual average electricity demand is about 18,414 GWh covered entirely from regional production including only about 5% of photovoltaic energy. At a national level, it is about 319.9 TWh, covered from the national production for about 86% including 11% of photovoltaic energy.
In 2022, the installed PV capacity in Campania was 2 GW including both utility-scale and distributed solar systems, against an installed PV capacity of 24.7 GW across Italy.
The utilised agricultural surface in Campania covers 40.3% (1367.10 ha) of the total regional surface, slightly lower than the national value (42.3%) but significantly lower than that of the Southern Italy (51.2%) [
17]. In Campania, there are 24,806 farms, representing about 6% of national data. In total, 91% of these are individual farms that utilise an agricultural surface of 12 ha against 20 ha at national level.
The agriculture in Campania is very successful due to the quantity and quality of products. It is first in the national production of vegetables (potatoes, tomatoes, aubergines, peppers, beans, peas) and fruit (figs, hazelnuts, apricots, cherries, sasine). As regards breeding, in the flat areas, cattle are raised, while in the mountainous areas, sheep farming is practiced, especially goats. Buffalo breeding is also flourishing.
2.2. Methodology
Mapping the eligible available lands at the regional level is one of the main steps for the development of the agrivoltaic systems around a country. According to the national regulatory framework from Italy, the regional institutions are called on to fulfil this task, taking into account the current regulations as well as several environmental constraints.
The intention of methodologic framework here proposed to determine the suitable areas for agrivoltaic systems was to develop an innovative paradigm of sustainable agrivoltaics. To do so, land eligibility for agrivoltaic systems has been evaluated quantifying the appropriateness of the land unit to produce the optimal PV power output and crop yield by using an agrivoltaic system while minimising its impact on the structure and the perception of the surrounding landscape.
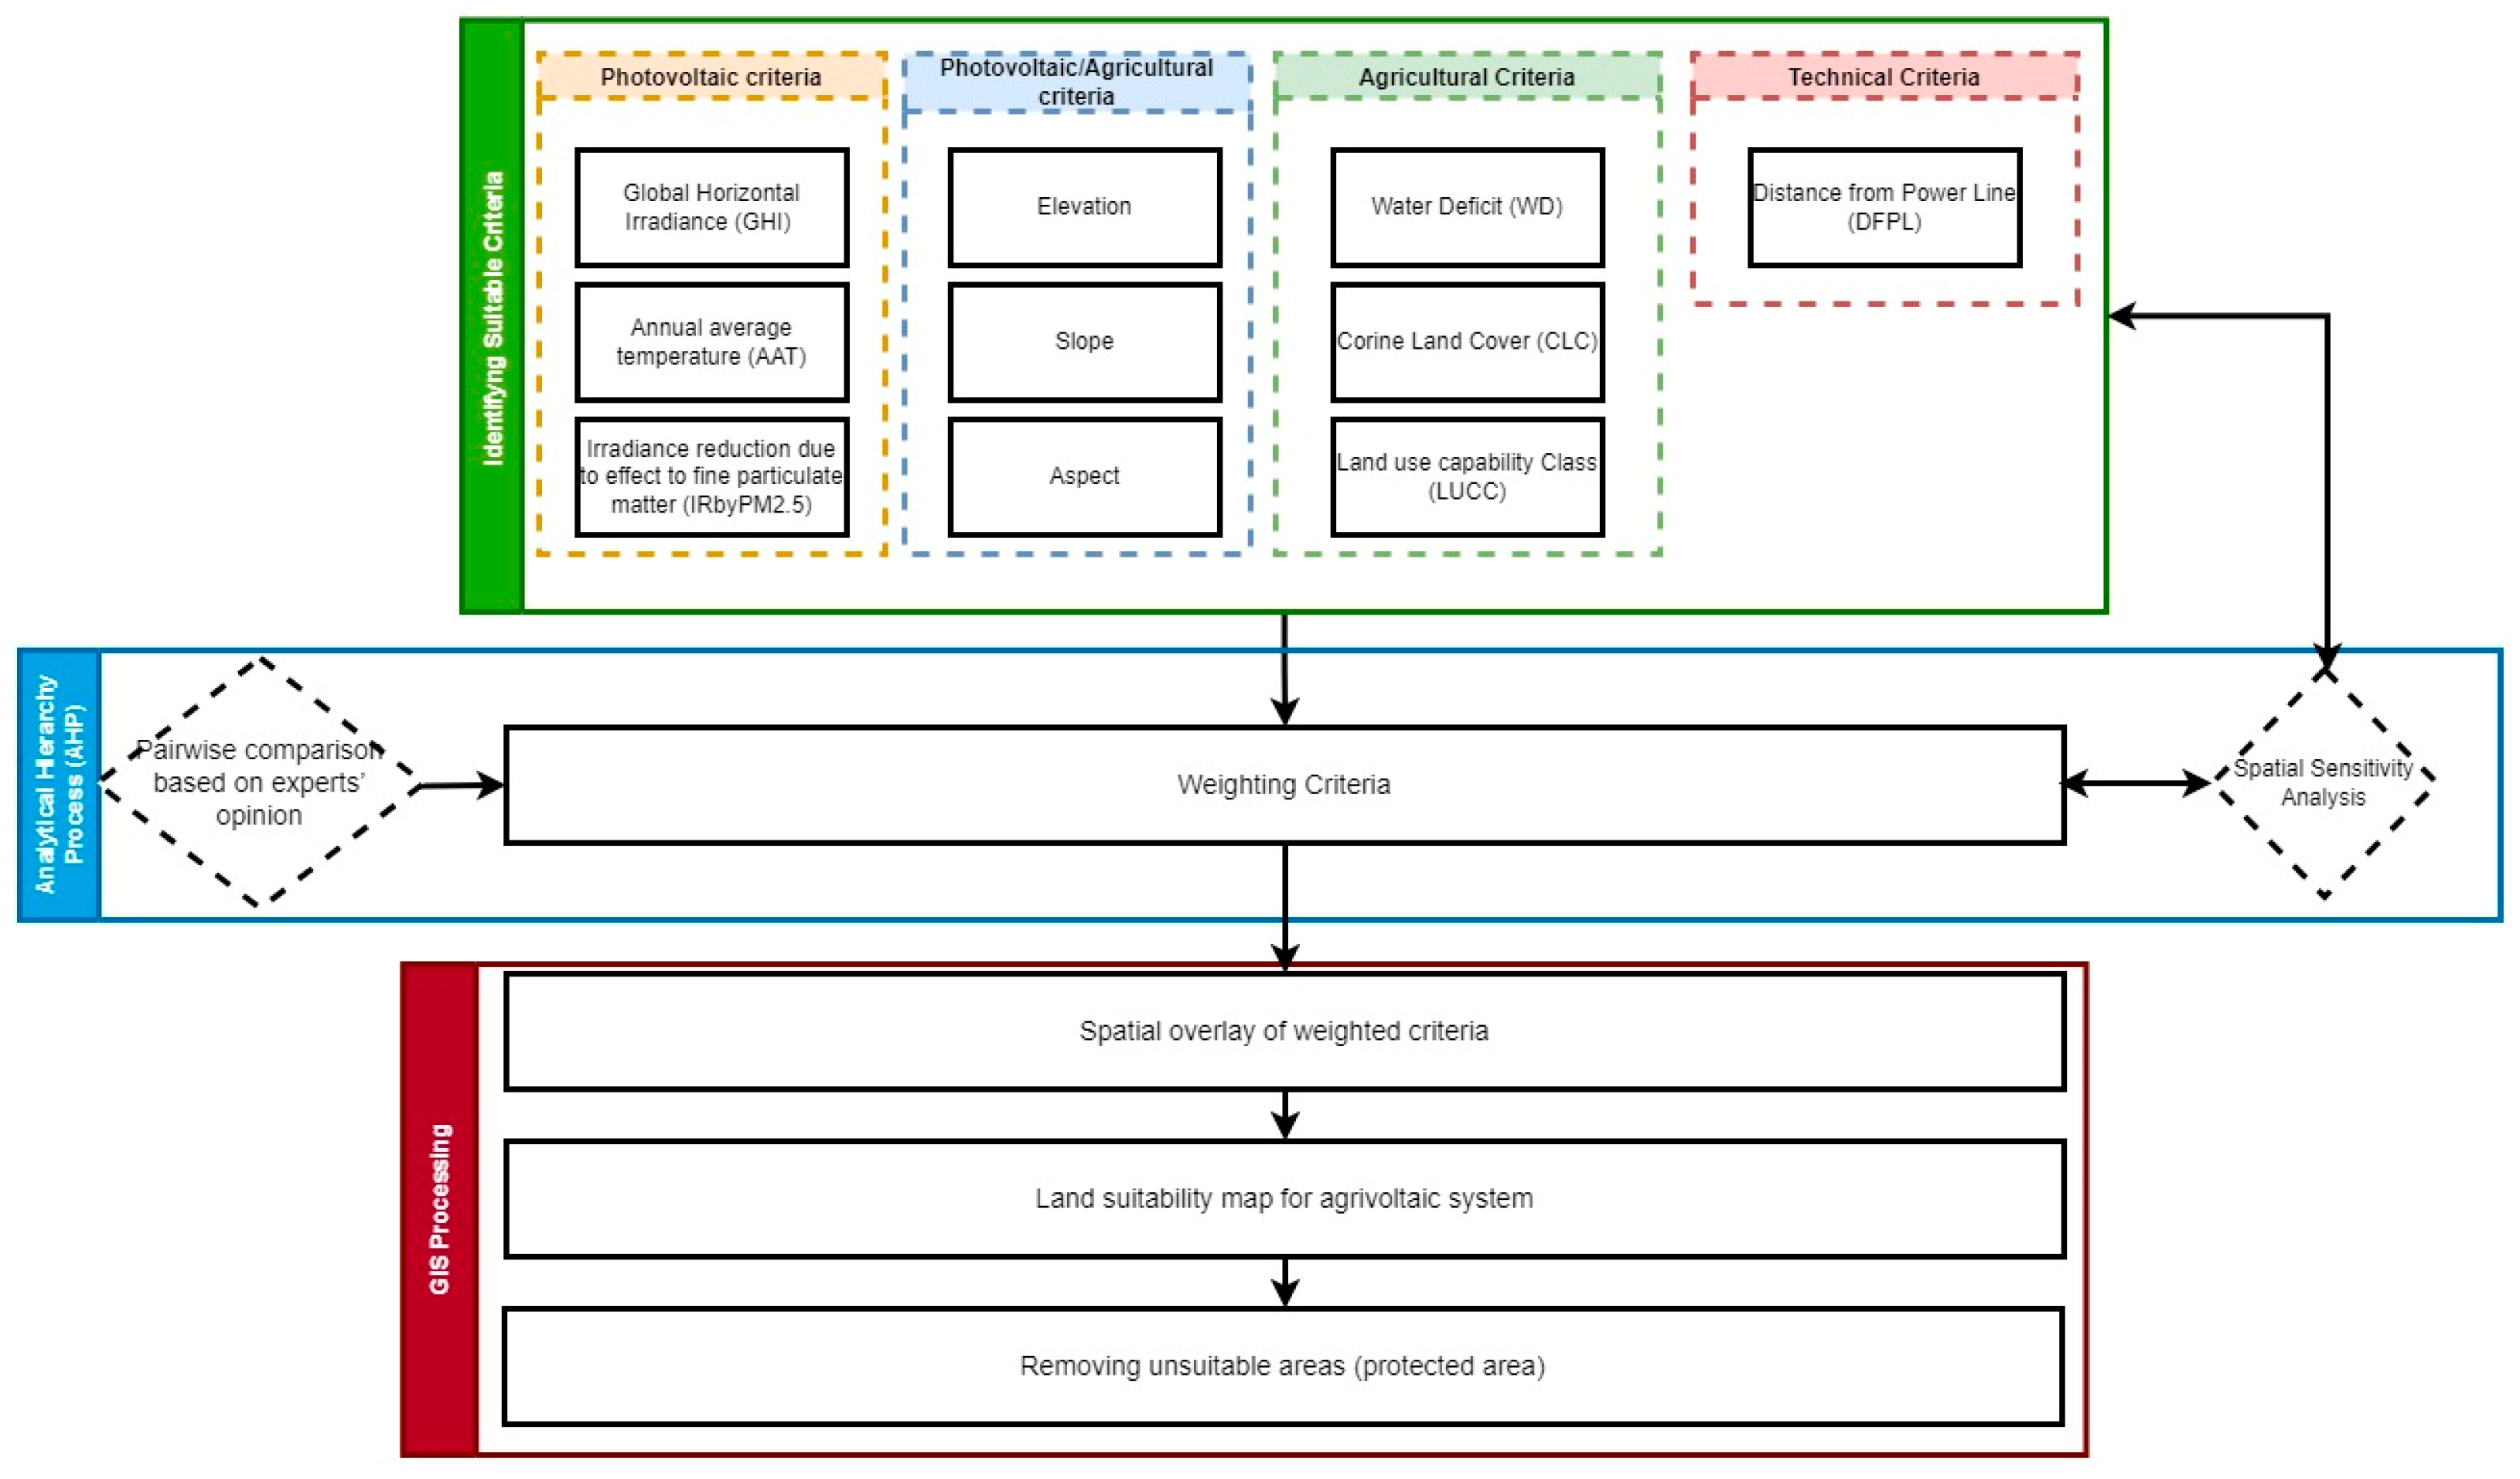
The spatial multicriteria analysis based on the integration of GIS and AHP methods, developed for our scopes, consists in three main steps as shown in the following flowchart (
Figure 2).
Firstly, based on experts’ knowledge and the current agrivoltaic literature, a set of suitability criteria has been properly defined, capturing the geophysical, technical, environmental, and meteorological factors that can affect both the solar PV potential of a unit of land and the crop yields, along with agriculture-oriented factors such as the land agricultural use, land capability and water deficit.
Then, the weights of the selected criteria have been determined using the AHP method. The opinions of a group of experts, properly involved, were crucial for evaluating the relative and global relevance of the selected criteria in the suitability decision-making process.
Thus, the selected criteria have been performed as geographical variables (i.e., spatial layers), normalised and categorised in five levels of suitability (very low, low, moderate, high and very high).
Finally, using a spatial overlay analysis, the criteria properly weighted have been combined as geographical variables in a land suitability index for agrivoltaic systems and unsuitable areas have been excluded according to different (constraints) criteria. So, a site suitability map for agrivoltaic systems has been generated for the whole Campania region as the case study, dividing it into five levels of suitability.
This map includes the suitable agricultural lands to develop agrivoltaic systems in which the best environmental, meteorological, and geographical conditions occur along with the best land use capabilities for agriculture affecting the agrivoltaic potential.
A spatial sensitivity analysis of the criteria weights involved in the land suitability analysis was performed in order to check the reliability of the resulting site suitability map for agrivoltaics. In particular, the dependency of proposed model output on the weights of input parameters has been explored, identifying criteria that are especially sensitive to weight changes and showing the impacts of changing criteria weights on the model outcomes in the spatial dimension.
In the following, the main steps of the proposed methodology are described in detail and referred to the case study of the Campania region. Then, the methodology is extended to the other NUTS-2 regions of Italy, generating the land suitability map at a regional scale for the agrivoltaic systems at a national level. Finally, on the basis of the resulting maps, the eligible area and capacity potential are evaluated both globally and then for the different land area categories and with different land area coverage percentages, assuming an installed power density of 0.6 MW/ha.
2.3. Identifying Suitability Criteria
The choice of criteria and their weighting are the crucial steps of the proposed methodology since they affect the decision-making process underlying the site suitability analysis.
There is a wide range of literature [
15,
18,
19,
20,
21] that analyses the criteria for selecting the suitable sites for renewable energy sources as well as the best renewable technology. These criteria are essentially classified into constraint criteria and weighting criteria. Eight main categories are identified to which criteria can belong: costs, risk, climate, environment, geography, visibility, ecology and society. For each category, specific (sub-) criteria can be defined. Regarding renewable technology, the criteria can belong to categories including technical, economic, land use, feasibility, efficiency, flexibility, and CO emissions, and reliability and precision aspects can affect the performance of renewable technology.
For our scopes, an effort has been made to identify a set of key criteria (including both constraints and weighting criteria) that can positively affect both the energy and agricultural production so as to realise the potential of the synergistic integration of photovoltaics and agriculture on the same land unit.
The choice of criteria has been addressed by both the recent literature in the agrivoltiac field and a group of experts, properly involved, including scientists in photovoltaic, agricultural and landscape fields and stakeholders with a crucial role in the implementation of agrivoltaics (designers, developers, decision-makers in the energy and agricultural fields).
Thus, geophysical, location, technical, meteorological and environmental criteria, which can affect both the solar photovoltaic potential and crop yield of a land unit, have been selected along with criteria such as land use, land use capability and water deficit, which can affect proper agricultural production. As shown in
Figure 2, the criteria involved in the site suitability decision process include global horizontal irradiance (GHI), annual average temperature (AAT), irradiance reduction due to the effect of fine particulate matter (IRbyPM2.5), elevation, slope, aspect, water deficit (WD), CORINE land cover (CLC), land use capability class (LUCC) and the distance from power lines (DFPL). These criteria are described in the following sections, specifying their relevance with respect to the development of agrivoltaic systems.
2.3.1. Solar Radiation
Solar radiation is defined as the amount of solar energy reaching a point at the surface of the earth. Several factors can affect the amount of solar radiation such as longitude, latitude, humidity, temperature, evaporation, and the sun’s angle. Solar radiation is one of the most essential criteria since it determines the output electricity generation from the solar PV systems. Thus, for realising an agrivoltaic system, it is important to characterise the installation site with respect to the solar radiation. In particular, the amount of solar radiation incident on the PV array is represented by the value of global horizontal irradiance per year (kWh/m2). GHI is the total amount of microwave radiation received by a horizontal surface on the ground. This value includes both direct normal radiation (DNI) and diffuse horizontal irradiance (DHI). The locations with values less than 900 kWh/m2/year have been excluded for this study.
2.3.2. Annual Average Air Temperature
Temperature has a significant impact on the solar PV panel operating efficiency. A 1 °C increase in temperature can decrease the panel efficiency by 0.6% when temperatures exceed 25 °C. During hot summer months when the PV panel efficiency is known to plateau and become less productive, agrivoltaic systems vegetated with cropping systems or native habitat can create cooler microclimates under the PV panels, improving the PV panel life and performance [
24]. As an example, in agrivoltaic systems utilising bifacial PV modules, the undersides of the PV panels may utilise greater reflectance from vegetation, leading to increased energy production [
25].
2.3.3. Solar Radiation Reduction by PM2.5
Fine particulate matter (PM2.5) is a complex mixture of solids and aerosols with a maximum diameter of 2.5 micrometres. Particulate matter is mainly emitted by combustion processes as well as vehicular traffic and residential combustion plants.
A number of scientific papers have reported on air pollution effects on photovoltaic energy generation and, notably, on the relationship between the reduction in solar insolation reaching the PV systems and PM2.5 concentrations in the air [
26,
27].
Such a study was carried out by the authors with the scope of quantifying the effects of the PM2.5 in the air on the solar insolation in the city of Naples (South Italy). An empirical relationship between the PM2.5 concentrations and the reduction in solar insolation was found using local high-frequency insolation and pollution data [
28,
29,
30].
For our scopes, this factor has been estimated for the entire Campania. It has been found that the annual PM2.5 pollution recorded across the region causes an insolation reduction of between 3% and 8% [
24].
2.3.4. Elevation
The land elevation from sea level affects the amount of solar radiation reaching the ground. Regarding energy production, the higher the elevation of the installation site, the lower the atmosphere thickness and atmospheric load by aerosols, which increases the solar radiation received.
On the other hand, land elevation affects the variation in plant coverage by causing temperature changes. Product diversity decreases at higher elevations. From the literature, it is known that at elevations between 300 and 700 m, a large variety of vegetables and fruits, particularly olives, can be cultivated [
31]. At elevations up to 2000 m, it is not possible to cultivate economic and agricultural products other than grains and fodder crops. Based on these considerations, the elevations up to 300 m have been evaluated from moderately to highly suitable, taking more account of energy production. The maximum elevation of the study area is 1896 m from sea level.
2.3.5. Slope
This topographic parameter influences both the agricultural practice and the technical feasibility of the PV plant co-developed on the same land. In fact, slope limits agricultural production by negatively affecting the soil properties as well as by restricting the possibility of using machines and management applications (i.e., soil tillage, irrigation and drainage). On the other hand, slope influences both the optimality conditions for orientation and inclination of the PV modules (mounted on the ground between the crops). For low slopes, the terrain orientation is irrelevant because it can be easily compensated by the support structures of the PV panels, whereas on steeper slopes, the orientation of the ground is a constraint and the solar power plants should be built only on the south-oriented terrains. In addition, when installing PV systems in steep sloped areas, problems related to soil erosion, drainage systems and the stability of the terrain foundation have to be addressed, making the installation work more difficult and expensive. In the literature, the maximum slope that makes the plant installation technically feasible is fixed at 15% [
32].
Combining optimal land slope and land aspect conditions, we have considered that the locations to be excluded verify one of the following conditions: (1) the terrain is not south-facing (i.e., east-, southeast-, west-, or southwest-facing) and the slope is greater than 3%; or (2) the terrain is south-facing and the slope is greater than 15%.
2.3.6. Aspect/Orientation
This topographical factor is critical for land eligibility for agrivoltaics. In the northern hemisphere, south-facing is considered to be optimal for PV installations. However, southeast and southwest facing are also assessed optimal in conjunction with a maximum tilt angle of PV modules of 30 degrees in a fixed configuration.
As regards the agricultural practices, for maintaining their physiological activities, the plants need sun exposure at certain intervals. In general, in south and west orientations, they receive sunlight for a substantial portion of the day. Hence, south/west facing are regarded as optimal for agricultural lands as well.
2.3.7. Water Deficit
Taking into account the benefits across the crop–energy–water nexus, the plant water deficit parameter has been considered as a suitability criterion for agrivoltaics. Plant water deficit is commonly defined as being when the plant water status is reduced sufficiently to affect normal plant functioning (e.g., plant growth, stomata conductance, rate of photosynthesis, etc.).
Plant water deficit may occur as a consequence of a seasonal decline in soil water availability, developing in the long term, or may result from a high atmospheric evaporative demand. An increased evaporative demand of the atmosphere, occurring mostly on a daily basis, affects the total carbon gain by the crops, even irrigated ones. Strategies to control the water status of plants are numerous. Among others, shading can be used to reduce excessive solar radiation reaching plants. Incorporating PV into agriculture, the shading caused by the PV modules can help in alleviating water evaporation during the summers and proves beneficial especially in the dry season. It was observed that shading resulted in water savings in the range of 19–47% depending on the level of shade [
33].
This criterion is evaluated as:
where WD is water deficit, PET is the potential evapotranspiration and AET is the actual evapotranspiration.
Based on the above reasoning, the lands affected by higher water deficit are evaluated as benefiting more from the agrivoltaic systems and, therefore, these systems have the potential to save water, especially in water-limited systems.
2.3.8. Land Use and Cover
Based on the current state of research, all types of crops are generally suited for planting under an agrivoltaic system. However, different effects on the yield have been investigated essentially due to the shading effect. Highly shade-tolerant crops such as lettuces, tomatoes, saffron, kale, broccoli, eggplant, peppers, etc., as well as field forage (grass/clover mixture), various types of pomaceous and stone fruits, berries, soft fruits, and other special crops (such as wild garlic, asparagus, and hops) appear to be particularly suitable for agrivoltiac systems [
25,
34]. Emerging research is examining how photovoltaic systems can be integrated with more traditional shade-intolerant commercial crops such as corn, soybeans, and wheat [
5]. More generally, permanent and special crops, arable farming and grassland can benefit from the presence of PV modules on the same area of land.
However, in these applications, there can be additional considerations such as increasing the PV panel height as well as the spacing between rows of PV panels for designing solar systems that can accommodate traditional cropping systems [
35].
On the basis of these insights derived from the experimental agrivoltaic plants developed so far across several European countries as well as hearing experts’ opinions, specific agriculture and pasture areas potentially eligible for agrivoltaic installations have been selected. It should be noted that as a detailed crop inventory was not available, the classification of the European inventory CORINE Land Cover (CLC) [
36] was adopted. The CLC inventory provides consistent and thematically detailed information on land cover/use across Europe according to a nomenclature including 44 classes (on level 3) in five main land cover/use groups: artificial surfaces, agricultural areas, forests and seminatural areas, wetlands and water bodies.
For our scopes, nine classes have been selected within the Agricultural Areas group as shown in
Table 1, including: (1) arable lands (class 2.1; subclasses 2.1.1–2.1.3) under a rotation system used for annually harvested plants and fallow lands, non-irrigated or permanently irrigated, containing cultivated herbaceous plants and low-growing shrubs like cereals, root crops, leguminous crops, vegetables, oil crops, fodder crops, asparagus and chicory, strawberries, textile plants, tobacco, sugar cane, flowers among others; (2) permanent crops (class 2.2; subclasses 2.2.1–2.2.3) including extensive fruit orchards, olive groves, chestnut groves, walnut groves, and shrub orchards such as vineyards; (3) pastures (class 2.3), meadows and other permanent grasslands under agricultural use; and (4) heterogeneous agricultural areas (class 2.4; sub-classes 2.4.1–2.4.3) including areas of annual crops associated with permanent crops on the same parcel, areas of annual crops, meadows and/or permanent crops which are juxtaposed, landscapes in which crops and pastures are intimately mixed with natural vegetation or natural areas.
2.3.9. Land Use Capability Class
For the determination of the lands suitable for agrivoltaic installations, in addition to the parameter/criteria of land use and cover, the parameters of the land use capability class (LUCC) and land use capability sub-class (LUCS) have been used. This classification was elaborated in 1961 by the Soil Conservation Service of the Department of Agriculture of the United States and adopted by the Food and Agriculture Organization (FAO) in 1974.
Soil classification systems were created to aid the estimation of the conditions in which the soils were formed and the behaviours of the soils. Soil behaviours help in estimating the soil performance for agricultural production.
There are two main reasons for using these parameters in this study. The first one is that these parameters allow the selection of the soils with an optimal agricultural productive potential. The second one is that these soils are classified on the basis of characteristics such as low–moderate slope or exposure to a low–moderate level of erosion and flooding hazard, which are factors enabling the PV installations.
The LUCC classification includes eight classes [
37] though only the first six classes (i.e., Class I–Class VI) are considered in our decision-making process for their soil characteristics, which can favour the agrivoltaic installations. These classes are described in
Table 2. The Class VII and VIII lands are instead excluded for their adverse soil characteristics.
The land use capability sub-class (LUCS) is the second category of land use capability class. Sub-capability classification is made based on the constraining factors in the land capability classification. These sub-classes are expressed through the use of the symbols such as: (e) where the constraining factor is erosion or sensitivity to erosion; (w) for poor drainage, a wetness problem, high ground water or flooding; (s) for root area constraints. These symbols are combined (e.g., es, se, sw, etc.) when more than one constraint exists and are given following the capability class (e.g., I, IIe, IIIse, IVws, VIes, etc.). It is evident that the addition of these constraining factors impacts negatively on the soil performance for the agrivoltiac installations.
2.3.10. Distance from Power Lines
The location of power transmission lines from PV systems is an important criterion in siting solar farms, though in the opinion of the experts, it has to be considered, more properly, a feasibility criterion. However, the closeness of PV systems to power transmission lines reduces the transmission power losses and decreases the cost of constructing new transmission lines near the PV installations. In this study, the optimal distance from power transmission lines is selected between 0 and 3 km.
2.3.11. Protected/Unsuitable Areas
All national and regional natural park areas subject to protection constraints by national law 394/91 (source data: Siti Protetti) along with all areas of NATURA 2000 including areas set aside for the conservation of biodiversity in the European countries (set up by the Habitats Directive) for the conservation of natural and seminatural habitats and of wild flora and fauna have properly been excluded in the decision process of site suitability. In these excluded areas, there are additional areas subject to constraints established by specific ongoing national/regional laws on the exploitation of agrivoltaics in the regional territory.
2.4. Weighting Criteria
Criteria involved in the site suitability decision process are assigned specific weights through the AHP method.
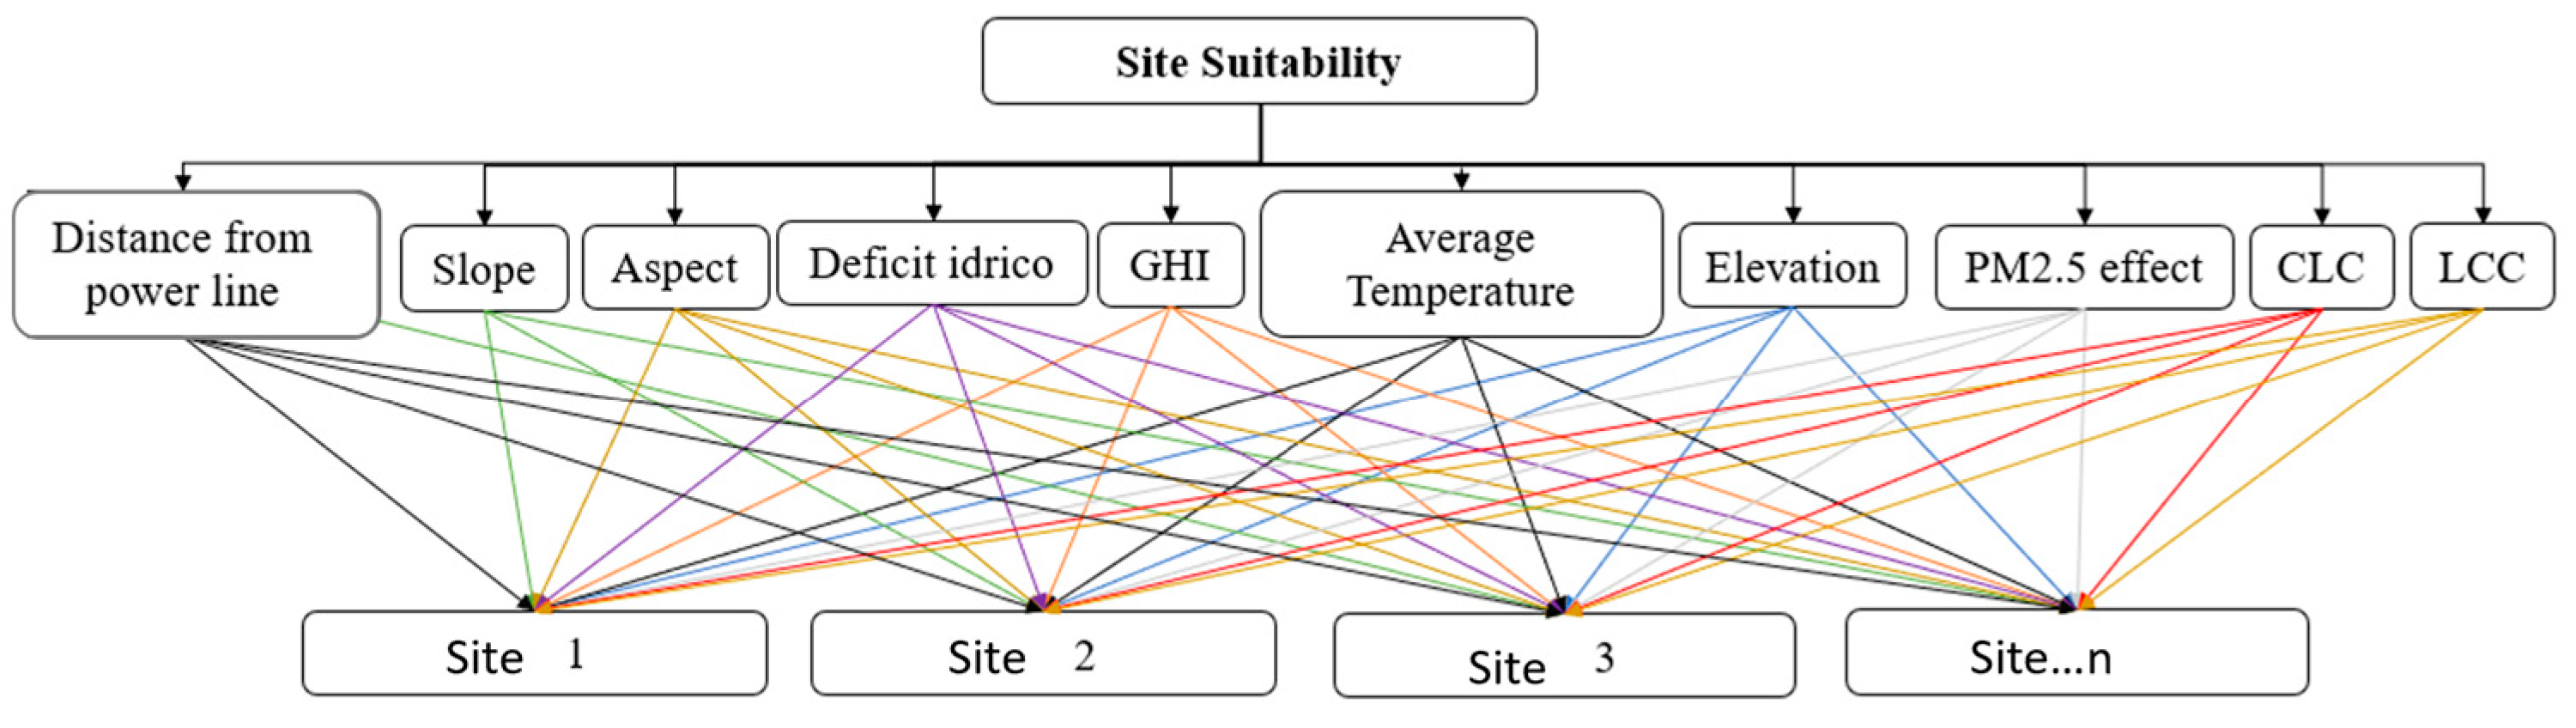
The first step of the AHP method concerns the hierarchical articulation of the elements constituting the decision problem: goal, criteria, sub-criteria, and alternatives.
Figure 3 shows the hierarchical structure of the elements related to land suitability analysis. The hierarchy is made up of only three levels: the specified objective, the selected (sub-)criteria, and the alternatives. It is worth noting that applying the spatial AHP method as in our study, the alternatives are located and geographically represented on each criteria map in the form of square cells of a grid.
The next step consists in the pairwise comparison of the criteria and sub-criteria. The pairwise comparison of criteria has been developed using the scale defined by Saaty, which is shown in
Table 3. This semantic scale allows qualitative judgements to be made with respect to the elements compared. A value of 1 indicates that the two elements have equal weight, while a value of 9 emphasises the extreme importance of one element over the other.
The comparison results in a C
x matrix as shown in Equation (1).
The matrix is organised into n × n, where n represents the rank of the matrix, i.e., the number of criteria compared. Cx = |Cij| ∀ i, j = 1,2,…, n for n criteria that influence the objective of the study, where Cij demonstrates the relative importance of the criteria Ci over Cj. The matrix is:
Square: with a size equal to the number n of (sub-)criteria compared;
Positive: (Cij > 0 ∀ i,j = 1,2…n) with elements equal to 1 on the main diagonal (Cii = Cjj =1 ∀ i,j = 1,2…n);
Reciprocal: (Cij = 1/Cji).
The comparison matrix here has been performed involving a group of five experts: one agronomist, two scientists with expertise in PV technologies, and two scientists with transversal skills on landscape and PV technologies. The experts have given their judgment on the relative importance of the selected criteria using the Saaty scale shown in
Table 3 and motiving it.
The comparison matrices filled by the experts are shown in
Table 4. Analysing these matrices, it can be seen that the opinion of the experts is often conflicting. To achieve a unique evaluation of the priorities, the geometric mean of the individual judgments has been calculated. This is the option provided by the AHP method in order to overcome the lack of consensus and compromise on the priorities within the group decision process [
38].
The pairwise comparison matrix resulting from the geometric mean is shown in
Table 5.
The final steps to be performed applying the AHP method are the calculation of the weight vector and the inconsistency level.
The i-th element of this vector is obtained by calculating the arithmetic mean of each row of the normalised matrix C
x [
22]. The weight vector is expressed in %.
The consistency level of the pairwise matrix is expressed by the calculation of consistency ratio (CR). CR is given by the ratio between the consistency index (CI) and the random consistency index (RCI). CI is given using Equation (2):
where
λmax is the maximum eigenvalue of the comparison matrix and n is the number of criteria. The index RCI depends on the number n of criteria according to
Table 6.
The consistence check of the calculated pairwise matrix is satisfied if CR assumes one of these values: CR < 5% (n = 3); CR < 9% (n = 4); CR < 10% (n > 4).
The weight vector associated to the resulting pairwise comparison matrix and the CR value are shown in
Table 5. It can be seen that the calculated pairwise comparison is consistent (CR = 0.8, n = 10). It is interesting to note that among criteria with a greater weight, solar radiation, temperature and land slope can affect both energy and agricultural production.
2.5. Land Suitability Mapping
In order to produce the map of the suitable lands for the agrivoltaic systems at a regional level, a number of geo-information datasets covering the case study of Campania have been collected to cover the selected criteria involved in the proposed spatial multicriteria analysis.
Table 7 shows the collected geospatial data and the source from which the data are acquired.
Using these geospatial datasets, the selected criteria have been performed as map layers by utilising GIS software (i.e., ESRI ArcGIS Pro 3.1.0).
Then, they have been normalised and classified in five ranks of suitability (1—very low, 2—low, 3—moderate, 4—high, and 5—very high) according to the experts’ opinions (
Table 4 and
Table 5) and previous studies [
19,
21].
The map layers have been generated in a raster format with a spatial resolution of 30 m × 30 m. Resample tools have been used for converting the spatial resolution of every map layer to 30 m.
In
Figure S2, the map layers are categorised into relative class ranges, as specified in
Table 8. The class ranges are mostly set at equal intervals.
The solar radiation map (GHI map) (
Figure S2a) indicates that most lands lay in high and very high levels of solar radiation, which ensures the significant potential to initiate agrivoltaic systems around the region. The higher the levels of GHI reaching the ground, the higher the suitable ranks defined to prioritise lands for agrivoltiac installations, given the assumption that higher GHI values involve higher energy production with the (agri-) photovoltaic systems.
The temperature map in
Figure S2b indicates the different levels of annual average temperature across the region. The lower the levels of annual average temperature, the higher the suitable ranks defined to prioritise lands for agrivoltiac installations, based on the assumption that high ambient temperature can negatively affect the performance of (agri-)photovoltaic systems.
The map in
Figure S2c indicates the variation in insolation reduction by PM2.5 across the region generated according to the empirical relation investigated in [
25]. It is evident that the lower the insolation reduction estimates, the higher the suitable ranks assigned to prioritise lands for agrivoltiac installations.
The land elevation map in
Figure S2d shows the classified digital elevation model (DEM) according to specified class ranks based on the plain, hill and mountain elevations. The higher the land elevation, the higher the suitable level assigned. The underlying assumption is that the higher the elevation, the lower the interference of the atmosphere on incoming solar radiation.
The aspect map in
Figure S2e shows the land aspect across the region according to specified class ranks. This map has been generated by processing the DEM layer extracting the direction of the downhill slope faces. South-facing along with south-east- and south-west-facing are here assigned higher suitable ranks, being evaluated as optimal for PV installations in the northern hemisphere.
The gradient and steepness of the terrain can affect the placement, orientation, and stability of photovoltaic modules. The slope map has been generated from DEM using surface analysis algorithms. Combining this map with the aspect layer, the terrain conditions can positively affect the design, operation and maintenance of the (agri-) photovoltaic installations extracted. The slope map in
Figure S2f shows the slopes less than or equal to 3% and southerly exposed as well as exposed in all other directions (except north-facing). Also, the slopes up to 15% and only southerly exposed are mapped. More details about these assumptions have been specified in
Section 2.3.
Based on the considerations we have made up to now, the lower the land slopes, the higher the suitable ranks defined to prioritise lands for agrivoltiac installations. The constrained slope map indicates that the most land lays in the higher levels of suitability in relation to combined slope and aspect criteria.
The water deficit map in
Figure S2g indicates that most lands do not suffer from water deficit. However, the lands affected by higher water deficit are evaluated as benefiting more from the agrivoltaic systems and higher ranks are assigned to them. The range values have been defined by the Jenks natural breaks optimisation method [
39].
The land use map in
Figure S2h represents the land area categories selected from the CLC dataset as suitable for agrivoltaic installations. The selection criteria have been specified in the in
Section 2.3.
The relevance of these classes to promote agrivoltaic installations has been expressed assigning ranks as higher to indicate that more benefits that the crops can obtain from shading by the agrivoltaic systems are significant, as is the protection by environmental influences. In particular, as shown in
Table 8, while a very high rank has been given to permanent crop classes (sub-classes 2.2.1–2.2.3) that are positively affected from partial shading by PV modules (e.g., wind growing, orchards), high rank has been given to arable land classes considering that in dry years, the positive effect by the agrivoltaic systems on the yield is proved to be particularly significant, while in normal years with high precipitation levels, yield reductions should not exceed 20%. Intermediate rank has been assigned the pasture class (sub-class 234) considering that the dual use of PV systems with sheep farming is commonly practiced and the expected synergy effects tend to be low compared to other agrivoltaic systems. Lower scores are assigned to the heterogeneous agricultural land classes (sub-classes 2.4.1–2.4.3) considering that the development of agrivoltaic systems in these areas could be more difficult.
The LUCC map in
Figure S2i represents the distribution of the land use capability classes around the region evaluated as valid for agrivoltaic installations. The map indicates that the most lands lay in the third and fifth classes with constraining factors
s and
e. The relevance of these classes to promote agrivoltaic installations has been expressed assigning ranks as higher as the lands are more suitable for agricultural production.
Finally, the distance from power lines map in
Figure S2l indicates the different buffer areas around the vector layer of the power lines. The higher the distance from the power lines, the lower the suitable ranks assigned to prioritise lands for agrivoltiac installations.
3. Spatial Sensitivity Analysis
A spatial sensitivity analysis of the criteria weights involved in the land suitability analysis has been performed for evaluating the dependency of proposed GIS-AHP model output on the weights of input parameters and identifying criteria that are especially sensitive to weight changes and to show the impacts of changing criteria weights on the model outcomes in the spatial dimension [
40,
41,
42].
In the sensitivity analysis, a common approach is to change input factors one at a time, better known as the OAT method [
43,
44], to see what effect this produces on the output. This appears to be a logical approach as any change observed in the output will unambiguously be due to the single factor changed [
43]. By changing one factor at a time, all other factors can be fixed, to a great extent, to their central or baseline value. This makes the comparability of the results possible.
In our case, the criteria weights are changed within a specific range aimed at: (1) assessing the stability of the resulting suitability map by introducing a known amount of change to criteria weights; (2) identifying those criteria that are especially sensitive to weight changes; and (3) visualising the spatial change in the resulting map.
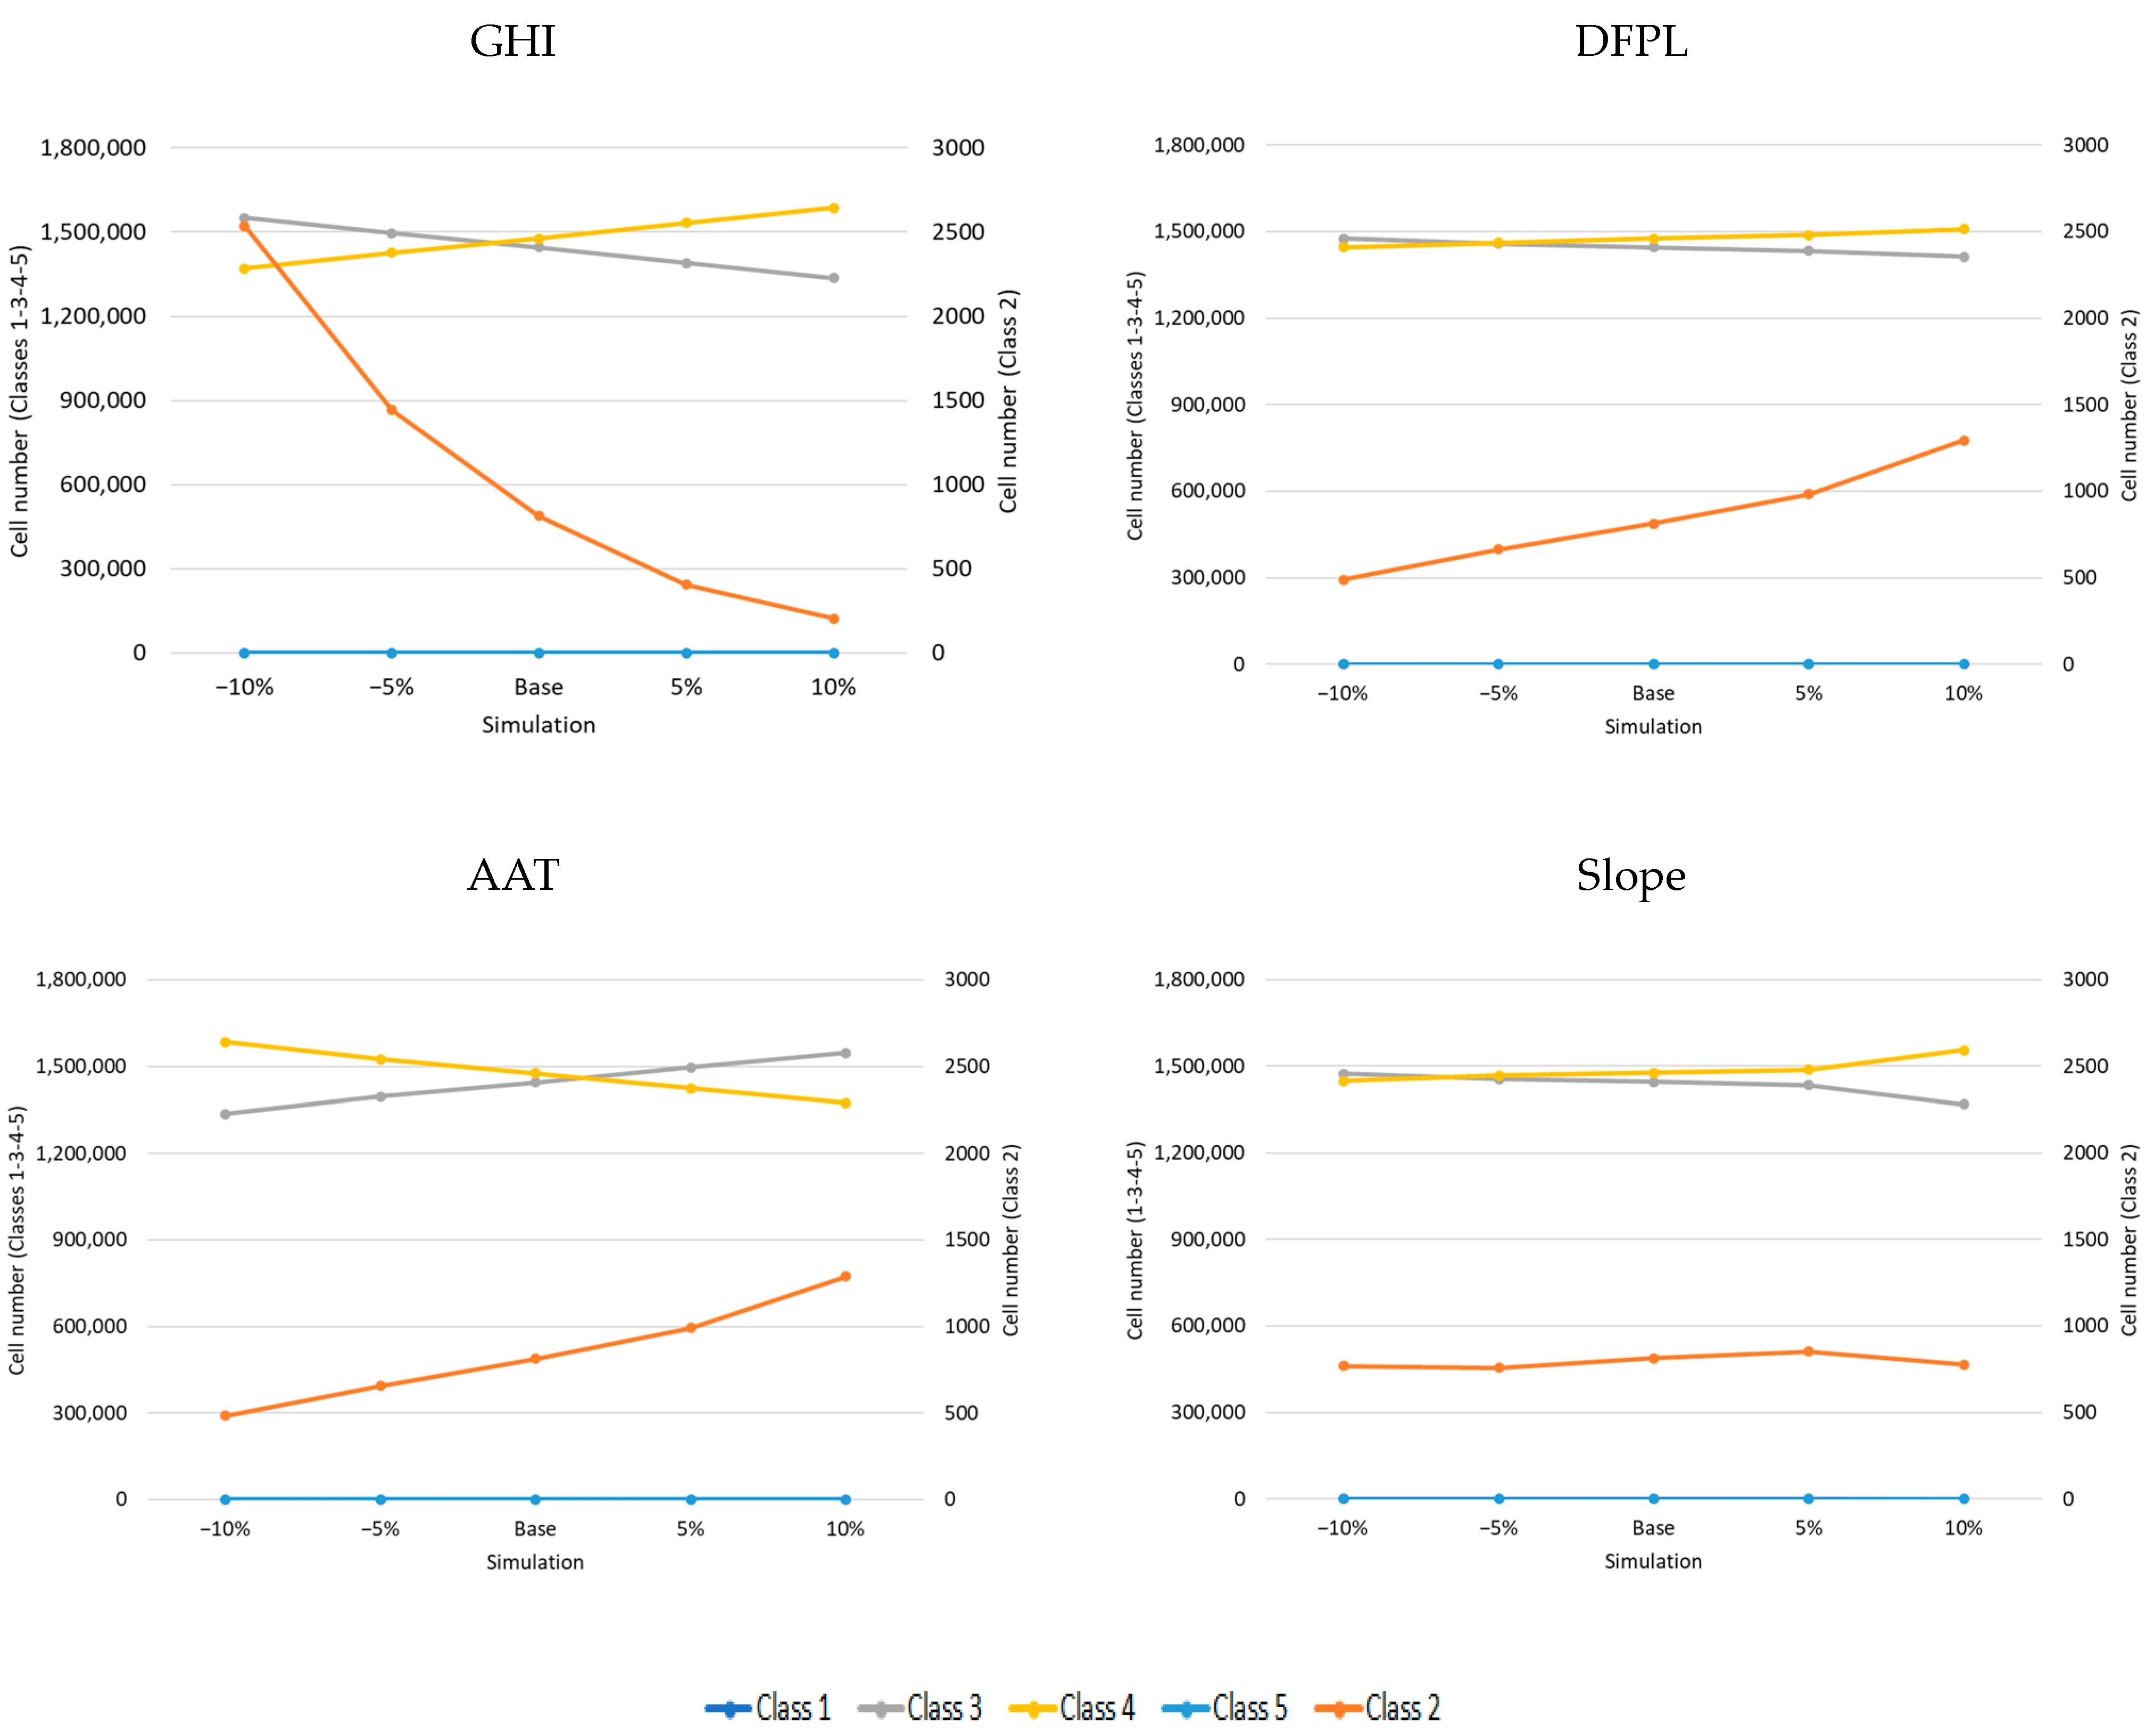
To do so, the first four criteria with a higher weight (i.e., global solar irradiance, distance from power lines, annual average temperature, and slope) have been chosen to be performed in the spatial sensitivity analysis. We have selected these criteria for their major relevance in determining the land eligibility.
For each selected criterion, the criteria weights have been altered in percent (plus or minus 5%) increments within the range of −10% to +10%. Changing the weight of one criterion, the weights of the other criteria are adjusted proportionally to satisfy the additivity constraint of the AHP that requires all criteria weights to sum to one. So, sixteen simulations were run and generated sixteen raster map layers, each classified into the five fixed suitability levels (C1—very low, C2—low, C3—moderate, C4—high, and C5—very high). These raster layers are compared with the related base map layers.
Table S1.1–1.4 show the changed weight vectors associated to the different simulation runs for each chosen criterion.
Table S2.1–2.4 show the cell distribution within suitability classes for each simulation run compared with the cell distribution of the base run. The graphs of
Figure 4 show the results from 16 simulations (4 for each criterion).
From the graphs, we can observe that most cells of each selected criterion move up one suitability class/level from their original rank from the base run, which is most evident between classes 3 (moderate) and 4 (high).
Then, comparing the graphs related to the criteria DFPL and Slope, we can see that the cell distribution is largely stable for all classes, while for GHI, the cell distribution decreases for classes 2 (low) and 3 (moderate) and increases for class 4 (high). Regarding the AAT criterion, we can see a cell distribution that increases for class 3 while decreasing for class 4. Instead, it is relatively consistent for class 2.
The GHI and AAT criteria essentially have the highest sensitivity with significant changes for classes 3 and 4 (moderate and high suitability), especially if they are compared with the base simulation. However, they cause variations in the suitability classification in terms of the number of cells and, hence, the total surface, which are not very significant (≤ 8%), being lower than the maximum variation percentage in the weights.
It can be concluded that the weight vector, resulting from the application of the GIS-AHP method, here defined, is stable with respect to variations up to ±10%, determining changes in the class distribution of more than 8% corresponding to the most weighted criteria. The criteria most sensitive to changes in weights are GHI and AAT, which are among the most weighted criteria.
4. Results
4.1. Suitable Eligible Land Map
In order to estimate the suitable eligible land for agrivoltaic systems in the Campania region, using a spatial overlay analysis, the criteria map layers, properly ranked and weighted, have been combined according to a land suitability index for agrivoltaic systems, defined by the following equation (unsuitable areas have been excluded):
where
is the
criteria map layer,
is the total number of criteria map layers,
is the weight associated to the
criteria map layer, and
is the
ranked criteria map layer.
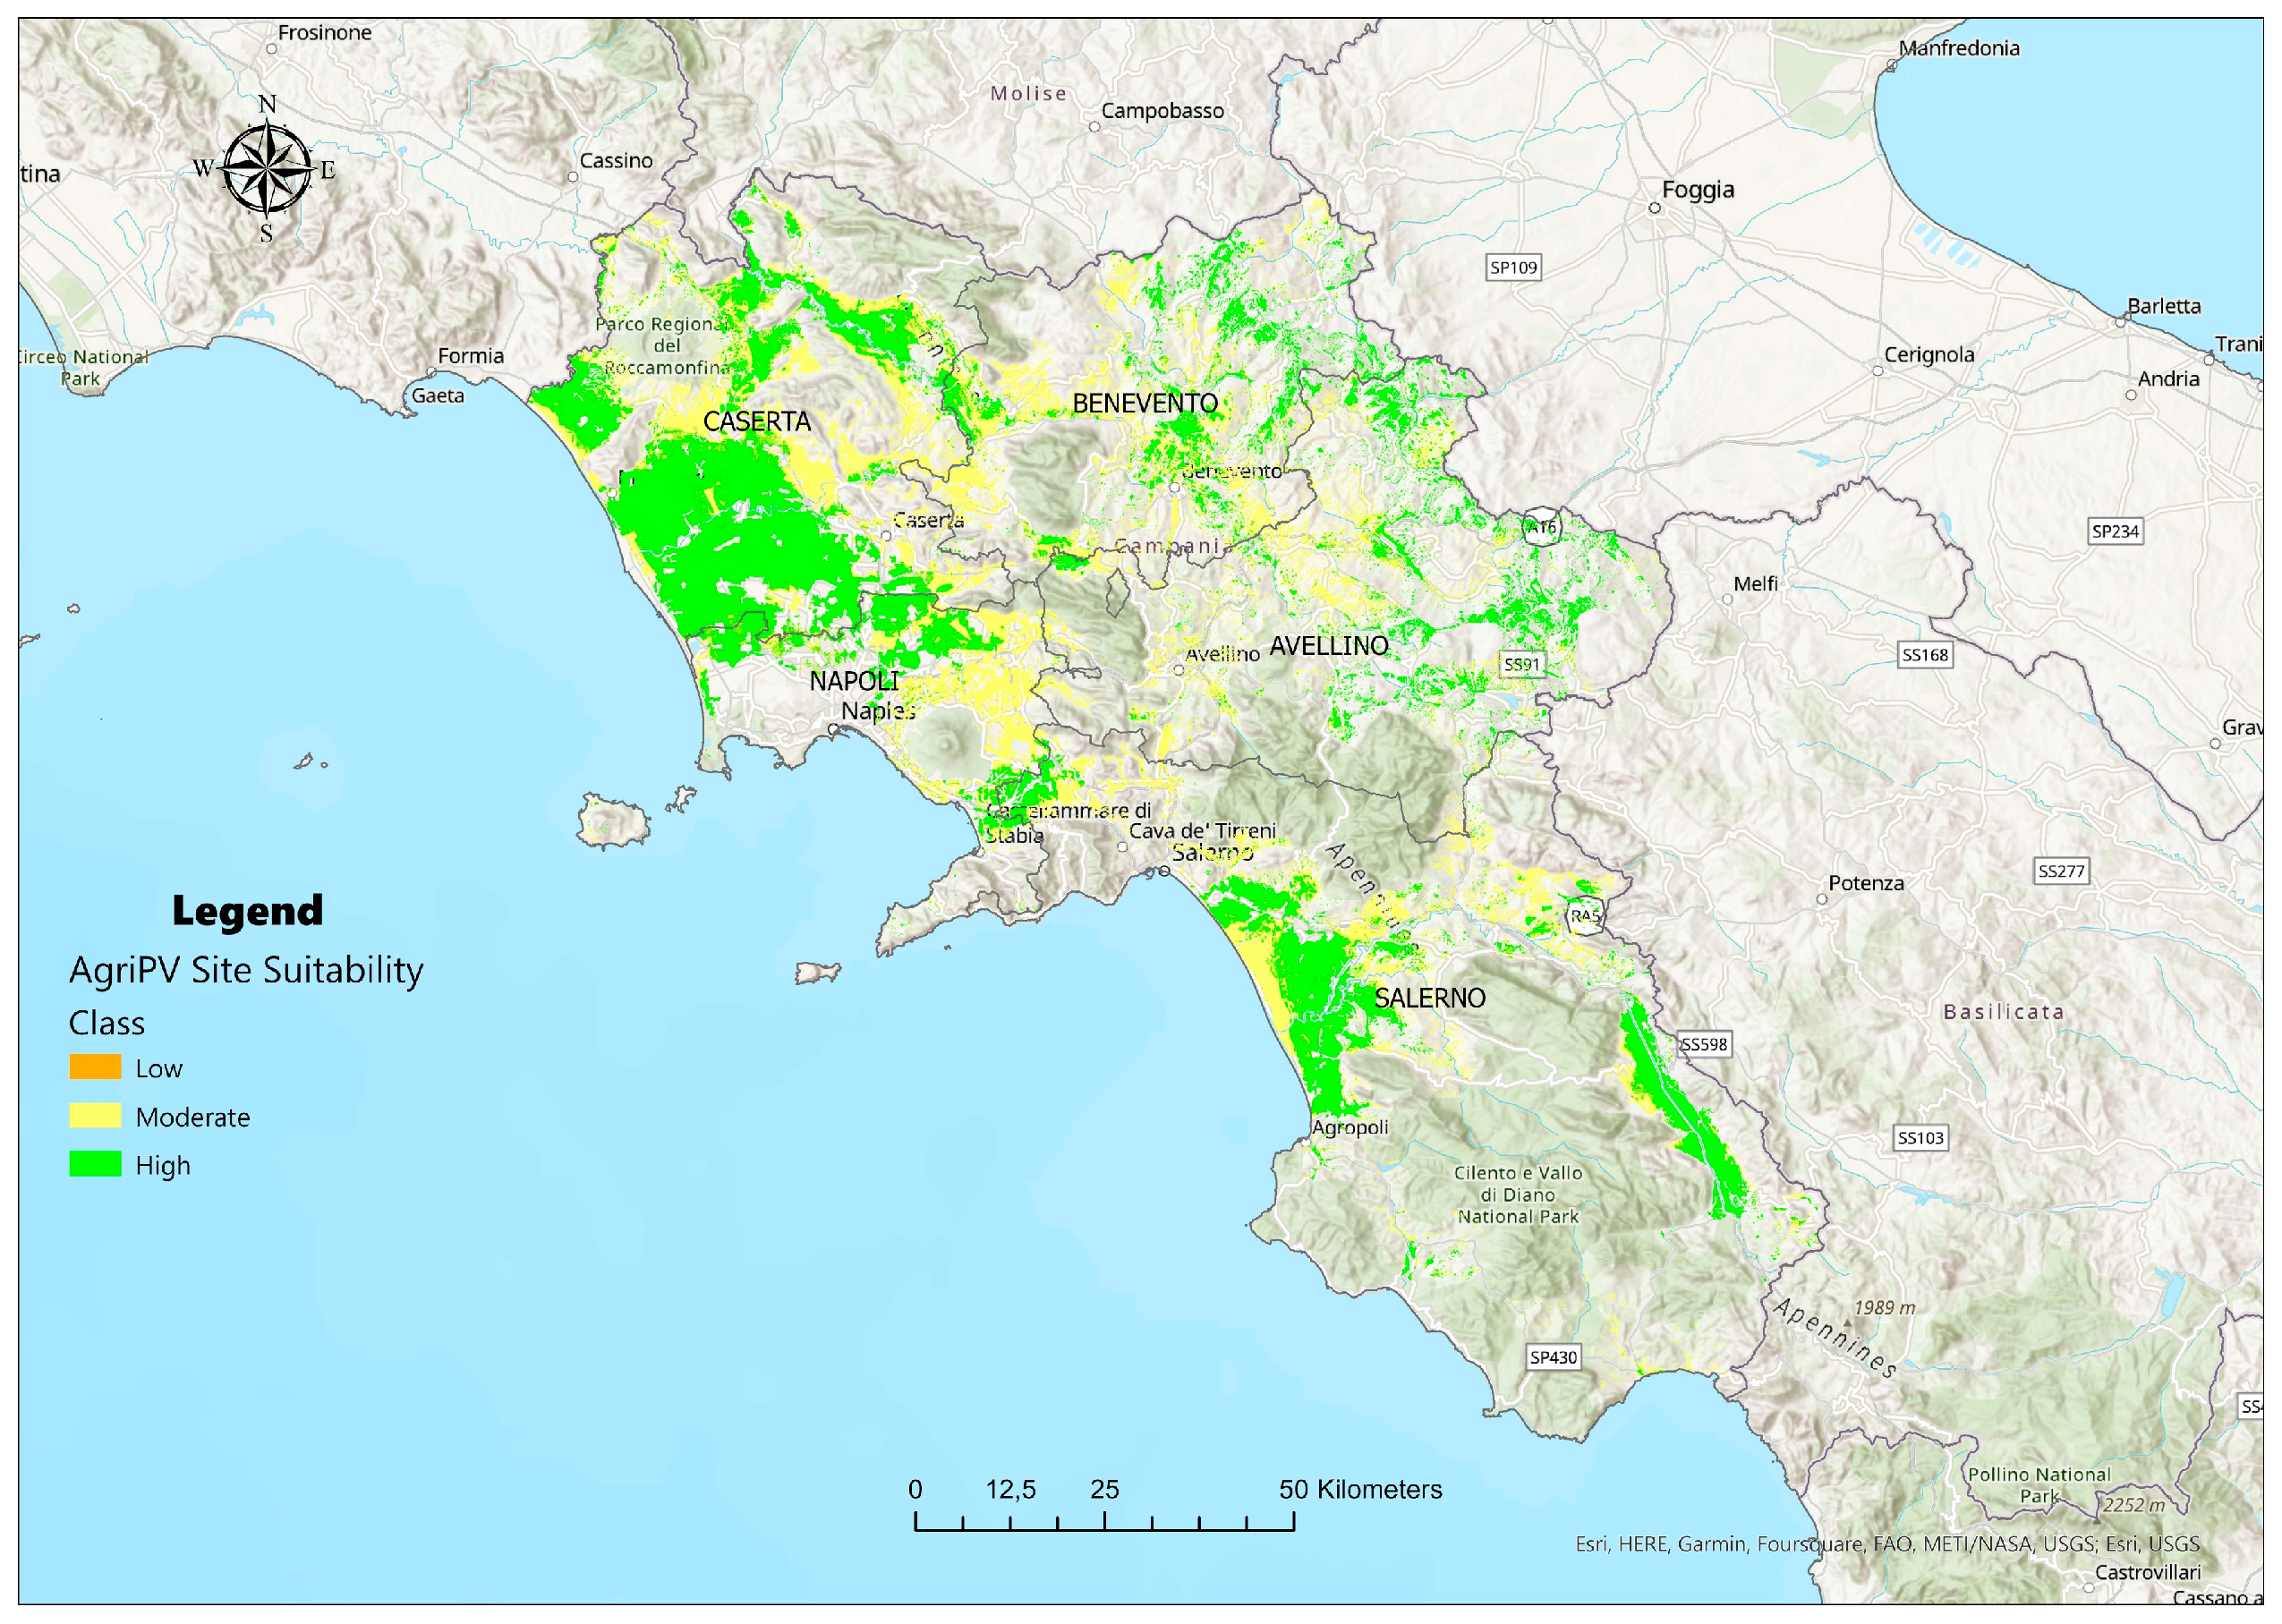
The resulting map is the land suitability map for agrivoltaic systems in the Campania region (
Figure 5), classified into five levels of suitability (very low, low, moderate, high and very high). These levels represent the different priorities to allocate agrivoltaic systems. It is noted that there are not lands categorised as very low or very high in suitability.
4.2. Eligible Area and Potential
According to the resulting map, the suitable eligible lands for agrivoltaic systems in Campania represents 25% of the total land of Campania, corresponding to 342,305 ha.
The most suitable lands are evaluated to be highly and moderately suitable. They represent 52% and 47%, respectively, of the total suitable lands. The other 1% of suitable land is low in suitability.
The suitable lands appear to be sparsely distributed in the northeastern part of the region while appearing to be concentrated in the southern (i.e., Piana del Sele, Vallo di Diano) and northwestern parts (i.e., Piana Campana). Across the five provinces—Caserta, Salerno, Benevento, Avellino, and Napoli—the share of suitable land is between 11 and 36%. The provinces of Caserta and Salerno have higher percentage of suitable lands with 36% and 23%, respectively, followed by Benevento with 16%, Avellino with 14% and finally Naples with 11% (
Table 9).
As shown in
Table 10, the class of arable lands (CLC 2.1) has a higher percentage of suitable lands with 55% (corresponding to 188,268 ha), including non-irrigated or permanently irrigated lands with 36% and 19%, respectively. The latter contain mainly cultivated herbaceous plants and low-growing shrubs like cereals, root crops, leguminous crops, vegetables, oil crops, fodder crops, asparagus and chicory, strawberries, textile plants, tobacco, sugar cane, and flowers, among others.
The lands used for permanent crops (CLC 2.2), including extensive fruit orchards, olive groves, chestnut groves, walnut groves, and vineyards, cover 17% of suitable lands (58,192 ha). Within this class, the fruit trees occupy a higher percentage of suitable lands with 16% (54,769 ha), while the olive groves cover only 1% (3423 ha).
The suitable areas used for annual crops associated with permanent crops on the same parcel (classified as heterogeneous agricultural areas according to CLC 2.4) cover about 28% while the suitable lands used for pastures (CLC 2.3) cover only 1%, corresponding to 3423 ha of the regional agricultural territory.
From a wide variety of realised agrivoltaic projects, the obtained range for the installed PV power is between 0.2 and 0.9 MW/ha, depending on the system design (see [
1,
5,
45], among others). The capacity potential (in GW) for agrivoltaic systems is here estimated by considering the calculated suitable area and assuming a capacity density of 600 kW/ha, as also indicated in [
7]. So, the maximum capacity potential for agrivoltaic systems achieved represents approximately 205 GW for the Campania region.
In this case, assuming a land coverage percentage of 1.6% of the identified suitable lands, the agrivoltaic potential of the installed capacity that could be achieved corresponds to the 4 GW target, assigned in the region for contributing to reach the national 80 GW target for PV, derived by Fit-for-55 and RePowerEU packages [
46,
47].
Table 11 shows the capacities that could be achieved for the identified suitable lands categorised as arable land, permanent crops and permanent grassland and meadow assuming that 10% and 5% of their areas are covered with agrivoltaic systems.
It is worth noting that the potential of installed capacity is at the GW scale for the main land categories of arable land and permanent crops both if they are covered by 10% and only 5% with agrivoltaic systems. Instead, the potential is at the MW scale for the pasture land category.
4.3. Extension of the Analysis to Italy
The spatial multicriteria analysis developed here for the Campania region was extended to the national level considering the NUTS-2 region for determining which agricultural lands across the entire country are suitable for agrivoltaic systems.
Thus, the eligibility area and potential for agrivoltaic systems have been estimated region by region.
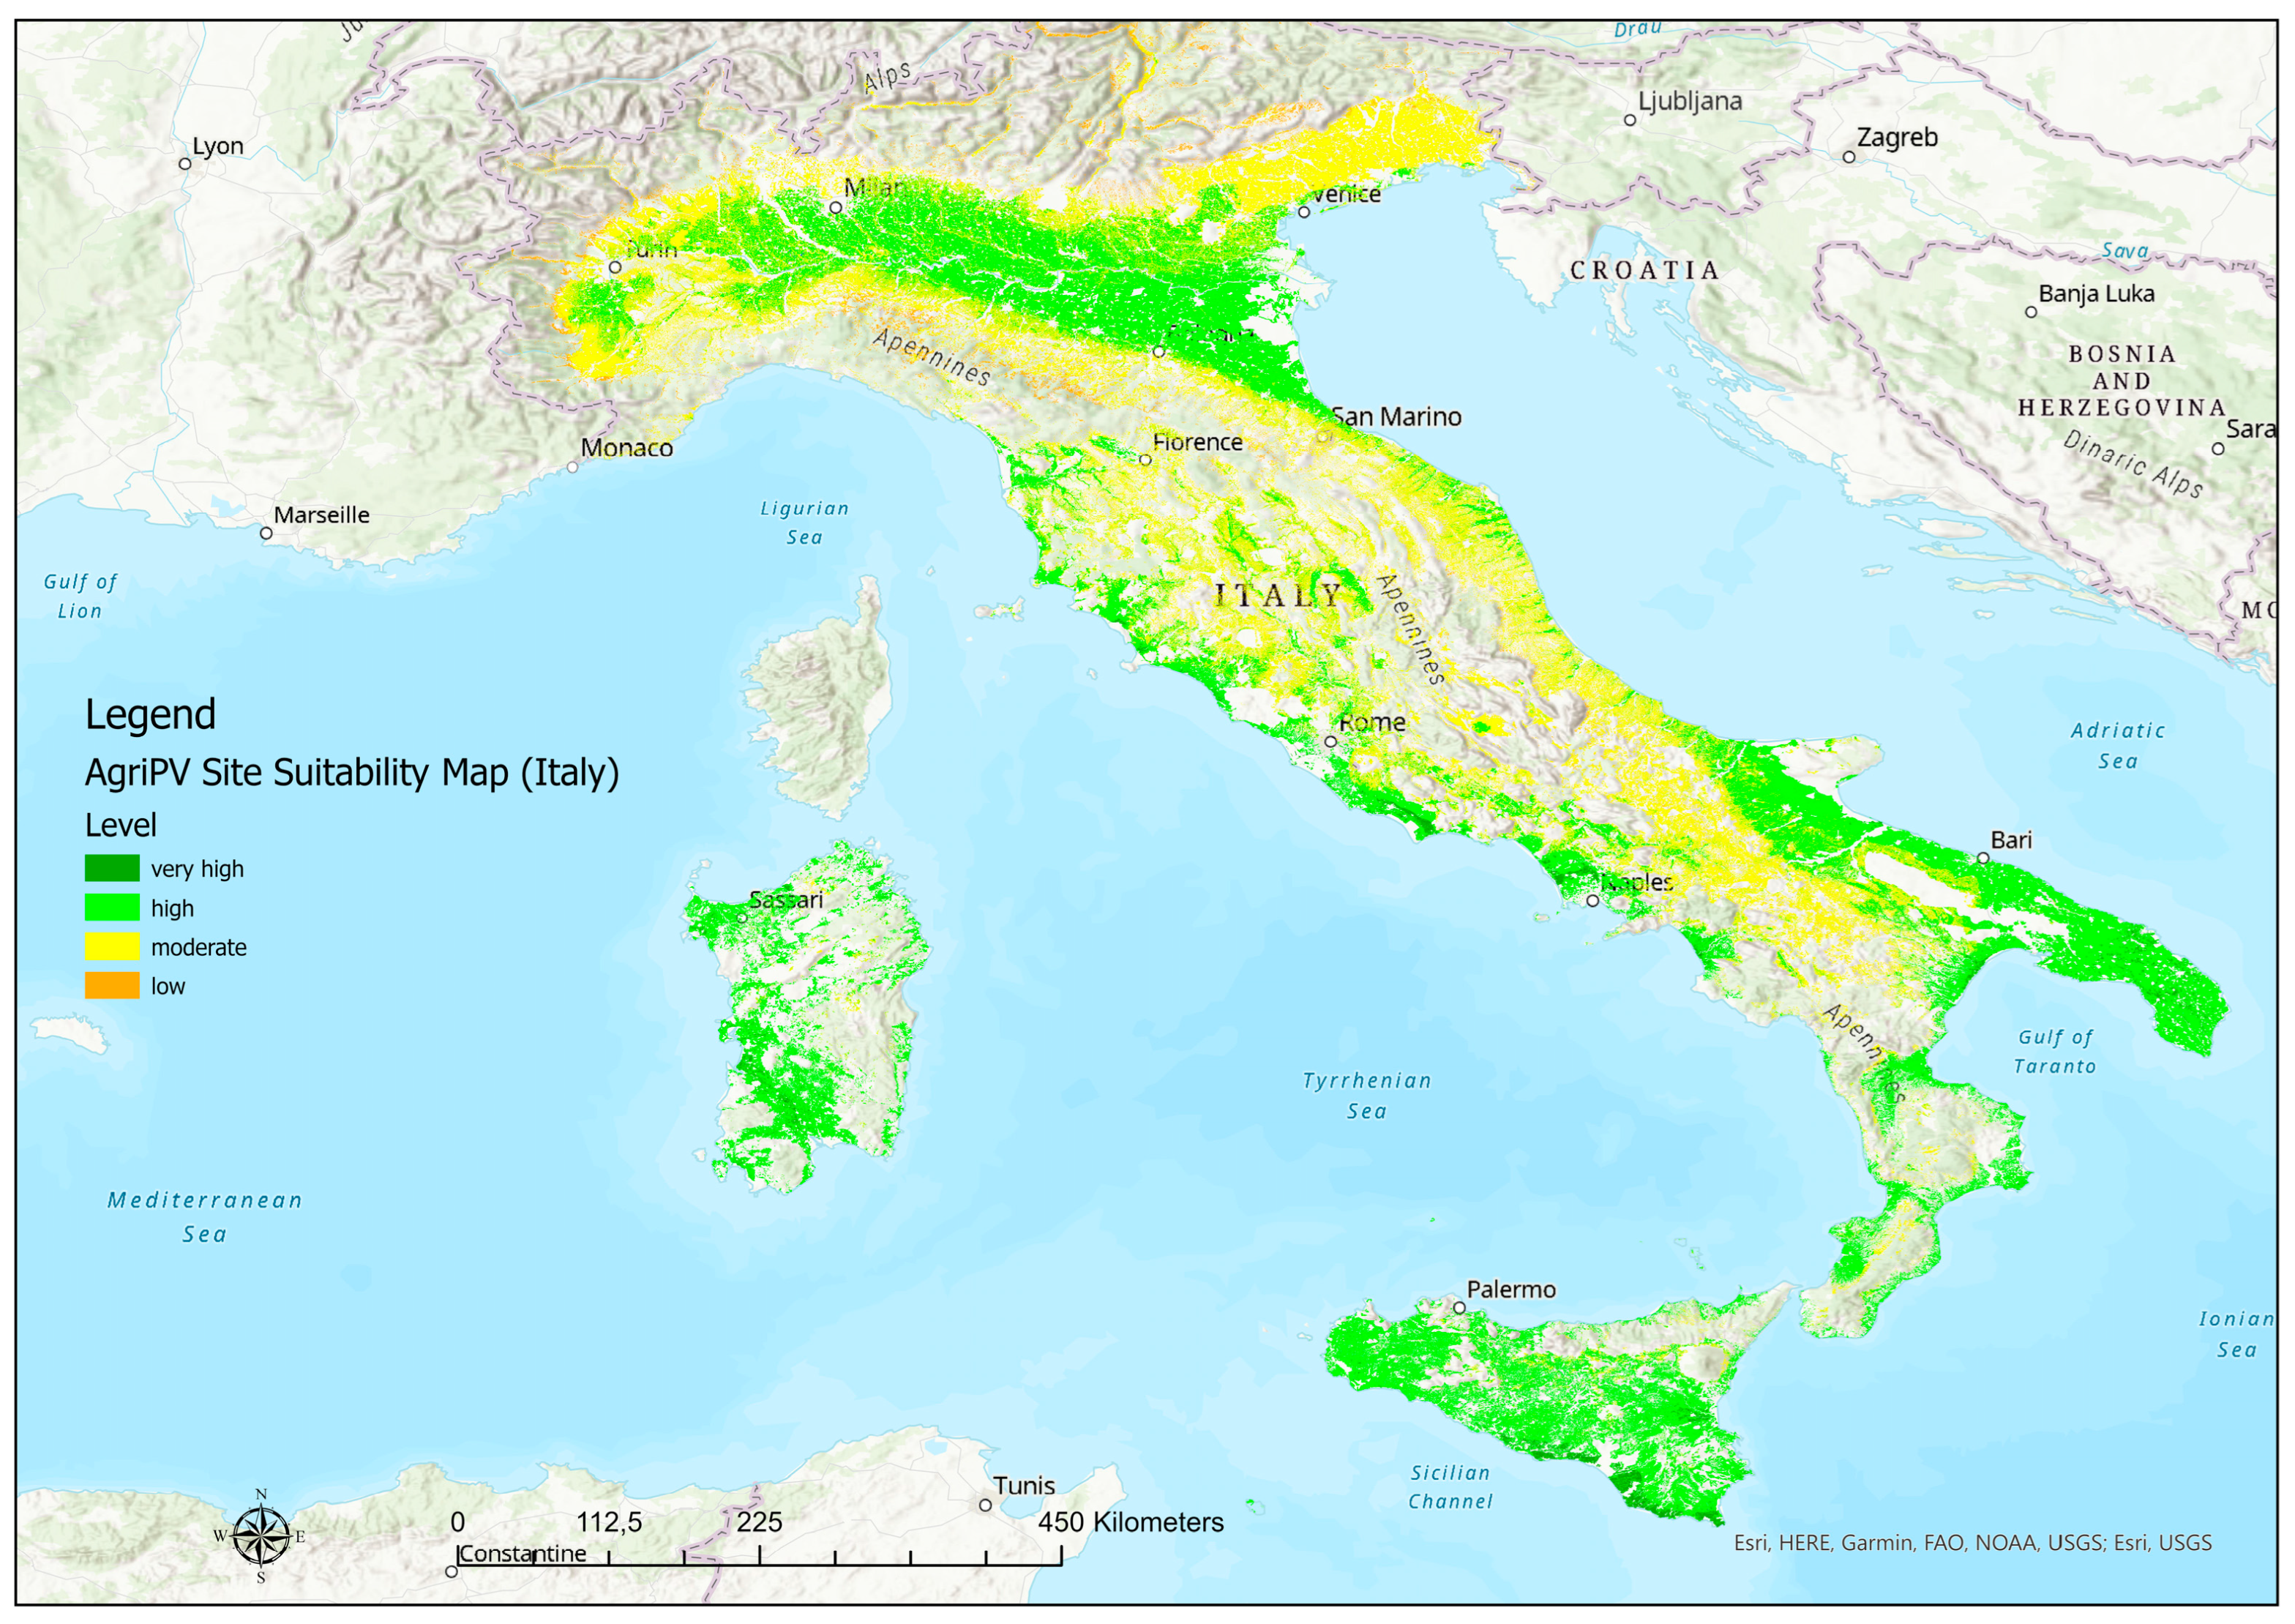
First, the land suitability map for agrivoltaic systems has been generated for the entire country as shown in
Figure 6 and classified into five levels of suitability (very low, low, moderate, high and very high), by spatially combining the criteria, properly defined (see
Table 10), that may favour the dual and synergistic use of the same land unit for energy and agricultural production.
The eligible regions for agrivoltaic systems in Italy represent 65% of the national agricultural surface area (estimated 16.5 million hectares), and the eligible area is approximately 10.7 million hectares. The most suitable lands are evaluated to be highly and moderately suitable. They represent 51% and 44%, respectively, of the total suitable lands.
The eligible area is quite unevenly distributed across Italy. The regions with a higher percentage of eligible area are Puglia, Sicilia and Emilia Romagna with, overall, 34% of these areas being suitable, corresponding to about 12 million hectares for each one (
Table 12).
For the majority of the regions, the share of eligible land is between 2% and 9%, as shown in
Table 12. Few regions have a percentage lower than 2%, although Trentino-Alto Adige, Liguria and Valle d’Aosta do, with suitable areas that are 83,989 ha, 21,979 ha and 6972 ha, respectively.
Assuming an installed power density of 0.6 MW/ha, the maximum capacity potential for agrivoltaic systems that could be achieved is 6435 GW for the entire country. Thus, a land coverage of only 1.24% of the eligible area is needed to reach the 80 GW target to date assigned to Italy by the European policies on green transition.
In our analysis of the agrivoltaic potential, we wanted to support two possible scales of agrivoltaic development: one at a large scale corresponding to utility-scale installations and the other at a small scale corresponding to the size of most national small/medium farms.
With this scope, we have identified the eligible contiguous lands covering areas greater than 20 ha for utility-scale installations and the eligible contiguous lands covering areas from 2 up to 20 ha for farm-scale installations. Thus, in the first case, the eligible lands correspond to about 10.3 million hectares across the entire country, while in the other case, they correspond to about 420,000 ha.
As shown in
Table 13, the main land categories of arable land and permanent crops cover 74% of the suitable areas greater than 20 ha, reaching an overall potential installed capacity of 4.699 GW. Similar to the Campania region, the permanent grassland and meadow category (CLC 2.3) covers only 1% of the eligible areas (≥ 20 ha) across the entire country. The potential of the CLC 2.4 category remains significant at a national level.
5. Discussion and Conclusions
Agrivoltaics’ share of renewable generation is indicated as relevant by the energy transition policies across European countries. For its implementation, a fundamental step is to determine which areas are suitable within a country according to relevant criteria and constraints on which to base the assessment of the agrivoltaic potential of the country.
According to the national regulatory framework from Italy, the regional institutions are called on to identify the eligible lands for the deployment of agrivoltaic systems across the regional territory, also taking into account the current regulations as well as several environmental constraints.
The aim of this research work was to investigate and develop a methodological framework for a reliable agrivoltaic land eligibility analysis at a regional level based on a spatial multicriteria analysis (i.e., GIS/MCDM-AHP). To do so, a set of relevant criteria was selected based on experts’ knowledge and current agrivoltaic literature capturing the geophysical, technical, environmental, and meteorological factors that can affect both the solar PV potential of a unit land and the crop yields, along with agriculture-oriented factors such as the land agricultural use, land capability and water deficit. On the basis of these criteria, properly weighted, a land eligibility map for agrivoltaic systems has been generated, first for the region Campania and then for the other NUTS-2 regions of Italy, extending the developed methodology region by region.
Thus, on the basis of the agrivoltaic land suitability map we obtained, a set of agrivoltaic potential indicators have been calculated. The results indicate that the eligible regions for agrivoltaic systems in Italy cover 65% of the national agricultural surface. The eligible land area is distributed between 2% and 9% across most regions. The maximum capacity potential for agrivoltaic systems that could be achieved, with an installed power density of 0.6 MW/ha, is 6435 GW for the entire country. A land coverage of only 1.24% of the eligible area could guarantee that the fixed renewable energy target is met at a national level. The Campania region covers 3% of the national suitable land area with a maximum capacity potential of 205 GW. In this region, the arable land category has a higher percentage of suitable lands while the pastures category has a lower percentage. Therefore, the potential of the installed capacity results at the GW scale for the main land categories of arable land and permanent crops, both if they are covered by 10% and only 5% with agrivoltaic systems. Similarly to the region Campania, the suitable land area categories are also distributed around the entire country. Thus, the impact of agrivoltaic system development on land occupation can be considered marginal, especially in relation to benefits generated for both the energy and agricultural sectors.
Determining the agrivoltaic land eligibility and evaluating the related potential at a regional level using the approach here proposed represents a step forward with respect to the methods commonly used by the competent authority and the scientific community. Generally, the land eligibility is evaluated on the basis of selected agricultural land types and considering some land topographic characteristics (e.g., slope and orientation) that can affect the solar radiation reaching the ground. Then, protected areas such as protected habitats for birds and other wildlife as well as landscapes and parks are excluded.
It is reasonable to assume that a reliable estimation of the eligible land area and the related potential better support effective agrivoltiac system development. This involves, as a matter of necessity, a comprehensive set of key factors that improve energy and crop yields as well as the evaluation of their relevance to land eligibility.
As expected, Ali Khan Niazi and Victoria [
5], in their recent study, provided an estimation 10 times the suitable eligible land area calculated here for agrivoltaic systems in the NUTS-2 regions of Italy. That is because their eligibility analysis was essentially based on the Corine Land Cover database, ensuring that the area was on land already used for agriculture, and with constraints like distance to forests, settlements, and roads.
Nevertheless, it is to be noted that the output accuracy of the proposed methodology depends on the level of detail of the land cover and use data source. The more detailed land use and cover data that are available up to the agricultural cadastral patches and the specific crops, the more relevant this information becomes in the land eligibility analysis.
Such an official data source, covering the entire Italian country, is represented by the SIAN—National Agricultural Informative System (
https://cns.sian.it/portale-sian/home.jsp (accessed on 19 November 2023)), though it is not open data. However, this information (crop field features) may be extracted from satellite and aerial imagery by using advanced segmentation algorithms (GeoAI-Artificial Intelligence), though they are computationally intensive and require powerful GPUs.
The development of agrivoltaic systems has a dual impact. One is on the agricultural sector where photovoltaic systems are functional for agricultural or livestock activities, optimising the farmers’ energy consumption, supporting a transition to non-fossil fuelled means and machinery, and making agriculture more sustainable in terms of their environmental impact as well as more profitable and competitive. The other impact is on the energy sector addressing the need to produce renewable energy in large quantities and at low cost to the community, while ensuring the protection of the soil resource in its primary use, which is food production. The installation of agrivoltaic systems can become an economic support through which to recover abandoned land, support pastoral activities, and revive vegetable and other crops that can coexist with an agrivoltaic systems.
The agrivoltaic potential indicators evaluated in this research work are just some of those that could be extracted from the resulting eligible land map. In addition to all of this, the outcome of this research study was also the development of a spatial tool able to provide a reliable evaluation of the agrivoltaic potential at a regional scale and to spatially identify the eligible lands as well as their eligibility levels across regions. Such a tool is targeted to policymakers as well as agrivoltaic project designers and developers in order to promote and effectively support the development of agrivoltiac systems for use at a country level.


 ,
, 


