Abstract
Given the significance of sustainability in the current global market, doing a comprehensive and current assessment of a supplier’s sustainability might be beneficial for improving a firm’s competitiveness. This study aims to develop sustainable supplier selection criteria, examine their interrelationships, and determine the critical criteria in the paint and coating industry. This study employed a focus group discussion (FGD), the Delphi method, a decision-making trial and evaluation laboratory-based analytical network process (DANP), and a measurement of alternatives and ranking according to compromise solution (MARCOS). The findings indicated that most sub–criteria experts agreed that 11 economic sub–criteria, five environmental sub–criteria, and three social sub–criteria should be considered when selecting a sustainable supplier. The results show that the most influential criteria are environmental criteria, while the critical criteria are social criteria. In addition, “Service” (E4), “Green Material” (L3), and “Health and Safety” (S1) sub–criteria should be considered to assess the supplier because they have high relation and prominence. Globally, the top five highest weighted sub–criteria are “Respect for the Law” (S2), “Health and Safety” (S1), “Worker’s Social Rights” (S3), “Waste Management” (L5), and “Environment Management System” (L1). We practically selected 12 providers from the paint and coating sector to assess the scheme’s practicality. This work introduced a novel model for selecting a sustainable supplier that helps industries understand their core criteria and sub–criteria. This will enhance the industry’s competitiveness and sustainability by evaluating suppliers based on economic, environmental, and social criteria.
1. Introduction
The global concern for sustainability has arisen due to the depletion of resources, climate change, and public health issues [1]. Firms are now transitioning their supply chains to be more sustainable because of the globalization of corporations’ supply networks, as well as growing public awareness and pressure from governments and stakeholders [2]. To protect against consumer dependability, industries are anticipated to strategically arrange and coordinate their internal resources and procedures to include sustainability criteria in their supply chain management activities, which include the selection of suppliers [3]. While suppliers may not be considered essential components of a firm’s internal supply chain system, their actions may nonetheless contribute to cost savings and achieve social and environmental objectives for the organization [3].
Nevertheless, conventional supplier selection relied solely by economic criteria. Nowadays, there is a global emphasis on sustainability, which involves considering all three aspects of the Triple Bottom Line (TBL)—economic, environmental, and social concerns—across the supply chain, including the selection of suppliers [4]. The term “sustainable supplier selection” might have several interpretations based on the specific goals of the study. Sustainable supplier selection is a process in which the most suitable suppliers, based on economic, social, and environmental criteria, are chosen to enhance the purchasing process, facilitate strategic partnership selection, improve product quality, increase customer satisfaction, and ultimately gain a competitive advantage in the market for a buyer [5]. Sustainable supplier selection is the act of choosing suitable supply partners that provide the most financial value while minimizing the negative impact of their activities on society and the environment [6]. Sustainable supplier selection implies the incorporation of economic and social considerations, together with environmental consciousness, as well as conventional supply chain management [7].
Prior studies have shown that collaborating with suppliers that have significant environmental, social, and economic concerns may significantly enhance the sustainability of supply chains [8,9]. Moreover, sustainable supplier selection (SSS) has a significant impact on a company’s financial situation [10]. However, SSS can be difficult to apply because of the multiple factors employed in decision-making. The reality that these criteria are often contradictory renders supplier selection more complex [11]. Decision-makers need to understand the specifics of each sub-criterion’s impact on the others to identify the key criteria and sub–criteria. To advance knowledge in this research area, this study aims to design sustainable supplier selection criteria, examine their interrelationships, and determine the critical causal sustainable criteria.
The paint and coating industry in Indonesia was chosen for this study because, first, the market for paint and coating in Indonesia is the largest in Southeast Asia and is projected to grow at a compound annual growth rate (CAGR) of 8.16% during the forecast period of 2021–2025 [12]. Second, paint and its raw materials have a direct effect on customer and employee health, prompting the need for green raw materials and high product quality.
Nexus3 and the International Pollutants Elimination Network (IPEN) conducted research, which revealed that 77% of 120 paint samples had a lead value exceeding 90 ppm, and 33% of these samples had a lead content exceeding 10,000 ppm [13]. Third, a few suppliers monopolize certain raw materials, making it impossible to meet the Domestic Component Level (TKDN) mandated by the Indonesian government (FGD, 2022). Additionally, the dominance of these suppliers also affects the unaffordable costs of raw materials and the often-constricted shipments caused by ship transport.
Nevertheless, research on sustainable supplier selection and order allocation in the paint industry still needs to be improved, even though it has significant environmental impacts. Compliance with environmental regulations demands the identification of sub–criteria that support economic standards, as well as environmentally and socially friendly practices. Given the unique characteristics of raw materials and production processes in the paint industry, these sub–criteria must be specific. Previous studies, however, have frequently weighted criteria and sub–criteria without an in-depth analysis of their interrelationships sub–criteria. The complexity of sub–criteria in sustainable supplier selection can only be well understood if the relationships between criteria and sub–criteria are comprehensively identified. The interaction between these criteria and sub–criteria greatly influences the final decision.
This study provides a significant contribution to the field of sustainable supplier selection, particularly in the paints and coatings industry, by filling a gap in the previous literature. Although previous studies have provided summary information related to sustainability criteria and sub–criteria in various sectors, very few have focused on the paint and coatings industry and the influence of the relationship between criteria and sub–criteria [14,15]. This study addresses a specific contribution by introducing new sub–criteria, a more in-depth analysis of cause-and-effect relationships, and a more accurate and comprehensive weighting model, resulting in benefits for the industry to help the industry understand the complexity of sustainable supplier selection issues, assist the industry in overcoming the difficulties of making decisions to select sustainable suppliers, assist the industry in meeting government demands to become a sustainable industry through the development of an integrated conceptual model of sustainable supplier selection, help the industry become an industry that cares about the environment and society while maintaining procurement efficiency, and provide opportunities for the industry to gain consumer confidence and a good reputation through sustainable supplier selection. This research can also complement previous studies through the novelty provided and can contribute to delivering new views in solving the problem of sustainable supplier selection, and this research becomes a reference for future studies.
By offering an in-depth understanding of the complexities of sustainable supplier selection, this research helps the industry overcome the difficulties in the decision-making process. This study’s development of a sustainable supplier selection conceptual model provides a systematic and structured approach that meets the demands of sustainability-related governments and regulations. The model enables the industry to maintain procurement efficiency while considering environmental and social impacts. In terms of novelty, this research introduces a new and innovative hybrid approach that has yet to be widely discussed, particularly in identifying the sustainable supplier selection sub–criteria and analyzing their interrelationship in the paints and coatings industry. With a new view on problem-solving, this work contributes to the development of theory and practice in the field of sustainability, opening up opportunities for further research and the development of innovative solutions.
2. Research Background
This study aims to investigate sustainable supplier selection (SSS) criteria and procedures by systematically examining the literature. Several keywords were included in the literature search, such as “sustainable supplier selection”, “supplier selection”, and “green supplier selection”. We gathered research from well-known databases, including ScienceDirect (sciencedirect.com) and Scopus, to ensure comprehensive coverage.
Figure 1 shows that the number of articles devoted to SSS has risen steadily over the past decade, reaching 70 in 2021. We used the inclusion criteria to select publications that addressed the topic of sustainable supplier selection in various industries, published within the last ten years (2012–2021). Peer-reviewed, English-language articles were also required to meet the inclusion requirements. We also included research that described social, environmental, and economic factors to consider when choosing a supplier. This section discusses the previous studies on sustainable supplier selection (SSS) criteria and methodologies.
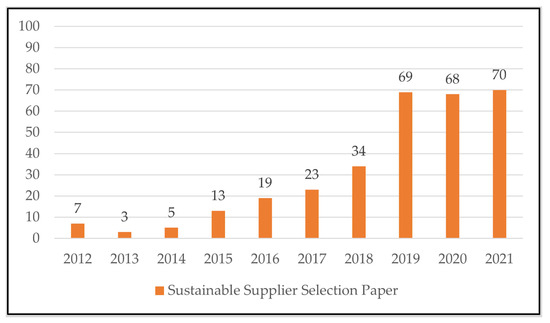
Figure 1.
Distribution of manuscripts published on SSS by year from 2012 until 2021.
2.1. Sustainable Supplier Selection Criteria
The importance for sustainable supplier evaluation has grown increasingly as industries have begun to focus more on environmental and social problems as the concept of corporate social responsibility grew in the second half of the 2000s [16]. The selection criteria may vary depending on the sector, and organizations must choose indicators that are relevant to them [17]. Menon and Ravi (2022) specified 16 sub–criteria to select sustainable suppliers in the electronics sector, including quality, cost, delivery, flexibility, eco-design, resource reduction and consumption, pollution control, environment management systems, green image, human rights, safety systems, and occupational health, corporate social responsibility, education and training, code of conduct, conflict of interest, and transparency in accounting and business [1]. Rahman et al. (2022) established a list of 15 specific sub–criteria to consider when selecting sustainable suppliers in the textile dyeing sector, including price, delivery, quality, production technology, capability, environmental management system, pollution regulation, practice of recycling, energy consumption, sustainable raw materials, economic well-being and development of the employees, employees’ rights, health and safety, training, and information disclosure [18]. Machesa, Tartibu, and Okwu (2020) identified ten sub–criteria for sustainable supplier selection in the paint industry, namely quality, delivery, reliability, price, performance history, technical capability, packaging, warranty and claim policies, availability, and customer service [19].
We identified the most widely used sub–criteria for sustainable supplier selection through a systematic literature review. The first search results yielded 311 articles on SSS. Our study selected 32 manuscripts related to SSS for further examination after a three-stage screening process that involved the inclusion and deletion of criteria.
Table 1 shows the number of publications in the last ten years that have been related to SSS problems. Following that, the articles were reviewed based on several criteria:

Table 1.
Literature selection.
- The first selection excluded conference proceedings, book chapters, correspondence, data articles, editorials, errata, mini-reviews, brief communications, and other forms of the articles; only peer-reviewed academic journal publications in English were taken into consideration [15]. As a result of this phase, there were 825 publications, of which 282 had something to do with SSS.
- The publications in the second selection were evaluated according to their keywords, abstracts, and titles [19]. Consequently, there are now just 77 complete texts out of the total number of articles in SSS.
- The introduction, study methodology, and conclusions in the third selection were skimmed in order to identify credible publications [19]. The number of chosen papers was then reduced to 32 articles in SSS.
The criteria and sub–criteria in SSS identified through the systematic literature review are represented in Table 2.
Table 2.
Sustainable supplier selection criteria and sub–criteria.
Table 2 shows the prospective sub–criteria derived from the literature. Economic sub–criteria such as cost, delivery, and quality directly affect operational efficiency and customer satisfaction. Environmental sub–criteria like greenhouse gas emissions and waste management are increasingly critical due to regulatory pressures and consumer demand for sustainable practices. Social sub–criteria, such as health and safety and workers’ rights, align with ethical sourcing and CSR commitments, which greatly influence corporate reputations. All of these sub–criteria were chosen for the current investigation. A focus group discussion and the Delphi method should be implemented to emphasize the significance of every sub-criterion. Following a Focus Group Discussion (FGD) and the Delphi method, distinctions emerged between the sub–criteria used for the current research and those utilized in the cited studies. Several sub–criteria were acquired, while others were omitted, to be detailed in Section 4.1 and Section 4.2.
2.2. Sustainable Supplier Selection Approaches
MCDM techniques attempt to determine the compromise solution from a group of options based on decision-maker preference. The existing literature has extensively discussed various MCDM methods for selecting the most suitable alternative. These methods include the Analytic Hierarchy Process (AHP) [31,32,33], Analytic Network Process (ANP) [32,34,35], Technique for Order Preference by Similarity to Ideal Solution (TOPSIS) [11,28,36,37], ELimination and Choice Expressing the REality (ELECTRE) [38], and Decision-making Trial and Evaluation Laboratory (DEMATEL) [32,36,39]. These techniques have strengths and limitations depending on the decision context and the number of criteria involved.
AHP is one of the most popular MCDM techniques and is frequently used in supplier selection due to its ability to handle hierarchical criteria structures. For instance, it applies AHP to assess the significance of cost, quality, and environmental performance in supplier selection. However, many criteria can limit AHP, making the method less manageable and potentially compromising the consistency of pairwise comparisons [31,32,33].
ANP, an extension of AHP, accounts for the interdependencies among criteria, which is particularly useful in complex decision-making environments such as electronics and pharmaceutical industries. For example, ANP has been applied in the electronics sector to evaluate the relationships between environmental practices and supplier performance, offering a more dynamic and interconnected evaluation process than AHP [32,34,35]. However, the complexity of ANP requires more computational effort and expert knowledge, making it less accessible in cases where such resources are limited.
TOPSIS is another widely used method, especially in cases where decision-makers need to rank suppliers based on their proximity to an ideal solution. The textile industry employs TOPSIS to rank suppliers based on their cost-effectiveness and environmental impact. It excels in simplicity and ease of use but has limitations when handling subjective and qualitative criteria, which are common in sustainability assessments [11,28,36,37].
Stankovi’c et al. [24] devised the well-known MARCOS method to provide reliable sorting of alternatives in the fuzzy environment, even when dealing with a large sample size. The study by Stević et al. [27] provided evidence of the successful measurement of sustainable candidates in the healthcare supply chain using MARCOS. Furthermore, the authors asserted that MARCOS exhibited superior robustness and stability compared to TOPSIS when evaluating the decision-making units.
ELECTRE is suited for cases where decision-makers seek to eliminate alternatives based on a set of outranking criteria, making it effective in industries with strict regulatory requirements, such as food processing or pharmaceuticals. ELECTRE’s strength lies in its ability to handle conflicting criteria, but it may become difficult to apply when there are too many alternatives or when the data are imprecise [38].
DEMATEL, unlike other methods, focuses on categorizing criteria into two groups: cause and effect [15], which is particularly useful in complex, interrelated decision environments. Its graphical representation of relationships gives decision-makers a clear understanding of the influence between criteria, although it does not assign weights to the criteria [32,36,39]. The Battelle Memorial Institute established the DEMATEL method to examine complex social network structure challenges in a real system [40]. The primary benefit of the DEMATEL method is that it can examine and display the interaction between two subsystems in a system using graph theory. This method is widely adopted in various fields, including in the textile industry to identify the sustainability barrier, in the optical industry to determine the green supplier criteria, and also for evaluating sustainable suppliers [14,15,41].
This technique, however, is limited to identifying the relationship influence between criteria and sub–criteria and does not provide weights for criteria and sub–criteria. Previous research developed the DANP to determine public procurement bidders’ most significant criteria [42]. Combining the DEMATEL and the ANP methods yielded the ideal option for complex criteria and sub–criteria interaction. The DANP approach’s advantage lies in its ability to detect the relationships between criteria and sub–criteria using the DEMATEL technique. This allows us to calculate the priority weights of the criteria and sub–criteria using the ANP based on the results from DEMATEL [39].
In summary, selecting the most appropriate MCDM method depends heavily on the nature of the industry and the decision-making context. While methods like AHP and TOPSIS are straightforward to implement, they may struggle with many criteria or interdependencies. On the other hand, the combination of DANP and MARCOS creates a hybrid model that enhances the accuracy of the ranking process by integrating the strengths of both methods. This hybridization is innovative because it allows us to consider the direct impact of criteria and their interrelations. In contrast, MARCOS ensures that the ranking of suppliers is based on a detailed comparison with ideal benchmarks. The method offers distinct benefits that align with specific decision-making requirements in sustainable supplier selection.
3. Research Methodology
We proposed a hybrid Multi-Criteria Decision-Making (MCDM) methodology, precisely the combination of DANP (DEMATEL-based ANP) and MARCOS that are more suitable for complex decision-making scenarios where the relationships between criteria need to be explored in depth. This methodology offers a more reliable and nuanced evaluation of suppliers compared to traditional MCDM methods. The research approach is structured into five distinct phases: identifying the research problem, determining and validating criteria and sub–criteria, exploring cause−effect influence relationships among the criteria and sub–criteria, assessing the supplier, and obtaining the sustainable supplier rating. In the beginning, observation and a comprehensive literature analysis identified the research issue. In phase 2, an FGD and survey were conducted using the Delphi method. This study’s focus group included 13 people: ten paint and coating procurement specialists, two government procurement experts, and one academic. Two-hour online conferences were held with unrelated respondents. An expert in Delphi consensus should confirm the sub–criteria after a FGD. In phase 3, a decision-making trial and evaluation laboratory-based analytical network process (DANP) approach sub–criteriawas used to explore cause−effect influence relationships among the criteria and sub–criteria and the weight of sustainable supplier selection criteria and sub–criteria. In phase 4, the weight of criteria and sub–criteria acquired during the previous phase are subsequently employed in the MARCOS model to assess suppliers. Finally, in the last phase, the sustainable supplier ranking was obtained. Specifically, the research methodology is shown in Figure 2.
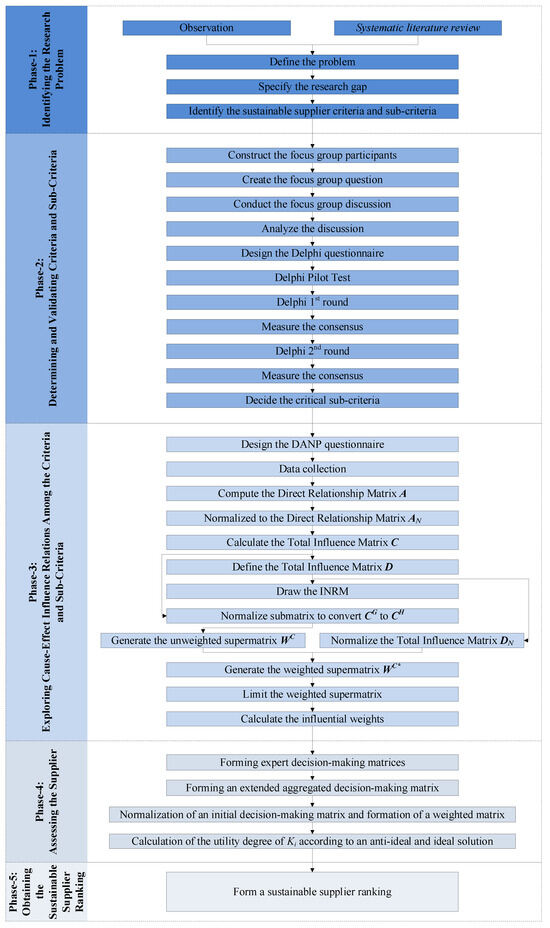
Figure 2.
Research methodology.
As mentioned above, the initial data collection was FGD, where the experts should discuss in groups the problems and how to select a sustainable supplier. In this case, the researcher formulates seven questions to facilitate expert discourse about the subject, including:
- How can sustainability issues be considered in the procurement process?
- What is the current procurement process?
- What are the driving forces behind a sustainable procurement process?
- What are the factors inhibiting the sustainable procurement process?
- What are the sub–criteria in the current supplier selection process?
- Which assessment sub–criteria are necessary when choosing a supplier?
- What is the relationship between sub–criteria for selecting suppliers?
After conducting the FGD, then several sub–criteria were identified through the focus group process: the Lead Time sub–criteria and the Payment Term sub–criteria. These two sub–criteria were included in the Delphi method.
3.1. Delphi
The Delphi method aims to verify the model, where validation means checking the model’s correctness and appropriateness for its intended use [43]. To make the research concept and questions more applicable, we invited three people to participate in the pilot survey before the first-round Delphi research. The data collection was carried out in two rounds using an online questionnaire, each including nine experts. Table 3 provides general information regarding the Delphi research that was undertaken.
Table 3.
Delphi scope.
Table 2 presents the measure of consensus which includes three requirements: the interquartile range, the standard deviation, and 51% of respondents in the “very important” category (i.e., between eight and ten on a 10-point scale). This method shows that the interquartile range and/or standard deviation may be within acceptable limits, yet the expert consensus in the “very important” category is below 51% or vice versa. Thus, all three criteria should be assessed simultaneously to ensure agreement.
3.2. Decision-Making Trial and Evaluation Laboratory-Based Analytical Network Process (DANP)
The DANP consists of two stages: the first stage is the creation of the Influential Network Relation Map (INRM) to validate the effects among the criteria and sub–criteria using the DEMATEL method, and the second stage is the calculation of the priority weights of the criteria using the ANP based on the DEMATEL findings [39]. This study utilized a five-point scale to measure how much one sub-criterion affects another. A score of zero meant “no influence”, a score of one meant “low influence”, a score of two meant “moderate influence”, a score of three meant “strong influence”, and a score of four meant “extremely high impact”. A survey was conducted using the developed online questionnaire. The poll was designed for professionals with at least five years of expertise in the paint and coating industry’s procurement and/or supply chain management. Seven of the nine experts surveyed responded to our surveys. All participants were tasked with determining the relative importance of the various criteria and sub–criteria pairs.
3.3. Measurement of Alternatives and Ranking According to Compromise Solution (MARCOS)
The MARCOS approach is based on establishing the correlation between alternatives and reference values, particularly ideal and anti-ideal alternatives. The utility functions of alternatives are calculated based on the prescribed relationships, and a compromise ranking is established with regard to the ideal. The participants assessed these characteristics for every supplier using a five-degree scale: 1 = extremely poor; 3 = poor; 5 = medium; 7 = acceptable; 9 = very good. There were 12 suppliers in all, assessed by five participants. The MARCOS approach was implemented by distributing a virtual online questionnaire.
4. Data Analysis
4.1. Focus Group Discussion (FGD)
The outcomes of the FGD consist of viewpoints about the sub–criteria considered when selecting sustainable suppliers. FGD discovered the existence of a new sub–criteria for evaluation. The sub-criterion “Payment Term” (E11) is a novel addition to the sustainable supplier selection process that prior studies have not utilized. The economic criteria for sustainable supplier selection encompass several sub–criteria, including Cost (E1), Quality (E2), Delivery (E3), Service (E4), Technology Capability (E5), Reputation (E6), Relationship (E7), Capacity of the Supplier (E8), Flexibility (E9), Lead Time (E10), and Payment Term (E11). Moreover, environmental criteria cover sub–criteria such as Environment Management Systems (L1), Pollution Production (L2), Green Material (L3), Green Packaging (L4), Waste Management (L5), and Green House Emissions (L6). Additionally, social criteria include sub–criteria such as Health and Safety (S1), Respect for the Law (S2), Worker’s Social Rights (S3), and Corporate Social Responsibility (CSR) (S4).
4.2. Validating Criteria and Sub–Criteria Using Delphi Method
4.2.1. Delphi Round 1
In the initial round, 13 experts were asked to participate in the research; nine responded. Most of the Delphi questions (85.7%) were answered in agreement. Three sub–criteria were not reached with consensus, i.e., “Relationship” (E7) whose standard deviation is 1.74 > 1.5, “Green House Emissions” (L6) whose standard deviation is 1.81 > 1.5, and “Corporate Social Responsibility” (S4) whose standard deviation is 1.64 > 1.5, and only 22% answered “very important”. These three sub–criteria were included in the second round of the Delphi poll, which also informed the group’s responses.
4.2.2. Delphi Round 2
In the second round, the experts were allowed to re-answer the questions after considering the previous round’s responses. They were also required to provide justifications for their responses. After the second round of voting, all panelists agreed that “Relationship” (E7) is an essential sub-criterion for choosing suppliers (70% of respondents answered “very important”). In contrast, based on the percentage of responses, only 30% of panelists answered “very important” for the “Green House Emissions” (L6) sub-criterion, and 20% answered “very important” for the “Corporate Social Responsibility” (S4) sub-criterion, indicating that these sub–criteria are not as important to the panelists. From the second round, the 19 sub–criteria that have reached consensus will be included in the data collection and processing using the DANP method.
4.3. Exploring Cause−Effect Influence Relations among the Criteria and Sub–Criteria
As previously stated, the DANP consists of two stages: the first stage is the creation of the INRM to validate the effects among the criteria and sub–criteria using the DEMATEL method, and the second stage is the calculation of the priority weights of the criteria using the ANP based on the DEMATEL findings. The DEMATEL approach and ANP are calculated in the following subsections [39].
4.3.1. DEMATEL Process
Step 1: The direct-influence matrix A is computed for the sub–criteria. The replies may be utilized to obtain the average of each pairwise comparison. The element aij in the direct-influence matrix A represents the average of the influential values provided by all experts. All diagonal terms in Matrix A are zeros.
where n is the number of criteria.
The direct-influence matrix A is shown in Table 4.
Table 4.
Direct-influence matrix A.
Step 2: A is normalized to the normalized direct-influence matrix AN. As indicated in Equations (2) and (3), all entries in the direct-influence matrix A are divided by the highest value of the sum of each column or row. AN represents the normalized direct-influence matrix. The normalized direct-influence matrix AN is shown in Table 5.
Table 5.
The normalized direct-influence matrix AN.
Step 3: The total influence matrix C is calculated for the sub–criteria. To comprehend the continuous direct and indirect impact, we must compute the total influence matrix C using Equation (4), where I is the identity matrix. The direct influence is shown by AN. The first-order indirect impact is represented by . The second-level indirect impact is represented by . The element cij of matrix C represents the overall direct and indirect effect from the ith criteria to the jth criteria. The total influence matrix C is shown in Table 6.
Table 6.
The total influence matrix C.
Step 4: The value of prominence and relation for the sub–criteria is determined. When ri represents the sum of the ith row in the total influence matrix C and qj represents the sum of the jth column in C, ri represents the sum of the ith sub-criterion’s direct and indirect influence on other sub–criteria and qj represents the sum of other sub–criteria’s direct and indirect influence on the jth sub–criteria.
where n is the number of sub–criteria.
When i = j, the value of prominence (ri + qi) represents the strength of effects given and received by the ith sub–criteria, which is also known as the value of prominence. The greater (ri + qi) is, the greater the influence of the ith sub–criteria. The value of relation (ri − qi) reflects that if (ri − qi) is positive, the ith sub–criteria are more likely to affect other sub–criteria, and that if (ri − qi) is negative, the ith sub–criteria are more likely to be affected by other sub–criteria.
Step 5: The total influence matrix D is defined for the criteria. The total influence matrix C is divided into a supermatrix with m × m submatrices, where m is the number of criteria. Criteria are given as Dim.i in Equation (8), where 1 ≤ i ≤ m. Gij is a submatrix with the same number of columns as the number of sub–criteria in Dim.j and the same number of rows as the number of sub–criteria in Dim.i. The total influence matrix D is shown in Table 7.
Table 7.
The total influence matrix D for criteria.
Equation (9) shows an example of the submatrix Gm1, where z1 is the number of sub–criteria in Dim.1 and zm is the number of sub–criteria in Dim.m.
As shown in Equation (11), the total influence of matrix D for the criteria may be computed by averaging the influence values within each matching submatrix in C. Moreover, (ri + qi) and (ri − qi) may also be determined.
where m is the number of criteria.
Step 6: an influential network relationship map (INRM) of the criteria and sub–criteria. By mapping all co-ordinate sets of (ri + qi, ri − qi), each INRM may be viewed. If the impact values are greater than a certain threshold, digraphs between criteria and sub–criteria may be created. If cij is greater than the threshold, the influential connections may be depicted as an arrow from the ith sub–criteria to the jth sub–criteria.
Using the INRM, the cause−effect influence relations between criteria and sub–criteria can be identified [42]. The INRM is a scatter plot that maps the co-ordinates of the (ri + qi) value and (ri − qi) value using arrows linked to them according to threshold values. The value of (ri + qi) indicates the degree to which all criteria or sub–criteria have or attain an influence and the importance of that connection. The larger (ri + qi) is, the more significant it influences or is influenced by others [39,44]. If the value of (ri − qi) is positive, one criterion tends to influence the other. On the other hand, if the value of (ri − qi) is negative, one criterion tends to be affected by the other [39]. By separating the INRM into four quadrants to create a causal diagram, the complicated causal linkages among the criteria may be reduced as a framework for analyzing the impacts between criteria [36]. The causal diagram’s horizontal and vertical axes are represented by the notation (ri + qi, ri − qi), with the mean representing the dividing line on the horizontal axis (ri + qi) and 0.0 representing the dividing line on the vertical axis (ri − qi) [36]. The measurement of the cause−effect influence relations among criteria, whose results are reported in Table 8 and Figure 3, is complete.
Table 8.
Influence relations among the criteria.
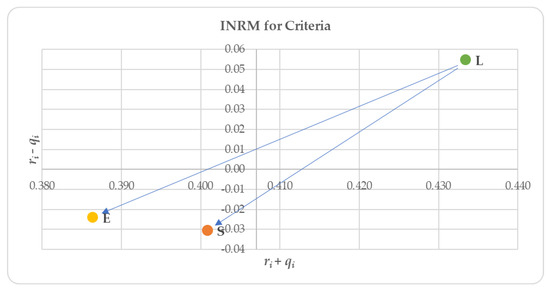
Figure 3.
INRM of the criteria.
Table 3 shows that the values of (ri − qi) of the other two criteria are negative, which means that the environmental (L) criteria might impact the economic (E) and social (S) criteria, which are represented in Figure 1. All dimensions’ highest (ri + qi) score is 0.433 for environmental (L) criteria. Environment (L) has a strong link and prominence, showing that it is the main criterion affecting other criteria and the deciding criteria in selecting a sustainable supplier. Conversely, the economic (E) and social (S) criteria have a low relation and prominence, indicating that these criteria may be affected by the environmental (L) criteria. Despite this, economic (E) and social (S) criteria are still considered.
The cause−effect influence relations among the economic (E) sub–criteria are then measured and presented in Table 9.
Table 9.
Influence relations among the sub–criteria for the economic criteria.
As shown in Table 9, the economic (E) criteria have five causal sub–criteria regarding the value of (ri − qi) as follows: “Quality” (E2), “Service” (E4), “Technology Capability” (E5), “Capacity of the Supplier” (E8), and “Flexibility” (E9). Table 9 shows that “Service” (E4) has the highest (ri + qi) value of 1.785 compared with the other five causal sub–criteria, thus, it has a significant impact on the other sub–criteria. The cause−effect influence relations of these five sub–criteria are highly complex and hard to articulate. However, we can illustrate the relationship for two sub–criteria with the most substantial impact, namely the “Service” (E4) and “Quality” (E2) sub–criteria, as shown in the following figure.
As shown in Figure 4, “Service” (E4) highly influences “Cost” (E1), “Delivery” (E3), “Reputation” (E6), and “Relationship” (E7).
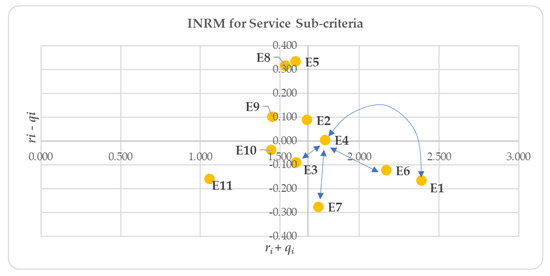
Figure 4.
INRM of the “Service” (E4) sub–criteria.
As shown in Figure 5, “Quality” (E2) has a significant influence on “Cost” (E1), “Delivery” (E3), “Technology Capability” (E5), and “Reputation” (E6). As a result, decision-makers need to pay greater attention when choosing suppliers. Table 10 shows that there are two causal sub–criteria for the environmental (L) criteria: “Green Material” (L3) and “Green Packaging” (L4). As shown in Table 10, for “Green Material” (L3), the (ri + qi) value of 0.840 is higher than that for “Green Packaging” (L4). Therefore, “Green Material” (L3) is an essential sub-criterion and significantly affects other sub–criteria.
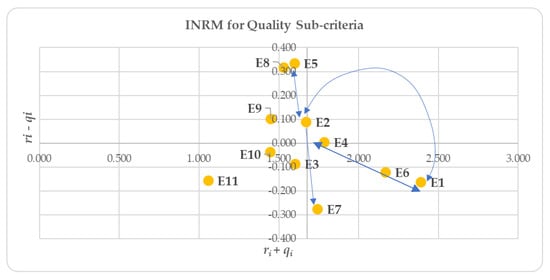
Figure 5.
INRM of the “Quality” (E2) sub–criteria.
Table 10.
Influence relations among the sub–criteria for the environmental criteria.
As shown in Figure 6, the choice to use green material influences “Environment Management System” (L1), “Pollution Production” (L2), and “Waste Management” (L5). Therefore, decision-makers should give it top priority.
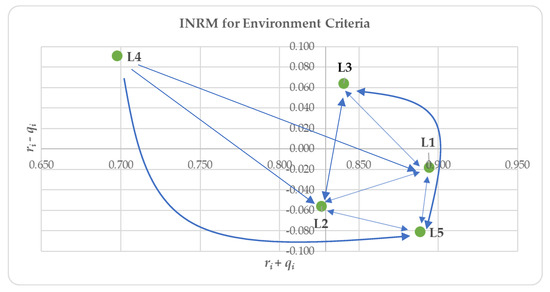
Figure 6.
INRM of the environmental criteria.
Moreover, Table 11 shows that “Health and Safety” (S1) is the only one causal social sub-criterion for the social criteria. As shown in Table 6, “Health and Safety” (S1) has an (ri + qi) value of 0.420, proving that “Health and Safety” (S1) is the essential sub-criterion that has a significant impact on other sub–criteria. The “Health and Safety” (S1) sub–criteria influence “Respect for the Law” (S2), and “Worker’s Social Rights” (S3).
Table 11.
Influence relations among the social sub–criteria.
Figure 7 represents the INRM for the social criteria. The arrows in Figure 7 are obtained when the influence value on the total influence matrix is greater than the threshold value, which, for the social criteria, is 0.069.
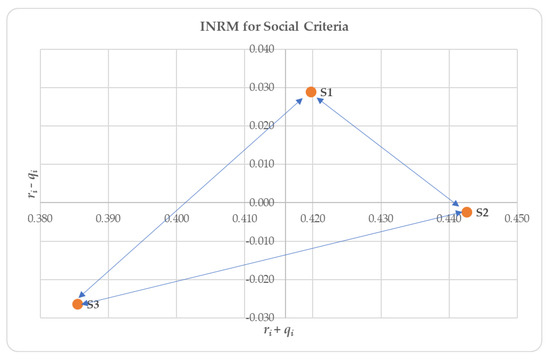
Figure 7.
INRM of the social criteria.
4.3.2. DANP Process
The weights of the criteria and sub–criteria are derived through several steps.
Step 1: Each submatrix is normalized to convert CG to CH. Each submatrix Gij in CG is normalized in this stage. Equation (12) is an example of the normalizing of Hm1. Hm1 may be calculated by dividing each row in Gij by its total. The normalized total influence matrix CH is created by normalizing the total influence matrix by the criteria. The normalized total influence matrix CH is shown in Table 12.
Table 12.
The normalized total influence matrix CH.
Step 2: CH is transposed to generate the unweighted supermatrix WC. The unweighted supermatrix WC is composed of submatrix Hij′, which has been transposed from CH. The unweighted supermatrix WC is shown in Table 13.
Table 13.
The unweighted supermatrix WC.
Step 3: The total influence matrix DN is normalized for the criteria. In the normalized total impact matrix DN, each element is divided by the sum of each row in D. Additionally, the weight of each criterion may also be determined, as shown in the example of Dim.1 in Equation (16), where n is the number of criteria.
Step 4: WC and DN are combined to generate the weighted supermatrix WC*. Each submatrix Wij is multiplied by the relevant dij of the total influence matrix DN that has been normalized. Equation (17) displays the influential values used to determine the weighted supermatrix. The weighted supermatrix WC* is shown in Table 14.
Table 14.
The weighted supermatrix WC*.
Step 5: The weighted supermatrix is limited, and the overall priority is calculated. The weighted supermatrix WC* is multiplied by itself k times, with k increasing to sufficiently large powers until the supermatrix converges and gains long-term stability.
On the diagonal of the limited supermatrix Wlimit, the DANP weights are obtained. These weights represent the relative significance of each component. Table 15 represents the weights of the criteria and sub–criteria for choosing a sustainable supplier, hence, their relative importance can be determined.
Table 15.
Sustainable supplier criteria and sub–criteria weights.
According to the findings, the social criteria are the most significant, with a weight of 0.350. Because the paint business values suppliers that comply with the law and ensure their workers’ health and safety, social criteria have the most weight, followed by economic criteria with a weight of 0.344, and environmental criteria with a weight of 0.306. Our results differ from previous research when economic criteria were ranked first and social criteria were ranked second [1,25,26]. Although the criteria applied in this research are broad and can be used to various industries with minimal modifications, the weights of the predetermined criteria are highly dependent on the product, type of supplier, and supply period [25]. Globally, the top three key sub–criteria are “Respect for the Law” (S2), “Health and Safety” (S1), and “Worker’s Social Rights” (S3).
4.4. Assessing the Supplier
A case study of a paint and coating industry served as the basis for evaluating the effectiveness of the proposed two-stage Multiple Criteria Decision Making (MCDM) model, specifically DANP and MARCOS. The objective was to identify the most suitable suppliers for alkyd resin (A1, A2, A3, A4, A5), TiO2 (B1, B2, B3, B4), and talc (C1, C2, C3) materials. The MARCOS method determined the ideal and anti-ideal solutions for each criterion. The ideal is the maximum value associated with each criterion, while the lowest value is considered anti-ideal. We compute the ultimate utility function of suppliers. These parameters establish the final ranking of suppliers. Table 16 displays the utility function and the final ranking of the suppliers.
Table 16.
The utility function and the final ranking of the suppliers.
According to Table 16, the highest-rated supplier of TiO2 raw materials is B2. The next tier of suppliers for TiO2 raw materials includes B4, B1, and B3. We list the alkyd resin raw materials suppliers in the following order: Supplier A1 is listed first, followed by suppliers A4, A2, A3, and A5. The sequence of suppliers for talc raw materials is as follows: providers C2, C1, and C3.
5. Results and Discussion
To assess sustainable suppliers, a set of sub–criteria encompassing three main criteria was created. The study examined the significant connections between the criteria and sub–criteria, and the model was then developed based on INRM.
5.1. Analyzing the Results
The sustainable supplier selection sub–criteria and their interrelationships are identified. Figure 8 depicts the sustainable supplier selection interrelationships model.
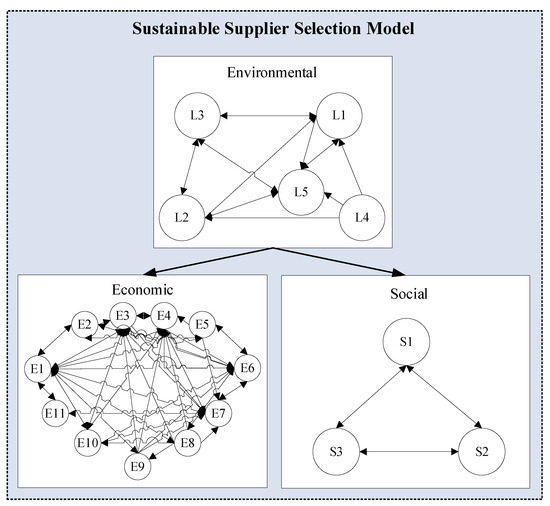
Figure 8.
Sustainable supplier selection interrelationships model.
Figure 8 illustrates that the sub–criteria of sustainable supplier selection exhibit a complex relationship. One of the three criteria and eight of the nineteen sub–criteria are causal criteria and sub–criteria, respectively. The following criteria and sub-criteria are considered: Environmental (L) criteria, “Quality” (E2), “Service” (E4), “Technology Capability” (E5), “Capacity of the Supplier” (E8), “Flexibility” (E9), “Green Material” (L3), “Green Packaging” (L4), and “Health and Safety” (S1) sub–criteria. According to experts, the most influential factor in choosing a sustainable supplier is the Environmental (L) criteria. However, experts do not disregard the significance of social and economic factors. Alternatively, it might indicate that environmental issues now have greater importance in the paint and coating industry in Indonesia. The company will not enter into a contract with a supplier that does not have a robust environmental management system since this might risk the health and safety of employees and, therefore, affect delivery timelines. This criteria is expected to impact the other two criteria significantly.
“Quality” (E2) is a sub-criterion that has the ability to impact other sub–criteria. This aligns with existing research, which identifies quality as a causal sub-criterion [15]. According to Figure 8, the “Quality” (E2) sub–criteria has an impact on “Cost” (E1), “Delivery” (E3), “Technology Capability” (E5), and “Reputation” (E6). An increase in quality will result in an increase in cost, on-time delivery, advancements in technological capabilities, and a positive reputation. Furthermore, the interdependent connection between “Quality” (E2) and “Cost” (E1), as well as “Quality” (E2) and “Technology Capability” (E5), is seen as having a mutual link. In this instance, an increase in quality will cause the company to spend more cost and an increase in cost will cause further improvements in quality. This mutual link also exists between “Quality” (E2) and “Technology Capability” (E5), where an improvement in quality will lead to a development in the company’s technology in order to uphold the quality standards. Similarly, an increase in technology capability will lead to an improvement in quality. However, this sub-criterion does not directly impact the other sub–criteria such as “Relationship” (E7) sub–criteria, but the linkage can be moderated with another sub–criteria, in this case is “Delivery” (E3) sub–criteria. The connection between quality and relationship appears to be influenced by “Delivery” (E3) sub–criteria. This applies to other sub–criteria; as the quality improves, the other sub–criteria will increase as well.
Additionally, according to Figure 8, the “Service” (E4) sub-criterion has an interrelation with “Cost” (E1), “Delivery” (E3), “Reputation” (E6), and “Relationship” (E7) sub–criteria. This implies that when the supplier improves its service, their relationship with the buying company will become stronger. As the relationship strengthens, the supplier will provide optimal service.
Moreover, new sub–criteria, namely “Payment Term” (E11), has been included in the economic criteria. The inclusion of this sub-criterion is the unique aspect of this study, as it introduces new interrelationships between sub–criteria in the economic criteria shown in Figure 8. Particularly noteworthy is the impact of other sub–criteria on the “Payment Term” (E11) sub–criteria, and vice versa.
This interrelation is exists between the other causal sub–criteria and it is beneficial because a little improvement in one sub-criterion can impact the other sub–criteria, for instance “Green Material” (L3) and “Green Packaging” (L4) sub–criteria have an impact on “Environment Management System” (L1), “Pollution Production” (L2), and “Waste Management” (L5) sub–criteria. This implies that the frequency with which a supplier utilizes green materials and packaging directly correlates with the level of implementation of environmental management systems, the reduction of pollution, and the effective waste management practices of that supplier. Every cause-and-effect relationship that arises will add complexity to the decision-making process. Hence, the decision-maker has to determine the critical sub–criteria. While these results demonstrate causal criteria and sub–criteria, and a level of correlation among them, they do not provide information on their weights or priority levels.
The data indicate that the social factor has the highest level of importance, with a weight of 0.350. Given the paint industry’s focus on suppliers that adhere to legal requirements and prioritize the well-being and safety of their employees, social factors have the most significance. The sub-criterion known as “Respect for the Law” (S2) has a weight of 0.123, which places it at the top of the global rankings. According to the FGD, choosing suppliers that fully comply with the law is essential to ensure smooth operations. The second-ranked sub-criterion is “Health and Safety” (S1) with a weight of 0.122. Suppliers prioritizing their workers’ health and safety will have a more stable company, which is a crucial aspect of sourcing. The “Worker’s Social Right” (S3) sub-criterion occupies the third position with a weight of 0.104. Suppliers that care about the rights of their workers will ensure that their employees are wealth and work for a long time, which will result in a stronger relationship between suppliers and businesses.
Moreover, the sub–criteria are compared between those with the highest prominence values (the most significant), those with high prominence and relation values, and those with the highest weight. Table 17 summarizes the relevance of the key sub–criteria when selecting a sustainable supplier.
Table 17.
Summary of the key sub–criteria of sustainable supplier.
From Table 17, “Cost” (E1) is shown to be the most significant and has the highest weight in Economic Criteria. Even this sub-criterion is significantly influenced by others, and is still the top priority among Economic Criteria. However, “Service” (E4) has a large influence on the other sub–criteria. This indicates that a supplier’s service is the key to achieving market leadership in terms of cost, on-time delivery, a positive reputation, and a favorable working relationship. Therefore, “Cost” (E1) and “Service” (E4) are the most crucial sub–criteria in Economic Criteria.
The most crucial sub-criterion in Environmental Criteria is “Environment Management System” (L1). Even if other sub–criteria influenced this sub-criterion, the impact was substantialsub–criteria. “Green Material” (L3), on the other hand, has a significant impact on the other sub–criteria. This implies that a supplier’s decision to deliver green material is critical to running an environment management system, limiting pollution output, and optimizing waste management. Finally, the Environmental Criteria ranks “Waste Management” (L5) first. Selecting waste management providers is vital to ensuring that no trash pollutes the environment and that all operations function properly. As a result, the key sub–criteria in Environmental Criteria are “Environmental Management System” (L1), “Green Material” (L3), and “Waste Management” (L5). Prior studies in the textile dyeing company, which ranked “Environment Management System” as one of the top five sub–criteria [18], are consistent with these findings.
In Social Criteria, “Respect for Law” (S2) is demonstrated to be the most important and has the greatest weight. Even though others heavily impact this sub-criterion, it remains the top priority in Social Criteria. “Health and Safety” (S1), however, substantially affects the other sub–criteria. This means that the health and safety of a supplier will influence the company’s compliance with relevant laws and the fulfillment of labor rights. As a result, the most important sub–criteria in Social Criteria are “Health and Safety” (S1) and “Respect for Law” (S2).
5.2. Conducting Sensitivity Analysis
Analysis of sensitivity is a widely used technique in the field of optimization problems. Its purpose is to comprehend the response of the final solution of the issue to variations in the input parameters [45]. A sensitivity analysis was performed to assess the robustness of the acquired data. This was accomplished by adjusting the primary weights for each of the seven experts individually while maintaining equal weights for the other experts [45]. The allocated weights for experts in each scenario are shown in Table 18. Distinct total relationship matrices of sustainable supplier selection sub–criteria were derived for each scenario using sensitivity analysis. Table 19 displays the calculated influence relation among sub–criteria for each scenario. Table 20 presents the weight of sustainable supplier selection criteria, and Table 21 presents the weight of sustainable supplier selection sub–criteria derived from sensitivity analysis.
Table 18.
Expert weights in sensitivity analysis.
Table 19.
Influence relation among sub–criteria that were found during sensitivity analysis.
Table 20.
Sustainable supplier selection criteria weights on sensitivity analysis.
Table 21.
Sustainable supplier selection sub–criteria weights on sensitivity analysis.
The results of the sensitivity analysis indicate that the cause and effect groups are clustered consistently. Additionally, the ranking order for the sub–criteria of sustainable supplier selection remains similar in each situation, with insignificant differences in order. Therefore, there is, indeed, no significant bias in the impact of evaluations provided by the experts.
6. Conclusions
This study identified major drivers of sustainable supplier selection. This research utilized an FGD to gather all information regarding sustainable supplier selection, the Delphi method to reach a consensus on sustainable supplier selection sub–criteria, the DEMATEL approach to analyze the cause−effect relationships among criteria and sub–criteria, and the DANP to weight criteria and sub–criteria when selecting sustainable suppliers. The following findings show that a novel sustainable supplier selection model has been successfully developed. The model includes sub–criteria derived from studies and expert views collectively agreed upon through FGD and Delphi. A new sub-criterion, namely “Payment Term” (E11), has been included in the economic criteria. It is essential to point out that researchers have not previously used these sub–criteria. The model also depicts the correlation between criteria and sub–criteria, and the magnitude of this correlation. The in-depth analysis has identified several key sub–criteria that should be considered. These include economic criteria such as “Cost” (E1) and “Service” (E4), environmental criteria such as “Environment Management System” (L1), “Green Material” (L3), and “Waste Management” (L5), and social criteria such as “Health and Safety” (S1) and “Respect for Law” (S2). Second, the criteria and sub–criteria were properly weighted, and were as follows: The social criteria had the most weight, with a weight of 0.35, followed by the economic criteria, with a weight of 0.344. The highest sub-criterion weight globally was assigned to “Respect for the Law” (S2), with a weight of 0.123. It was followed by “Work Health and Safety” (S1) with a weight of 0.122, “Employee Rights” (S3) with a weight of 0.104, “Waste Management” (L5) with a weight of 0.069, and “Environmental Management System” with a weight of 0.068.
This research adds to the existing literature and provides practical and managerial implications. Firstly, this study employed broad criteria that, with minor modifications, could apply to other areas. The research presents a detailed set of sub–criteria for selecting and assessing sustainable suppliers for a system. This initiative assists suppliers in enhancing the operational efficiency of their sustainable supply chains. Second, the DANP approach facilitates experts in systematically reaching more rational decision outcomes and allows them to analyze the causative criteria and sub–criteria. Third, the results showed that social criteria were the most important when choosing suppliers. While selecting suppliers, managers must prioritize law, health, safety, and workers’ social rights. Last, this study provides firms with the advantage of identifying sustainable suppliers, enabling them to incorporate sustainable practices into their operations. As a result, companies may expand their market and establish themselves as global businesses.
Although this approach successfully assists company managers in identifying and analyzing crucial factors for sustainable supplier selection, it has limitations. Initially, the survey question may require significant time due to including various sub–criteria. We suggest merging several sub–criteria in future research to improve the practicality of the survey approach. Moreover, the connection and weight of specified sub–criteria vary by product, supplier, and supply period; thus, managers must frequently evaluate them. Managers should also collaborate with suppliers to notify them of their sustainability goals. Furthermore, although this model incorporates comprehensive criteria and sub–criteria, it is essential to note that some sub–criteria may have varying degrees of importance in the context of distribution suppliers compared to manufacturing suppliers. Subsequent investigations should indicate if the source is a manufacturer or a distributor. Finally, to conduct a thorough study and provide meaningful comparisons, further studies must diversify the evaluation methodologies. Future research is necessary to validate these results in supplier selection.
Author Contributions
Conceptualization, A.C.D., T.Y.M.Z. and R.A.; methodology, A.C.D.; investigation, A.C.D.; writing—original draft preparation, A.C.D.; writing—review and editing, A.C.D., T.Y.M.Z. and R.A.; supervision, T.Y.M.Z. and R.A.; funding acquisition, T.Y.M.Z. and R.A. All authors have read and agreed to the published version of the manuscript.
Funding
This research was partially funded through Seed Funding Grant 2023–2024, grant number NKB-2619/UN2.F4.D/PPM.00.00/2023. The writers’ viewpoints may not represent those of their institution or funder.
Institutional Review Board Statement
Not applicable.
Informed Consent Statement
Not applicable.
Data Availability Statement
The whole dataset supporting the findings of this research is accessible upon inquiry.
Acknowledgments
We appreciate the respondents’ willingness to provide data for this study. The authors claim no financial or personal relationships impacted their authorship of this article.
Conflicts of Interest
The authors declare no conflicts of interest.
References
- Menon, R.R.; Ravi, V. Using AHP-TOPSIS methodologies in the selection of sustainable suppliers in an electronics supply chain. Clean. Mater. 2022, 5, 100130. [Google Scholar] [CrossRef]
- Büyüközkan, G.; Çifçi, G. A novel fuzzy multi-criteria decision framework for sustainable supplier selection with incomplete information. Comput. Ind. 2011, 62, 164–174. [Google Scholar] [CrossRef]
- Nsikan, J.; Affiah, E.A.; Briggs, I.; Koko, N. Sustainable supplier selection factors and supply chain performance in the Nigerian healthcare industry. J. Transp. Supply Chain. Manag. 2022, 16, 633. [Google Scholar] [CrossRef]
- Ghayebloo, S.; Tarokh, M.J.; Venkatadri, U.; Diallo, C. Developing a bi-objective model of the closed-loop supply chain network with green supplier selection and disassembly of products: The impact of parts reliability and product greenness on the recovery network. J. Manuf. Syst. 2015, 36, 76–86. [Google Scholar] [CrossRef]
- Rashidi, K.; Noorizadeh, A.; Kannan, D.; Cullinane, K. Applying the triple bottom line in sustainable supplier selection: A meta-review of the state-of-the-art. J. Clean. Prod. 2020, 269, 122001. [Google Scholar] [CrossRef]
- Moheb-Alizadeh, H.; Handfield, R. Sustainable supplier selection and order allocation: A novel multi-objective programming model with a hybrid solution approach. Comput. Ind. Eng. 2019, 129, 192–209. [Google Scholar] [CrossRef]
- Sen, D.; Datta, S.; Mahapatra, S.S. Sustainable supplier selection in intuitionistic fuzzy environment: A decision making perspective. Benchmarking Int. J. 2018, 25, 545–574. [Google Scholar] [CrossRef]
- Gebauer, H.; Fleisch, E. An investigation of the relationship between behavioral processes, motivation, investments in the service business and service revenue. Ind. Mark. Manag. 2007, 36, 337–348. [Google Scholar] [CrossRef]
- Jakhar, S.K.; Rathore, H.; Mangla, S.K. Is lean synergistic with sustainable supply chain? An empirical investigation from emerging economy. Resour. Conserv. Recycl. 2018, 139, 262–269. [Google Scholar] [CrossRef]
- Er Kara, M.; Oktay Fırat, S.Ü. Supplier Risk Assessment Based on Best-Worst Method and K-Means Clustering: A Case Study. Sustainability 2018, 10, 1066. [Google Scholar] [CrossRef]
- Memari, A.; Dargi, A.; Jokar, M.R.A.; Ahmad, R.; Rahim, A.R.A. Sustainable supplier selection: A multi-criteria intuitionistic fuzzy TOPSIS method. J. Manuf. Syst. 2019, 50, 9–24. [Google Scholar] [CrossRef]
- Inkwood. Indonesia Paints & Coatings Market Forecast 2021–2025; Inkwood: Boston, MA, USA, 2020. [Google Scholar]
- Ismawati, Y.; Primanti, A.; Brosche, S.; Clark, S.; Weinberg, J.; Denney, V. Timbal dalam Cat Enamel Rumah Tangga di Indonesia; Bali Fokus: Bali, Indonesia, 2013. [Google Scholar]
- Gao, H.; Ju, Y.; Gonzalez, E.D.S.; Zeng, X.J.; Dong, P.; Wang, A. Identifying critical causal criteria of green supplier evaluation using heterogeneous judgements: An integrated approach based on cloud model and DEMATEL. Appl. Soft Comput. 2021, 113, 107882. [Google Scholar] [CrossRef]
- Giri, B.C.; Molla, M.U.; Biswas, P. Pythagorean fuzzy DEMATEL method for supplier selection in sustainable supply chain management. Expert Syst. Appl. 2022, 193, 116396. [Google Scholar] [CrossRef]
- Ulutaş, A.; Topal, A.; Pamučar, D.; Stević, Ž.; Karabašević, D.; Popović, G. A New Integrated Multi-Criteria Decision-Making Model for Sustainable Supplier Selection Based on a Novel Grey WISP and Grey BWM Methods. Sustainability 2022, 14, 16921. [Google Scholar] [CrossRef]
- Amindoust, A.; Ahmed, S.; Saghafinia, A.; Bahreininejad, A. Sustainable supplier selection: A ranking model based on fuzzy inference system. Appl. Soft Comput. 2012, 12, 1668–1677. [Google Scholar] [CrossRef]
- Rahman, M.M.; Bari, A.B.M.M.; Ali, S.M.; Taghipour, A. Sustainable supplier selection in the textile dyeing industry: An integrated multi-criteria decision analytics approach. Resour. Conserv. Recycl. Adv. 2022, 15, 200117. [Google Scholar] [CrossRef]
- Machesa, M.; Tartibu, L.; Okwu, M. Selection of sustainable supplier(S) in a paint manufacturing company using hybrid meta-heuristic algorithm. S. Afr. J. Ind. Eng. 2020, 31, 13–23. [Google Scholar] [CrossRef]
- Beiki, H.; Mohammad Seyedhosseini, S.; Ponkratov, V.V.; Zekiy, A.O.; Ivanov, S.A. Addressing a sustainable supplier selection and order allocation problem by an integrated approach: A case of automobile manufacturing. J. Ind. Prod. Eng. 2021, 38, 239–253. [Google Scholar] [CrossRef]
- Çalık, A. A hybrid approach for selecting sustainable suppliers and determining order allocation based on interval type-2 fuzzy sets. J. Enterp. Inf. Manag. 2020, 33, 923–945. [Google Scholar] [CrossRef]
- Feng, J.; Gong, Z. Integrated linguistic entropy weight method and multi-objective programming model for supplier selection and order allocation in a circular economy: A case study. J. Clean. Prod. 2020, 277, 122597. [Google Scholar] [CrossRef]
- Jia, R.; Liu, Y.; Bai, X. Sustainable supplier selection and order allocation: Distributionally robust goal programming model and tractable approximation. Comput. Ind. Eng. 2020, 140, 106267. [Google Scholar] [CrossRef]
- Liaqait, R.A.; Warsi, S.S.; Agha, M.H.; Zahid, T.; Becker, T. A multi-criteria decision framework for sustainable supplier selection and order allocation using multi-objective optimization and fuzzy approach. Eng. Optim. 2021, 54, 928–948. [Google Scholar] [CrossRef]
- Bektur, G. An integrated methodology for the selection of sustainable suppliers and order allocation problem with quantity discounts, lost sales and varying supplier availabilities. Sustain. Prod. Consum. 2020, 23, 111–127. [Google Scholar] [CrossRef]
- Nasr, A.K.; Tavana, M.; Alavi, B.; Mina, H. A novel fuzzy multi-objective circular supplier selection and order allocation model for sustainable closed-loop supply chains. J. Clean. Prod. 2020, 287, 124994. [Google Scholar] [CrossRef]
- You, S.Y.; Zhang, L.J.; Xu, X.G.; Liu, H.C. A new integrated multi-criteria decision making and multi-objective programming model for sustainable supplier selection and order allocation. Symmetry 2020, 12, 302. [Google Scholar] [CrossRef]
- Rabieh, M.; Rafsanjani, A.F.; Babaei, L.; Esmaeili, M. Sustainable supplier selection and order allocation: An integrated delphi method, fuzzy topsis, and multi-objective programming model. Sci. Iran. 2019, 26, 2524–2540. [Google Scholar] [CrossRef]
- Gören, H.G. A decision framework for sustainable supplier selection and order allocation with lost sales. J. Clean. Prod. 2018, 183, 1156–1169. [Google Scholar] [CrossRef]
- Khoshfetrat, S.; Rahiminezhad Galankashi, M.; Almasi, M. Sustainable supplier selection and order allocation: A fuzzy approach. Eng. Optim. 2020, 52, 1494–1507. [Google Scholar] [CrossRef]
- Awasthi, A.; Govindan, K.; Gold, S. Multi-tier sustainable global supplier selection using a fuzzy AHP-VIKOR based approach. Int. J. Prod. Econ. 2018, 195, 106–117. [Google Scholar] [CrossRef]
- Govindan, K.; Mina, H.; Esmaeili, A.; Gholami-Zanjani, S.M. An integrated hybrid approach for circular supplier selection and closed loop supply chain network design under uncertainty. J. Clean. Prod. 2020, 242, 118317. [Google Scholar] [CrossRef]
- Mohammed, A.; Harris, I.; Govindan, K. A hybrid MCDM-FMOO approach for sustainable supplier selection and order allocation. Int. J. Prod. Econ. 2019, 217, 171–184. [Google Scholar] [CrossRef]
- Liu, K.; Liu, Y.; Qin, J. An integrated ANP-VIKOR methodology for sustainable supplier selection with interval type-2 fuzzy sets. Granul. Comput. 2018, 3, 193–208. [Google Scholar] [CrossRef]
- Tavana, M.; Yazdani, M.; Di Caprio, D. An application of an integrated ANP–QFD framework for sustainable supplier selection. Int. J. Logist. Res. Appl. 2017, 20, 254–275. [Google Scholar] [CrossRef]
- Chen, Z.; Ming, X.; Zhou, T.; Chang, Y. Sustainable supplier selection for smart supply chain considering internal and external uncertainty: An integrated rough-fuzzy approach. Appl. Soft Comput. 2020, 87, 106004. [Google Scholar] [CrossRef]
- Mohammed, A.; Setchi, R.; Filip, M.; Harris, I.; Li, X. An integrated methodology for a sustainable two-stage supplier selection and order allocation problem. J. Clean. Prod. 2018, 192, 99–114. [Google Scholar] [CrossRef]
- Wan, S.-p.; Xu, G.-l.; Dong, J.-y. Supplier selection using ANP and ELECTRE II in interval 2-tuple linguistic environment. Information Sciences 2017, 385, 19–38. [Google Scholar] [CrossRef]
- Chen, S.-H.; Lin, W.-T. Analyzing determinants for promoting emerging technology through intermediaries by using a DANP-based MCDA framework. Technol. Forecast. Soc. Chang. 2018, 131, 94–110. [Google Scholar] [CrossRef]
- Gabus, A.; Fontela, E. Perceptions of the World Problematique: Communication Procedure, Communicating with Those Bearing Collective Responsibility; Batelle Geneva Research Centre: Geneva, Switzerland, 1973. [Google Scholar]
- Gardas, B.B.; Raut, R.D.; Narkhede, B. Modelling the challenges to sustainability in the textile and apparel (T&A) sector: A Delphi-DEMATEL approach. Sustain. Prod. Consum. 2018, 15, 96–108. [Google Scholar] [CrossRef]
- Peng, K.-Y.; Liao, H.-L. A Study on the Key Factors of CSR Indicators for Tenderers in Procurement Screening Using the Delphi Method and DEMATEL-Based Analytic Network Process. Adm. Sci. 2022, 12, 151. [Google Scholar] [CrossRef]
- Głuszek, E. Use of the e-Delphi Method to Validate the Corporate Reputation Management Maturity Model (CR3M). Sustainability 2021, 13, 12019. [Google Scholar] [CrossRef]
- Wang, C.N.; Nguyen, T.T.T.; Dang, T.T.; Nguyen, N.A.T. A Hybrid OPA and Fuzzy MARCOS Methodology for Sustainable Supplier Selection with Technology 4.0 Evaluation. Processes 2022, 10, 2351. [Google Scholar] [CrossRef]
- Rajak, S.; Parthiban, P.; Dhanalakshmi, R. Analysing barriers of sustainable transportation systems in India using Grey-DEMATEL approach: A supply chain perspective. Int. J. Sustain. Eng. 2021, 14, 419–432. [Google Scholar] [CrossRef]
Disclaimer/Publisher’s Note: The statements, opinions and data contained in all publications are solely those of the individual author(s) and contributor(s) and not of MDPI and/or the editor(s). MDPI and/or the editor(s) disclaim responsibility for any injury to people or property resulting from any ideas, methods, instructions or products referred to in the content. |
© 2024 by the authors. Licensee MDPI, Basel, Switzerland. This article is an open access article distributed under the terms and conditions of the Creative Commons Attribution (CC BY) license (https://creativecommons.org/licenses/by/4.0/).