You are currently viewing a new version of our website. To view the old version click .
Sustainability
  • Article
  • Open Access

2 September 2024

Air Pollution and Corporate Innovation: Does Top Management Quality Mediate and Government Talent Policy Moderate?

,
,
and
1
School of Economics and Management, Changsha University of Science and Technology, Changsha 410004, China
2
Zhejiang College, Shanghai University of Finance and Economics, Jinhua 321000, China
*
Author to whom correspondence should be addressed.
This article belongs to the Special Issue Advancing Sustainable Cities and Urban Regions Development: New Challenges and Prospects

Abstract

Air pollution not only poses significant threats to the physical and mental well-being of individuals, but it also has the potential to trigger a regional brain drain, thus inhibiting corporate innovation performance. This study explores the impact of air pollution on corporate innovation from the perspective of top management quality. We find that lower air quality significantly reduces the quality of corporate top management, thereby reducing their innovation output. However, local government talent attention alleviates the negative impact of air pollution on corporate innovation. Further analysis reveals that the local government’s environmental attention aggravates the negative effects of air pollution on corporate innovation. Finally, executive compensation alleviates the negative impact of air pollution on corporate innovation.

1. Introduction

Severe air pollution problems accompany the rapid development of emerging economies. China, for example, ranked 168th out of 180 participating countries and regions in the Air Quality Index [1]. Air pollution adversely affects physiological function, cognitive abilities, and mental wellness, which brings significant negative externalities to human production and life. It significantly increases residents’ risk of cardiovascular and respiratory diseases [2], shortens life expectancy, increases hospitalization and mortality rates [3,4], and predisposes them to anxiety and depression [5,6], as well as reducing subjective well-being [7,8]. Globally, governments and international organizations have implemented a number of green policies to address the issue of air pollution. One such initiative is the Paris Agreement, which was signed in 2016 and aims to limit the increase in the average global temperature while directly addressing the issue of greenhouse gas emissions [9]. The BreathLife campaign was initiated by the United Nations Environment Programme (UNEP), the World Health Organization (WHO), and the Climate and Clean Air Coalition (CCAC) in the same year in order to mitigate the effects of air pollution on public health [10]. The 50th anniversary of the Clean Air Act was commemorated in the United States in 2020. This legislation was initially implemented in 1970 with the aim of regulating air pollution and enhancing air quality in the United States [11]. Continued efforts and policy support are needed to further improve air quality. Air pollution has a direct negative impact on the standard of human capital inputs used by businesses, which is manifested in the generation of slacking behavior, reducing the productivity of individuals [12] and further inhibiting their innovative vitality [13,14].
Innovation is considered to be significantly influenced by human capital [15]. Air pollution not only directly undermines the innovative vitality of the individual labor force but also leads to the loss of the regional and corporate stock of talent. Based on the theory of “voting with their feet” [16,17], residents’ health costs rise [18], and the propensity of residents to migrate increases [19,20], as a result of health issues linked to air pollution. A highly qualified workforce, in particular, would be more aware of the quality of the air [21]. This highly skilled workforce is more likely to pay to improve air quality and reduce air pollution as they can afford the fees associated with changing jobs [22,23]. As a result, air pollution causes a decrease in the human capital reserves of businesses and consequently discourages firms from innovating, leading to a “brain drain effect” [12,13,24,25]. Nonetheless, existing research has studied the brain drain effect associated with air pollution with more consideration of the loss of labor in general or highly qualified labor in particular, ignoring the unique role of corporate top management. We aim to make progress in closing this research gap in the current body of literature.
China faces the dual challenge of advancing environmental governance while sustaining robust economic development. In 2023, China’s 339 prefectural and larger cities did not comply with the air quality criteria, which provides a suitable research scenario for our study [26]. We used a sample of public companies in the Chinese Shanghai and Shenzhen markets from 2004 to 2019 to empirically study the effects of air pollution (PM 2.5 concentration) on corporate innovation with respect to the locations of the companies. We focused on testing the mediating role played by the quality of top management, as well as the role of government talent policies as a moderator. In addition, this study analyzes the moderating role of government environmental attention and executive compensation. Finally, the robustness of the results is verified through rigorous endogeneity and robustness tests. We obtained four main findings. First, air pollution significantly inhibits firms’ innovation output. Second, air pollution significantly reduces the quality of corporate top management. Third, the top management quality mediates the effect of air pollution on firms’ innovation. Fourth, local government talent policies have been shown to alleviate the detrimental influences of air pollution on firms’ innovative capabilities to a significant degree. Moreover, this study reveals that executive compensation mitigates the adverse effect of air pollution on firm innovation to some extent. Meanwhile, government environmental attention exacerbates the adverse effect of air pollution on firm innovation. These results offer governments and businesses a theoretical foundation and empirical support for preventing and controlling air pollution, optimizing talent conservation, and maximizing talent benefits. Furthermore, they hold great theoretical and practical importance in advancing the superior growth of transition economies.
This study makes contributions in the following three areas: First, it improves upon studies on air pollution and business economic behavior. Air pollution-induced human capital flows and their microeconomic consequences have received increasing attention, with existing studies focusing more on the general labor force or generalized highly qualified personnel [13,14,25], and the top management has been scarcely studied as a critical element of corporate innovation. This study establishes the negative impact of air pollution on corporate innovation and verifies the mediating role played by the top management team as a necessary countermeasure to the brain drain effect of air pollution. This is the first time that the quality of the top management has been included in the analytical framework considering air pollution and corporate innovation.
Second, it expands the research related to the human capital of corporate management. Corporate innovation is significantly influenced by the level of competence of top management [27]. However, little research exists on the factors influencing the human capital of top management. This study introduces air pollution as an exogenous variable and verifies its negative impact on the quality of corporate top management.
Third, it adds to the literature on talent policy. Air pollution raises the compensation requirements for corporate executives [28,29]. As a result, corporate pay rises to retain talent have undoubtedly exacerbated the crowding out of corporate funds due to pollution treatment and R&D investments. Local government talent policies provide monetary and non-monetary incentives to attract and gather talent [30]. We examine the impact of local government talent initiatives on reducing the negative externalities of air pollution and suggest a viable policy justification.
The remainder of this article is structured as follows. Section 2 reviews the related literature and formulates the research hypotheses. Section 3 presents the research design. Section 4 shows the empirical results. Section 5 describes the analysis of the impact mechanisms. Section 6 outlines the conclusion and future directions.

3. Research Design

3.1. Sample Selection and Data Sources

We used all Chinese A-share listed companies from 2004 to 2019 as the initial sample (Considering the relevant data currently published by China Meteorological Network is as of 2019, and there are more missing values in the relevant databases, the data from 2004–2019 were selected to ensure the reliability of the results). The data were screened according to the following criteria: (1) companies with delisting treatment such as ST, PT, and ST*, among others, and located in cities with incomplete PM2.5 data were excluded; (2) financial companies in sectors such as banking, insurance, and securities; those with missing and abnormal patents, financial, R&D and manager data; or with the total number of patent applications less than 1 were excluded, and (3) all continuous variables were winsorized at the level of 1%. After the above screening steps, the sample obtained comprised 3088 listed companies with 13,654 firm-year observations.
The CSMAR database (China Stock Market & Accounting Research Database) provides basic information about listed companies, financial data, and data for constructing the top management quality indicators. The data for PM2.5 and AQI indices were collected from the CNRDS (Chinese Research Data Services Platform) and the official website of China’s Ministry of Ecology and Environment. Patent applications, patents granted, and R&D investment data were all sourced from the CNRDS. Local governments’ talent policy data were manually collected from each local government’s annual work report.

3.2. Definition of Variables

3.2.1. Explanatory Variables

Air Pollution (LnPM). Referring to Van et al. [62], the annual average PM2.5 concentration value at the city level were selected as the core indicator based on careful consideration of air pollution data’s availability, objectivity, and reliability. In order to match the data of companies and cities, we first collected the office address information of listed companies from the CSMAR database. Then we matched it to the city’s air pollution indicator (PM2.5). The city’s PM2.5 concentration was measured by taking the natural logarithm.

3.2.2. Explained Variables

Three indicators are used to represent the innovation level of enterprises, including the number of patent applications (PatentApply), the number of patents granted (PatentGrant), and the intensity of R&D investment (RD-Ratio). Among them, the number of patents applied for and granted represents the R&D output (We take the natural logarithm of the number of patent applications plus 1 and the number of patents granted plus 1, respectively. To avoid the influence of extreme values on the results, the variable of the number of patent applications was winsorized by winsor2; that is, it was truncated at the upper and lower 1% quartiles, and the natural logarithm was taken by adding 1 to the truncated value), and the R&D investment intensity represents the R&D input (The time frame for this analysis was 2007–2019, as R&D investment data for Chinese listed companies have been published since 2007) (R&D expenditure/total assets). We adopted an integrated perspective of R&D outputs and inputs to measure firms’ innovation level, in order to better ensure the robustness of the findings.

3.2.3. Mediating Variables

Top Management Quality (TMQ). Referring to Chemmanur & Paeglis [33] and Chemmanur et al. [27], and combining the information on top managers disclosed in the annual reports of each company, we define as managers with a title of division director or higher. The senior managers in our sample can be broadly categorized in seven groups: CEOs, presidents, board members, other chief officers (CFO, etc.), division heads, VPs, and others. In detail, we include board members who hold positions of authority, supervisory board members, presidents, vice presidents, general managers, deputy general managers, financial directors, technical directors, chief executive officers, chief financial officers, chief economists, secretaries of boards of directors, and secretaries of party committees. Under our research scenario, we selected well-validated top managerial characteristics that significantly affect innovation activities, including the education level [58,63,64], overseas experience [7,65], academic background [66], financial background [67,68], professional background [69,70], holding of multiple positions [71,72,73] and executive career experience [36].
Based on this, we first constructed the following seven sub-indicators: PhD (the number of corporate managers who have obtained a doctoral degree); Overseas (the number of corporate managers with overseas study or work experience); Academic (the number of corporate managers with an academic background); Fin (the number of corporate managers with a financial background); Profession (the number of corporate managers in the production, operation, R&D, sales or finance function in the management team); Higher (the number of managers who hold the position of vice chairman or vice general manager and higher positions); and Exp (the number of managers who held the position of CEO, CFO, vice director or above in other companies before joining the company). The above seven sub-indicators were adjusted, and three common components were extracted using principal component analysis with a KMO (Kaiser Meyer Olkin) value of 0.681 to obtain the following Equation (1).
T M Q = 0.123 P h D + 0.160 O v e r s e a s + 0.087 A c a d e m i c + 0.180 F i n + 0.156 P r o f e s s i o n + 0.067 H i g h e r + 0.028 E x p
Thus, higher TMQ scores reflect the higher quality of top management human capital, where PhD, Overseas, Academic, Fin, Profession, Higher, and Exp are standardized data.

3.2.4. Moderating Variables

Local Talent (LT), the local government’s attention to scientific and technological talents, was selected as a proxy variable for the intensity of talent policies implemented by prefecture-level city governments. First, the Local Government Work Reports (including 274 prefecture-level cities of 31 provinces) from 2008 to 2019 were collected manually. Second, the frequency of the occurrence of words related to science and technology talents was counted via word segmentation of the government report texts, and the frequency was taken as the natural logarithm. The related words are talent resources, high-level talents, talent team formation, leading talents, scientific and technological innovation and so on.

3.2.5. Control Variables

Based on existing studies, we selected control variables at both the firm and city levels. At the firm level, we controlled for firm size, age, nature of property rights, profitability, asset–liability ratio, current asset ratio, capital intensity, and social wealth creativity. At the city level, we controlled for the share of the second industrial output value in the GDP of the host city, foreign investment, the GDP of the host city, the GDP per capita of the city, the average annual sunshine hours of the city and the average annual temperature of the city. The specific definitions of the variables are provided in Table 1, and the results of the correlation analysis are outlined (see Appendix A).
Table 1. Variable definitions.

3.3. Empirical Model

3.3.1. OLS Regression Models

We first used ordinary least squares (OLS) to estimate the impact of air pollution on the corporate innovation of listed companies, and the regression model is as follows:
P a t e n t A p p l y i , c , t / P a t e n t G r a n t i , c , t / R D_R a t i o i , c , t = β 0 + β 1 L n P M i , c , t + β X i , c , t + γ t + ρ r + ε i , c , t
where i represents enterprise; c represents city; t represents time. P a t e n t A p p l y i , c , t , P a t e n t G r a n t i , c , t and R D_R a t i o i , c , t are the indicators to measure the level of innovation of the firms, X i , c , t is a series of control variables affecting firms’ innovation in year t of company i . γ t and ρ r represent the fixed effects of the year and the industry, respectively; ε i , c , t represents the standard error term; and the coefficient β 1 measures the impact of air pollution on firms’ innovation level.

3.3.2. Mediating Effects

Referring to Alesina et al. [74], we used a mediator model to analyze the mechanism of air pollution’s impact on firms’ innovation; that is, the mediating role of the top management quality. The following model is developed:
L n P M i , c , t = η 0 + ω 1 I n v e r s i o n i , c , t + ω X i , c , t + γ t + ρ r + ε i , c , t
T M Q i , c , t = λ 0 + λ 1 L n P M i , c , t + λ X i , c , t + γ t + ρ r + ε i , c , t
P a t e n t A p p l y i , c , t / P a t e n t G r a n t i , c , t / R D_R a t i o i , c , t = μ 0 + μ 1 L n P M i , c , t + δ T M Q i , c , t + θ X i , c , t + γ t + ρ r + ε i , t
Model (3) is the first-stage regression model of the instrumental variable approach; L n P M i , c , t is the logarithm of the annual average PM2.5 concentration in year t of the city c where company i is located; and the instrumental variable I n v e r s i o n i , c , t is the logarithm of the number of days of atmospheric inversion in the city where company i is located, after adding 1.
Model (5) is a second-stage regression model, where the dependent variables P a t e n t A p p l y i , c , t , P a t e n t G r a n t i , c , t and R D_R a t i o i , c , t are measures of firms’ level of innovation; X i , c , t is a series of control variables affecting firms’ innovations in year t ; γ t and ρ r represent year and industry fixed effects, respectively; ε i , c , t represents the standard error term; and we focus on the coefficients λ 1 , μ 1 , and δ .

3.3.3. Moderating Effect

In order to examine the moderating effect of local government talent attention on air pollution and firms’ innovation, we set up the following model (6):
  P a t e n t A p p l y i , c , t / P a t e n t G r a n t i , c , t / R D R a t i o i , c , t = α 0 + α 1 L n P M i , c , t + α 2 L n P M i , c , t L T i , c , t + α 3 L T i , c , t + α X i , c , t + γ t + ρ r + ε i , c , t  
where L T i , c , t is the intensity of local talent policy; L n P M i , c , t L T i , c , t is the interaction term between air pollution and local talent policy; and the meanings of the other variables are consistent with the above models.

4. Empirical Results and Endogeneity Test

4.1. Descriptive Statistics

Table 2 lists the descriptive statistics of the core variables. It can be seen that the standard deviation of the annual number of patent applications is 1.276 and the number of patents granted is 1.410, indicating that there is a great difference in innovation output among enterprises. The standard deviation of the PM2.5 concentration in the city where the company’s office is located is 0.332 μg/m3, indicating that there is a great difference in the degree of air pollution in various cities. In addition, we also carried out the variance inflation factor (VIF) test for all variables, and the average VIF value is less than 2, indicating that there is no serious multicollinearity between the variables.
Table 2. Descriptive statistics of core variables.

4.2. Empirical Results and Analysis

Table 3 reports the regression results of model (1) Columns (1), (2), and (3) demonstrate the results of the baseline regression, which includes only all the control variables. Columns (4), (5), and (6) demonstrate the regression results that incorporate the core explanatory variables, and the coefficients of all explanatory variables are negatively significant at a 1% level, which indicates that there is a significant and negative impact of air pollution on the innovation of the firms. This empirical finding is in line with a series of studies conducted in the United States [75], the European region [76], and BRICS countries [23,24,40], which revealed that air pollution has a negative impact on innovation activities. Therefore, Hypothesis 1 is confirmed.
Table 3. Impact of air pollution on corporate innovation.

4.3. Endogeneity Test

Although we included many control variables in the estimation of model (1) to minimize the omitted variable problem, there may still be an endogeneity problem due to reverse causality between air pollution and firm innovation. Therefore, drawing on Arceo et al. [77], we used the natural logarithm of the number of days per year that an atmospheric inversion occurs in the city where each firm’s office is located plus 1 as an instrumental variable for air quality. The results show that, in the first-stage regression, atmospheric inversion has a significant positive effect on air pollution (i.e., atmospheric inversion significantly increases the degree of air pollution), with an F-value much larger than 10. In the second-stage regression results, the coefficients of LnPM are all negatively correlated at a significance level of 1%, (i.e., air pollution is still significantly negatively related to enterprise innovation). The results are reported in Table 4.
Table 4. Regression results of the instrumental variable method.

5. Mechanism Test Based on Top Management Quality and Local Talent Policy

5.1. The Mediating Role of Corporate Top Management Quality (TMQ)

In the above empirical analysis, the inhibitory effect of air pollution on corporate innovation was been verified. Next, we tested the impact mechanism. In the hypothesis development section, we pointed out that air pollution will reduce the top management quality of enterprises, thus adversely affecting the innovation of enterprises. First, we verified the negative correlation between air pollution and top management quality. Firms with poorer quality top management may be more reluctant to take on corporate social responsibility and neglect environmental issues. This may exacerbate the endogeneity problem of air pollution in the region. We used the instrumental variable (Inversion) from the previous endogeneity test to conduct an instrumental variable two-stage regression. Table 5 reports the results of the OLS regression and the 2SLS regression. In the basic regression in column 1, the coefficient of LnPM is −0.0819 and significant at the 1% level, indicating that air pollution significantly reduces top management quality. In the second stage of regression of instrumental variables, the coefficient of air pollution LnPM is significantly negative at a 5% level. This indicates that the more severe the air pollution, the poorer the quality of corporate top management. The regression results further demonstrate that air pollution has a significant negative impact on the quality of top management. Therefore, Hypothesis 2 is confirmed.
Table 5. Regression results of air pollution and top management quality.
Next, according to Alesina et al. [74], we tested the mediating effect of the quality of top management. The results are reported in Table 6. In Column (1), the coefficient of air pollution (LnPM) on the number of patent applications is −0.2794, and on the number of granted patents is −0.1714, which is significant at a 1% level. The coefficient of R&D investment is −0.0015, which is negatively significant at a 5% level. This confirms that air pollution can directly reduce enterprise innovation. Meanwhile, in the 2SLS regression of column (3), the coefficients between air pollution and corporate innovation are also all negative and significant. However, the absolute value of the coefficients −0.6485, −0.7569, and −0.0075 are larger than the OLS regression results. This may be due to the elimination of the endogeneity issue brought by air pollution.
Table 6. The mediating effect of top management quality.
In terms of the mediating effect of top management quality, first, it was demonstrated above that the coefficient of top management quality on air pollution is significantly negative at the 1% level, indicating that air pollution in the city where offices are located significantly reduces the quality of top management. Second, in column (2), when air pollution, top management quality, and firm innovation are regressed simultaneously, the OLS regression coefficients of top management quality are 0.1477, 0.1567, and 0.0001. Among the three measures, innovation outputs (i.e., PatentApply and PatentGrant) are both positively significant at the 1% level. Although the role of top management quality on R&D investment is not significant in the results of the OLS model, in the results of the 2SLS model shown in Column (4), the coefficients of top management quality are all positively significant at the 1% level and the coefficients all increased. Most importantly, the regression coefficients of air pollution all decrease after adding the top management quality, indicating that the top management quality plays a mediating role between air pollution and firm innovation. In summary, air pollution can indirectly reduce innovation output through reducing the quality of top management. The mechanism can be described as “Air pollution–Top management Quality–Corporate Innovation”. Hence, Hypothesis 3 is verified.
In addition, to verify the mediating effect’s robustness, we also conducted a Sobel test and bootstrap test. The absolute values of the Z-values in the Sobel test were 6.193, 6.09, and 2.524, which are all greater than 1.65, and the p-value was also significant at the 1% level. In the bootstrap mediating effect test, the 95% confidence interval estimation contained no 0 after 1000 iterations. This indicates that the mediating effect is significant; that is, there is a significant mediating effect of the top management quality in the relationship between air pollution and corporate innovation.

5.2. The Moderating Role of Local Government Talent Policies

In recent years, China has opened up an inter-regional competition for talent. Almost all major cities have introduced many talent policies, mainly oriented to groups with advanced skills, high education, and high innovation ability. From the perspective of marginal cost, the talent policy reduces the talent hiring cost borne by enterprises to a certain extent and enhances the attractiveness of local enterprises, and is conducive to promoting skills upgrading and knowledge exchanges among the top management team. From the perspective of marginal benefit, attracting and gathering more talent is conducive to creating an atmosphere of innovation factor agglomeration, significantly improves the corporate top management’s quality, and enhances the team’s innovation ability, which can further improve the innovation efficiency and output of enterprises [30]. Therefore, we tested the moderating effect of local government’s talent attention on air pollution and firms’ innovation, and the results are reported in Table 7. We can see that the interaction term of LnPM*LT is significantly and positively related to the number of patent applications, the number of patents granted, and the intensity of R&D investment at the 1%, 10%, and 5% levels, respectively. This suggests that local talent policy weakens the negative impact of air pollution on firms’ innovation, to a certain extent, thus verifying Hypothesis 4.
Table 7. The moderating effect of local government talent attention.

5.3. Further Analysis

Due to the negative externalities of air pollution, governments are increasingly emphasizing the regulatory role of environmental regulation, which can prompt firms to increase their environmental investment in pollution prevention and control [78]. However, this may crowd out firms’ R&D investment and inhibit their innovation. Conversely, executives with strong bargaining power and high incomes need higher wages to compensate for the adverse impacts of air pollution on their physical and mental health (i.e., loss of non-monetary earnings). In order to attract and retain talent and maintain a higher level of top management quality, firms need to compensate by paying an additional premium to executives [28,29]. In addition, appropriate compensation can, to a certain extent, mitigate the risk-averse behavior of executives toward innovative activities [79], and, when the CEO compensation structure is linked to stock volatility, it can affect the corporate social responsibility (CSR) performance to a large extent [80]. A reasonable CEO compensation structure will encourage the executive team to invest in innovative projects [81], thereby increasing the team’s innovation capability. This is important for the sustainable operation and development of firms. Therefore, we test the moderating effects of local government environmental governance and corporate executive compensation separately in this section.

5.3.1. Government Environmental Protection Attention

Referring to Chen et al. [19], we use local government environmental protection attention (LEP) as a proxy variable for local government environmental governance. We manually collected provincial government work reports (including 31 provinces) from 2008 to 2019. We counted the frequency of environment-related words through applying word segmentation to the government report text (We take the natural logarithm for the word frequency). Compared with other commonly used metrics, LEP is more comprehensive and can better reflect the overall status of local environmental governance. From Table 8, it can be seen that the interaction terms LnPM*LEP are all negatively significant at the 1% level, indicating that the government’s attention to environmental protection strengthens the negative correlation between air pollution and firms’ innovation. This result is consistent with the findings of existing studies.
Table 8. The moderating effect of the government’s attention to environmental protection.

5.3.2. Executive Compensation

Next, we measured the executive compensation variable (Salary) using the natural logarithm of the total compensation of the top three executives with the highest amount disclosed by listed companies. We tested the moderating effect of executive compensation on the relationship between air pollution and innovation of firms. The results in Table 9 show that the coefficients of the interaction term, LnPM*Salary, are significantly positive at the 5%, 10%, and 1% levels, respectively; that is, a firm’s executive compensation can recover to a certain extent for the negative impacts of air pollution on a firm’s technological innovation.
Table 9. The moderating effect of executive compensation.

5.4. Robustness Tests

We conducted a series of tests to ensure the robustness of the benchmark regression results. First, in terms of the explained variables, as an enterprises’ innovation output needs a certain period and has a lag, we advanced the number of patent applications and the number of patents granted by 1, 2, and 3 periods. The regression results verify Hypothesis 1 (see Appendix B). In addition, we subdivided the total number of patent applications into the number of invention patent applications (IPatentApply) and the number of non-invention patent applications (UnIPatentApply) for the OLS regression. The result is consistent with the results of the benchmark regression (see Appendix C).
Second, in terms of the explanatory variables, we replaced the PM 2.5 concentration with the annual average air quality index (AQI) of the city where the company’s office is located for robustness testing (the unit is μg/m3, and we take the natural logarithm for the AQI). The baseline regression results remained robust (see Appendix D).
Finally, in terms of the selected samples, megacities—including Beijing, Shanghai, Guangzhou, and Shenzhen—have a stronger agglomeration of resources, which leads to a lower comparability of the samples with other cities. Therefore, we used OLS to conduct regression after excluding the samples from Beijing, Guangzhou, and Shenzhen, and Hypothesis 1 was verified again (see Appendix E).

6. Concluding Discussion and Policy Implications

6.1. Concluding Discussion

This study incorporated the quality of top management and local talent policy into the analytical framework of air pollution and corporate innovation. First, we analyzed the mechanism between air pollution and corporate innovation, and developed relevant hypotheses. Then, we used a sample of Chinese public companies from 2007 to 2019 to analyze the impact of air pollution on corporate innovation. The findings revealed that the more severe the air pollution in a firm’s location, the lower its level of innovation, suggesting that air pollution has an inhibiting effect on the innovative activities of local firms. This empirical finding is in line with a series of studies and existing evidence from different regions around the world, including the United States [75], Europe [76], and BRICS countries [23,24,40], which have revealed that air pollution has an adverse impact on innovation activities.
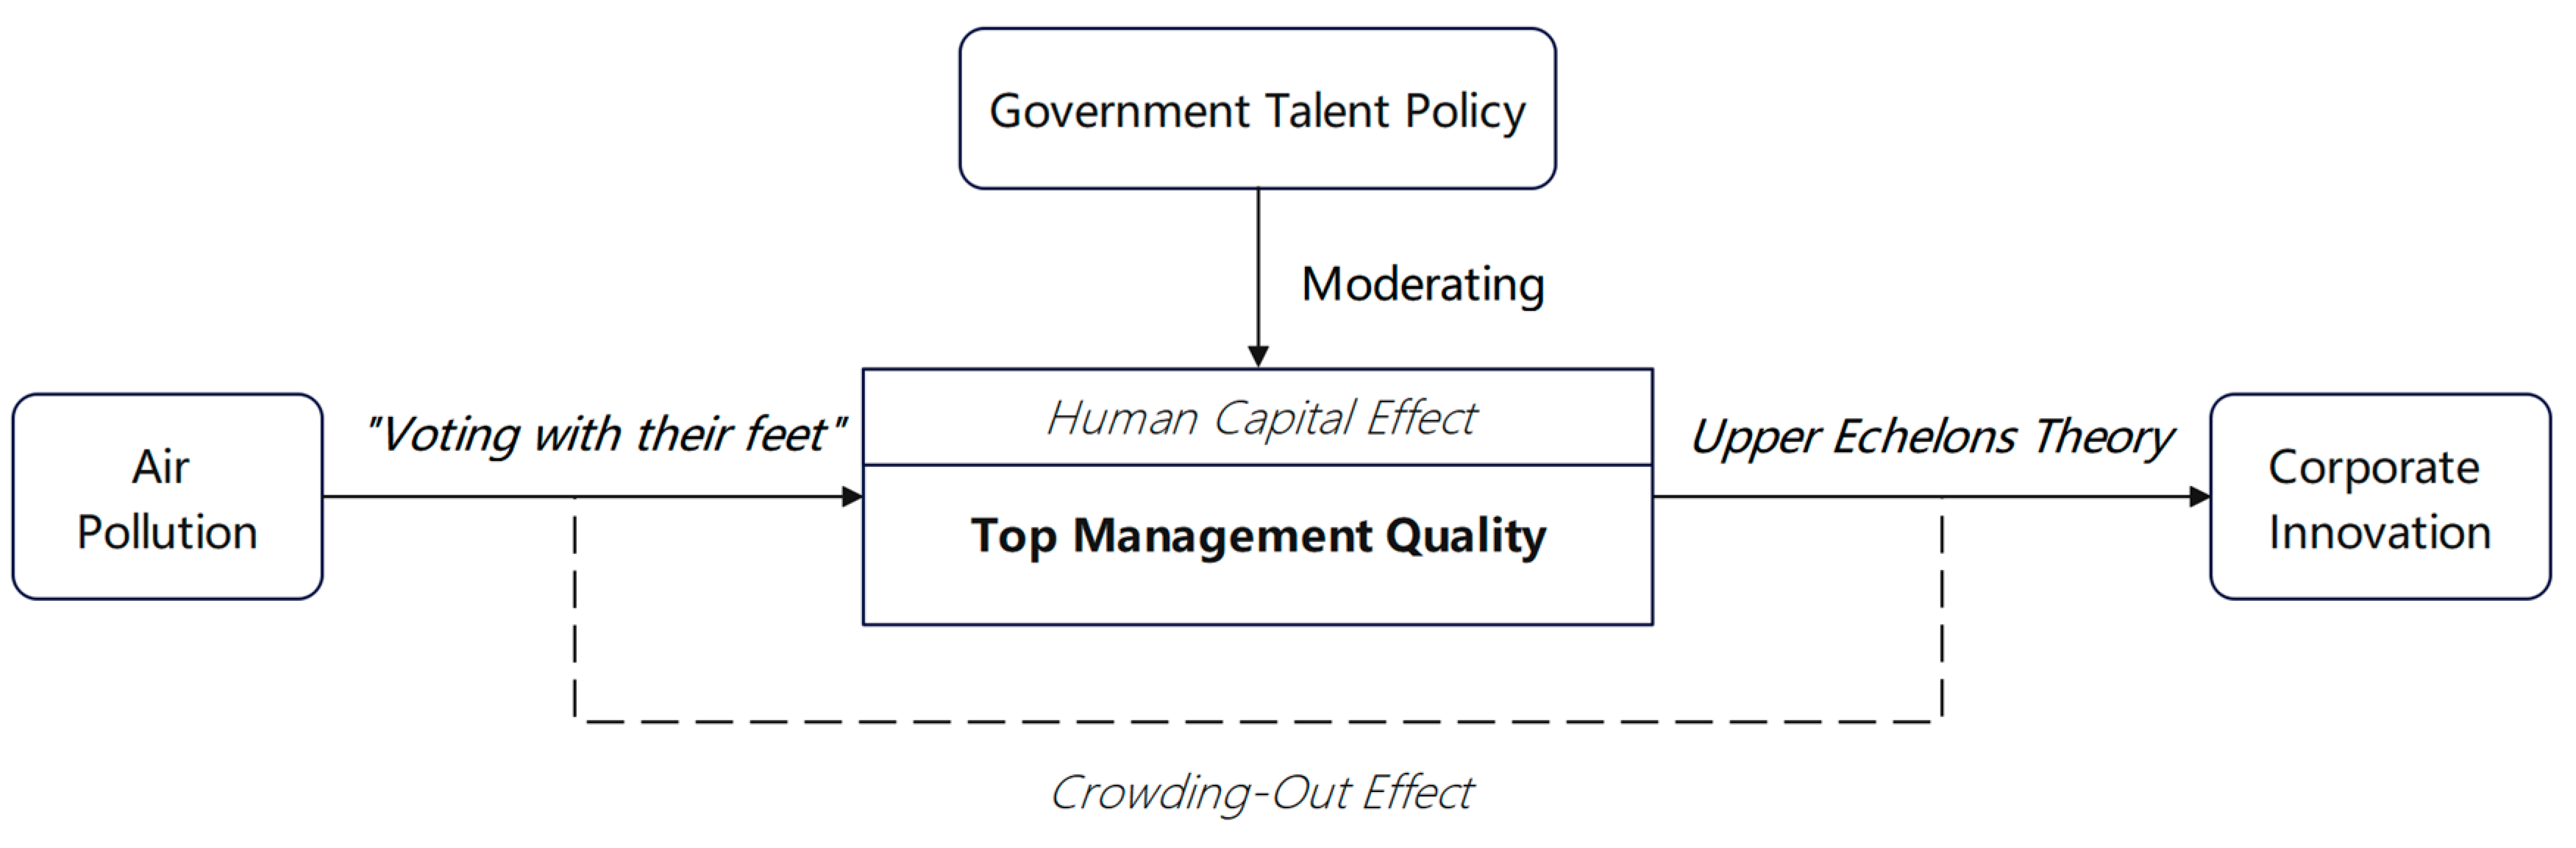
Next, to explore the intrinsic mechanism between air pollution and enterprise innovation, we tested the mediating effect of top management quality and the moderating effect of local talent policy. Based on the theory of “voting with their feet” and the upper echelons theory, we found that the quality of the top management plays a mediating role between air pollution and corporate innovation. It was verified that the brain drain effect caused by air pollution will lead to a decline in corporate innovation. Nevertheless, the moderating effect of local talent policy suggests that local government’s attention to talent can alleviate the negative effect of air pollution on corporate innovation. Therefore, enterprises can optimize the top management’s structure and improve its quality to promote innovation output. Equally, local governments can improve local talent policies to enhance the supply of high-skilled talent and improve the innovation vitality of local enterprises. The previous literature has mainly focused on the capital crowding-out effect while focusing on the general workgroup regarding the human capital channel [13,14,25]. This study provides novel evidence from the view of top management quality.
In addition, it has been found that air pollution raises the salary compensation requirements of corporate executives, and this study empirically confirmed that executive compensation can mitigate the negative impact of air pollution on firms’ innovation. In addition, the increase in the intensity of local environmental regulation and supervision will crowd out firms’ R&D investment and reduce their innovation output. Policymakers should also consider cultivating and developing enterprises’ technological R&D capabilities when strengthening environmental regulatory policies. For example, R&D subsidies, tax incentives, and other complementary measures can be provided to reduce the potential costs of technological innovation for enterprises.

6.2. Policy Implications

This study reveals the importance of the current environmental benefits and talent dividends. It provides policy insights for enterprises to realize innovative development and for local governments to promote high-quality economic development. For enterprises, it is necessary to improve the executive selection mechanism and top management structure, select executives who match the abilities required by enterprises, set up a reasonable compensation incentive system, and provide executives with a good working environment. This can help to alleviate the negative impacts of air pollution on the innovation of enterprises and, ultimately, realize the fulfillment of environmental responsibility. For the government, it is crucial to promote and regulate clean production according to the local industrial structure and ensure the implementation of the concept of low-carbon development. To attract and retain innovative talents, local governments can improve and advertise their local talent policy, improve talent introduction-related supporting services, and provide talent with excess non-monetary benefits besides monetary subsidies, thereby enhancing the local talent-gathering capacity and alleviating the negative impacts of air pollution. In addition, considering the capital crowding-out effect of air pollution, policies such as R&D subsidies and tax incentives can be granted to reduce the R&D costs of enterprises, to some extent.

6.3. Limitations and Future Directions

This study still has the following limitations. First, we measured top management quality considering only some of the executives’ background characteristics that affect innovation performance, and individual characteristics such as executives’ behaviors and preferences were not taken into account. Second, the unavailability of job mobility data, such as corporate executives’ original workplaces and out-flow destinations, limits extensive research on the environment-improving motivations and practical outcomes of corporate executive mobility. Third, we did not subdivide the local talent policies when testing the moderating effect of local talent policies; for example, the preferential policies for different types and levels of talent and the regional differences in various types of talent policies. Failure to consider these policy differences may lead to overly broad conclusions.
Future research can incorporate individual characteristics such as executives’ behavioral preferences, leadership styles, or environmental awareness to construct a more comprehensive evaluation system for top management quality. Subsequent research can utilize big data technology and combine the internal data of companies to collect information on the growth and learning environment (e.g., birth city, university city), workplace change (original work city, out-flow work city), and other factors. This can make up for the lack of relevant information in the publicly available data sources and allow for research from the perspective of the trajectory of the flow of human capital to be conducted. In addition, future studies can also shed light on air pollution and corporate innovations in a cross-country context; for instance, through exploring the impacts of air pollution on executives’ cross-border migration among Asia, Europe, the United States, and other economies. Finally, future research could examine the match between various talent policies and specific talents in greater detail, leading to a more accurate understanding of how local talent policies can mitigate the negative impacts of air pollution on corporate innovation.

Author Contributions

Conceptualization, R.Z. and K.M.; methodology, K.M.; software, K.M. and X.C.; validation, X.C., R.Z. and J.Z.; formal analysis, K.M.; investigation, K.M.; resources, J.Z.; data curation, K.M. and X.C.; writing—original draft preparation, K.M.; writing—review and editing, R.Z.; visualization, X.C.; supervision, R.Z. and J.Z.; project administration, R.Z. and J.Z. All authors have read and agreed to the published version of the manuscript.

Funding

This research received no external funding.

Institutional Review Board Statement

Not applicable.

Data Availability Statement

The raw data supporting the conclusions of this article will be made available by the authors on request.

Conflicts of Interest

The authors declare no conflict of interest.

Appendix A

Table A1. Results of the correlation analysis.
Patent~yPatent~tRD-RatioLnPMTMTQCapitalLeverage
PatentApply1
PatentGrant0.823 ***1
RD-Ratio0.159 ***0.124 ***1
LnPM−0.139 ***−0.109 ***−0.035 ***1
TMTQ0.205 ***0.196 ***0.062 ***−0.107 ***1
Capital−0.098 ***−0.096 ***−0.202 ***−0.057 ***0.035 ***1
Leverage0.113 ***0.104 ***−0.215 ***0.023 ***0.00500−0.129 ***1
Liquidity0.065 ***0.077 ***0.240 ***0.01200.118 ***−0.166 ***−0.176 ***
TobinQ−0.072 ***−0.065 ***0.226 ***−0.050 ***−0.060 ***0.00800−0.258 ***
ROA0.053 ***0.030 ***0.180 ***0.005000.081 ***−0.178 ***−0.397 ***
lnSale0.409 ***0.376 ***−0.114 ***0.033 ***0.146 ***−0.384 ***0.500 ***
LnAge0.135 ***0.115 ***−0.171 ***0.020 **−0.243 ***0.009000.404 ***
BoardIndSize0.050 ***0.055 ***0.0130−0.037 ***−0.106 ***0.061 ***−0.031 ***
FDI−0.027 ***−0.016 *0.038 ***0.227 ***0.082 ***−0.027 ***0.023 ***
Structure−0.139 ***−0.113 ***−0.107 ***0.128 ***−0.077 ***−0.155 ***−0.0120
GDP0.262 ***0.253 ***0.200 ***0.118 ***0.089 ***0.073 ***−0.066 ***
GDPAvg0.278 ***0.274 ***0.202 ***0.041 ***0.038 ***0.056 ***−0.090 ***
Suntime−0.019 **−0.028 ***−0.024 **0.115 ***0.01800.085 ***0.072 ***
Temperature0.109 ***0.106 ***0.135 ***−0.277 ***0.059 ***−0.077 ***−0.106 ***
Liquid~yTobinQROAlnSaleLnAgeBoardI~eFDI
Liquidity1
TobinQ0.078 ***1
ROA0.182 ***0.201 ***1
lnSale−0.149 ***−0.305 ***0.030 ***1
LnAge−0.336 ***0.036 ***−0.239 ***0.426 ***1
BoardIndSize0.029 ***0.032 ***−0.024 ***−0.017 **−0.022 **1
FDI0.097 ***−0.004000.0110−0.00100−0.00700−0.009001
Structure−0.024 ***−0.022 **0.034 ***−0.113 ***−0.101 ***−0.079 ***0.033 ***
GDP0.144 ***0.051 ***0.032 ***0.088 ***−0.028 ***0.098 ***0.140 ***
GDPAvg0.116 ***0.065 ***0.037 ***0.091 ***−0.015 *0.101 ***0.094 ***
Suntime−0.060 ***−0.128 ***−0.061 ***0.106 ***0.093 ***0.002000
Temperature0.081 ***0.105 ***0.079 ***−0.088 ***−0.142 ***0.042 ***0.00200
Struct~eGDPGDPAvgSuntimeTemper~e
Structure1
GDP−0.527 ***1
GDPAvg−0.304 ***0.758 ***1
Suntime−0.324 ***0.107 ***0.067 ***1
Temperature0.185 ***0.099 ***0.186 ***−0.641 ***1
Note: * p < 0.1, ** p < 0.05, *** p < 0.01.

Appendix B

Table A2. Regression results for early patent term.
(1)(2)(3)
Panel A
PatentApplyt+1PatentApplyt+2PatentApplyt+3
LnPM−0.2992 ***−0.2362 ***−0.1902 ***
(0.0470)(0.0532)(0.0577)
ControlsYesYesYes
YearYesYesYes
IndustryYesYesYes
N1058291457819
R20.34890.30550.2604
Panel B
PatentGrantt+1PatentGrantt+2PatentGrantt+3
LnPM−0.3666 ***−0.3005 ***−0.2188 ***
(0.0489)(0.0579)(0.0617)
ControlsYesYesYes
YearYesYesYes
IndustryYesYesYes
N1058291457819
R20.3360.2980.239
Note: t-values in parenthesis, *** p < 0.01.

Appendix C

Table A3. Regression results after adjusting for firm innovation indicators.
(1)(2)
VariableIPatentApplyUnIPatentApply
LnPM−0.2671 ***−0.3501 ***
(0.0442)(0.0456)
ControlsYesYes
YearYesYes
IndustryYesYes
N13,65413,654
R20.3610.29
Note: t-values in parentheses, *** p < 0.01.

Appendix D

Table A4. Regression results of air pollution AQI and firm innovation.
(1)(2)(3)
PatentApplyPatentGrantRD_Ratio
LnAQI−0.2357 ***−0.1886 **−0.0025 ***
(0.0670)(0.0754)(0.0009)
ControlsYesYesYes
YearYesYesYes
IndustryYesYesYes
N12,50412,50410,075
R20.3630.3420.162
Note: t-values in parentheses, ** p < 0.05, *** p < 0.01.

Appendix E

Table A5. Regression results after deleting the sample of cities in the north, Shanghai, Guangzhou, and Shenzhen.
(1)(2)(3)
PatentApplyPatentGrantRD_Ratio
LnPM−0.3704 ***−0.2380 ***−0.0012 **
(0.0423)(0.0477)(0.0006)
ControlsYesYesYes
YearYesYesYes
IndustryYesYesYes
N11,24211,2428643
R20.400.3780.156
Note: t-values in parentheses, ** p < 0.05, *** p < 0.01.

References

  1. Yale University. 2024 Environmental Performance Index (EPI). 2024. Available online: https://epi.yale.edu/measure/2024/EPI (accessed on 21 July 2024).
  2. Bae, H.R.; Chandy, M.; Aguilera, J.; Smith, E.M.; Nadeau, K.C.; Wu, J.C.; Paik, D.T. Adverse effects of air pollution-derived fine particulate matter on cardiovascular homeostasis and disease. Trends Cardiovasc. Med. 2022, 32, 487–498. [Google Scholar] [CrossRef]
  3. He, G.; Fan, M.; Zhou, M. The effect of air pollution on mortality in China: Evidence from the 2008 Beijing Olympic Games. J. Environ. Econ. Manag. 2016, 79, 18–39. [Google Scholar] [CrossRef]
  4. Carlsen, H.K.; Andersson, E.M.; Molnár, P.; Oudin, A.; Xu, Y.; Wichmann, J.; Spanne, M.; Stroh, E.; Engström, G.; Stockfelt, L. Incident cardiovascular disease and long-term exposure to source-specific air pollutants in a Swedish cohort. Environ. Res. 2022, 209, 112698. [Google Scholar] [CrossRef]
  5. Pun, V.C.; Manjourides, J.; Suh, H. Association of ambient air pollution with depressive and anxiety symptoms in older adults: Results from the NSHAP study. Environ. Health Perspect. 2017, 125, 342–348. [Google Scholar] [CrossRef] [PubMed]
  6. Yang, T.; Wang, J.; Huang, J.; Kelly, F.J.; Li, G. Long-term exposure to multiple ambient air pollutants and association with incident depression and anxiety. JAMA Psychiatry 2023, 80, 305–313. [Google Scholar] [CrossRef] [PubMed]
  7. Yuan, R.; Wen, W. Managerial foreign experience and corporate innovation. J. Corp. Financ. 2018, 48, 752–770. [Google Scholar] [CrossRef]
  8. Zhang, G.; Ren, Y.; Yu, Y.; Zhang, L. The impact of air pollution on individual subjective well-being: Evidence from China. J. Clean. Prod. 2022, 336, 130413. [Google Scholar] [CrossRef]
  9. Markandya, A.; Sampedro, J.; Smith, S.J.; Van Dingenen, R.; Pizarro-Irizar, C.; Arto, I.; González-Eguino, M. Health co-benefits from air pollution and mitigation costs of the Paris Agreement: A modelling study. Lancet Planet. Health 2018, 2, e126–e133. [Google Scholar] [CrossRef]
  10. Gulland, A. UN pledges to tackle environmental health risks. BMJ Br. Med. J. (Online) 2018, 360, k176. [Google Scholar] [CrossRef]
  11. Schmalensee, R.; Stavins, R.N. Policy evolution under the clean air act. J. Econ. Perspect. 2019, 33, 27–50. [Google Scholar] [CrossRef]
  12. Hanna, R.; Oliva, P. The effect of pollution on labor supply: Evidence from a natural experiment in Mexico City. J. Public Econ. 2015, 122, 68–79. [Google Scholar] [CrossRef]
  13. Ai, H.; Wang, M.; Zhang, Y.-J.; Zhu, T.-T. How does air pollution affect urban innovation capability? Evidence from 281 cities in China. Struct. Change Econ. Dyn. 2022, 61, 166–178. [Google Scholar] [CrossRef]
  14. Liu, S.; Kong, D.; Zhang, J. Air pollution-induced brain drain: Evidence from inventor mobility. Int. Rev. Financ. Anal. 2024, 91, 102976. [Google Scholar] [CrossRef]
  15. Romer, P.M. Increasing returns and long-run growth. J. Political Econ. 1986, 94, 1002–1037. [Google Scholar] [CrossRef]
  16. Parrino, R.; Sias, R.W.; Starks, L.T. Voting with their feet: Institutional ownership changes around forced CEO turnover. J. Financ. Econ. 2003, 68, 3–46. [Google Scholar] [CrossRef]
  17. Tiebout, C.M. A pure theory of local expenditures. J. Political Econ. 1956, 64, 416–424. [Google Scholar] [CrossRef]
  18. Rahut, D.B.; Ali, A.; Behera, B. Domestic use of dirty energy and its effects on human health: Empirical evidence from Bhutan. Int. J. Sustain. Energy 2017, 36, 983–993. [Google Scholar] [CrossRef]
  19. Chen, Z.; Kahn, M.E.; Liu, Y.; Wang, Z. The consequences of spatially differentiated water pollution regulation in China. J. Environ. Econ. Manag. 2018, 88, 468–485. [Google Scholar] [CrossRef]
  20. Lai, W.; Song, H.; Wang, C.; Wang, H. Air pollution and brain drain: Evidence from college graduates in China. China Econ. Rev. 2021, 68, 101624. [Google Scholar] [CrossRef]
  21. Archsmith, J.; Heyes, A.; Saberian, S. Air quality and error quantity: Pollution and performance in a high-skilled, quality-focused occupation. J. Assoc. Environ. Resour. Econ. 2018, 5, 827–863. [Google Scholar] [CrossRef]
  22. Chu, Y.; Liu, Y.; Lu, Y.; Yu, L.; Lu, H.; Guo, Y.; Liu, F.; Wu, Y.; Mao, Z.; Ren, M. Propensity to migrate and willingness to pay related to air pollution among different populations in Wuhan, China. Aerosol Air Qual. Res. 2017, 17, 752–760. [Google Scholar] [CrossRef]
  23. Wang, F.; Wu, M. Does air pollution affect the accumulation of technological innovative human capital? Empirical evidence from China and India. J. Clean. Prod. 2021, 285, 124818. [Google Scholar] [CrossRef]
  24. Farooq, U.; Ashfaq, K.; Rustamovna, R.D.; Al-Naimi, A.A. Impact of Air Pollution on Corporate Investment: New Empirical Evidence from BRICS. Borsa Istanb. Rev. 2023, 23, 876–886. [Google Scholar] [CrossRef]
  25. Tan, Z.; Yan, L. Does air pollution impede corporate innovation? Int. Rev. Econ. Financ. 2021, 76, 937–951. [Google Scholar] [CrossRef]
  26. Ministry of environmental protection of the People’s Republic of China. Bulletin on the State of China’s Ecological Environment. 2024. Available online: https://www.mee.gov.cn/hjzl/sthjzk/zghjzkgb/202406/P020240604551536165161.pdf (accessed on 24 March 2024).
  27. Chemmanur, T.J.; Kong, L.; Krishnan, K.; Yu, Q. Top management human capital, inventor mobility, and corporate innovation. J. Financ. Quant. Anal. 2019, 54, 2383–2422. [Google Scholar] [CrossRef]
  28. Deng, X.; Gao, H. Nonmonetary benefits, quality of life, and executive compensation. J. Financ. Quant. Anal. 2013, 48, 197–218. [Google Scholar] [CrossRef]
  29. Yang, Z.; Leng, T.; Pan, L.; Wang, X. Paying for pollution: Air quality and executive compensation. Pac.-Basin Financ. J. 2022, 74, 101823. [Google Scholar] [CrossRef]
  30. Chen, Q.; Sun, T.; Wang, T. Synergy effect of talent policies on corporate innovation—Evidence from China. Front. Psychol. 2023, 13, 1069776. [Google Scholar] [CrossRef] [PubMed]
  31. Hambrick, D.C.; Mason, P.A. Upper echelons: The organization as a reflection of its top managers. Acad. Manag. Rev. 1984, 9, 193–206. [Google Scholar] [CrossRef]
  32. Hambrick, D.C. Top management groups: A conceptual integration and reconsideration of the “team” label. Res. Organ. Behav. 1994, 16, 171. [Google Scholar]
  33. Chemmanur, T.J.; Paeglis, I. Management quality, certification, and initial public offerings. J. Financ. Econ. 2005, 76, 331–368. [Google Scholar] [CrossRef]
  34. Chemmanur, T.J.; Gupta, M.; Simonyan, K. Top management team quality and innovation in venture-backed private firms and IPO market rewards to innovative activity. Entrep. Theory Pract. 2022, 46, 920–951. [Google Scholar] [CrossRef]
  35. Koo, K. Do not change horses: Specialist CEOs enhance innovation. Technol. Anal. Strateg. Manag. 2019, 31, 875–887. [Google Scholar] [CrossRef]
  36. Chen, S.; Bu, M.; Wu, S.; Liang, X. How does TMT attention to innovation of Chinese firms influence firm innovation activities? A study on the moderating role of corporate governance. J. Bus. Res. 2015, 68, 1127–1135. [Google Scholar] [CrossRef]
  37. Zhu, C.; Lee, C.-C. The internal and external effects of air pollution on innovation in China. Environ. Sci. Pollut. Res. 2021, 28, 9462–9474. [Google Scholar] [CrossRef]
  38. Zhu, F.; Zhuang, D.; Jin, S.; Gao, L.; Chen, R. Effects of air pollution on regional innovation and the mediator role of health: Evidence from China. Growth Change 2022, 53, 628–650. [Google Scholar] [CrossRef]
  39. Fu, S.; Viard, V.B.; Zhang, P. Air pollution and manufacturing firm productivity: Nationwide estimates for China. Econ. J. 2021, 131, 3241–3273. [Google Scholar] [CrossRef]
  40. Greenstone, M.; Hanna, R. Environmental regulations, air and water pollution, and infant mortality in India. Am. Econ. Rev. 2014, 104, 3038–3072. [Google Scholar] [CrossRef]
  41. Leiter, A.M.; Parolini, A.; Winner, H. Environmental regulation and investment: Evidence from European industry data. Ecol. Econ. 2011, 70, 759–770. [Google Scholar] [CrossRef]
  42. Berman, E.; Bui, L.T. Environmental regulation and productivity: Evidence from oil refineries. Rev. Econ. Stat. 2001, 83, 498–510. [Google Scholar] [CrossRef]
  43. Akpalu, W.; Normanyo, A.K. Gold mining pollution and the cost of private healthcare: The case of Ghana. Ecol. Econ. 2017, 142, 104–112. [Google Scholar] [CrossRef]
  44. Lin, S.; Xiao, L.; Wang, X. Does air pollution hinder technological innovation in China? A perspective of innovation value chain. J. Clean. Prod. 2021, 278, 123326. [Google Scholar] [CrossRef]
  45. Yu, Y.; Zhang, N. Environmental regulation and innovation: Evidence from China. Glob. Environ. Change 2022, 76, 102587. [Google Scholar] [CrossRef]
  46. Neidell, M. Information, avoidance behavior, and health the effect of ozone on asthma hospitalizations. J. Hum. Resour. 2009, 44, 450–478. [Google Scholar] [CrossRef]
  47. Levinson, A. Valuing public goods using happiness data: The case of air quality. J. Public Econ. 2012, 96, 869–880. [Google Scholar] [CrossRef]
  48. Xue, S.; Zhang, B.; Zhao, X. Brain drain: The impact of air pollution on firm performance. J. Environ. Econ. Manag. 2021, 110, 102546. [Google Scholar] [CrossRef]
  49. Chen, S.; Oliva, P.; Zhang, P. The effect of air pollution on migration: Evidence from China. J. Dev. Econ. 2022, 156, 102833. [Google Scholar] [CrossRef]
  50. Liu, B.; Wu, J.; Chan, K.C. Does air pollution change a firm’s business strategy for employing capital and labor? Bus. Strategy Environ. 2021, 30, 3671–3685. [Google Scholar] [CrossRef]
  51. Zhu, J.; Jiang, D.; Shen, Y.; Shen, Y. Does regional air quality affect executive turnover at listed companies in China? Econ. Model. 2021, 97, 428–436. [Google Scholar] [CrossRef]
  52. Levine, R.; Lin, C.; Wang, Z. Pollution and human capital migration: Evidence from corporate executives. Work. Paper. 2019. [Google Scholar] [CrossRef]
  53. Zeng, J.; He, Q. Does industrial air pollution drive health care expenditures? Spatial evidence from China. J. Clean. Prod. 2019, 218, 400–408. [Google Scholar] [CrossRef]
  54. Chen, F.; Chen, Z. Air pollution and avoidance behavior: A perspective from the demand for medical insurance. J. Clean. Prod. 2020, 259, 120970. [Google Scholar] [CrossRef]
  55. Denis, D.J.; Denis, D.K. Performance changes following top management dismissals. J. Financ. 1995, 50, 1029–1057. [Google Scholar] [CrossRef]
  56. Zheng, S.; Zhang, X.; Sun, W.; Lin, C. Air pollution and elite college graduates’ job location choice: Evidence from China. Ann. Reg. Sci. 2019, 63, 295–316. [Google Scholar] [CrossRef]
  57. Islam, E.; Zein, J. Inventor CEOs. J. Financ. Econ. 2020, 135, 505–527. [Google Scholar] [CrossRef]
  58. Lin, C.; Lin, P.; Song, F.M.; Li, C. Managerial incentives, CEO characteristics and corporate innovation in China’s private sector. J. Comp. Econ. 2011, 39, 176–190. [Google Scholar] [CrossRef]
  59. Zhao, Q.; Li, Z.; Yu, Y. Does top management quality promote innovation? Firm-level evidence from China. China Econ. Rev. 2021, 65, 101562. [Google Scholar] [CrossRef]
  60. Howitt, P. Steady endogenous growth with population and R. & D. inputs growing. J. Political Econ. 1999, 107, 715–730. [Google Scholar] [CrossRef]
  61. Wang, J.; Liu, N.; Ruan, Y. Influence factors of spatial distribution of urban innovation activities based on ensemble learning: A case study in Hangzhou, China. Sustainability 2020, 12, 1016. [Google Scholar] [CrossRef]
  62. Van Donkelaar, A.; Martin, R.V.; Brauer, M.; Boys, B.L. Use of satellite observations for long-term exposure assessment of global concentrations of fine particulate matter. Environ. Health Perspect. 2015, 123, 135–143. [Google Scholar] [CrossRef]
  63. Zhou, M.; Chen, F.; Chen, Z. Can CEO education promote environmental innovation: Evidence from Chinese enterprises. J. Clean. Prod. 2021, 297, 126725. [Google Scholar] [CrossRef]
  64. Camelo, C.; Fernández-Alles, M.; Hernández, A.B. Strategic consensus, top management teams, and innovation performance. Int. J. Manpow. 2010, 31, 678–695. [Google Scholar] [CrossRef]
  65. Godart, F.C.; Maddux, W.W.; Shipilov, A.V.; Galinsky, A.D. Fashion with a foreign flair: Professional experiences abroad facilitate the creative innovations of organizations. Acad. Manag. J. 2015, 58, 195–220. [Google Scholar] [CrossRef]
  66. Francis, B.; Hasan, I.; Wu, Q. Professors in the boardroom and their impact on corporate governance and firm performance. Financ. Manag. 2015, 44, 547–581. [Google Scholar] [CrossRef]
  67. Yang, C.; Xia, X.; Li, Y.; Zhao, Y.; Liu, S. CEO financial career and corporate innovation: Evidence from China. Int. Rev. Econ. Financ. 2021, 74, 81–102. [Google Scholar] [CrossRef]
  68. Liu, B.; Zhou, W.; Chan, K.C.; Chen, Y. Corporate executives with financial backgrounds: The crowding-out effect on innovation investment and outcomes. J. Bus. Res. 2020, 109, 161–173. [Google Scholar] [CrossRef]
  69. Saboo, A.R.; Sharma, A.; Chakravarty, A.; Kumar, V. Influencing acquisition performance in high-technology industries: The role of innovation and relational overlap. J. Mark. Res. 2017, 54, 219–238. [Google Scholar] [CrossRef]
  70. Hambrick, D.C. Upper echelons theory: An update. 2007, 32, 334–343. [CrossRef]
  71. Tuggle, C.S.; Sirmon, D.G.; Reutzel, C.R.; Bierman, L. Commanding board of director attention: Investigating how organizational performance and CEO duality affect board members’ attention to monitoring. Strateg. Manag. J. 2010, 31, 946–968. [Google Scholar] [CrossRef]
  72. Sun, H.; Cappa, F.; Zhu, J.; Peruffo, E. The effect of CEO social capital, CEO duality and state-ownership on corporate innovation. Int. Rev. Financ. Anal. 2023, 87, 102605. [Google Scholar] [CrossRef]
  73. Li, J.; Tang, Y. CEO hubris and firm risk taking in China: The moderating role of managerial discretion. Acad. Manag. J. 2010, 53, 45–68. [Google Scholar] [CrossRef]
  74. Alesina, A.; Zhuravskaya, E. Segregation and the Quality of Government in a Cross Section of Countries. Am. Econ. Rev. 2011, 101, 1872–1911. [Google Scholar] [CrossRef]
  75. Wangi, E.W. To What Extent Do Environmental Regulations Curb Air Pollution and Enhance Production, Productivity, and Innovation? 2023.
  76. Bracht, F.; Verhoeven, D. Air Pollution and Innovation. 2022. Available online: https://papers.ssrn.com/sol3/papers.cfm?abstract_id=3808260 (accessed on 28 October 2022).
  77. Arceo, E.; Hanna, R.; Oliva, P. Does the effect of pollution on infant mortality differ between developing and developed countries? Evidence from Mexico City. Econ. J. 2016, 126, 257–280. [Google Scholar] [CrossRef]
  78. Liu, G.; Yang, Z.; Zhang, F.; Zhang, N. Environmental tax reform and environmental investment: A quasi-natural experiment based on China’s Environmental Protection Tax Law. Energy Econ. 2022, 109, 106000. [Google Scholar] [CrossRef]
  79. Cheng, S. R&D expenditures and CEO compensation. Account. Rev. 2004, 79, 305–328. [Google Scholar] [CrossRef]
  80. Ikram, A.; Li, Z.; MacDonald, T. CEO pay sensitivity (delta and vega) and corporate social responsibility. Sustainability 2020, 12, 7941. [Google Scholar] [CrossRef]
  81. Ryan, H.E., Jr.; Wiggins, R.A., III. The interactions between R&D investment decisions and compensation policy. Financ. Manag. 2002, 31, 5–29. [Google Scholar] [CrossRef]
Disclaimer/Publisher’s Note: The statements, opinions and data contained in all publications are solely those of the individual author(s) and contributor(s) and not of MDPI and/or the editor(s). MDPI and/or the editor(s) disclaim responsibility for any injury to people or property resulting from any ideas, methods, instructions or products referred to in the content.

Article Metrics

Citations

Article Access Statistics

Multiple requests from the same IP address are counted as one view.