Abstract
Today, the concept of “smart ports”, which are designed to enhance operational efficiency and competitiveness, has emerged as a key paradigm in the port and maritime industry. As an integral component of maritime transportation networks, container terminals in ports play a crucial role in facilitating international trade and stimulating economic growth. Accordingly, the Korean government has steadily pursued policies and investments to improve the technological capabilities of ports, focusing on container terminals. However, there is still a lack of comprehensive research that thoroughly analyzes the operational efficiency of container terminals in domestic ports undergoing smart port technology implementation. Therefore, this study analyzes the operational efficiency of 20 container terminals across five major domestic ports, which are forerunners in smart port transformation, as declared by the Korean government. This study employs a Principal Component Analysis (PCA)–Data Envelopment Analysis (DEA) approach to increase the effectiveness of the analysis and addresses efficiency in two aspects: static and dynamic. The findings indicate that container terminals under Ulsan Port and Busan Port (New) have the best operational efficiency. In particular, Ulsan Port demonstrates significant improvement in terms of efficiency changes. The conclusion emphasizes the pivotal role of technological progress in achieving higher efficiency among container terminals. In addition to providing policymakers and port managers with useful insights into smart port transformation, this study is expected to make theoretical contributions to expanding the perspectives of port efficiency research by simultaneously encompassing static and dynamic analyses.
1. Introduction
Ports, as critical interfaces between maritime and land-based transportation networks [1,2], handle approximately 80% of the world’s maritime transportation-based trade [3], making significant contributions to international trade and economic development [4]. Along with the influence brought by the Fourth Industrial Revolution (4IR), the port and maritime industry (PMI) is continuously experiencing rapid evolution. The modernization and advancement of port infrastructure, which have been identified as integral components shaping the progression of PMI [5], have emerged as pivotal factors ensuring the efficient operation of both ports and the broader maritime industry.
In the wake of this evolution, a novel concept has arisen: the smart port. The smart port concept refers to the incorporation of advanced technologies (e.g., automation, big data, AI, IoT, etc.) into port operations to improve efficiency and competitiveness while also mitigating environmental impact [6,7]. Along with this strategic paradigm continuing to evolve, smart ports are not seen merely as a technological advancement but represent a deep-rooted pursuit of efficiency. This pursuit includes optimizing logistics and supply chain processes [8], improving resource management [9], and enhancing real-time decision-making capabilities through advanced data analytics [10]. In turn, this drive for efficiency is critical to ensuring port competitiveness in an ever-changing environment [4]. For example, through the use of IoT, smart ports can monitor and manage port activities in real time, reducing delays and improving throughput [6]. Automation technologies streamline operations, reducing the reliance on manual labor and minimizing human error [10]. Big data analytics and AI enable predictive maintenance, resource allocation, and proactive management strategies that significantly boost operational efficiency [9]. It was found that by pursuing operational efficiency, smart ports could more effectively handle increasing trade volumes, remain resilient during disruptions, and be better prepared to tackle future challenges.
Many developed nations, such as Singapore, Germany, and the Netherlands, have acknowledged the significance of implementing smart port technology to enhance overall port competitiveness. These countries have proactively invested capital in advancing smart port construction or developing smart port technologies and applying them to traditional port areas [7,11]. In line with this global trend, Korea has also promoted a smart port development plan with huge capital investment in port industries since the 2000s [7,12]. Because of the regional characteristics of the peninsula and the export-led trade structure, Korea believes the implementation of smart port technology could play a vital and significant role in the Korean economy [12]. However, the state of smart port development in Korea still lags behind its regional rivals, China and Japan, even though it has been improved as part of Korea’s national strategy [13]. In particular, considering the development of fully automated container terminals, the Port of Nagoya in Japan became Asia’s first fully automated port in 2008 [14]. Qingdao Port followed with the opening of China’s first fully automated container terminal in May 2017 [15]. In contrast, although Korea began promoting smart and automation projects in 2012, it was not until 2024 that it established its first fully automated terminal at Busan Port (New) [16].
Korea’s strategic background for developing smart ports can be mapped out through a series of policies over three key stages. In the initial stage, the focus was on incorporating basic port technologies, which were refined under the “Basic Long-term Port Development Plan (1999–2011)”. The subsequent stage emphasized enhancing the port operation system through the “National Logistics Master Plan (2011–2020)” [17] by boosting competitiveness with innovations in logistics, intelligent automation, and information-based businesses. The current stage aims to construct futuristic smart ports under the “National Logistics Master Plan (2016–2025)” (Ministry of Land, Infrastructure and Transport (MOLIT), 2016) [17]. Additionally, the Korean government (i.e., MOLIT) allocated KRW 100–200 billion over five years until 2019 for smart port technology development, emphasizing ongoing construction projects [7]. The Ministry of Oceans and Fisheries (MOF) also planned to pool KRW 17 trillion in government funds and KRW 26 trillion from the private sector to construct 12 smart ports by 2040 [13]. However, MOF is currently focusing on five major ports: Busan, Incheon, Yeosu, Gwangyang, Pyeongtaek Dangjin, and Ulsan [13]. Among these ports, Busan Port stands out as a pioneer in smart port transformation. In 2006, Busan Port opened new terminals to manage increasing trade volumes and alleviate congestion at older terminals, initiating substantial investments in smart port technology [16]. In 2015, the MOF began focusing on integrating IT solutions, automation, and remote operation technologies into port operations, which has had a direct impact on promoting the intelligent capabilities of Busan Port. Recently, in April 2024, the Busan Port (New) opened its first fully automated container terminal, which can be interpreted as a big step forward in the growth of smart ports in Korea [16].
MOF’s strategic preference for these five ports is based on the importance of the role they play in Korea. By the end of 2022, Busan Port’s total container throughput reached 22.078 million TEUs, commanding the largest market share at 76.6% (Figure 1) [18]. In comparison, Incheon Port’s throughput was 389,000 TEUs (11.1% market share), Yeosu Gwangyang Port handled 1.864 million TEUs (6.5%), Pyeongtaek Dangjin Port recorded 853,000 TEUs (3.0%), and Ulsan Port managed 389,000 TEUs (1.4%) [18]. The container throughput of these five ports accounts for more than 97% of the total in 31 international trade ports in Korea. Moreover, despite Ulsan Port’s smaller share (1.4%), its throughput exceeds the total of the others (1.5%, with 26 ports remaining), as shown in Figure 1. This underscores the significant status of these five ports in Korea. Notably, as the two most representative ports in Korea, Busan Port is subdivided into Busan North Port and Busan New Port, while Incheon Port is categorized into Incheon South Port and Incheon New Port. These ports, with their container terminals, are crucial components of Korea’s maritime infrastructure and significant gateways for global trade. By the end of 2023, Busan Port’s position escalated to the sixth in the world, highlighting its global impact [19].
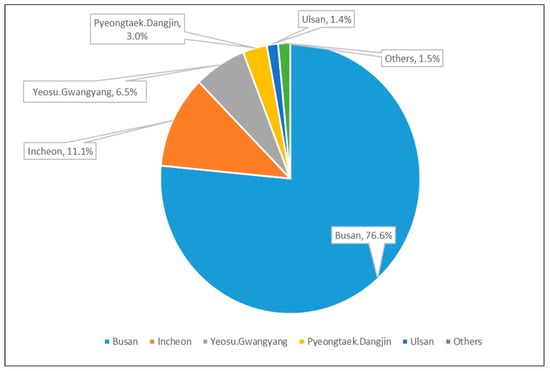
Figure 1.
Korea container throughput market share in 2022. Source: BPA [18].
Adding to the national strategic importance, in 2022, 62.5% (20 out of 32) of industrial complexes in Korea were strategically placed near ports, attracting around 44,000 international vessels to these major ports. This integration of land-based transportation networks with maritime commerce highlights their strategic significance. By actively participating in smart port initiatives, these terminals could stimulate economic growth by enhancing connectivity and efficiency. Considering the Korean government’s plan to expand to more ports (e.g., Boryeong, Saemangum, Mokpo, Jeju, Donghae, Pohang) by 2040 [13], these container terminals will continue to play a crucial role in shaping Korea’s smart port landscape. Figure 2 illustrates the distribution of container terminals across the five major ports (10 in Busan, 4 in Incheon, 2 in Pyeongtaek Dangjin, 2 in Yeosu Gwangyang, and 2 in Ulsan).
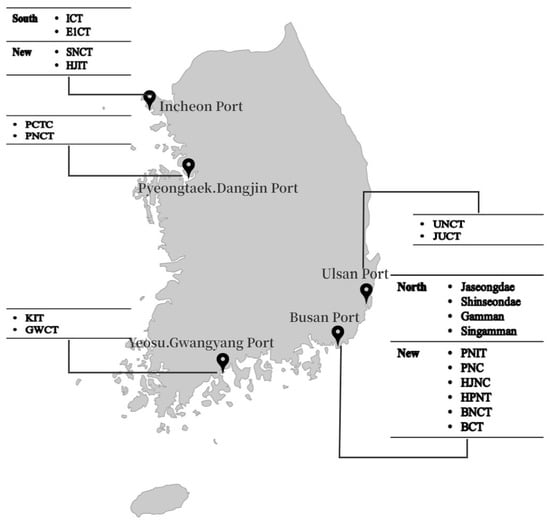
Figure 2.
Container terminal distribution across five main ports in Korea.
Ports act as vital links between land-based and maritime transportation networks, with container terminals assuming a central role in global logistics [1,2]. Research on port operation and efficiency is essential because it has a significant impact on grading using the smart port index [10,20,21]. This index is a quantitative measurement tool used to assess the degree of “smartness” of a port, considering factors such as technological applications, automation, and intelligent infrastructure. In this context, efficiency appears to become a more crucial research aspect, as it is closely tied to the intricacy of designing port infrastructure—a major factor that determines the overall performance of a port, particularly at its container terminals [20]. Inefficient container terminals result in higher transportation costs, hinder the growth of commerce, and diminish port competitiveness. Conversely, enhancing terminal efficiency not only facilitates global market access but also stimulates trade, thereby boosting incomes [22]. Realizing this importance, the Korean government has continued to develop policies and invest in converting existing ports into smart ports, with the goal of further improving operational efficiency and capabilities [7]. Nevertheless, there is still a lack of research in academia assessing operational efficiency issues underpinning this smart port development background, especially focusing on the level of container terminals.
Therefore, to address this research gap, this paper analyzes the static and dynamic operational efficiency of container terminals from five major domestic ports in Korea. These ports are currently the frontrunners of smart port technology adopters announced by the Korean government. This study aims to answer the following research questions: (1) What is the static operational efficiency of container terminals in major Korean ports that have implemented smart port technologies? And (2) how has the dynamic operational efficiency of the container terminals, which have been pursuing the utilization of smart port technologies, changed over time? For analysis to answer these questions, this study utilizes a hybrid approach combining Principal Component Analysis (PCA) and Data Envelopment Analysis (DEA).
Employing this PCA-DEA hybrid approach might permit a thorough and robust examination of efficiencies in the container terminal sector. PCA is instrumental in reducing the dimensions of the dataset, thereby making it manageable and allowing it to focus on the most significant variables [23]. Introducing PCA prior to the DEA application enables us to avoid the model accuracy reduction caused by ratio imbalance [24] between too many variables and a certain number of decision-making units (DMUs). This ratio imbalance issue is often overlooked in current studies that employ the DEA method, raising significant concerns about how to enhance DEA calculation effectiveness by controlling the ratio. Thus, this combination could bring out an effective efficiency measurement at container terminals with increased robustness and accuracy. Furthermore, with sub-models of BCC and Malmquist within DEA, both static and dynamic analyses can be performed. This may further enrich this study, offering a full view of efficiency at specific points and over time [25]. In addition, based on the characteristics of this hybrid method, this paper may theoretically offer innovation at the research level for efficiency measurement studies in the port and maritime domain. More importantly, the findings of this research could also ultimately serve as the foundation for providing implications for policymakers and port managers to further improve container terminals’ operational efficiency, especially in the context of smart port technologies development in Korea.
The rest of this paper is organized as follows. First, the next section provides a literature review on smart port efficiency and port efficiency evaluation methods. Section 3 describes the analysis procedure based on the PCA-DEA hybrid approach. Section 4 explains the efficiency index setting and data collection process for this analysis, and Section 5 presents the specific process and results of the analysis. Section 6 provides a discussion on interpreting the analysis results in depth and the present implications. Finally, Section 7 concludes with a description of the limitations of this study and future research directions.
2. Literature Review
2.1. Smart Port Efficiency
Port efficiency refers to how effectively and productively a port operates. Efficiency plays a crucial role in the competition and performance of ports [26,27]. In today’s fierce competitive maritime industry, port efficiency is actively pursued from a strategic perspective that focuses on increasing capacity, optimizing resource use, and improving overall productivity, with the aim of ensuring long-term competitiveness [28,29,30,31]. Many port efficiency studies have mainly contributed to research on costs, especially in the fields of international trade and logistics. Tongzon [32] and Clark et al. [33] verified a strong positive relationship between port efficiency and transportation costs using mathematical models. Sanchez et al. [34] concluded that port efficiency can be a pivotal factor influencing maritime transport costs. Similarly, Tongzon and Heng [8] embedded the study of port efficiency within the context of modern logistics and supply chain management (SCM), emphasizing its significant impact on transport costs and trade volume. However, at the same time, some other researchers have explored port efficiency concerning factors like port size and ownership structure. Martinez-Budria et al. [35] and Cullinane et al. [36] suggested that larger port sizes may be associated with increased efficiency. Song [37] highlighted that combining competition and cooperation strategies could enhance efficiency and competitiveness. Cui and Notteboom [38] argued that changes in port structure caused by privatization could increase both cost and technical efficiency. In addition, recent studies further emphasize the role of connectivity and sustainability in port efficiency. Rødseth et al. [39] stressed that the Liner Shipping Connectivity Index (LSCI) is vital for influencing port efficiency through improved market access. Li et al. [40] demonstrated that sustainable practices, such as reducing carbon emissions, are crucial for enhancing port efficiency.
Turning to the context of smart port development, the strategic use of cutting-edge technology has become the most common approach to increase port efficiency, and this, meanwhile, has also been recognized as the research focus in most studies [10,20,21]. Castellano et al. [9] argued that digital and communication technologies (DCTs), such as interactive websites and social media marketing, not only significantly improve port efficiency and competitiveness but also provide valuable insights for strategic investments. Philipp et al. [41] emphasized that by combining technology and innovative ideas, smart ports can achieve increased operational efficiency and reduced costs. Yau et al. [42] stressed that the efficiency improvement in smart port operations relies on the integration of information and communication technology (ICT). In addition, Molavi et al. [10], Makkawan and Muangpan [43], and Othman et al. [44] also highlighted the benefits of 4IR technologies (e.g., AI, automation, IoT, big data, blockchain, cloud computing, 5G/6G communication, etc.) in advancing various aspects of ports such as infrastructure, facilities, transport means, cargo handling, traffic management, safety assurance, and energy consumption tracking.
As such, many researchers are dedicated to enhancing operational performance by increasing efficiency in multiple areas, such as productivity, automation, and intelligent infrastructure, primarily using advanced technology. However, to obtain a balanced view of smart port evaluation, it is necessary to go beyond this operational focus and consider more diverse aspects such as environment, energy, security, safety, and social responsibility [10,20,21]. In this context, Al-Fatlawi and Motlak [45] provided a comprehensive view of smart ports, including smart ships, containers, cranes, automated guided vehicles (AGVs), and energy management, stressing technology leveraging to improve operational efficiency. Additionally, Yen et al. [20] highlighted the importance of port design and investment in relation to transport efficiency.
2.2. Port Efficiency Evaluation Methods
Port efficiency analysis commonly employs frontier models, frequently utilizing linear programming techniques that cover both parametric and non-parametric approaches. Stochastic Frontier Analysis (SFA) is applied as the representative parametric method, while Data Envelopment Analysis (DEA) is utilized as the classical non-parametric technique [22,46]. In general, SFA accounts for random errors and inefficiency, allows statistical inference, and handles various production functions but requires predefined production functions and is computationally complex [36]; DEA, on the other hand, handles multiple inputs and outputs without needing predefined production functions, but it is sensitive to outliers and noise and does not account for random errors [24].
SFA, which considers both observed and unobserved factors affecting efficiency, is suitable for various port efficiency studies. For instance, Liu [47] investigated the impact of port ownership structure on inter-port efficiency using the SFA method with 28 UK ports. Notteboom et al. [48] combined SFA with Bayesian techniques to assess the effectiveness of Asian and European container ports. Cullinane and Song [49] researched the productive efficiency of Korean container terminals through SFA with 65 observations. Barros et al. [50] evaluated the effects of cost and operational variables on major Chinese ports using the SFA with panel data spanning from 2002 to 2012. Odeck and Schoyen [46] utilized an SFA-based Malmquist productivity index approach to assess the productivity of 24 Norwegian container seaports.
Similarly, DEA constructs an efficiency frontier, comparing each DMU against top performers using varied input–output combinations [24,51]. The increasing popularity of DEA in port efficiency studies is evident in the statistical analysis of published papers in the maritime domain, as pointed out by Krmac and Kaleibar [22]. A summary of studies that have applied DEA to the efficiency analysis of domestic and international ports is shown in Table 1. It finds that, on a global scale, many researchers [25,26,35,52,53,54,55,56,57,58,59] chose DEA as a relevant measurement tool to examine efficiency-related issues in maritime ports, while on a domestic Korean scale, DEA is also popular in research targeting local ports and has been applied by researchers such as Park and De [60], R.-K. Park [61], B.-K. Park et al. [62], Min and Park [63], H.-G. Park [64], Chang [65], Seo et al. [66], and Chen et al. [67].

Table 1.
A Summary of studies applying DEA to efficiency analysis for international and domestic Korean ports.
In summary, the existing literature mainly focuses on researching port operational efficiency through static DEA approaches, with the majority targeting traditional ports and seldom incorporating the emerging trend of smart port transformation. This study would contribute to this gap by comprehensively analyzing container terminals’ operational efficiency in ports undergoing smart port technology implementation, considering both static and dynamic perspectives.
3. Methodology
As mentioned in Section 1, the purpose of this paper is to conduct an in-depth analysis of the static and dynamic operational efficiency of the five major domestic ports announced by the Korean government that have adopted smart port technology, with a particular focus on container terminals. The primary research approach in this paper involves the hybrid PCA-DEA technique, where the PCA is used to reduce variable numbers while the DEA is adopted to calculate efficiency among multiple DMUs. This combination has the advantage of improving operational efficiency evaluation accuracy while optimizing data processing, providing the research with both sharp insight and robustness. The procedure of this hybrid approach of PCA-DEA approach is delineated in Figure 3. This procedure is largely divided into two stages: “Index Setting & Data Collection” and “Data Analysis”.
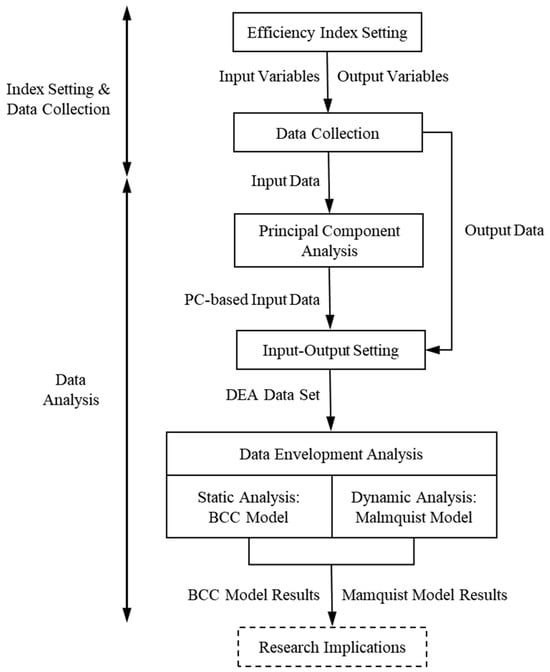
Figure 3.
Procedure of the hybrid PCA-DEA Approach.
The first stage, “Index Setting & Data Collection”, focuses on setting the efficiency index and gathering data accordingly. Reflected in Figure 3, in “Efficiency Index Setting” step of this stage, eleven indicators are configured as “Input Variables”, and one indicator is configured as an “Output Variables”. Then, in “Data Collection” step, the corresponding data to these variables are acquired.
The second stage, “Data Analysis”, stresses the use of PCA and DEA techniques to analyze the data collected in the previous stage. In this stage, the “PCA Execution” is first performed on the “Input Data” to avoid model accuracy reduction caused by potential ratio imbalance between too many variables and a certain number of DMUs. As a result of “PCA Execution”, principal components (PCs) that can be distinguished with different meanings are extracted as a basis for producing newly “PC-based Input Data”. Subsequently, this “PC-based Input Data”, together with the “Output Data” collected in the “Data Collection” step, goes through the “Input-Output Setting”, which prepares “DEA Data Set”. After that, in “DEA Execution” step, two types of DEA analysis are conducted. The first type is an analysis using the BCC Model, which pays attention to static efficiency analysis based on one point in time. The second type is the Malmquist model, which focuses on dynamic efficiency analysis, i.e., the change in efficiency between two specific points in time. Lastly, based on results gained from the above analysis, this study proposes implications for improving efficiency.
3.1. Principal Component Analysis (PCA)
Principal Component Analysis (PCA), a dimension reduction technique for handling vast data, aims to maximize the variance of a linear combination of variables while preserving their independence [23,70,71]. This method transforms original indicators into new orthogonal variables, retaining essential data and simplifying the problem [23]. PCA prevents information loss from the original indicators, enhancing objectivity by avoiding subjectivity-related influences. In general, before conducting PCA, it is necessary to perform data normalization, correlation analysis, and applicability examination [25]. Normalization, including methods like Min-Max and z-score standardization, is important in ensuring data comparability and accurate analysis by removing unit and magnitude differences [72]. At the same time, correlation analysis and applicability examination are used to assess relationships among variables and their suitability for PCA.
3.2. Data Envelopment Analysis (DEA)
Data Envelopment Analysis (DEA) is a versatile tool assessing the relative efficiency of linear programming-based schemes with multiple inputs and outputs [24,51]. Representative DEA models include CCR, BCC, Malmquist, and SBM (Slack-based Measure). Among these models, CCR and BCC have been widely studied and applied. In DEA’s context, similar schemes form the fundamental unit of analysis, defined as the Unit of Assessment (UA) or DMU [68,73]. DEA does not require constructing functional relationships between variables, making it effective in avoiding subjective influences [24,51]. However, when conducting DEA approach, it should carefully consider the numbers of selected variables of inputs, outputs, and DMUs, which in general should meet the mathematic function shown below (Equation (1)) and consider ratio balance [24]. Namely, with a fixed number of DMUs, if it loses ratio balance with too many inputs or outputs, the accuracy of the model calculation results would be reduced.
where n is total number of DMUs, p is input number, and q is output number. Here, the default value of k normally is 2 or 3 [24].
Considering the constant returns to scale assumption in CCR, it may have limitations in practical applications [74]; therefore, this paper opts for the BCC model for static analysis. The BCC model allows for the assumption of varied returns to scale, making it more adaptable and accurate when assessing DMUs of various sizes [24]. Additionally, compared to the CCR model, the BCC model may better represent the scale effects and nonlinear relationships that exist in practice, rendering it more appropriate for measuring port efficiency with diverse and varying scales. Meanwhile, for the dynamic analysis, this paper adopts Malmquist model.
3.2.1. BCC Model
The BCC model, named after Banker, Charnes, and Cooper in 1984, operates under the assumption of variable returns to scale. It considers overall efficiency (OE) as the product of technical efficiency (TE) and scale efficiency (SE). The mathematical representation, including both objective function and constraints, is shown in Equation (2).
Objective function:
Constraints:
where θ0 is the overall efficiency (OE) of the DMU, ε is the non-Archimedes constant, sj− is the input slack variable for the jth input, sr+ is the output slack variable for the rth output, λi is the weight of the ith DMU, Xjr is the value of the jth input for the ith DMU, Yri is the value of the rth output for the ith DMU, Xj0 is the input value of the target DMU, and Yr0 is the output value of the target DMU.
Typically, upon performing the BCC model calculation, three possible outcomes are obtained [24,51]:
① When θ = 1 and sj− = 0, sr+ = 0, the DMU is DEA effective; namely, the input–output efficiency reaches the optimal state;
② When θ = 1 and sj− ≠ 0, sr+ ≠ 0, the DMU is DEA weakly effective; namely, the amount of input is too large and fails to reach the optimal efficiency state;
③ When θ ≠ 1, the DMU is DEA ineffective.
3.2.2. Malmquist Model
The Malmquist model, normally known as Malmquist productivity index (MPI), is a method used to assess the productivity change of a DMU over time [75,76,77]. The general expression is shown below (Equation (3)):
where M (xt, yt, xt+1, yt+1) is MPI, Dt + 1(xt+1, yt+1) is technology distance from period “t” to “t + 1”, Dt(xt, yt) is technology distance in period “t”, Dt(xt+1, yt+1) is technology distance in period “t + 1”, xt+1 is input vector in period “t + 1”, yt+1 is output vector in period “t + 1”, xt is input vector period “t”, and yt is output vector period “t”.
The MPI is a valuable tool for assessing and quantifying changes in total factor productivity (TFP) between two consecutive time periods [75,76,77]. TFP serves as a metric for the efficiency of converting inputs into outputs, encompassing all factors of production. When M (xt, yt, xt+1, yt+1) > 1, TFP demonstrates an upward trend from period “t” to period “t + 1”; when M (xt, yt, xt+1, yt+1) = 1, it remains in a stable state; when M (xt, yt, xt+1, yt+1) < 1, it indicates a declining trend. TFP is intricately connected to two other components, namely efficiency changes (EC) and technological change (TC). EC reflects the shift in efficiency of DMUs from one time period to another, while TC represents the technological progress made by DMUs over time. The relationship between TFP, EC, and TC can be expressed as Equation (4):
4. Index Setting and Data Collection
4.1. Efficiency Index Setting
This study aims to investigate the operational efficiency of twenty container terminals in five main ports in Korea undergoing smart port technology development. The DMU has thus been chosen as the twenty container terminals under these main ports. Simultaneously, after referring to the previous research, this study builds the input evaluation index (11 indicators) around three aspects of “Land”, “Facility”, and “Labor” and sets a single variable of “Container Throughput” as the output evaluation indicator. Table 2 below presents the evaluation index building for this paper.
Table 2.
Evaluation index building.
4.2. Data Collection
The research data in this paper are mainly derived from secondary sources, taking the most recent accessible data from the year interval of 2020 to 2022 as the basis. The data of the output indicator “Container Throughput (Y)” are collected from Port MIS, the statistical database under MOF in Korea. For the data of the input indicators, especially for the 9 out of 11 variables of “Terminal Area (X1)”, “C.F.S. Area (X2)”, “Lenth of Berth (X3)”, “Depth of Water (X4)”, “Number of Berths (X5)”, “No. of Quay Crane (X6)”, “No. Transfer Crane (X7)”, “No. Other Mobile equipment (X8)”, and “Container Handling Capacity (Annual) (X9)”, they are collected form the official website of each container terminals and the annual reports issued by the port authority that they are belonging to. The data on the remaining human-related input indicators of “No. of Employee (X10)” and “Employee Salary (Annual) (X11)” were obtained from the specialist recruiting organization called “Saramin” in Korea.
5. Data Analysis
In this section, the analysis centered on the twenty selected container terminals backgrounded by the Korean smart port development context is conducted with both PCA and DEA operations. The computational tool adopted in this paper is SPSSAU, an online data science algorithm platform that delivers statistical [78].
5.1. PCA Execution
Data normalization is the first processing step in executing the PCA. In this paper, the classic data normalization method of “Min-Max normalization” (Equation (5)) is used. “Min-Max normalization” is a straightforward technique that precisely scales the data within a predefined range, which normally scales between 0 and 1 [72].
where X is the value of the original variables, X′ is the value after normalization, min (X) is the minimum observed value of X in the dataset, and max (X) is the maximum observed value of X in the dataset.
After data normalization, it comes to data correlation and applicability tests. In the correlation analysis, it takes the data sample of 2022 as an example and finds that the original data among input variables of “X1”, “X3”, “X6”, “X7”, “X8”, and “X9” have a high correlation relationship. The average correlation coefficient between any two of these variables listed above is nearly 0.85. Similar phenomena also can be detected among the data samples collected from the years 2021 and 2020. The relatively high correlation, therefore, suggests suitability for applying PCA, which is advantageous in mitigating the impact of information overlap among the original variables by extracting “PCs” while preserving the essential information [25]. Next, turning to the applicability examination, both KMO and Bartlett tests are conducted (Table 3). The KMO test determines whether the sample size is sufficient, and for sample sizes less than 100, a value greater than 0.6 is considered appropriate [79]. The KMO values for the years 2020, 2021, and 2022 are notably high, measuring 0.763, 0.780, and 0.733, respectively. Additionally, all the p-values from the Bartlett test for these three years are below 0.05, suggesting that applying PCA to the dataset is suitable [79].
Table 3.
KMO and Bartlett test.
Subsequently, when applying PCA to three sample datasets from the years 2020, 2021, and 2022, it is observed that four “PCs” are extracted from each input-oriented dataset, keeping more than 90% of the original data. Specifically, the cumulative variance achieved by the four “PCs” in 2020 is 92.35%, while in 2021 and 2022, these figures change to 91.89% and 92.59%, respectively (see Table 4). Although the cumulative contribution rate surpassing 85% typically indicates a sufficient representation of the original variable information [80], this study sets a higher standard, choosing to select “PCs” that account for more than 90% of the variance to ensure a more robust representation.
Table 4.
PC extracting.
Meanwhile, the loading matrix produced by PCA reveals the correlation relationships among the “PCs” and their original input indicators. Table 5 illustrates the loading values for the four “PCs” across each sample year (2022, 2021, and 2020). Based on the loading value distribution of each year, it is observed that items with high loading values under PC1 consistently correspond to variables centered around facility dimensions (e.g., X6, X7, X8, X9). For PC2 and PC3, high loading values were found to be associated with variables related to dimensions of land (e.g., X2) and labor (e.g., X11), respectively. Furthermore, for PC4, the high-loading-value items also exhibit a strong loading relationship with land dimensions. Thus, within these four “PCs”, PC1 primarily represents facility-related aspects, while PC2 and PC4 are associated with land, and PC3 focuses on the labor dimension.
Table 5.
Loading matrix.
Additionally, with the orthogonal rotation of the loading matrix, the linear combination coefficient matrix is formed (Table 6). This table can be used for calculating the score of each “PC”.
Table 6.
Linear combination coefficient matrix.
5.2. Input–Output Setting
Based on the coefficients presented in Table 6, the score for each “PC” in each sample year can be computed. These scores are used as the “PC-based Input Data”, which are labeled with new variable names: PC1, PC2, PC3, and PC4. These newly formed inputs represent the key information of the container terminals’ operational characteristics in three dimensions: land, facility, and labor. The output is measured as the singular original output (container throughput). These input and output data are prepared for the next step of DEA execution. Table 7 offers the input–output setting, using the 2022 dataset as an example.
Table 7.
Input–output setting (example with dataset of 2022).
However, in Table 7, it is not difficult to find that there are some negative values among input settings. Thus, considering that the input and output data for the DEA approach should not be negative, it needs to undergo a negative-to-positive transformation. This paper refers to Zhang et al. [81] and adopts the revised “Min-Max normalization” (Equation (6)) method to make negative values positive.
where I is the score of each “PC” gained through PCA execution, I′ is the value after negative-to-positive transformation, min (I) is the minimum obtained score of I in the dataset, and max (I) is the maximum obtained score of I in the dataset.
5.3. DEA Execution
With the prepared data set in the previous step, DEA execution is carried out. The sub-model BCC is used for static analysis, while Malmquist is for dynamic analysis.
5.3.1. Static Analysis: BCC Model
Table 8 presents the TE, SE, and OE results of the BCC model for twenty DMUs (container terminals) across the sample years of 2022, 2021, and 2020. However, it is worth noting that one DMU, “BCT”, was only established in the recent year 2022 and therefore lacked results for the years 2021 and 2020.
Table 8.
Results of BCC model calculation.
For the TE measurement, which indicates the efficiency of technical factors applied by DMUs, a value equivalent to 1 indicates that the factor is being employed effectively. Conversely, a value less than 1 suggests that there is room to enhance the factor’s technological efficiency [24,51]. As shown in Table 8, four DMUs—“PNC”, “HJNC”, “UNCT”, and “JUCT”—achieved technical efficiency in 2020. This trend continued into 2021 with the addition of another technically efficient DMU, “HPNT”. By 2022, a total of seven DMUs reached technical efficiency, including “BNCT” and “BCT”, which were newly recognized as such compared to the previous year. The increasing technical efficiency of DMUs over the years means that advances in smart port technology and ongoing operational improvements are increasing efficiency. In particular, terminals such as “BNCT” and “BCT”, which achieved technical efficiency in 2022, benefited from investment in automation to strengthen Busan Port’s capabilities [16].
For the SE measurement, which examines the scale efficiency of DMUs, if the SE value is 1, it denotes that the scale factor achieves optimal scale efficiency; if the SE value is less than 1, it suggests potential enhancement of returns to scale by expanding the scale. Conversely, if the SE value is greater than 1, it implies no decrease or change in returns to scale [24,51]. Table 8 reveals that in 2020 and 2021, the DMUs “PNC” and “HJNC” maintained scale efficiency. But, by 2022, the scale efficiency DMUs have changed to “PNC”, “BNCT”, and “JUCT”. The shift in scale efficiency indicates significant changes in port operations and infrastructure. The emergence of “BNCT” and “JUCT” as scale-efficient DMUs in 2022 can be attributed to their processing capacity expansion and effective resource management. In contrast, the scale operations in “HJNC” might not align with its infrastructure allocation adjustments in 2022, and therefore, it needs a reassessment to regain optimal efficiency.
The OE measurement, which is used to test the overall efficiency of DMUs, is obtained by multiplying the value of TE with SE. The value of OE should be equal to or less than 1, where a value of 1 signifies DEA efficiency and a value rather than 1 indicates non-DEA efficiency [24,51]. It detects that in Table 8, two DMUs of “PNC” and “HJNC” reached DEA efficiency in 2020, and this result has continued through 2021, while in 2022, the efficient DMUs switched to “PNC”, “BNCT”, and “JUCT”. The OE results for the observed sample years highlight the consistent performance of “PNC” and the increasing efficiency of “BNCT” and “JUCT”. This may benefit from the effective operational strategies and technological innovations of the three container terminals. In particular, “BNCT” achieved OE with increases in TE and SE in 2022, while for “HJNC”, the OE decline was accompanied by its SE reduction in 2022, which implies a necessity to address operational inefficiencies.
5.3.2. Dynamic Analysis: Malmquist Model
Table 9 presents the Malmquist model’s calculation results, which measure efficiency changes from 2020 to 2022 across two distinct periods: “2020–2021” and “2021–2022”. However, because no data are available for the DMU “BCT” in 2020 and 2021, this DMU is deemed unsuitable for the dynamic analysis of the Malmquist model and is therefore excluded from the calculations.
Table 9.
Results of Malmquist model calculation.
The TFP examination is often the indicator most focused on when calculating the Malmquist model. TFP can be split into two components: EC and TC, where EC can be further divided into pure technical efficiency (PEC) and scale efficiency (SEC). If the TFP value exceeds 1, it suggests an increase in efficiency; conversely, if the TFP is less than 1, it indicates a decrease or decline in efficiency [75,76,77]. As shown in Table 9, it finds that during the transition from 2020 to 2021, although all the DMUs’ TFP values approached 1, half of DMUs still reported a decline in efficiency, indicated by values less than 1. Conversely, the remaining half of DMUs demonstrated an improvement, with values greater than 1. However, there was a significant shift from 2021 to 2022. Except for two DMUs, “HJNC” and “HPNT”, which exhibited lower TFP values of 0.781 and 0.987, respectively, all other valid DMUs demonstrated an enhancement in efficiency.
For the EC examination, which assesses changes in technical efficiency, a value greater than 1 reveals an improvement in technical efficiency compared to the previous period, while a value less than 1 illustrates a decline [75,76,77]. In Table 9, it was discovered that during the transition from 2020 to 2021, there were eight DMUs with EC values greater than 1, two DMUs with EC values equal to 1, and nine DMUs with EC values lower than 1. This suggests varying situations in technical efficiency development—increasing, stagnant, and decreasing, respectively. Specifically, among eight technical efficiencies increasing DMUs, six DMUs of “PNIT”, “HPNT”, “BNCT”, “KIT”, “GWCT”, and “PNCT” further displayed the improvement trend in both subcomponents of PEC and SEC. Turning to the transition from 2021 to 2022, all but one DMU, “HJNC”, had a lower EC value (0.953), and one DMU, “PNC”, had a stagnant EC value (1.000); the remaining seventeen DMUs developed technical efficiency sharply. Notably, eight DMUs of “Gamman”, “PNIT”, “BNCT”, “ICT”, “SNCT”, “HJIT”, “KIT”, and “GWCT” were further detected with an increase in both subcomponents of PEC and SEC. Reasons for the strengthening of EC between 2021 and 2022 may include strategic investments in new equipment and infrastructure. Specifically, “HPNT” at Busan Port (New Port) has continuously introduced cutting-edge facilities such as remote-control cranes to increase productivity [16]; “KIT” and “GWCT” from Yeosu Gwangyang Port upgraded their facilities to accommodate larger vessels [82]. These DMUs (container terminals) have shown their efforts to improve technical efficiency.
For the TC examination, which tests the degree of technical progress, a value greater than 1 signifies an enhancement in technical progress compared to the previous period, while a value less than 1 indicates a decline [75,76,77]. Table 9 reveals that in the transition from 2020 to 2021, all but one DMU, “PNC” (1.018), shows technical progress in enhancement, and two DMUs of “HPNT” (0.974) and “BNCT” (0.991) display technical progress in decrease; all of the remaining sixteen DMUs present stagnant technical progress. In turning to the transition from 2021 to 2022, the DMUs with technical progress in enhancement increased to five of “Jaseongdae” (1.030), “PNC” (1.617), “BNCT” (1.037), “GWCT” (1.047), and “UNCT” (1.150); the DMUs with technical progress in decline were “HJNC” (0.820) and “HPNT” (0.915), while the remaining twelve DMUs still maintained the stagnant state of technical progress. The increase in TC between 2021 and 2022 was primarily attributed to the adoption of advanced technologies such as automation, IoT, AI, and big data, which have enhanced operations by making technical progress. Evidence from this period includes two DMUs (container terminals) at Busan Port (New): “PNC” implemented smart management systems and eco-friendly technologies to boost efficiency and reduce emissions, while “BNCT” invested in automation and digitalization to drive technical progress [16].
Considering the discussion on TFP, EC, and TC so far and their changing trends, it can be confirmed that the increase in TFP is accompanied by an improvement in EC and TC. This trend mainly appears between 2021 and 2022. Specifically, efficient operating practices and applied technologies are shown to simultaneously enhance EC and TC, which in turn results in improved overall efficiency. This suggests that most container terminals (DMUs) are focused on driving substantial improvements in both efficiency and technological advancements to further improve performance.
6. Discussion, Findings, and Implications
As port operations are rooted in dynamism and complexity in nature [83], introducing the additional discussion on the return to scale (ROS) and average annual structural change appears to be necessary for attaining clearer findings. ROS is an economic term that describes the percentage change in output when all inputs increase by a certain percentage [84]. Discussing ROS helps organizations evaluate the impact of scaling production on output and efficiency, enabling them to make informed decisions. The average annual structural change, on the other hand, measures changes within an organization in a given period [77]. Discussing the average annual structural change is crucial because it can shed light on changing trends and aid organizations in predicting future patterns [85]. Both ROS and annual structural change may provide insightful information for measuring the effects of multiple operations in a container terminal, allowing a deeper understanding of how changes can affect a container terminal’s efficiency and guiding strategic decisions.
The first discussion presented is about the ROS status of twenty selected DMUs (container terminals) during the observed period from 2020 to 2022. In general, the operating environment of ports is complex [83]. Thus, when measuring the operational efficiency of a port, it is more practical to assume ROS in a variable status rather than in a constant status [74]. This assumption is consistent with the perspective of the BCC approach. Table 10 uses the lambda value to illustrate the ROS types of twenty selected DMUs. Here, the lambda value is seen as a unit of measurement for assessing how changes in scale returns affect the benefits of the DMU [69]. In general, there are three ROS types based on the lambda value. If the lambda value equals 1, it means the scale return remains constant (optimal state); if the lambda value is less than 1, it suggests an increase in scale returns (the scale is too small and can be expanded to increase benefits). Conversely, if the lambda value is greater than 1, it implies a decrease in scale returns (the scale is too large and can be reduced to increase benefits). In Table 10, DMUs with a lambda value of 1 reveal a constant ROS, while those with a lambda value of less than 1 illustrate an increasing ROS. These findings on ROS types also highly exhibit consistency with the efficiency measurement results calculated from the static analysis of the BCC approach in Table 8. Especially, the DMUs that demonstrate an OE value of 1 in Table 8 correspondingly show a constant ROS with a lambda value of 1 in Table 10. Similarly, those DMUs with an OE value less than 1 in Table 8 indicate an increasing ROS, reflected by a lambda value less than 1 in Table 10. Apart from the above, Table 10 also reveals that during the observation period from 2020 to 2022, two DMUs at Busan Port (New) consistently experienced stable scale payoffs. In 2020 and 2021, the DMUs identified with constant ROS were “PNC” and “HJNC”. However, in 2022, this shift to “PNC” and “BNCT”. Moreover, except for the DMU “JUCT” at Ulsan Port, which also achieved a constant ROS in 2022, all other DMUs with an ROS coefficient below 1 indicate the need for scale expansion to enhance efficiency. Thus, it is evident that from 2020 to 2022, both Busan (New) and Ulsan Ports demonstrated operational efficiency. Specifically, Busan Port maintained efficient operations consistently with two DMUs (“PNC and HJNC” or “PNC and BNCT”), and Ulsan Port achieved operational efficiency in 2022 with the DMU “JUCT”.
Table 10.
ROS status of selected DMUs.
Building on the previous ROS discussion, this paper simultaneously examines the average structural changes of twenty selected DMUs (container terminals) over time. The following Table 11, derived from Table 9, further reveals the shift between two distinct time periods (“2020–2021” and “2021–2022”) and uncovers potential trends within the dataset. Specifically, at the container terminal level, a consistent trend of improvement in average structural changes in TFP across nearly all DMUs is observed. Noteworthy, there has been a substantial increase in technical efficiency, as evidenced by the EC component, with “JUCT” (1.766), “UNCT” (1.670), and “E1CT” (1.585) emerging as the top-performing container terminals. Likewise, the examination of TC highlights “PNC” (1.318) as the leader in fostering technical advancements, followed by “UNCT” (1.075) and “GWCT” (1.023). After multiplying these efficiency values, it uncovers the top three TFP improvements: “UNCT” (1.851), “JNCT” (1.766), and “E1CT” (1.585). While turning to the port level, remarkable increases in EC are observed at Ulsan Port (1.718), Incheon Port (South) (1.397), and Pyeontack Dangjin Port (1.237), demonstrating their dedication to enhancing operational efficiency. Similarly, significant enhancements in TC are noted at Ulsan Port (1.038), Busan Port (New) (1.037), and Yeosu Gwangyang Port (1.012), reflecting their proactive approach to technological innovation. Then, multiplying these EC and TC values at the port level reveals that Ulsan Port (1.808) is the best-performing port in terms of TFP, followed by Incheon Port (South) (1.397), Pyeontack Dangjin Port (1.237), Yeosu Gwangyang Port (1.137), Incheon Port (New) (1.125), Busan Port (New) (1.103), and Busan Port (North) (1.077).
Table 11.
Average structural change of selected DMUs.
Through the above discussions, this paper derives two key findings, highlighting the internal consistency between static and dynamic analyses. The first finding indicates that container terminals in Busan Port (New) and Ulsan Port have relatively optimal operational efficiency states during the observation period. This answers research question (1): “What is the static operational efficiency of container terminals in major Korean ports that have implemented smart port technologies?” Concerning research question (2), “How has the dynamic operational efficiency of the container terminals, which have been pursuing the utilization of smart port technologies, changed over time?”, the second finding reveals the dynamic operational efficiency change by TFP transition across adjacent two-year transitions. It demonstrates that Ulsan Port emerges as the top performer in TFP change, followed by Incheon Port (South), Pyeontack Dangjin Port, Yeosu Gwangyang Port, Incheon Port (New), Busan Port (New), and Busan Port (South).
Based on these research findings, this study further reveals there is a significant correlation between TFP and operational efficiency, highlighting the crucial role played by the degree of technical progress in achieving optimal efficiency within container terminals. This correlation can be reflected as a virtuous cycle: progress in technology, particularly the application of cutting-edge technology, can raise TFP and improve operational efficiency. The case of the “JUCT” terminal in Ulsan Port exemplifies the practical application of the theoretical correlation between technical progress and operational efficacy. During the observation period, “JUCT” successfully transitioned from a phase of inefficiency to an improved state of efficiency, propelled by enhancements in technical efficiency and the intensification of technological progress degrees. However, even with the recognition of the significant role technical progress played in enhancing overall operational efficiency, there is a disparity in achieving efficiency levels across various container terminals due to the difference that exists in technological advancement degree. Specifically, once certain terminals meet a threshold of efficiency, the momentum for advancing technical progress may decelerate or stagnate. This phenomenon is evident in terminals like “PNC” and “HJNC” within Busan Port (New), which maintain consistent operational efficiency but exhibit relatively low TFP values. Hence, it is apparent that while some terminals pursue aggressive technological advancement for the optimization of efficiency, others adopt a more equilibrium-oriented approach to maintain their achieved efficiency levels.
All the above research findings eventually serve as the foundation for implications to policymakers and port managers for further improving efficiency, particularly in the context of smart port technology integration. For policymakers, this research suggests the necessity of crafting policies that incentivize and support the promotion of smart port technologies. These policies have the potential to stimulate container terminals to increase the degree of technical progress, accelerating the achievement of operational efficiency and sustainable practices. Moreover, with the identified top-performing ports showcasing advancements in technical efficiency and progress, policymakers can direct strategic investments, such as enhancing smart infrastructure, developing data analytics capabilities, and implementing cybersecurity measures, toward the further development of smart port (container terminal) building. In addition, to effectively pursue these strategic directions, it is also necessary for policymakers to develop standardized guidelines for the implementation and operation of smart port technologies based on experience that has successfully improved operational efficiency. These guidelines are expected to enable consistency and interoperability across various ports (container terminals) in terms of practical operations and ultimately contribute to strengthening the sustainability of smart ports. For port managers, this paper also highlights the importance of embracing smart port technologies for speeding operational efficiency optimization. The continuous incorporation of emerging technologies such as IoT, automation, and digital twins is expected to accelerate the level of technical progress, which ultimately enhances the operational efficiency of container terminals. Thus, port managers are suggested to prioritize incorporating technologies into port operations to promote the realization of smart ports (container terminals). In order to effectively realize this strategic direction, port managers, in particular, need to develop and implement regular training programs for the port (container terminal) personnel. These programs would aim to improve the workforce’s ability to understand and utilize new technologies to ensure an effective transition to smart operations. Meanwhile, since smart port technology will continue to be updated, it is important to make efforts to update and operate training programs to keep pace with these changes.
7. Conclusions
Ports and container terminals play a pivotal role in connecting land and maritime transport systems within global logistics [1,2]. Studying port operation and efficiency is significant because it not only can affect the smart port index ratings but also the ultimate evaluation of performance and competitiveness [10,20,21]. Despite this importance being recognized by many researchers, previous research on Korean ports has primarily focused on traditional container terminals with little recognition of the growing trend of smart port technology. Meanwhile, the prevalent frontier model of DEA, commonly employed in port efficiency studies, has also been recognized with limitations when involving a large amount of input and output variables with certain numbers of DMUs. This is due to a specific guideline (see Equation (1)) that sets criteria for the ratio between the numbers of inputs, outputs, and DMUs to ensure DEA model efficacy and analysis reliability [24]. Namely, exceeding this ratio with too many inputs or outputs for a set number of DMUs may reduce the accuracy of DEA analysis results. Thus, to address this risk while filling the research gap, this paper raises two research questions and introduces the hybrid PCA-DEA method to investigate the operational efficiency of container terminals in five Korean ports that are at the forefront of smart port technology advancements. In this approach, PCA is employed to handle numerous variables, while two sub-models of BCC and Malmquist under DEA are used for conducting static and dynamic analysis, respectively. Concerning research question (1) on static operational efficiency, the findings indicate that container terminals under Ulsan Port and Busan Port (New) have the best operational efficiency during the selected observation. Meanwhile, concerning research question (2) on dynamic operational efficiency changes over time, Ulsan Port demonstrates a transition from inefficiency to efficiency and consistently leads in TFP improvement, followed by Incheon Port (South), Pyeongtaek Dangjin Port, Yeosu Gwangyang Port, Incheon Port (New), Busan Port (New), and Busan Port (South). Based on all the research findings, this paper further emphasizes the pivotal role of technical progress in achieving higher efficiency among container terminals.
The theoretical contributions of this study can be discussed in two points as follows. As to the research comparison with the previous literature, the approach of this study aligns with those of Park et al. [62], Min and Park [63], and Park [64], which also applied the static DEA method to evaluate the efficiency of container terminals in Korean ports. However, unlike these studies that use only static analysis, this paper provides a systematic methodology that incorporates both static and dynamic analyses. This can be considered a significant theoretical contribution in that it allows us to gain more comprehensive insights from a broader perspective. Additionally, as described in the Literature Review section, there is a notable lack of studies on port operation efficiency within the context of Korean smart port development. Although Seo et al. [66] recognized the trend toward smart ports and focused on automobile container terminals, their study only covered infrastructure and labor factors, excluding broader indicators such as land-related elements. Thus, this paper addresses the existing weakness by expanding to a more multidimensional perspective, which can be considered another theoretical contribution of this study.
Nevertheless, this study still has the following limitations. First, although this study attempts to offer a comprehensive approach by considering both static and dynamic analysis of operational efficiency and using two DEA models—BCC and Malmquist—it does not assume alternative models, such as undesirable SBM, which is equipped to handle negative factors. This oversight might neglect the impact caused by potential undesirable inputs or outputs, thereby influencing the research findings. As such, future research may achieve more precise outcomes by considering a wider variety of models. Second, while the eleven input variables in this study provide a range of perspectives on the input portion, the output variable does not offer the same breadth. Therefore, future research should explore output variables from a wide range of viewpoints to assess efficiency more effectively in port sectors. Third, another limitation may be the short-term data. This study covers only three years of data from 2020 to 2022, which may lead to limitations in the dynamic analysis of long-term efficiency changes. Therefore, in future studies, it is necessary to use data over a longer period to identify trends from a longer-term perspective. Meanwhile, this study analyzed the overall impact of technology on ports. However, in the future, it will be necessary to conduct a more in-depth analysis of how specific technologies, such as 5G, robotics, or AI, affect port efficiency. Additionally, a comparative study on port efficiency among countries is also considered to be an interesting future research work.
Author Contributions
Conceptualization, L.Z. and W.S.; methodology, L.Z.; software, L.Z.; validation, L.Z. and W.S.; formal analysis, L.Z.; investigation, L.Z.; resources, L.Z.; data curation, L.Z. and W.S.; writing—original draft preparation, L.Z.; writing—review and editing, L.Z. and W.S.; visualization, L.Z. and W.S.; supervision, W.S.; project administration, W.S. All authors have read and agreed to the published version of the manuscript.
Funding
This work was supported by the Ministry of Education of the Republic of Korea and the National Research Foundation of Korea (NRF-2022S1A5C2A03093690).
Institutional Review Board Statement
Not applicable.
Informed Consent Statement
Not applicable.
Data Availability Statement
The raw data supporting the conclusions of this article will be made available by the authors on request.
Acknowledgments
The authors wish to thank the editors and anonymous referees for their helpful comments and suggested improvements.
Conflicts of Interest
The authors declare they have no conflict of interest over the publishing of this study.
References
- Günther, H.O.; Kim, K.H. Container terminals and terminal operations. OR Spectr. 2006, 28, 437–445. [Google Scholar] [CrossRef]
- Felício, J.A.; Caldeirinha, V.; Dionísio, A. The effect of port and container terminal characteristics on terminal performance. Marit. Econ. Logist. 2015, 17, 493–514. [Google Scholar] [CrossRef]
- Humphrey, R. Why Ports Matter for the Global Economy. Available online: https://blogs.worldbank.org/transport/why-ports-matter-global-economy (accessed on 2 April 2024).
- Zheng, S.; Negenborn, R.R. Centralization or decentralization: A comparative analysis of port regulation modes. Transp. Res. E Logist. Transp. Rev. 2014, 69, 21–40. [Google Scholar] [CrossRef]
- de la Peña Zarzuelo, I.; Freire Soeane, M.J.; López Bermúdez, B. Industry 4.0 in the port and maritime industry: A literature review. J. Ind. Inf. Integr. 2020, 20, 100173. [Google Scholar] [CrossRef]
- Ferretti, M.; Schiavone, F. Internet of Things and business processes redesign in seaports: The case of Hamburg. Bus. Process Manag. J. 2016, 22, 271–284. [Google Scholar] [CrossRef]
- Jun, W.K.; Lee, M.K.; Choi, J.Y. Impact of the smart port industry on the Korean national economy using input-output analysis. Transp. Res. A Policy Pract. 2018, 118, 480–493. [Google Scholar] [CrossRef]
- Tongzon, J.; Heng, W. Port privatization, efficiency and competitiveness: Some empirical evidence from container ports (terminals). Transp. Res. A Policy Pract. 2005, 39, 405–424. [Google Scholar] [CrossRef]
- Castellano, R.; Fiore, U.; Musella, G.; Perla, F.; Punzo, G.; Risitano, M.; Sorrentino, A.; Zanetti, P. Do digital and communication technologies improve smart ports? A fuzzy DEA approach. IEEE Trans. Ind. Inform. 2019, 15, 5674–5681. [Google Scholar] [CrossRef]
- Molavi, A.; Lim, G.J.; Race, B. A framework for building a smart port and smart port index. Int. J. Sustain. Transp. 2020, 14, 686–700. [Google Scholar] [CrossRef]
- Lin, S.C.; Chang, H.K.; Chung, Y.F. Exploring the Impact of Different Port Governances on Smart Port Development Strategy in Taiwan and Spain. Sustainability 2022, 14, 9158. [Google Scholar] [CrossRef]
- ESCAP. Smart Ports Development Polices in Asia and the Pacific; ESCAP: Bangkok, Thailand, 2021. [Google Scholar]
- Intralink. Marine Industry 4.0 South Korea; Department for International Trade: Seoul, Republic of Korea, 2021. [Google Scholar]
- IAPH. The Study on Best Practices of Container Terminal Automation in the World; International Association of Ports and Harbors: Tokyo, Japan, 2015. [Google Scholar]
- CGTN. Ghost Port: Asia’s First Fully-Automated Port Begins Operations in Qingdao. Available online: https://news.cgtn.com/news/3d637a4e31677a4d/share_p.html (accessed on 5 June 2024).
- Seatrade Maritime News. Busan New Port Launches First Automated Container Terminal in South Korea; Seatrade Maritime News: Dubai, India, 2024; Available online: https://www.seatrade-maritime.com (accessed on 5 June 2024).
- Ministry of Land, Infrastructure and Transport. The National Logistics Master Plan (2016–2025); Ministry of Land, Transport and Maritime Affairs: Sejong, Republic of Korea, 2016. [Google Scholar]
- BPA. 2022 Port of Busan Container Statistics. Available online: https://www.busanpa.com/eng/Board.do?mode=view&mCode=MN0043&idx=30055 (accessed on 27 April 2024).
- World Shipping Council. The Top 50 Container Ports. Available online: https://www.worldshipping.org/top-50-ports (accessed on 1 March 2024).
- Yen, B.T.H.; Huang, M.J.; Lai, H.J.; Cho, H.H.; Huang, Y.L. How smart port design influences port efficiency—A DEA-Tobit approach. Res. Transp. Bus. Manag. 2023, 46, 100862. [Google Scholar] [CrossRef]
- Belmoukari, B.; Audy, J.F.; Forget, P. Smart port: A systematic literature review. Eur. Transp. Res. Rev. 2023, 15, 4. [Google Scholar] [CrossRef]
- Krmac, E.; Mansouri Kaleibar, M. A comprehensive review of data envelopment analysis (DEA) methodology in port efficiency evaluation. Marit. Econ. Logist. 2023, 25, 817–881. [Google Scholar] [CrossRef]
- Abdi, H.; Williams, L.J. Principal component analysis. Wiley Interdiscip. Rev. Comput. Stat. 2010, 2, 433–459. [Google Scholar] [CrossRef]
- Cooper, W.W.; Seiford, L.M.; Tone, K.; Zhu, J. Some models and measures for evaluating performances with DEA: Past accomplishments and future prospects. J. Prod. Anal. 2007, 28, 151–163. [Google Scholar] [CrossRef]
- Chen, J.; Wan, Z.; Zhang, F.; Park, N.k.; He, X.; Yin, W. Operational Efficiency Evaluation of Iron Ore Logistics at the Ports of Bohai Bay in China: Based on the PCA-DEA Model. Math. Probl. Eng. 2016, 2016, 9604819. [Google Scholar] [CrossRef]
- Mustafa, F.S.; Khan, R.U.; Mustafa, T. Technical efficiency comparison of container ports in Asian and Middle East region using DEA. Asian J. Shipp. Logist. 2021, 37, 12–19. [Google Scholar] [CrossRef]
- Fancello, G.; Serra, P.; Aramu, V.; Vitiello, D.M. Evaluating the efficiency of Mediterranean container ports using data envelopment analysis. Compet. Regul. Netw. Ind. 2021, 22, 163–188. [Google Scholar] [CrossRef]
- Haralambides, H.E. Containerization and the port industry. Int. Encycl. Transp. 2021, 5, 545–556. [Google Scholar] [CrossRef]
- Parola, F.; Risitano, M.; Ferretti, M.; Panetti, E. The drivers of port competitiveness: A critical review. Transp. Rev. 2017, 37, 116–138. [Google Scholar] [CrossRef]
- Figueiredo, A.E.P.; Carvalhal, R.d.D.; Hoeflich, S.; Figueiredo, L.; Pereira, S.L.; Dias, E.M. Port operation—Increase of automated systems, decline of workforce jobs? In Recent Advances in Computer Science, Proceedings of 19th International Conference on Circuits, Systems, Communications and Computers (CSCC 2015), Zakynthos Island, Greece, 16–20 July 2015; IEEE: Piscataway, NJ, USA, 2015; pp. 259–266. ISBN 978-1-61804-320-7. [Google Scholar]
- Cullinane, K.; Wang, T.F. Chapter 23 Data Envelopment Analysis (DEA) and Improving Container Port Efficiency. Res. Transp. Econ. 2006, 17, 517–566. [Google Scholar] [CrossRef]
- Tongzon, J.L. Determinants of port performance and efficiency. Transp. Res. A Policy Pract. 1995, 29, 245–252. [Google Scholar] [CrossRef]
- Clark, X.; Dollar, D.; Micco, A. Maritime Transport Costs and Port Efficiency; World Bank: Washington, DC, USA, 2002. [Google Scholar]
- Sánchez, R.J.; Hoffmann, J.; Micco, A.; Pizzolitto, G.V.; Sgut, M.; Wilmsmeier, G. Port Efficiency and International Trade: Port Efficiency as a Determinant of Maritime Transport Costs. Marit. Econ. Logist. 2003, 5, 199–218. [Google Scholar] [CrossRef]
- Martinez Budria, E.; Diaz Armas, R.; Navarro Ibanez, M.; Ravelo Mesa, T. A study of the efficiency of Spanish port authorities using data envelopment analysis. Int. J. Transp. Econ./Riv. Internazionale Econ. Trasp. 1999, 26, 237–253. [Google Scholar]
- Cullinane, K.; Song, D.W.; Gray, R. A stochastic frontier model of the efficiency of major container terminals in Asia: Assessing the influence of administrative and ownership structures. Transp. Res. A Policy Pract. 2002, 36, 743–762. [Google Scholar] [CrossRef]
- Song, D.W. Port co-opetition in concept and practice. Marit. Policy Manag. 2003, 30, 29–44. [Google Scholar] [CrossRef]
- Cui, H.; Notteboom, T. A game theoretical approach to the effects of port objective orientation and service differentiation on port authorities’ willingness to cooperate. Res. Transp. Bus. Manag. 2018, 26, 76–86. [Google Scholar] [CrossRef]
- Rødseth, K.L.; Holmen, R.B.; Kuosmanen, T.; Schøyen, H. Market access and seaport efficiency: The case of container handling in Norway. J. Ship. Trade 2023, 8, 8. [Google Scholar] [CrossRef]
- Li, J.; Ren, J.; Ma, X.; Xiao, G. Environmental efficiency of ports under the dual carbon goals: Taking China’s Bohai-rim ports as an example. Front. Mar. Sci. 2023, 10, 1129659. [Google Scholar] [CrossRef]
- Philipp, R.; Gerlitz, L.; Moldabekova, A. Small and Medium-Sized Seaports on the Digital Track: Tracing Digitalisation across the South Baltic Region by Innovative Auditing Procedures. In International Conference on Reliability and Statistics in Transportation and Communication; Kabashkin, I., Yatskiv, I., Prentkovskis, O., Eds.; Springer: Cham, Switzerland, 2020; pp. 351–362. [Google Scholar]
- Yau, K.L.A.; Peng, S.; Qadir, J.; Low, Y.C.; Ling, M.H. Towards smart port infrastructures: Enhancing port activities using information and communications technology. IEEE Access 2020, 8, 83387–83404. [Google Scholar] [CrossRef]
- Makkawan, K.; Muangpan, T. A conceptual model of smart port performance and smart port indicators in Thailand. J. Int. Logist. Trade 2021, 19, 133–146. [Google Scholar] [CrossRef]
- Othman, A.; El-gazzar, S.; Knez, M. A Framework for Adopting a Sustainable Smart Sea Port Index. Sustainability 2022, 14, 4551. [Google Scholar] [CrossRef]
- Al Fatlawi, H.A.; Motlak, H.J. Smart ports: Towards a high performance, increased productivity, and a better environment. Int. J. Electr. Comput. Eng. (IJECE) 2023, 13, 1472–1482. [Google Scholar] [CrossRef]
- Odeck, J.; Schøyen, H. Productivity and convergence in Norwegian container seaports: An SFA-based Malmquist productivity index approach. Transp. Res. A Policy Pract. 2020, 137, 222–239. [Google Scholar] [CrossRef]
- Liu, Z. The Comparative Performance of Public and Private Enterprises: The Case of British Ports. J. Transp. Econ. Policy 1995, 29, 263–274. [Google Scholar]
- Notteboom, T.; Coeck, C.; Van Den Broeck, J. Measuring and Explaining the Relative Efficiency of Container Terminals by Means of Bayesian Stochastic Frontier Models. Int. J. Marit. Econ. 2000, 2, 83–106. [Google Scholar] [CrossRef]
- Cullinane, K.; Song, D.W. A stochastic frontier model of the productive efficiency of Korean container terminals. Appl. Econ. 2003, 35, 251–267. [Google Scholar] [CrossRef]
- Barros, C.P.; Chen, Z.; Wanke, P. Efficiency in Chinese seaports: 2002–2012. Marit. Econ. Logist. 2016, 18, 295–316. [Google Scholar] [CrossRef]
- Cook, W.D.; Tone, K.; Zhu, J. Data envelopment analysis: Prior to choosing a model. Omega 2014, 44, 1–4. [Google Scholar] [CrossRef]
- Roll, Y.; Hayuth, Y. Port performance comparison applying data envelopment analysis (DEA). Marit. Policy Manag. 1993, 20, 153–161. [Google Scholar] [CrossRef]
- Tongzon, J. Efficiency measurement of selected Australian and other international ports using data envelopment analysis. Transp. Res. A Policy Pract. 2001, 35, 107–122. [Google Scholar] [CrossRef]
- Barros, C.P.; Athanassiou, M. Efficiency in European Seaports with DEA: Evidence from Greece and Portugal. Marit. Econ. Logist. 2004, 6, 122–140. [Google Scholar] [CrossRef]
- Ng, A.S.F.; Lee, C.X. Productivity analysis of container ports in Malaysia: A DEA approach. J. East Asia Soc. Transp. Stud. 2007, 7, 2940–2952. [Google Scholar] [CrossRef]
- Jiang, B.; Li, J. DEA-based Performance Measurement of Seaports in Northeast Asia: Radial and Non-radial Approach. Asian J. Shipp. Logist. 2009, 25, 219–236. [Google Scholar] [CrossRef]
- Wanke, P.F.; Barbastefano, R.G.; Hijjar, M.F. Determinants of efficiency at major Brazilian port terminals. Transp. Rev. 2011, 31, 653–677. [Google Scholar] [CrossRef]
- Güner, S. Incorporating value judgments into port efficiency measurement models: Insights from Turkish ports. Marit. Econ. Logist. 2018, 20, 569–586. [Google Scholar] [CrossRef]
- Quintano, C.; Mazzocchi, P.; Rocca, A. A competitive analysis of EU ports by fixing spatial and economic dimensions. J. Ship. Trade 2020, 5, 18. [Google Scholar] [CrossRef]
- Park, R.k.; De, P. An Alternative Approach to Efficiency Measurement of Seaports. Marit. Econ. Logist. 2004, 6, 53–69. [Google Scholar] [CrossRef]
- Park, R.K. A Study on the Extracting the Core Input and Output Variables in Korean Seaports by DEA and PCA Approach. J. Navig. Port Res. 2006, 30, 793–800. [Google Scholar] [CrossRef][Green Version]
- Park, B.K.; Choi, M.S.; Song, J.Y. A Study on the Efficiency Analysis of Container Terminal. In Korean Institute of Navigation and Port Research Conference; Korean Institute of Navigation and Port Research: Yeosu, Republic of Korea, 2006; pp. 163–170. [Google Scholar]
- Min, H.; Park, B.I. A hybrid Data Envelopment Analysis and simulation methodology for measuring capacity utilisation and throughput efficiency of container terminals. Int. J. Logist. Syst. Manag. 2008, 4, 650–672. [Google Scholar] [CrossRef]
- Park, H.G. The data envelopment analysis of container terminals to transshipment cargo. J. Korea Port Econ. Assoc. 2010, 26, 1–19. [Google Scholar]
- Chang, Y.T. Environmental efficiency of ports: A data envelopment analysis approach. In Ports and the Environment; Routledge: London, UK, 2017; pp. 77–88. [Google Scholar]
- Seo, J.H.; Gong, J.M.; Nam, T.H.; Yeo, G.T. Analyzing Efficiency of Korean Automobile Ports. J. Navig. Port Res. 2017, 41, 127–136. [Google Scholar] [CrossRef]
- Chen, M.; Lee, H.; Yun, K. A Study on Efficiency Evaluation of Yeosu? Gwangyang Port. Korea Logist. Soc. 2021, 29, 13–24. [Google Scholar]
- Charnes, A.; Cooper, W.W.; Rhodes, E. Measuring the efficiency of decision making units. Eur. J. Oper. Res. 1978, 2, 429–444. [Google Scholar] [CrossRef]
- Banker, R.D.; Charnes, A.; Cooper, W.W. Some Models for Estimating Technical and Scale Inefficiencies in Data Envelopment Analysis. Manag. Sci. 1984, 30, 1078–1092. [Google Scholar] [CrossRef]
- Maćkiewicz, A.; Ratajczak, W. Principal components analysis (PCA). Comput. Geosci. 1993, 19, 303–342. [Google Scholar] [CrossRef]
- Pasini, G. Principal component analysis for stock portfolio management. Int. J. Pure Appl. Math. 2017, 115, 153–167. [Google Scholar] [CrossRef]
- Patro, S.; Sahu, K.K. Normalization: A preprocessing stage. arXiv 2015, arXiv:1503.06462. [Google Scholar] [CrossRef]
- Thanassoulis, E. Introduction to the Theory and Application of Data Envelopment Analysis; Springer: New York, NY, USA, 2001. [Google Scholar]
- Kumar, N.; Singh, A. Efficiency analysis of banks using DEA: A review. Int. J. Adv. Res. Innov. 2014, 1, 120–126. [Google Scholar] [CrossRef]
- Caves, D.W.; Christensen, L.R.; Diewert, W.E. The Economic Theory of Index Numbers and the Measurement of Input, Output, and Productivity. Econometrica 1982, 50, 1393–1414. [Google Scholar] [CrossRef]
- Farrell, M.J. The Measurement of Productive Efficiency. J. R. Stat. Soc. Ser. A Gen. 1957, 120, 253–281. [Google Scholar] [CrossRef]
- Firsova, A.; Chernyshova, G. Efficiency Analysis of Regional Innovation Development Based on DEA Malmquist Index. Information 2020, 11, 294. [Google Scholar] [CrossRef]
- Liang, L.; Huang, W.; Huang, S.; Weng, D. Combining SPSSAU and WJX. CN Analysis to Study the Status Quo of Online and Offline Blended Teaching Model. In Proceedings of the 2nd International Conference on Internet, Education and Information Technology (IEIT 2022), Zhangjiajie, China, 15–17 April 2022; Atlantis Press: Amsterdam, The Netherlands, 2022; pp. 379–389. [Google Scholar]
- Shrestha, N. Factor analysis as a tool for survey analysis. Am. J. Appl. Math. Stat. 2021, 9, 4–11. [Google Scholar] [CrossRef]
- An, N.; Xie, J.; Zheng, X.; Gao, X. Application of PCA in concrete infrared thermography detection. In Proceedings of the 2015 2nd International Workshop on Materials Engineering and Computer Sciences, Jinan, China, 10–11 October 2015; Atlantis Press: Amsterdam, The Netherlands, 2015; pp. 809–814. [Google Scholar]
- Zhang, S.; Wei, J.; Zhong, C.; Yang, Y.; Wei, W. The comprehensive evaluation of Wuhan’s urban ecological transportation development based on PCA-DEA. Highw. Automot. Appl. 2018, 189, 22–27. [Google Scholar] [CrossRef]
- HMM Co., Ltd. Terminal Operations. Available online: https://www.hmm21.com/company/service/terminalMain.do (accessed on 6 June 2024).
- Valentine, V.F.; Gray, R. The measurement of port efficiency using data envelopment analysis. In Proceedings of the 9th World Conference on Transport Research, Seoul, Republic of Korea, 22–27 July 2001; Institute of Marine Studies, University of Plymouth: Plymouth, UK, 2001; p. 27. [Google Scholar]
- Duncombe, W.; Yinger, J. An analysis of returns to scale in public production, with an application to fire protection. J. Public Econ. 1993, 52, 49–72. [Google Scholar] [CrossRef]
- Fligstein, N.; Dauber, K. Structural change in corporate organization. Annu. Rev. Sociol. 1989, 15, 73–96. [Google Scholar] [CrossRef]
Disclaimer/Publisher’s Note: The statements, opinions and data contained in all publications are solely those of the individual author(s) and contributor(s) and not of MDPI and/or the editor(s). MDPI and/or the editor(s) disclaim responsibility for any injury to people or property resulting from any ideas, methods, instructions or products referred to in the content. |
© 2024 by the authors. Licensee MDPI, Basel, Switzerland. This article is an open access article distributed under the terms and conditions of the Creative Commons Attribution (CC BY) license (https://creativecommons.org/licenses/by/4.0/).