Review

Carbon Footprint of Greenhouse Production in EU—How Close Are We to Green Deal Goals?

by
Maria Ravani
1,2,
Konstantinos Georgiou
3,
Stefania Tselempi
2,
Nikolaos Monokrousos
2,* and
Georgios K. Ntinas
1,*
1
Institute of Plant Breeding and Genetic Resources, Hellenic Agricultural Organization DIMITRA (ELGO-Dimitra), Thermi, 57001 Thessaloniki, Greece
2
University Center of International Programmes of Studies, International Hellenic University, 57001 Thessaloniki, Greece
3
School of Informatics, Aristotle University of Thessaloniki, 54124 Thessaloniki, Greece
*
Authors to whom correspondence should be addressed.
Sustainability 2024, 16(1), 191; https://doi.org/10.3390/su16010191
Submission received: 24 November 2023 / Revised: 13 December 2023 / Accepted: 20 December 2023 / Published: 25 December 2023

Abstract

:
Sustainable greenhouse production has been brought to the forefront as one of the pillars in achieving the objectives set by the Green Deal strategy in 2020, for drastically decreasing net emissions from agriculture. The scope of this review was to capture the current situation regarding the sustainability of greenhouse production in the European Union and to present ways to decrease the carbon footprint. For this reason, a systematic search of studies was conducted, focusing on the investigation of the environmental assessment of conventional greenhouses in EU along with a bibliometric analysis to identify the relationships between the studies. In total, 52 papers were selected for an in-depth analysis that led to addressing the posed research questions. The study reveals that Spain and Italy were the most active countries in the literature for the calculation of the carbon footprint in greenhouses, the value of which showed a large variation per crop and per country and was significantly affected by the use of non-renewable energy sources. It was observed that practical solutions to reduce the carbon footprint of greenhouses have already been implemented and proposed, which indicates a positive inclination towards achieving the Green Deal objectives.

1. Introduction

The continuous increase in the Earth’s population, as well as the intensification of every aspect of human activity, has led to a series of effects on the environment. Global warming (GW), increased greenhouse gas (GHG) emissions, depletion of mineral resources, and land degradation are all interrelated problems under the guise of climate change (CC) [1]. Also, pollution and deterioration are occurring in forests and oceans and out of the eight million species on the planet, one million are in danger of extinction [2]. In the European Union (EU), as early as 1990, actions began to be proposed, along with mobilization aimed at mitigating the effects of human activities on the environment [3]. Indicatively, the CC strategy for reducing the global temperature was established, later with the Kyoto Protocol [4] and the Emissions Trading Systems (ETS) [5], the 20-20-20 targets [6], and the Paris Climate Agreement [7]. Efforts to curb CC culminated in December 2019 with the presentation of the Green Deal by the European Commission [8].
The European Green Deal (EGD) strategy was developed in response to the escalating environmental issues and the growing public and institutional awareness of this phenomenon, which has given renewed impetus to EU-level CC policy and action [9,10]. The EGD is a set of policy initiatives that attempts to support and motivate sustainable production and put the EU on a green transitional path, with its final objective of achieving carbon neutrality by 2050 [11], while developing a competitive economy and technological development. EGD also impacts the relationships of EU with its partners from the European Neighborhood Policy (ENP) and will promote significant changes in neighborhood policies [12]. It will also be consistent with new investment opportunities, for green development in partner countries in all sectors of the economy (agriculture, infrastructures, market trade, etc.) [13]. The other key goals that have been established and make up the three main pillars of the agreement are the reduction in net GHG emissions by 55% by 2030, compared to 1992 emissions levels (Fit to 55 strategy), and the plantation of 3 billion additional trees in the EU, which will further contribute to the protection and enhancement of biodiversity.
A significant share of global GHG emissions and the burden on the environment is occupied by the agricultural sector in EU, which accounted for 380.5 Mt CO2 eq in 2023. However, the amount of these emissions was slightly reduced compared to 2005 [14]. If additional targets and cultivation methods are adopted, the reduction in emissions for some countries will reach up to 50%, based on the Effort Sharing Regulation [15]. The adoption of innovative practices to reduce GHG emissions, the use of renewable energy sources (RES), adopting green energy policies [16], creating sustainable products, the construction of eco-friendly buildings like greenhouses (GHs), reduction in pollution processes from the agricultural production, reduction in pesticides use, and the use of environmentally friendly transportation methods are indicative practices for reducing the agricultural sector’s environmental impacts.
Different GH production systems have been studied in terms of inputs consumption [17,18], as GHs are one of the most intensive forms of cultivation, due to the high consumption of resources to cover energy needs, the use of fertilizers or the use of considerable amounts of construction materials [19]. In high-tech GHs, higher yield and year-round production can be achieved through better water- and nutrient-use efficiency and by utilizing less land area for production. High quantities of products with high added value can be observed in areas with degraded soil, or in areas where, under different circumstances, it would not be possible to grow agricultural products throughout the year. They can be characterized as systems with lower environmental impacts than open field, by implementing specific production methods [20]. The areas with protected cultivation in Europe occupy more than 175,000 ha [21], while Spain occupies 54,000 ha from which 32,048 ha are located in the Almeria region [22], and Italy occupies 33,000 ha [23], with them being the largest GH producers, while also Spain, Italy, and France are the largest cultivators of organic GH farming, with 2000 ha, 2000 ha, and 600 ha, respectively [21].
It is clear that with GH production gaining so much traction, it is important to quantify the environmental impact of the used practices, especially in EU countries, which have to meet EGD goals. The most widely accepted method for this purpose is life cycle assessment (LCA), which has been applied in numerous cases in recent years [24]. By using LCA, the effects of the production systems are presented by means of a multitude of environmental indicators, such as the carbon footprint (CF) [25]. CF is a measurement of the total amount of CO2 equivalents released to the environment during the life cycle of a product or activity [26] and is one of the most robust indicators used to assess the environmental impact of production systems. To the best of our knowledge, thus far there has not been a holistic approach to all GH production systems in EU countries, calculating CF or highlights area-specific methods for reducing CF.
The purpose of this review was to study the literature regarding the calculation of the CF of products from GHs, in the EU countries, to record the values of CF and to present ways of reducing its value in these systems. In addition, the goal was to capture whether RES or alternative materials are used as inputs in these systems and to what extent the values of the examined indexes are affected by their use or non-use. Within the framework of this paper, a bibliometric analysis was also conducted, in order to present the relationships between the studies selected for this review and highlight research trends. All of the above were examined under the prism of the regulations and the principles of the EGD and an attempt was made to assess, based on the actual data, the extent to which the goals that have been established until 2050 are being met. Finally, a summary of all findings was provided, to present the suggestions made from the studies on ways to reduce GHG emissions from GH agricultural production and maintain sustainability, that can be applied by farmers and researchers in the EU.

2. Systematic Review Methodology

For the present study, a systematic review was performed combined with a bibliometric analysis in order to create groups based on the commonality of goals and emphasis given from each study [27]. While the systematic study allows us to present the current developments while focusing on qualitative aspects relevant to the review at hand (e.g., plant species, hotspots) [28], the accompanying bibliometric analysis enables a more abstract view of the research landscape and the portrayal of influential publication venues, thematic axes of the published work, and collaborations between countries.
In contrast to other types of reviews, such as critical reviews, overviews (not systematic), and literature reviews, systematic reviews contain comprehensive and exhaustive searching of studies and synthesis of the results, so that their analysis leads to the improvement of the existing situation, through the finding and presentation of proposals and methods where this is required, but also the drafting of proposals for future research in the field [28]. Moreover, bibliometric studies involve the accumulation of bibliometric information (e.g., publication venue, author affiliations, number of citations) and the use of statistical methodologies to profile the research landscape.

2.1. Research Question

The following research questions (RQ) were formulated considering EGD, to provide comprehensive results and draw conclusions about the state of CF production in EU countries: RQ1. What is the research landscape of carbon footprint analysis in the European Union countries, based on bibliometric indicators? RQ2. What is the value of the carbon footprint indicator of greenhouse crops in European Union countries? RQ3. Are renewable energy sources being exploited in European Union greenhouses and how does this affect carbon footprint values? RQ4. Based on current data, is it possible for greenhouse production to meet the Green Deal’s directive Fit for 55 to reduce the European Union’s greenhouse gas emissions by 55% by 2030, and in what ways?

2.2. Eligibility Criteria

Certain criteria had to be met for a study to be considered suitable for thorough investigation and be included in the final list of studies chosen for this review. For the final list of works, only peer-reviewed studies were considered, which conducted an environmental study with real data (not simulation or models) from vegetable and ornamental production in conventional GHs exclusively in EU countries. The studies had to clearly present the value of the CF, which would result from conducting an LCA. In cases where the absolute value of the CF may not have been stated, but expressed as a percentage, the quality of the work and its potential contribution to the work were assessed on a case-by-case basis and included in the final selection or rejected as insufficient.

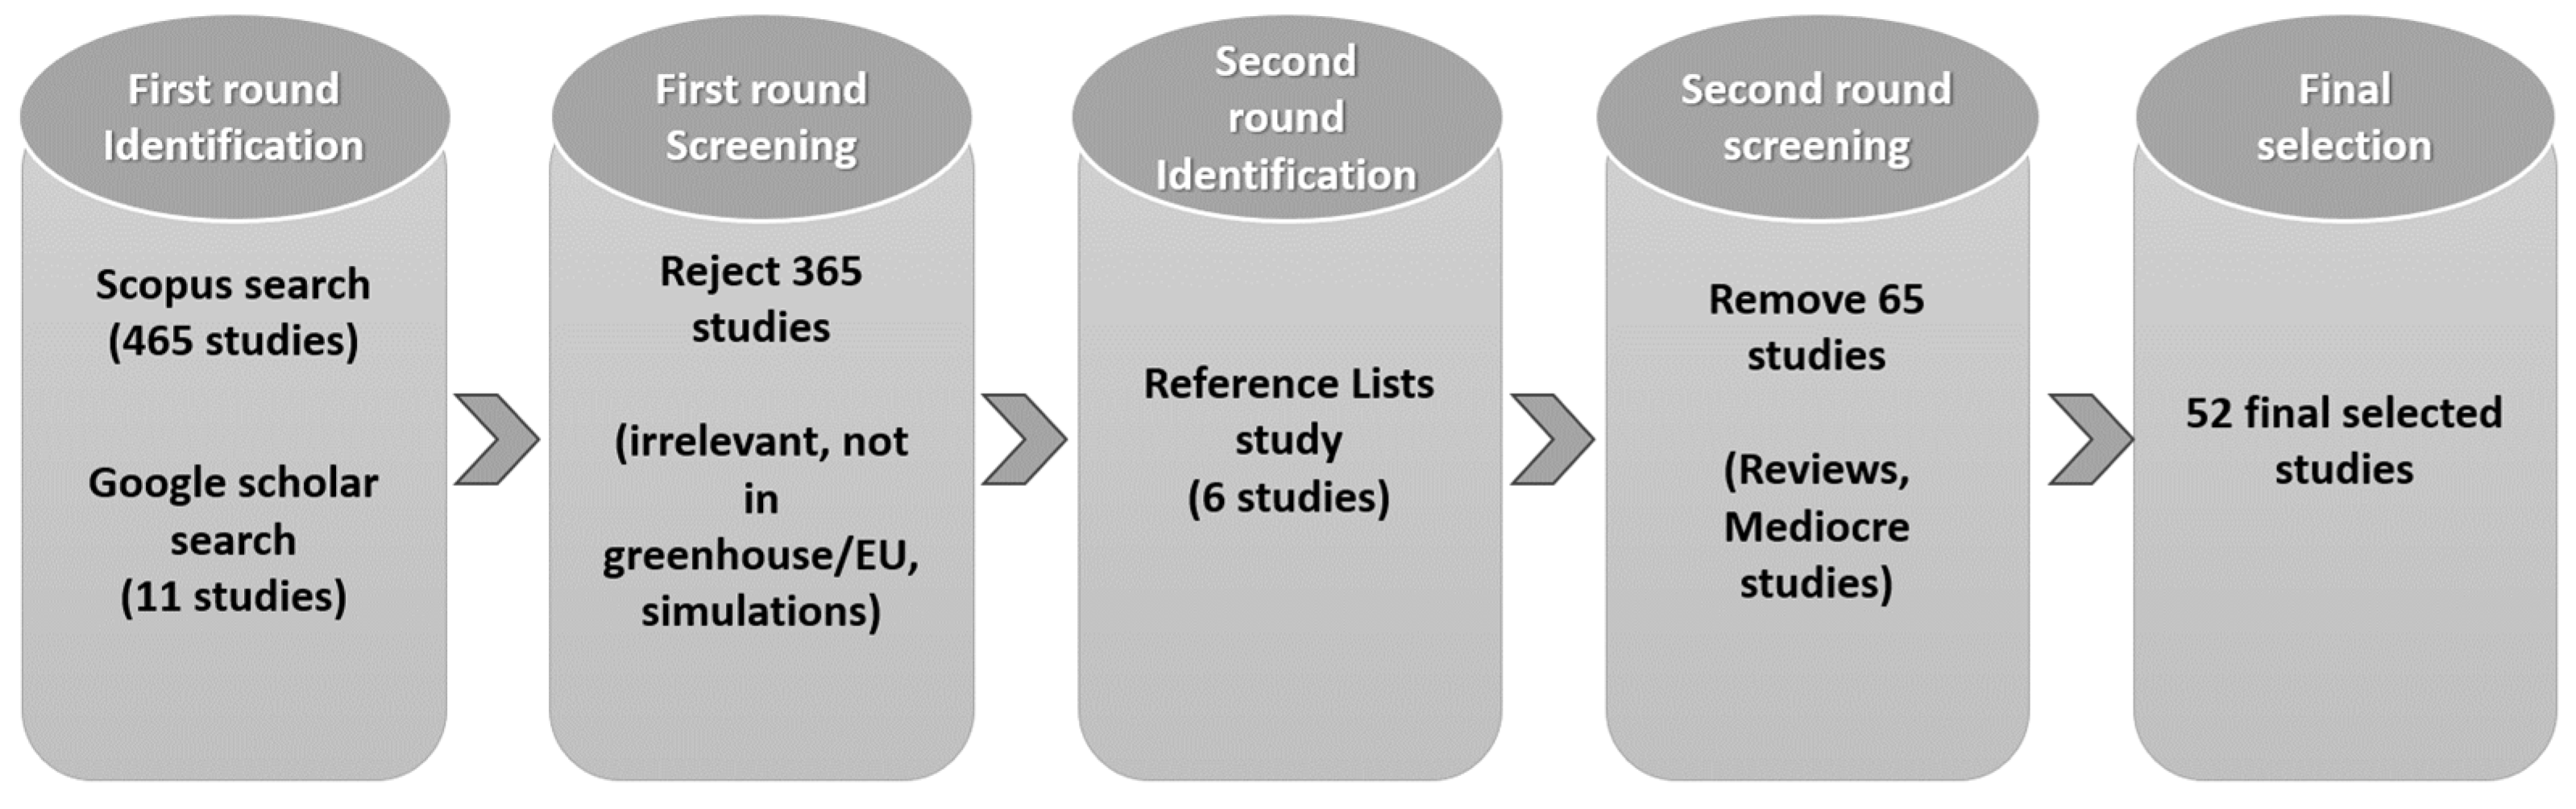
2.3. Search Strategy

To select the papers for this review, the steps shown in Figure 1 were followed. The main search for relevant papers was carried out in Scopus and the initial search was performed in 17 March 2023, while the final search string used was formed on 5 April 2023 and yielded 465 studies. The terms that have been used were “carbon footprint”, “LCA”, “Life Cycle Assessment”, “greenhouse production”, “greenhouse cultivation”, and “greenhouse”, while there was also a more detailed application of filters to collect only works that constituted articles, conference papers, scientific reports, and reviews in English. In addition, papers were searched manually in Google Scholar to check if important papers were missing from the main search, which resulted in 11 more studies being added to the initial studies list. It was decided not to apply a chronological criterion in the search for papers, in order to study the method and frequency with which environmental studies were conducted in earlier years and how the interest in the issue evolved over the years.
Out of the 465 results from the Scopus search, 365 studies were removed, as they did not meet the criteria to be included in the present review. They were considered irrelevant to the chosen topic, or they were referring to the cultivation of crops in non-conventional GHs (net-houses, non-robust structures), or in open field. Moreover, they contained experiments and analyses in non-EU countries, they performed simulations without actual data, or did not present clear values of CF and environmental impact from the studied systems. Before rejecting these papers, their bibliographic references were studied, with the aim of finding additional suitable papers; hence, six more papers were included in the study. For the final selection, out of the 117 studies (100 from Scopus, 11 from Google Scholar, and 6 from reference lists of rejected studies), 52 papers were chosen, as the remaining 65 studies constituted review papers or papers with some contribution to the purposes of this review, but not eligible for the final selection. Thus, the final selection of papers involved 52 studies on the CF of GH production in the EU.

2.4. Description of the Selected Studies

After the final selection of the 52 studies, a table was created in a Microsoft Excel spreadsheet, where data from each study were inserted, regarding the information with significant interest for the extraction of the final results. Therefore, the categories formed were related to both cultivation techniques and details about CF calculation. Thus, the categories included the year of publication, the country where the GH is located, the type of study (commercial or experimental) the cultivated species, the cultivation period, the GH area, and the total yield per growing season. In addition, the categories included the CF calculation protocol followed, the databases from which additional data were extracted for each study, the software used for the calculations, the functional unit (FU), the system boundaries, the method of calculating environmental impacts, the specific impact categories studied, and the value of the CF, as well as the hotspots of the production process.

2.5. Bibliometric Analysis

To conduct the bibliometric analysis, the digital object identifiers (DOIs) of the final studies were leveraged. More specifically, the extracted DOIs were inserted in the Scopus database, to retrieve bibliometric information. The goals of the bibliometric analysis were to (i) present basic descriptive information regarding the collected studies, (ii) inspect the research landscape on a country-wise level to portray country collaborations, and (iii) extract thematic axes from the collected studies that capture the research directions in GH CF. It should be noted that, during the study extraction based on the DOIs, two studies that were not indexed in Scopus were excluded from the analysis. This constitutes a minor limitation that nevertheless does not hinder the quality of the bibliometric insights.
In Table 1, the goals of the bibliometric analysis, along with the statistic methodologies used to achieve them, as well as the leveraged metadata for each goal, are presented. To conduct the bibliometric analysis, the Biblioshiny framework [29] of the bibliometrix library [30] was used for the first and second goals, while the third goal was achieved by using both Biblioshiny and VosViewer [31].
Regarding the first goal, descriptive statistics were employed to capture the number of documents per year, some primary information about the collected studies (e.g., the document types, the total number of citations, etc.), and the most popular publication venues. These indicators can portray, in a descriptive manner, the research activity on GH CF and track the evolution of the domain. For the second goal, the countries of the authors were used, along with the document citations to profile the country-wise analysis of studies. More specifically, the scientific production of each country, i.e., the total number of document authors that originate from a country, was profiled both in a geographical manner as well as annually, for the most productive countries. In addition, the document citations were taken into account, along with the author countries to portray the countries that attract the interest of other researchers and develop innovative methods of GH CF calculation. Finally, the collaboration between countries was portrayed using network analysis.
Regarding the third goal, and the extraction of thematic insights, the selected approach was twofold. Using VosViewer, a co-occurrence network was constructed, relying on the co-occurrence of the author keywords and keywords plus in the documents. The construction of a network relies on the association strength between pairs of words, considering the common occurrences of the words and the occurrences of each word separately.
In addition, for the thematic clusters, the methodology introduced by Callon et al. [32] was used, which first computes a co-occurrence network between the author keywords of the collected studies. Then, a community detection algorithm (assigned by the researcher that conducts the analysis) finds communities of interconnected terms. These communities are comprised of keywords and may be connected to each other through shared words. The final step of the algorithm calculates two metrics, namely the Callon Centrality and the Callon Density. The Callon Centrality assesses the association strength of a community with all other communities, i.e., the number of links that the keywords within a community have with keywords from other communities. Conversely, the Callon Density assesses the strength of connections with a community itself, usually calculated by the mean value of internal links [32]. The goal of this methodology is to produce thematic clusters, which comprise interconnected keywords, distributing them into a two-dimensional space and assessing their innovation [32,33,34].

3. Study Insights and Discussion

The results regarding the basic descriptive statistics of the individual characteristics of the works, as well as the results of the bibliometric analysis, are presented in this section. The extracted data regarding the CF calculation process, along with information about the general characteristics of the selected studies (country, year, plant species) are presented in Table A1 and Table A2 in Appendix A.

3.1. General Description of the Studies

3.1.1. Countries and Year

The main countries where the examined studies were carried out were Italy (16 studies, 31%), Spain (16 studies, 31%), Germany (six studies, 12%), The Netherlands (five studies, 10%), and Greece (four studies, 8%). However, in some cases the experiments and analyses were carried out in two countries at the same study, which facilitates the comparison of data between different countries with different environmental conditions [20,35,36,37]. No chronological criterion was applied to the search strategy, so the selected papers were published from 2005 to 2023. Most papers were published after 2017 (26 papers) in a five-year period, while from 2005 to 2017, 26 papers were also published, but in a 12-year period. In both Spain and Italy, the rate of publication of papers per year seems relatively stable, with an average of two papers published per year. The ever-increasing interest in sustainable production, as well as the popularity of the LCA method for calculating the environmental impact of agricultural systems, has contributed to both the scientific community implementing alternative methods for reducing the impact [38,39] and producers monitoring and reducing the impact of their existing systems [40,41]. From the list of works under study, in 30 of them commercial production systems with actual data from the field were analyzed, while the other 22 concerned experimental studies in universities or other research institutes.

3.1.2. Plant Species—Cultivation Period—Yield

Out of the 52 studies selected, 28 (52% of the total papers), are related to the calculation of the environmental impact of the tomato crop, which was cultivated in Spain in 13 of the 28 works (46%). In addition, 15 papers deal with ornamental plants (29%), which were mainly cultivated in Italy (9 out of 15 papers, 60%) and 4 papers with lettuce (8%), while in the rest of the papers other leafy vegetables or fruiting vegetables in GHs are studied, such as peppers, cucumber, and grapevine. Since there was no specific search criterion of papers based on cultivated species, as the review covered the whole range of plants grown in greenhouses in EU countries, the systematic search of the scientific databases resulted in more papers on tomato cultivation, as it is quite a widespread species in countries under study. It is also noted that tomato was widely cultivated in Spain and ornamental plants in Italy, which is influenced by multiple factors, such as climatic conditions and geographical and economic parameters. Spain, and the specific area of Almeria, has wide access to groundwater and sunlight, which provide favorable conditions for tomato, while in Italy ornamental plants play a crucial role in enhancing the country’s national economy [42,43].
Tomato is one of the main vegetable species cultivated in GHs on a large scale in the EU, with 18,099 Mt of tomatoes produced in 2021 [44]. In addition to being a fairly widespread ingredient in the human diet, tomato also has high requirements in its cultivation stage and processing. This leads into a high consumption of inputs such as electricity and fossil fuels for heating and cooling in order to produce higher yields [45], and by extension a significant burden on the environment, which justifies the high proportion of papers studying the CF of the crop in GHs.
The cultivation period of the crops varies according to the plant species, the country of production and the type of study (experimental or commercial). In particular, lettuce, which has a much shorter biological cycle than tomato, was cultivated for about a month or a maximum of two months [46] in the works under study and there were multiple cycles of cultivation during a year [46,47]. Tomato was cultivated from six months (10 studies) to one year (12 studies), without any clear correlation between country and cultivation period. There were two crop cycles of almost six months but also one crop cycle over the course of a year both in warmer countries such as Spain and Italy [48,49,50,51], and in northern countries with colder climate conditions such as Germany and The Netherlands [20,52].
Regarding the observed yield, the comparison of product amounts in GHs from different studies could not be carried out, as the countries where the study is conducted or the cultivation season are different. Even in the same countries, it would not be possible to compare the yield between different papers due to other inhibiting factors, such as the conditions of conducting the experiments (different climatic conditions inside the GH, different substrates, etc.). However, in several cases the studies involved testing different cultivation techniques in the same work, which facilitated the comparison of results, both in terms of yield and CF value. More specifically, yield may differ between organic and conventional production systems, where in conventional systems higher yields are observed than in organic cultivation production systems. In the selected studies, it was measured that in organic GH production, tomato yield was 15 kg/m2 per year (for two cultivation seasons), while the corresponding value in conventional GH systems was 17.4 kg/m2 [40]. The season in which crops are grown, may play a crucial role in yield, as it was shown that the winter cultivation of aeroponic lettuce resulted in 120 kg, while in the autumn–winter period, the yield was measured at 279.3 kg [47]. In another work where tomato was grown in different production scenarios in Germany, in a GH with F-clean cover materials and energy-saving screens, yield was measured at 17.9 kg/m2. In the corresponding GH equipped with a double PE covering, the yield was 12.1 kg/m2 which led to the conclusion that high-tech greenhouses with more robust and durable structures may lead in higher productivity [20].
The type of cultivation system (hydroponic/soil) seems to comprise a crucial factor in crop yield. It was found that in soilless cultivation systems, roses resulted in a double yield (100–110 stems/year) to that in soil cultivation (40–50 stems/year), when the GH is heated in winter [41]. Similar results were presented between a soil cultivation system and a hydroponic system of lettuce cultivation in a GH, where yield was measured at 29.05 kg/m2 in soil and 53.2 kg/m2 in hydroponics [53]. In a solar collector GH where tomato was cultivated under a semi-closed climate control system and high CO2 concentrations, yield was increased by 22% in comparison to the tomato cultivation in a conventional GH [45]. Finally, the significant impact of heating in the product’s yield is clearly shown in a study of tomato cultivation in Spain, where in heated conditions the yield was 153 t/ha, while in unheated conditions the yield was calculated to be 93 t/ha [42]. The correlation between increased yield and heating is also shown in a study of tomato cultivation, where yield was calculated at 57 kg/m2 per year in heated conditions and 11 kg/m2 per year in unheated conditions [54].

3.1.3. Protocols

For the calculation of CF in all studies, the LCA of the production processes was used. The protocols followed by the authors of the papers were mainly the ISO standards. The first standard describing the LCA methodology was the ISO 14040 standard [25], published in 2006–2007. In studies after 2018 and in cases where detailed reference was made to the product carbon footprint (PCF), the ISO 14067 standard was also used. In studies prior to the publication of the 14040 and 14044 standards, the 14043 standard [55] was also leveraged, which was revised by 14040 and 14044, while it was also observed that the standards 14047/48/49 have been used which include explanations or illustrative examples in LCA applications [51]. ISO 14040 is the main and most general standard and studies the principles that must be drawn up for any ecological assessment of products or processes [25]. In contrast, ISO 14044 is more specific and detailed in that it describes the specific steps to be followed for assessment against the ISO 14040 [56]. The aim of the ISO 14067 standard is to help and point the way towards a more environmentally friendly direction to reduce the greenhouse gases that come from the production, transport, and consumption of the products [57].
ISO standards were used in 42 of the 52 selected papers (81% of total papers). Other standards and accepted methodologies that were followed to a lesser extent for the calculation of the environmental impact of the examined systems were the PAS 2050-1, DNCF2009 [52], the International Life Cycle Data System (ILCD), IPCC guidelines, and SPI tool. The PAS 2050 standard is a guide for estimating GHG emissions released during the production process of goods [58]. However, this specific guide, as stated in its instructions, does not include guidelines for communicating the results of the study to the public, which is the reason that methodologies from the ISO standards need to be included in the study, as it was observed to be the case for the examined papers that used the PAS template [59,60,61,62]. In the study of Vermeulen and van der Lans the “Carbon footprinting of horticulture products protocol” (DNCF2009) is used, which was developed by the Dutch horticultural sector and is in line with the PAS 2050 guidelines [52]. The ILCD has been recorded in handbooks containing all the important guidelines for LCA based on ISO 14040/44 protocols, for individual practitioners, to maintain consistency in the extracted results when conducting LCA [63]. The Intergovernmental Panel on Climate Change (IPCC) has released detailed methodologies on calculating CF in all agricultural production sectors [64], which were used in some studies of the present review [42,53,54]. Finally, the SPI tool which was also used as a method for estimating CF [65], is another similar approach for calculating the ecological footprint of a product or service by considering all material flows between the production system and the environment [66].

3.1.4. Databases

In the selected studies, in order to collect secondary data that were difficult to assess from the producers during interviews or were unknown to the researchers conducting the experiment, and also to perform the LCA for the calculation of CF based on actual data, specific databases were used. These databases were either embedded in the specific LCA software that was implemented for the purpose of the analysis or were used directly to provide factors for converting materials into GHG equivalent units. Typically, they are life cycle inventories (LCI) databases that play a crucial role in covering a wide list of materials and the whole cycle of products when conducting LCA. Databases used for inventory analyses are either open access (e.g., open LCA, ProBas) or available after paid subscription (e.g., Ecoinvent, GaBi).
In the majority of the selected studies, the databases that were mainly used were the Ecoinvent and GaBi databases. In total, 33 out of the 52 studies used Ecoinvent (64% of the studies), 7 studies used GaBi (13%), and 4 studies used the ProBas database (8%). The different versions of these databases are due to the different years that each study was published, which promoted researchers to use the version that was available at that period. Other databases that were utilized by the researchers were the iTec database, Agri-footprint, and LCAfoods. Regarding the main databases used, they seem to be the most prevalent among the scientific community for providing a wide range of datasets and information on multiple sectors, such as industrial and agricultural. Data are up-to-date and adapted for each geographic location, in order to achieve high transparency [67]. GaBi databases have been created to be a part of the GaBi software for LCA conduction. Similarly to Ecoinvent, the Gabi database included all data that are crucial for completing the inventory analysis [68].

3.1.5. Software

LCA software tools assist the research community in conducting life-cycle analyses with high accuracy and correctness. These software tools have integrated multiple databases with the aforementioned datasets and operate based on unique techniques and methods. Their operating principles are based on the insertion of data by the user about the manufacturing processes of the studied product and their ability to detect environmental burdens. Among the several LCA tools, some are free and publicly available (e.g., OpenLCA, SPIonWeb), and others must be purchased to be used. Differences between the existing tools have been observed in studies, which are related to the various datasets, impact assessment methods, and characterization factors [69] and may lead to different LCA results which increases the uncertainty of the extracted data [70].
In the selected papers, the authors either used a specific LCA software, or did not mention one, so in these cases they used equations for manual calculations of the CF. The most common tools were GaBi and the SimaPro software. Other software that were used in the selected studies were OpenLCA software (two studies), SPIonWeb Version 1.1. (one study), eFoodPrint ENV (one study), TEAM software (one study), and Umberto NXT CO2 (one study). In total, 24 of the studies mentioned SimaPro for the calculation process (46%), while 11 of them used the GaBi software (21%). This finding is also in line with the literature, where these two tools are the primary options for conducting LCA [71], while they have also been studied in combination, in order to investigate the degree of differentiation of the results for the same study. It has been found that for the exact same dataset, up to a 20% difference in values of environmental indicators was observed between SimaPro and GaBi software [70]. In order to avoid great discrepancies between the results, it is suggested that the efforts of the developers be directed to the provision of reliable tools and the conducting of comparison checks between the different software [70] or the use of the latest versions of each software, the application of a cross check of the extracted results through a third party, and the conduction of the analysis with large samples [71].

3.1.6. Functional Unit (FU)

When conducting an LCA, the choice of the most appropriate FU is fundamental for presenting the results and enabling comparison with other studies and experiments [72]. FU is a reference unit for the quantification of the production system’s performance and serves the role of connecting inputs and outputs [25,73]. Among the selected papers, the most common unit was the product mass which, depending on the quantity of production, was set to one ton (1 t) or one kilogram (1 kg) of vegetable. Conversely, depending on the type of crop (vegetable/floral species) the FU was either the product mass or flower pots and number of stems. Moreover, when examining the environmental ramifications per land area unit, the FU was set to 1 square meter (m2). Mass was used as the FU in 40 studies (77%), 1 flower pot in 8 studies (15%), 1 m2 in 6 studies, and the number of stems also in 6 studies (12% each). Six studies chose to use more than one FU for better interpretation of their results and to ease the comparison with other works. In these cases, the mass as the FU was presented along with area as the FU [20,45,74], and the area or number of stems with the number of pots [41,75], while days of flowering was also a choice as the FU along with one piece of product [76].
The selection of FU should be governed by a dynamic approach and not in a static framework as it may result in mishandling the constantly evolving product functionality [77]. In fact, different options of FU have effects in the perception of the environmental effects of the system [78]. Therefore, depending on the purpose of the study, different FUs can be selected. Common FUs are the mass and volume that are more suitable in production systems whose environmental effects are studied, while if the purpose of the research is to highlight the quality characteristics of food in the specific production systems, more suitable FUs are the nutrient or energy content of the food products [72]. This confirms the validity of the selected FUs in the examined works, where in most of them an FU of mass was chosen to express the results regarding the environmental burden of the systems.

3.1.7. System Boundaries

One of the main steps in the LCA methodology is the definition of the studied system boundaries in order to present the production process flow. Based on the stages included in the study, there are several types of system boundaries, such as cradle-to-gate, cradle-to-grave, or gate-to gate. In cradle-to-gate assessments, a part of the product life cycle is taken into account, with specific stages of the production process, which are from raw materials extraction until the product leaves the factory gate. In cradle-to-grave systems, all production stages are analyzed, from the production of raw materials to the use of products and their disposal or recycling [79]. When the boundaries are limited only from the time that raw materials enter the studied system until the final product is ready to be transported, then assessments are identified as gate-to-gate. In the studied papers, in cases where the final gate is defined, it is added clearly in the system boundaries (cradle-to-farm-gate).
It is shown that the stages that are chosen based on exclusion or inclusion criteria may not be representative to fulfill the goal of LCA, which is to capture the environmental impacts of production systems. Often, the choice of system boundaries is at the discretion of the researcher and may be based on personal experiences rather than scientific data [80,81]. In fact, it is possible that the stages that have been excluded from the selected boundaries contribute to the assessment of the burden on the environment just as much as the selected production stages [81].
This fact has been proven in practice, since when inputs that are often omitted in other works (machinery, use of pesticides, infrastructure, etc.) were included within the study boundaries, a significant increase in the CF was observed, while by excluding them from the system boundaries, the value of the indicator decreased by more than 45% [82]. Similar findings were also observed in the works selected for the review, where depending on the boundaries chosen, the result of the CF was different. In particular, in works that chose multiple system boundaries to present results, the CF was relatively higher when considering the entire product life cycle (cradle-to-grave) than when choosing a part of it (cradle-to-farm-gate). A reasonable conclusion is that cradle-to-grave analyses lead to more accurate overall results for the system; otherwise, some stages such as the consumer effect in environmental impact might be significantly underestimated [60].
For example, in GH tomato cultivation, when the cradle-to-farm gate approach was applied, the value of the CF was 0.216 kg CO2 eq per kg of tomato, while in the cradle-to-consumer approach it was calculated at 0.78 kg CO2 eq per kg of tomato [48]. Also, in another work of tomato cultivation in a heated and unheated GH, when the boundaries chosen were cradle-to-farm gate, the CF was estimated at 1.33 and 0.39 kg CO2 eq/kg of tomatoes, respectively, and in the cradle-to-regional distributional center approach the values were 2.07 and 1.13 kg CO2 eq/kg of tomatoes, respectively [42].

3.1.8. Impact Assessment Method

The next step in LCA, after the definition of goal and scope and the completion of inventory analysis, is the impact assessment of the studied system. When a specified LCA software is implemented for the analysis, impact assessment methods are embedded in the software. Then, it is the responsibility of the user to select the most appropriate approach based on the system under consideration and the environmental impact categories that need to be calculated and reported. In cases where a software is not available for the researcher, as already mentioned, a complete and analytical method based on equations proposed by the IPCC is applied to calculate GHG emissions released from the production systems [64]. Different impact assessment methods may lead to variability in the results and the absolute values of the impact categories, which increases the uncertainty in LCA [83]. Some methods may not have significant differences among them and can provide similar results [84]. However, it is critical to recognize that there are likely to be uncertainties between alternative methods, especially when the outcomes may affect many levels of decision-making [85]. One of the most used impact assessment methods seems to be CML [85,86], which is also confirmed by this review, where this method was used in 21 studies to present the LCA results.
In the reviewed studies, the selected methods were CML, ReCiPe, and IPCC. In 21 papers, different versions of CML were utilized (40% of the selected studies), in 8 studies the ReCiPe method was used (15% of the studies) while in 20 papers the methodology proposed by the IPCC for the calculation of CF was implemented (38% of the studies). In the rest of the studies, the particular method that was used for impact assessment was not specified, so they were categorized as studies with non-defined methods. As the main focus of the search strategy was the discovery of studies with calculated CF, it was expected that a high amount of studies that used IPCC method that is specified in CF calculation would be found. However, as CF is an indicator for the implications of CC in production systems, it can be assessed in the context of a wider environmental study with other environmental indicators by utilizing methods such as CML and ReCiPe. For this reason, the substantial number of works in which these methods were used can be explained.

3.1.9. Impact Categories

In all the selected works, the CF was calculated in kg (or g) CO2 eq per FU, which appeared in the studies with multiple terms such as “climate change”, “carbon footprint”, “Global Warming Potential” (GWP), and GHG emissions. When CF was calculated for a 100-year horizon, it was presented as GWP100. Although LCA was performed in all studies, CF was exclusively presented, with no other indicator, in 16 papers. In six studies, CF was presented along with one or two more indicators, which were cumulative energy demand (CED) or water footprint (WF). In the rest of the studies, a wide range of LCA environmental indicators were presented, including indicators such as abiotic depletion (AD), acidification (AC), eutrophication (ET), human toxicity (HT), land use (LU), and ozone layer depletion (OLD). CF itself is indeed a useful indicator of the environmental burdens of production systems but only represents a part of them.
The above indicators belong to both categories of environmental impact indicators, which are the midpoint and endpoint category. Midpoint indicators are related to the direct effects of the system in specific sectors and are closer to the source of the effects [87]. In more detail, they constitute the quantification of the effects of production systems on air, water, and soil. On the other hand, endpoint impact categories provide a holistic view of the consequences of production systems in areas such as human health (HH), biodiversity, and ecosystems. The level of the details provided is higher in midpoint indicators, as they are more robust and contribute to providing knowledge on the degree of the effects of environmental burdens at the endpoint level, generating less uncertainty when modelling the full cause–effect chain [88]. Typical midpoint indicators are GWP, AC, and OLD, while endpoint indicators are HT or resource depletion (fossil fuel or metals). In the papers under study that presented the full range of LCA indicators, both categories of indicators were calculated, with some papers referring only to midpoint-level indicators and others to both categories.

3.1.10. Carbon Footprint Values

As expected, the CF values of the selected works showed a large variation, due to the different countries where the studies were conducted, the different climatic conditions that affected the energy consumption for heating/cooling, the different experimental designs, the FU selection, the different plant species, and the types of inputs used. Of course, it is not possible to make a comparison between the CF values of the EU countries, as this would lead to unreliable and unsafe conclusions. Even within the borders of a country, the comparison between the same crops in different studies should be made with great caution, by looking for important common parameters of the cultivation process. The safest comparison can be made when different cultivation methods are presented in the same work in order to identify the most sustainable production system.
From a comparison of production systems in two different countries conducted in the same work, it emerged that the CF of the processed tomato was 2.6987 kg CO2 eq per kg of processed tomatoes in France and 3.0635 kg CO2 eq per kg of processed tomatoes in France from Turkish tomato paste, due to different energy sources utilized (nuclear energy in France and oil and gas in Turkey) [35]. In a different study, growing lettuce in Spain and Italy led to a slight difference in CF between the two countries, with Italy showing a slightly lower value (0.205 kg CO2 eq per FU) than Spain (0.225 kg CO2 eq per FU) and no discussion took place regarding the comparison between the two countries, rather than between open-field and GH production [37]. Similarly, a study of tomato cultivation in different scenarios was conducted in Greece and Germany, without comparison between countries, but between different treatments. It was found that the lowest CF was calculated in the F-clean system and the value was 0.4 kg CO2 eq/kg of product and 7.6 kg CO2 eq/m2 [20].
Another factor that appears to have differentiated the CF of GH production is the growing season. Specifically, in a work conducted on lettuce cultivation in Greece, the CF of production in winter was 3.549 kg CO2 eq per kg of lettuce, a value which is greater than spring cultivation (2.775 kg CO2 eq per kg of lettuce) and winter–spring cultivation (2.173 kg CO2 eq per kg of lettuce) [47]. Similar findings were also observed in tomato cultivation in Spain, where the CF in two spring crops was calculated at 0.61 and 0.56 kg CO2 eq/kg of tomatoes, respectively, while in the winter crop it was 1.41 kg CO2 eq/kg of tomatoes [38]. The tomato crop in this system appeared to exhibit low productivity in the winter season since it naturally does not respond efficiently in low temperatures.
The different production systems also present a difference in environmental performance due to inputs and cultivation process variation. In particular, it has been shown that cultivation in an aeroponic system presents a higher energy consumption than in a soil cultivation system, and this fact in combination with the lower yield that may be observed in winter cultivation lead to a larger CF [47]. Differences also exist between hydroponic and soil cultivation in GHs, due to increased energy consumption for the operation of hydroponic systems, water recirculation, or the operation of oxygen pumps, as these result in an increased CF [51,53].
Depending on the method of calculating the CF in the studies, its value varies, as differences were observed depending on the protocol used for the analysis and the handling of allocation and avoided products. Specifically, in a work where floricultural species were studied, when the methodology proposed by PAS2050 was applied, the CF was 0.45–0.5 kg CO2 eq per one poinsettia plant, while it was calculated at 0.53–0.58 kg CO2 eq per one poinsettia plant, when the methodology of the ISO 14067 standard was applied [59]. In another study on tomato cultivation in The Netherlands, when the avoided product method was implemented, CF was calculated at 780 kg CO2 eq per FU and when energy allocation was the method for handling the products, at 2000 kg CO2 eq per FU [89]. System boundaries selection may result in disparate CF values, as was demonstrated in a study for tomato production [90]. The fresh tomato value chain was responsible for 547.13 kg CO2 eq per FU, while the dried tomato value chain was responsible for 467.44.
The use of innovative irrigation systems appears to have made a significant difference in reducing the CF, with closed-loop irrigation systems being proposed as solutions to reduce the CF in multiple studies, due to the reduction in energy requirements for additional pumping during recirculation and other irrigation processes [35,38,39,74,89,91,92]. Smart irrigation systems are shown to lead to a 13% decrease of CF in comparison with conventional irrigation systems [91].
One of the most crucial factors that affected the result of the analysis for the calculation of the CF was the control of the climate parameters of the GH and more specifically the use or lack of heating, as well as the type of heating method used. Some of the forms of inputs used for heating in the examined GHs were fossil fuels such as coal and natural gas, biofuel pellets, wood chips, wood pellets, and geothermal energy, as well as the use of solar collectors and waste valorization methods. Among the above energy sources, there are both renewable ones, such as solar energy, renewable biofuel pellets, geothermal energy, and wood chips, as well as non-renewable sources, such as fossil fuels. In all the works that calculated the CF where RES were used as a first scenario and non-RES were used as a second scenario for heating, its value was always higher when non-renewable sources were used for the crop cultivation. For energy-saving techniques, controlled shading systems are also suggested, as it may result in saving around 5% of energy consumption during periods where cooling needs are increased [93].
In more detail, using natural gas for heating tomatoes in Italy set the CF value at 3.59 kg CO2 eq/kg of product while in the waste valorization scenario the corresponding value was 1.37 kg CO2 eq/kg of product [50]. Similar findings exist in a work with tomato cultivation in Slovenia, where when natural gas was used, the CF was 0.5255 kg CO2 eq/kg of tomatoes, while with the use of geothermal energy the corresponding value was 0.018 kg CO2 eq/kg of tomatoes [65]. Also, in Hungary, with natural gas combustion for GH heating the CF was 5000 kg CO2 eq per FU, while with the use geothermal energy as a heating provider it was 440 kg CO2 eq per FU [89]. Regarding geothermal energy systems, the use of a backup geothermal system, which will act as a supplementary heating provider along with a natural gas boiler, has also been suggested [94]. In this case, a low-enthalpy shallow geothermal system using basket geothermal heat exchangers can be used during winter and nighttime and is able to reduce carbon emissions by 8 to 28%. For heating flower plants in Poland, with natural gas combustion the CF was 170.1 kg CO2 eq/m2 per year and with the use of coal 366 kg CO2 eq/m2 per year, while using wood pellets yielded a value of 20.5 CO2 eq/m2 per year and with the use of wood chips a value of 18.4 CO2 eq/m2 per year [75].
Finally, the lack of heating in the GH during cultivation also plays a key role in the results, where it has been calculated that the CF in a heated GH in Spain was 2.07 kg CO2 eq/kg of product, while in unheated conditions it was 1.13 kg CO2 eq/kg of product [42]. This finding is also observed in other studies, where the average impact per kg of tomato cultivation in heated GHs of France can be 4.5 times greater than the same cultivation in unheated conditions [95].

3.1.11. Hotspots

Inputs or categories of inputs that occupy a significant share in the final CF calculated in the examined systems are identified as hotspots of the production process. In the selected works, the main input categories were electricity used either for climate control or machinery and auxiliary equipment operation, infrastructure of the GH, heating with non-renewable sources, fertilizers, specific substrate choice, transport of inputs or products, and packaging of the final products and pot containers.
In almost all of the works where there was control of climatic conditions in the GH during the growing season, the main hotspot was heating. In these studies, heating needs were covered either with electricity or fossil fuels, such as natural gas and coal. Electricity was categorized as a hotspot in 20 studies, while heating was also mentioned as a hotspot in 17 studies. In some cases, these two categories of inputs appeared simultaneously in the same study with a significant share of the CF (5 studies). Electricity is a well-known hotspot in GH cultivation, while the mitigation of its impacts can be achieved by the utilization of RES such as photovoltaic panels to cover energy needs, as they are able to cover 16–44% of the annual electricity demand [93,96].
GH infrastructure appeared as a hotspot in 25 papers, which demonstrates the importance of their inclusion within the boundaries of systems under consideration, as infrastructure is often excluded from some studies or only specific dimensions are taken into consideration which leads to non-representative results. It is shown that the exclusion of infrastructure from the impact assessment of the systems can conceal 10–30% of the actual impact [97]. GH designs that can be applied for a more sustainable production system include modifications in the structure, covering materials, ventilation, lightning, use of photovoltaic panels, geothermal systems, and smart monitoring equipment. Based on the studies selected for this review, as well as other studies from the literature, it is shown that glass GHs have a profound impact on the CF due to considerable amounts of glass and metals used for the structure, while for multi-tunnel GHs, a steel frame is the highest contributor [97]. Ιt is confirmed by the selected works that between these two types of structure frame, glass/steel GHs have a bigger CF than plastic/steel GHs [41,51]. The optimization needs of GH constructions become necessary, as specific construction systems such as integrated rooftop greenhouses (iRTG) may result in CF savings of 113.8, 82.4, and 5.5 kg CO2 eq/m2/year when oil, gas, and biomass are used for heating, respectively [98]. Other aspects of GH operations, such as lighting used for crops, should also be taken into consideration, as specific choices may lead in modifications in energy and heating demands. More specifically, transition to LED lighting can save 10–25% of total GH energy demand, but this technique should be chosen after further consideration as it may reduce the energy need for lighting but increase heating demands [99].
Fertilizers were also a hotspot in 17 studies, due to the high impact derived from their production [49]. Pot containers have a significant impact on the CF of multiple studies [43,61,100], with researchers proposing the substitution of plastic containers with biodegradable materials. However, this solution may not always be the most economically viable for the producers [61]. Another important aspect with a high impact in CF is the selection of the substrate that is used in cultivation with peat, perlite, and zeolite being among the most dominant choices in the selected studies. In a study of the impact assessment of substrate choice, it was presented that perlite has a very low carbon footprint (0.0209 kg CO2 eq) in comparison with coconut fiber (1.4334 kg CO2 eq) and bark (1.1197 kg CO2 eq) [101]. However, in a selected study, a replacement of 10% of perlite with 10% rice hulls as a substrate in flowers cultivation is proposed as a way to reduce the CF of the system [100]. Rockwool substrate has been characterized by high GHG emissions, with researchers suggesting its recycling after use in order to reduce its impact [102]. In other cases, in the selected studies, peat resulted in a significant amount of GHG emissions due to its production or transport [100,103].
Transport is presented as a hotspot in six studies, with researchers suggesting that in production systems, local sources of inputs and raw materials should be preferred, in order to reduce the distances covered [35,37,104]. In addition, long transport times may also lead to a reduction in the yielded production due to the quality degradation of the products until they reach the market shelves [105]. Finally, post-harvest stages can contribute highly to CF, but alternative methods such as the use of reusable packaging materials, reduction in the transportation distances, use of eco-friendly vehicles, and implementation of RES can result in an up to 90% reduction in the CF of this stage [106].

3.2. Bibliometric Analysis

3.2.1. Descriptive Information of Collected Studies

Regarding the first goal, our purpose was to portray the research landscape of the GH CF based on descriptive statistics. In Table 2, the basic information of the collected studies is presented. The investigation of the collected documents reveals that the majority of the studies are published in journals, with nine studies (18%) being published in conference proceedings. In total, 50 studies were published from 2005 to 2023, and written by 164 different authors. However, the annual growth presents a negative trend, with a −3.78% value. This can be attributed to the fact that the papers selected were published by the beginning of 2023, as the search for papers was completed in April of the same year. Thus, in a possible future search, the results will be different.
Moreover, the annual scientific production seems to fluctuate over the years (Figure 2), but with a constant rising trend from 2010 and beyond. This is an indication that the domain of the GH CF is indeed active and attracts the interest of researchers and practitioners. Especially as we approach 2050, which is the reference year of the EGD for the reduction in the CF in all sectors of the economy, the rising trend observed after 2010 is completely justified, as long as countries and individuals are moving towards this goal looking for solutions in the agricultural sector.
On a publication-venue level analysis, in Table 3, the most active journals are presented, based on the number of published articles. As observed, most of the journals are relevant to the field of agriculture and the environment in general, with the Journal of Cleaner Production being the most popular publication venue.
The most cited articles, presented in Table 4, primarily contribute to the topic by enhancing the visibility of their papers in the field among the research community. In particular, 10 papers are the most cited among the 50 articles chosen for this review [48,49,89,107,108], having more than 100 citations from other studies. This is attributed both to the considerable significance of the journals in which the specific papers were published, as well as the subject matter of each study.
For example, in the work of Cellura et al. [107], all stages of the products’ life cycle are taken into consideration to calculate the CF, providing better transparency and accuracy to the calculation of the actual amount of GHG emissions in all stages of the supply chain. Moreover, in the work of Martinez-Blanco et al. [49], the environmental impacts of both GHs and field cultivation are described, which may clearly illustrate the different impacts and comparison between the two main production systems. A similar experimental design is observed in the work of Ntinas et al. [20], where the CF was calculated in both GH and the open field in two different EU countries with different latitudes.

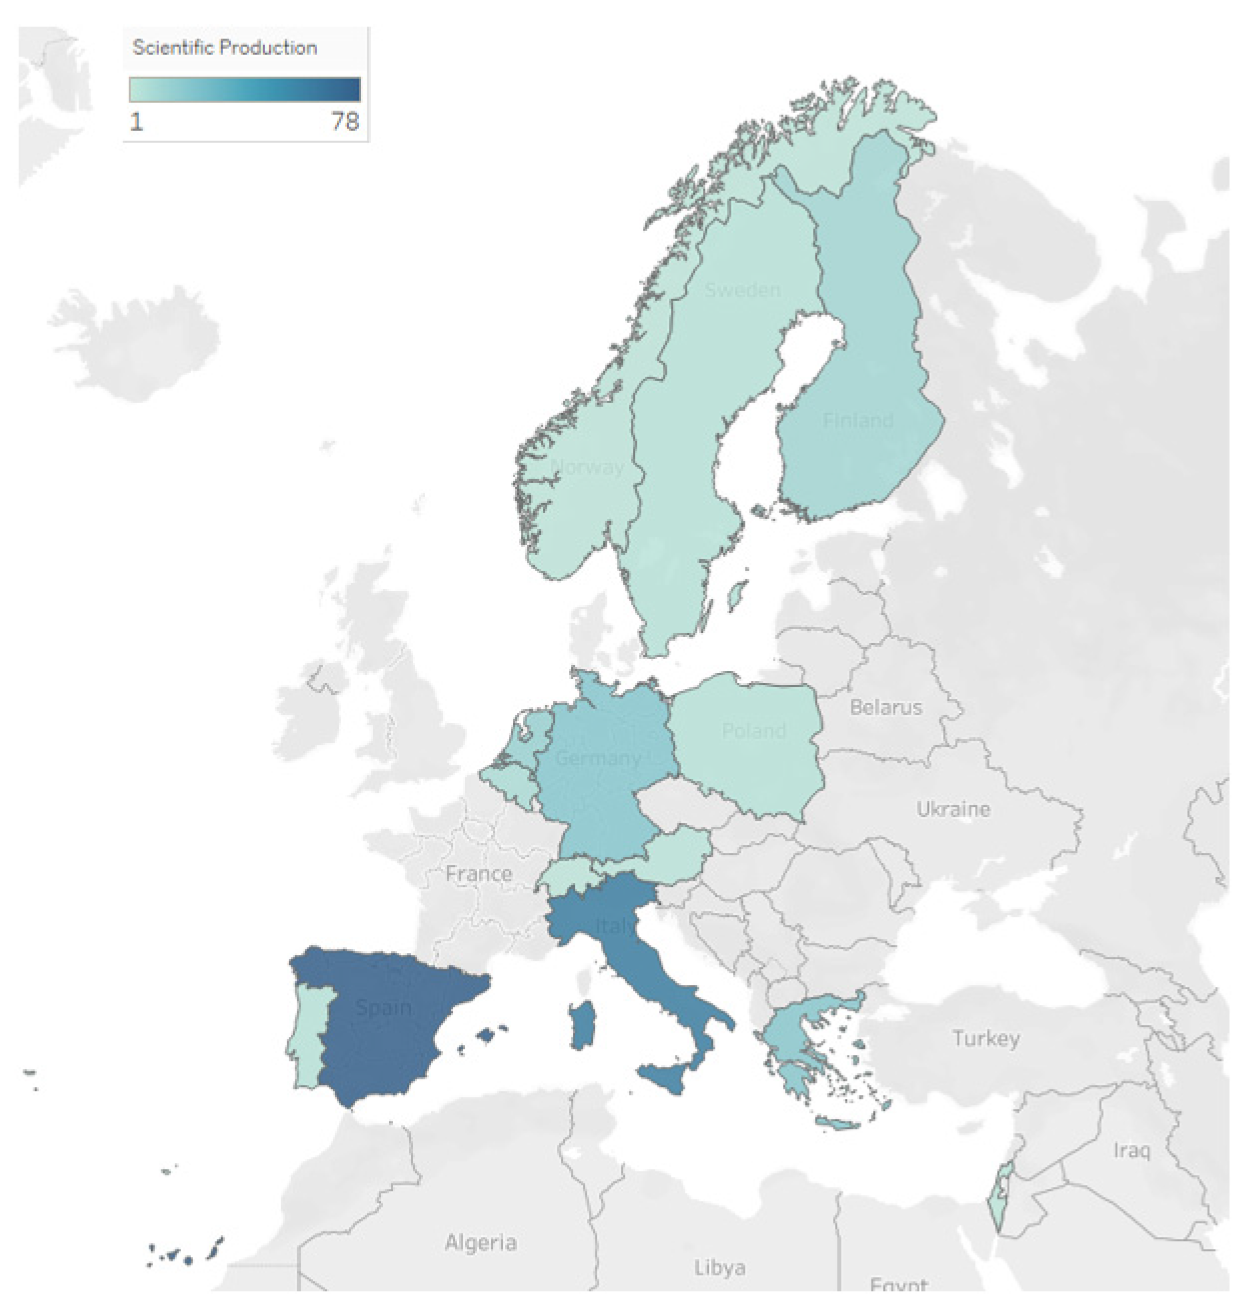
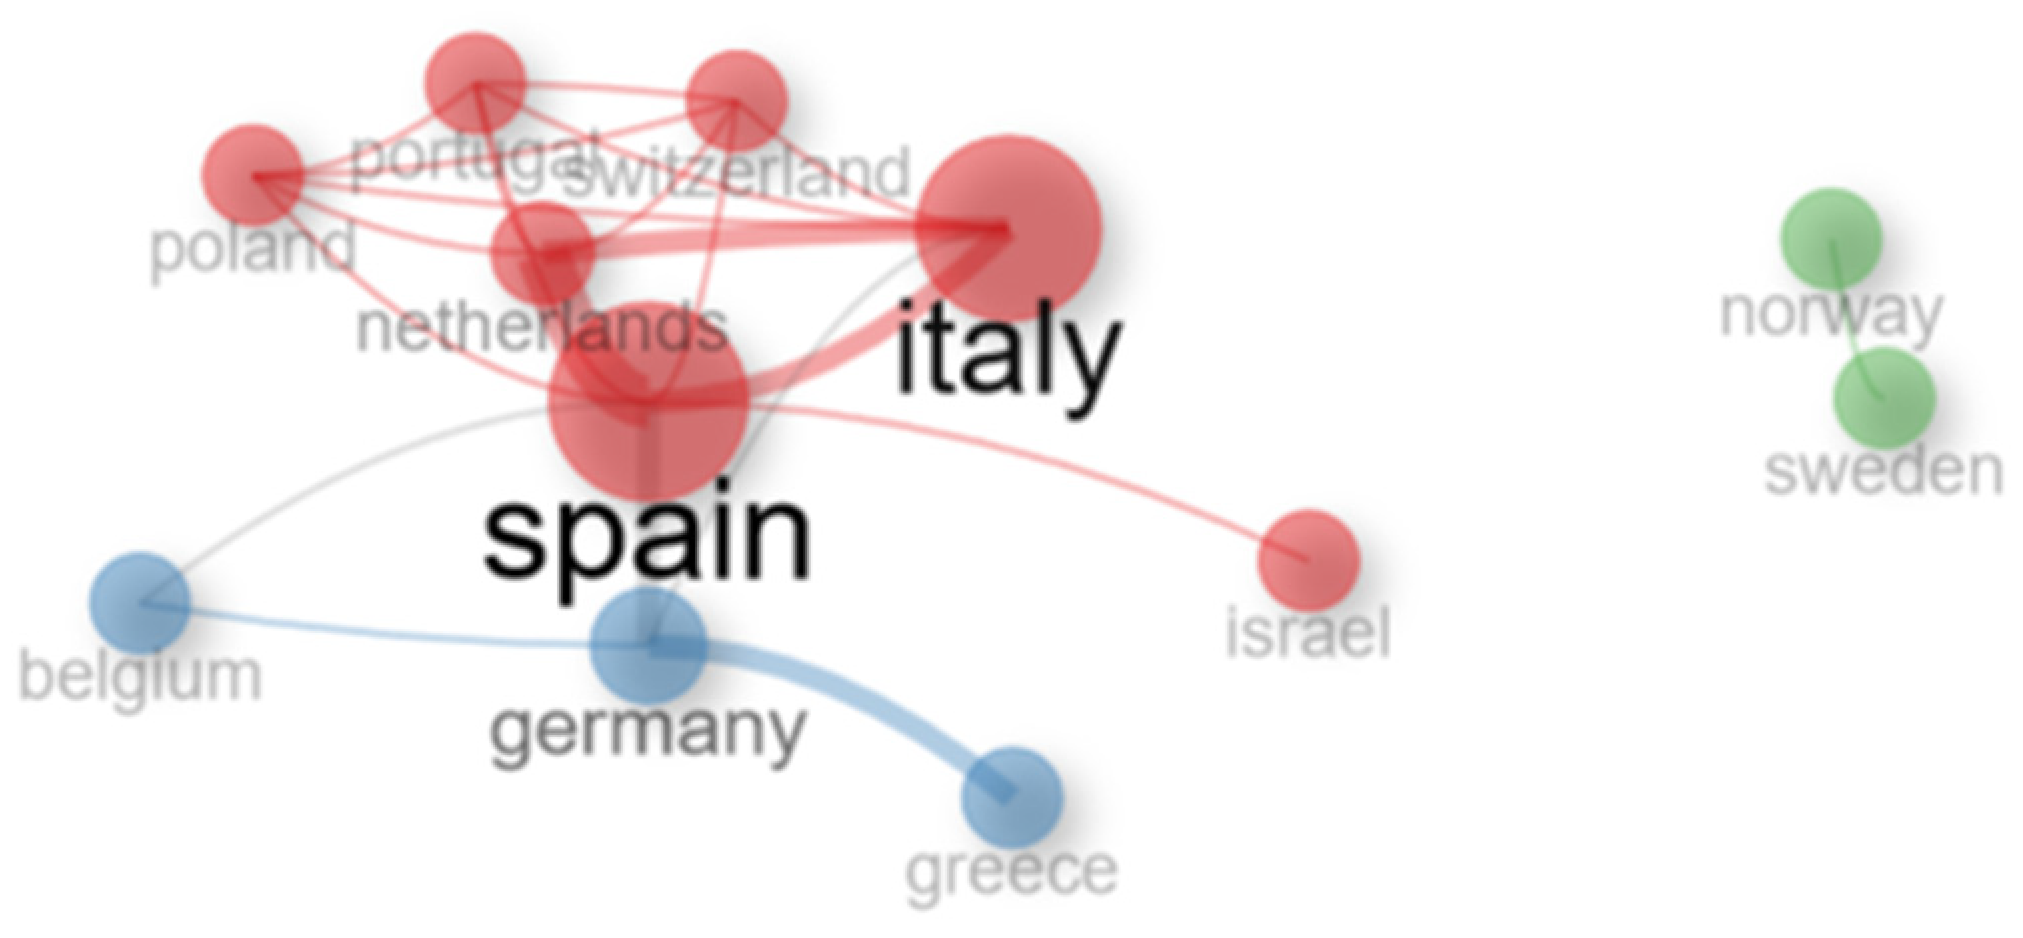
3.2.2. Country-Level Analysis

The next goal of the bibliometric analysis was to profile the activity of the collected studies in terms of the collaboration between countries, the scientific production of each country, and the countries that gather the highest number of citations. In Figure 3, the scientific production of each country is presented, where Spain, Italy, Germany, and Greece emerge as the most active countries in the field. This finding can be interpreted under the spectrum that Spain, Greece, and Italy are among the largest producers of GH crops in Europe, which justifies the increased research interest around the calculation of the CF in these countries’ GHs. In fact, Almeria, an area in southeastern Spain, has been marked as the greatest exponent of GH production in Europe [110]. Furthermore, these countries are characterized by a warm Mediterranean climate, which in most cases allows year-round production in GHs, with less need for heating during winter.
The increased interest around the calculation of the environmental impact of GHs in Germany could be attributed to the ambitious project that had been set in the country within the framework of the ZINEG project, with the aim of reducing the consumption of fossil fuels in GHs [111]. The efforts towards this goal led to winning the German Sustainability Award in 2014.
In addition, Figure 4 depicts the annual scientific production of the top five countries, where the same countries as Figure 3 are depicted as the most active ones, following a consistent upwards trajectory and validating the findings. The increase in the production of studies related to the subject covered by this review may be an indicator of the degree of fulfillment of the EGD’s goals by the countries. This fact may be considered under the assumption that the examined practices for reducing the effects of GH systems presented in the studies need to be applied on a wide scale due to negative effects of CC. It is also seen in Figure 4 that a greater increase in the production of studies over time is shown by Spain and Italy, which, as mentioned above, are the main countries producing GH products. The high activity of these countries is further indicated by Table 5, which demonstrates the most cited countries in the field, where Spain emerges as the most cited country.
Finally, in Figure 5, the collaboration network between countries that have published articles together is demonstrated. The nodes of the network represent the countries, and the size of the nodes represent the total scientific production of the countries. In addition, the thickness of an edge represents the strength of collaboration between countries, i.e., the number of times that authors of different countries co-occur in a paper. In this network, three main communities of collaboration are detected, comprising of country clusters that closely collaborate. Among them, the Scandinavian countries (Sweden, Norway) form an individual community, with no ties with other countries. The Scandinavian countries’ concentration of research efforts on high-tech agriculture practices may be linked to their special focus and competence, producing an internally focused collaborative network strengthened by strong institutional and intellectual linkages within the region [112]. Moreover, Spain and Italy are the main scientific actors and form close ties of collaboration, due to their geographical proximity, similar climate conditions, and common agricultural techniques that result in shared challenges and interests, and the presence of established research networks and institutions. They are also the main EU agricultural producers and importers to North Europe. Finally, Germany and Greece also collaborate to a high degree, with Germany also collaborating with Spain. Aside from collaborations among established research networks, Germany, as one of the most advanced economies in EU with a compelling reputation for research and innovation [113], may engage in partnerships with Greece and Spain, motivated by common economic interests in agricultural development and with the aim to improve overall scientific results and the quality of cooperative projects. Other smaller countries form collaboration ties with Italy and Spain (Poland, Portugal. Switzerland, The Netherlands), while strong ties are observed with The Netherlands and Spain/Italy. This occurrence is explained by the ability of each country (The Netherlands, Spain, and Italy) to contribute complementary skills and resources to collaborative efforts motivated by shared research agendas and common aims in sustainable agriculture, resource optimization, and climate resilience. Furthermore, as a significant agricultural exporter, The Netherlands benefits strategically from partnerships with Spain and Italy in meeting market demands and streamlining supply chains inside the EU [114]. Finally, Israel’s participation in joint initiatives may be explained by the country’s recognized skill and innovation in agricultural technologies, particularly precision agriculture, water management, and sustainable methods of agriculture which have led to its collaboration with EU countries [115].

3.2.3. Thematic Axes of Collected Studies

The final part of the bibliometric analysis involved the extraction of thematic clusters using the Callon clustering methodology and the usage of a co-occurrence network to portray the association ties between domain-specific words.
In Figure 6, the extracted thematic clusters are demonstrated, distributed into four quartiles with different values of Callon Density and Callon Centrality. Each cluster represents a detected community, which carries a value of centrality and density. The quadrants have been separated based on the median values of the Callon Density and Callon centrality, while the size of each circle is proportional to the number of cooccurrences of the words that comprise it; hence, larger circles indicate topics that are more frequent in the collected studies [32]. A first inspection reveals that the extracted thematic map adequately captures the scope of the studies, with a variety of themes detected in all quadrants.
The interpretation of the themes relies on the quadrant to which they belong in the thematic map. More specifically:
(a)
Themes in the upper left quadrant (high density, low centrality) represent niche themes that, while comprised of terms that are well connected to each other with strong ties, are not connected with the rest of the themes. Hence, these themes correspond to more refined areas of study that may require specific knowledge and expertise but may have important scientific impact. The themes in this cluster comprise of Theme_1 (lcia, rice hulls), Theme_2 (sustainable production, water-use efficiency), and Theme_3 (life cycle assessment (lca), cogeneration, natural gas). Within the more general subject of GH CF research, each theme in the niche cluster represents a focused and in-depth field of study. A product or process’s life cycle environmental impacts can be evaluated using the methodological technique known as life cycle impact assessment, or LCIA. The term “rice hulls” is included to show that the use of this specific agricultural input has special environmental impacts that are analyzed in impact assessment stage. Moreover, as the goal of sustainable production is to maximize resource utilization while reducing adverse effects on the environment, the inclusion of “water use efficiency” indicates that water-related issues in GH production could be the main focus. LCA is a technique for evaluating a process or product’s possible effects on the environment and environmental aspects over each stage of its life cycle. The words “cogeneration” and “natural gas” are specifically included, indicating a thorough investigation of energy-related aspects in GH production. Thus, they are a part of this cluster because of their lack of association with larger themes in the thematic map (low centrality) yet strongly interconnected terms within each subject (high density). Within their specific fields of study, this approach suggests a specialized focus, internal cohesiveness, and potential for major scientific impact.
(b)
Themes in the upper right quadrant (high density, high centrality) represent motor themes that comprise well interconnected terms that are also connected with other themes of other quadrants. Thus, these themes are drivers for research and have significant scientific activity surrounding them. In this cluster, the detected themes are Theme_4 (cut flowers, environmental analysis) and Theme_5 (lca, industrial ecology, circular economy) which are indeed crucial themes in the field of GH CF as they show broad links with other themes across several quadrants (high centrality) in addition to strong internal connections (high density). Regarding the environmental effects of the floral sector, the inclusion of “cut flowers” implies a particular focus on matters like energy use, water use, and possible pollution. This cluster also examines the GH CF through the lenses of life cycle assessment (LCA), industrial ecology, and circular economy. In doing so, it adopts a comprehensive approach to evaluate and mitigate the environmental impact of GH production over the course of its life cycle, investigate the environmental impacts of industrial systems, and promote sustainability by reducing waste and optimizing resource usage. These topics, which are positioned as catalysts for research and are seen as essential to the corpus of literature as a whole, suggest that they are critical in forming and impacting scientific research concerning GH CF.
(c)
Themes in the lower left quadrant (low density, low centrality) comprise weakly connected terms that are also isolated from the rest of the quadrants. Themes in this quadrant represent declining or emerging research fields that are either saturated and with low scientific production or finding their foothold in the scientific community. The themes in this cluster are Theme_6 (global warming potential, GH production) and Theme_7 (horticulture, environmental impacts, product carbon footprint). The first can be interpreted as focusing on evaluating and comprehending the possibility of GW in relation to GHG emissions. Given its low density and centrality, it is possible that this theme is still in the preliminary stages of investigation or is producing less scientific work than other themes in the field since it is a more specialized or narrowly focused area. The second one is centered on horticulture and focuses on evaluating the CF of the products associated with horticultural practices, and presents low density and centrality, indicating that it may be an emerging or declining field of study with a narrow focus and few connections to other themes, suggesting a possible lower level of scientific output in comparison to more central themes. Although some subjects may be particularly pertinent, the way they are now positioned within the field of science suggests that they require more research or development. It should also be noted that the position of themes is relevant to the examined domain (GH CF) and similar themes may have more prestigious positions in another domain.
(d)
Themes in the lower right quadrant (low density, high centrality) are basic themes that are well connected with other themes in the rest of the quadrants but have a weak internal structure. These themes, while important for research are less developed than motor themes (upper right quadrant). In this cluster, two of the detected themes are relevant to GHG emissions while the other theme is relevant to Theme_8 (life cycle assessment, greenhouse, carbon footprint), which is the central research theme of this study. GHG emissions’ evaluation and analysis entails researching the different gases released during agricultural activities and how these emissions affect the environment. While this subject is well-connected to other research fields, its low density and high centrality indicates that it may have a less developed internal structure, indicating the need for more in-depth studies. The study’s primary research focus, which includes life cycle assessment, GH technology, and the total CF related to GH production, represents an integrated approach to comprehending how GH activities affect the environment over all stages of their life cycle. Located in the lower right quadrant, the low density indicates that further internal growth is necessary, while the high centrality shows that it has strong relationships with other themes. Despite having a less developed internal structure, these themes play a crucial role in interpreting various research topics belonging to other quadrants.
Finally, using the VosViewer software, the co-occurrence network of the index and author keywords are presented, using the year overlay (Figure 7). In this network, the size of the nodes indicates the single frequency of each word, i.e., the number of times that a word appears in the author or index keywords, while the thickness of the edge between two words indicates their association strength, i.e., the number of times they co-occur together. Moreover, each node has been colored based on the average year of all the publications that contain it. An inspection of the co-occurrence network’s major nodes reveals a focus on greenhouse technologies, life cycle assessment, carbon footprint, environmental impact assessment, and initiatives to reduce GHG emissions. The field’s dedication to comprehending and reducing environmental repercussions is highlighted by the prominence of subjects like life cycle assessment and GHG emissions. The terms “greenhouses” and “cultivation” are often used, which indicates that GH agriculture is committed to developing sustainable methods and technology. The co-occurrence network’s more isolated nodes, like “annual bedding plants”, “diffusive farms”, “carbon dioxide emissions”, “environmental burden”, “compost production”, “composting process”, and “bio-stimulants and growth regulation”, each point to particular, potentially niche aspects of GH production. Together, these isolated nodes represent a variety of specialized and varied facets of GH production, adding to a more comprehensive understanding of environmental sustainability, cultivation techniques, and particular plant-related factors in the context of a larger body of literature. Due to their relative rarity, these subjects may possess distinctive qualities that distinguish them from more popular subjects while maintaining their applicability to GH research.

4. Research Questions Resolved

4.1. Research Question 1—What Is the Research Landscape of Carbon Footprint Analysis in the European Union Countries, Based on Bibliometric Indicators?

The conducted bibliometric analysis aimed at portraying the overall research landscape of GH cultivation, while also profiling the country-level information and the thematic trends of the domain. The analysis of the research landscape reveals that GH cultivation is indeed an emerging and evolving field, with 50 primary studies concerning the EU. The growth in the last 13 years has been constant, as innovative technologies emerge and render the field even more relevant. In addition, several respectable publication venues such as the Journal of Cleaner Production have been the primary receptors of GH cultivation research, while the works of Cellura et al. [107] and Torrellas et al. [108] appear to be the most cited papers among the collected studies.
In a country-wise level analysis, the countries with the highest scientific production are Spain, Italy, and Germany, which, along with Greece, are also the most highly cited countries in other published works. This proves that climate conditions play a crucial role in GH cultivation and innovation, with Mediterranean countries at the forefront of these ventures. Finally, the country collaboration network reveals that Spain and Italy frequently collaborate in published studies, with Germany, Greece, and The Netherlands also being active collaborators. An interesting finding concerns the Scandinavian countries that have developed an isolated community of collaboration which can be explained by their unique climate conditions.
Moreover, thematic analysis using thematic maps indicates that the concepts of circular economy and industrial ecology, coupled with LCA are drivers of research coupled with environmental analyses. Conversely, GHG emissions and the use of LCA in CF are basic themes that can be used as liaisons with more advanced topics while sustainable production and wastewater efficiency, LCIA, and LCA in natural gas comprise more niche topics that require additional expertise. Finally, global warming and horticulture environmental impacts are indicated to be either declining or emerging themes. The findings of the thematic analysis are validated by the co-occurrence network, where GH technologies, LCA, carbon footprint, and greenhouse gases are central nodes and are connected with more isolated communities such as “annual bedding plants”, “diffusive farms”, “groundwater”, “waste management”, and “fertilizers”, among others.

4.2. Research Question 2—What Is the Value of the Carbon Footprint Indicator of Greenhouse Crops in European Union Countries?

The CF of GH production in EU countries shows great variability and depends on several factors, such as the type of cultivated species, the amount of yield, the cultivation techniques, the use of heating, the use of fossil fuels or renewable energy sources, and the specific protocol/databases/software used for the calculations. The most important hotspot categories identified were heating, GH infrastructure, electricity, fertilizers, substrate choice, and transport. It was not possible to make a comparison between the CF values of the EU countries, as this would lead to unreliable and unsafe conclusions. A certain conclusion that can be drawn is that the value of CF can be increased significantly when non-renewable energy sources are used to heat the greenhouse. The CF values per production system, type of crop, and per country are detailed in Table A2.
It should be noted that the values of CF observed in the specific examined studies of this review were attributable to the specific production methods followed. By modifying the experimental design and using alternative inputs, the above values can be changed.

4.3. Research Question 3—Are Renewable Energy Sources Being Implemented in European Union Greenhouses and How Does This Affect Carbon Footprint Values?

RES appear to be frequently used in studies of the CF of GH crops in EU countries, as a means of reducing the environmental impact of production systems and contributors in achieving energy autonomy, by self-producing energy for the GH needs. The renewable resources used include wood pellets, wood chips, geothermal energy, solar energy, and biofuel pellets. In some works, even though it may not have been possible to use any RES, their use is suggested as a way of improving the sustainability of the systems. In studies where RES have been utilized as inputs, the CF was significantly reduced. Indicatively, in the selected studies, the use of RES over natural gas contributed to a reduction of 61–96.6% in CF values. However, it is important to always consider the economic viability of RES use for the producer in order to avoid financial weaknesses and failures.

4.4. Research Question 4—Based on Current Data, Is It Possible for Greenhouse Production to Meet the Green Deal’s Directive Fit for 55 to Reduce the European Union’s Greenhouse Gas Emissions by 55% by 2030, and in What Ways?

The EGD targets include a wide range of actions that need to be met. Production in GHs can contribute to strengthening the objectives of reducing GHG emissions by 55% by 2030, through the use of clean and secure energy sources, by utilizing innovative infrastructure techniques, by developing eco-friendly systems with less toxic substances escaping into the environment in order to protect biodiversity or by optimizing the transportation of products to cover the distance from farm to fork.
In the selected studies, the above issues were recognized by the authors, who either used methods to prevent the environmental impact of the examined systems or identified the production stages that require the use of alternative methods that can reduce the environmental burden caused. The reduction in produced toxic substances leaving the cultivated system could for example be achieved by limiting the use of fertilizers, which was presented as a solution in several works. Improving the construction materials of GHs has also been suggested as a solution by numerous studies, which have identified this particular issue as an important hotspot. Reducing the transportation time and distance has been suggested as an important means of both controlling and monitoring fossil fuel consumption while also protecting against the reduction in production that can lead to an increased CF. Choosing a specific sustainable cultivation method over another can even lead to a negative value of carbon footprint. In conclusion, more sustainable GH management by improving input use efficiency is necessary for covering market needs without having negative effects on the environment [116]. Following these given instructions and proposals, the EGD can be a comprehensive roadmap that lays forth a transformative vision for a more sustainable and resilient Europe [117].

5. Threads to Validity

In this section, we analyze the primary threats to the validity of our study. Based on similar studies that have conducted a systematic review and mapping of a scientific domain and guided by the methodology leveraged by Ampatzoglou et al. [118], we divide the threats in (i) those related to the selection of the studies, (ii) those relevant to the data validity of the collected studies, and (iii) those related to the conducted research and generalization.
Regarding the threats associated with the study selection, to mitigate any threats from manual or arbitrary choices, an automated study identification was employed, leveraging several search strings that could maximize the number of retrieved studies. The selection of the database that would be used for the study extraction is also a threat that must be mitigated. The authors of this paper used Scopus as the primary source of information due to the broad range of research topics that is indexed, providing a robust source of information.
The authors, who are knowledgeable in the studied domain, thoroughly discussed the potential keywords that would be incorporated to the final query. Hence, the threat of irrelevant results is mitigated as the utilized search string was meticulously examined. Of course, while the threat of omitting some relevant studies is indeed possible, the utilized search strategy limits this possibility. In addition, the inclusion and exclusion criteria were discussed and agreed among the authors so as to collect the most relevant studies and limit noise in the data, while the first and third authors also examined all studies manually to ensure that no irrelevant studies would be included in the final set. Any conflicts and disagreements in the study inclusion were resolved by all authors who examined the presented issues and carefully solved them. Finally, the relatively small number of studies is not concerning, as the examined domain is emerging, and the existing literature would inevitably be limited. However, due to the exhaustive search of the retrieved studies, the final set is highly representative of the status of the domain and can yield robust insights.
The threats that are related to the data validity mainly refer to bias and subjectivity in the selection of the examined fields. To avoid this threat, the authors carefully investigated the primary parameters that are evaluated by the LCA methodology, and all subsequent analyses were conducted based on this premise. In addition, the bibliometric analysis was performed based on valid and unbiased metadata extracted from Scopus, using established inferential methodologies and dedicated packages in R to facilitate this purpose [119].
Finally, to eliminate threats related to the research validity and the generalization of the findings, the search strategy and all methodologies are described in a thorough manner, to enable the reproducibility of this study. Moreover, the research plan and its execution were based on agreed policies and discussions among the authors, who are well established in the examined domain.

6. Conclusions

In this work, a systematic review of the literature was carried out, as well as a bibliometric analysis, in order to capture the state of sustainability of GH crops in the EU countries and to establish whether the mandated guidelines are being followed to achieve the goals of the EGD. Fifty-two studies involving vegetable and flower crops in conventional greenhouses were thoroughly studied, and information related to the calculation of the CF, as an indicator of the sustainability of the systems, was extracted. The possible use of RES, and alternative forms of inputs, in an attempt to reduce CF was investigated and studied. From the review process, it emerged that in the EU, dominant countries in the study of the CF in GH crops are Spain and Italy, while the growth of interest in sustainability in the last 13 years has been constant, as innovative technologies emerge and render the field even more relevant. The value of CF is affected by a variety of factors, while its reduction can be achieved by using RES, modifying the cultivation systems, and adapting the inputs selection to the current conditions in the best possible way. Leveraging the proposed methods from the selected works, the carbon footprint can even take negative values, which leads to the conclusion that it is possible to achieve a reduction in GHG emissions by more than 55% in the coming years.
The contribution of this study is significant in the field of research and broad agricultural production, as the above findings show area-specific practices for reducing the CF in GHs, which can be directly applied to approach sustainability as much as possible. The presentation of CF values in the current time period can be a benchmark in the future to determine whether the objectives for reducing CF of GH crops have been achieved.
It is stated that relying only on CF to assess the environmental impacts of the systems would result in overlooking impacts in other categories, for example those related with impacts from toxic substances [120]. For this reason, it is important to have a holistic approach when assessing the life-cycle of products. There is a relatively small number of papers regarding the calculation of the environmental impact of GH production that have been studied for this review; if it is taken into account that GHs occupy a large amount of area in the EU and worldwide, this fact could be considered as a limitation of the present study. It is important for future research to continuously emphasize the importance of achieving sustainability in agricultural production systems such as GHs, so that more LCA studies are produced and the proposed proven methods are applied, not only in the EU, but also worldwide. Policy implications could also lead to this direction, by proposing a systematic calculation of CF in the GHs, so that there is transparency and to identify hotspots that must be eliminated.

Author Contributions

Conceptualization, M.R., G.K.N. and N.M.; methodology, M.R. and K.G.; software, K.G.; validation, M.R. and G.K.N.; formal analysis, K.G.; investigation, M.R. and S.T.; resources, G.K.N.; data curation, K.G.; writing—original draft preparation, M.R.; writing—review and editing, All authors; visualization, M.R. and K.G.; supervision, G.K.N. and N.M. All authors have read and agreed to the published version of the manuscript.

Funding

This paper is being supported by the project “Exploitation of by-products from biogas plants for greenhouse heating and production of high added-value agricultural products with reduced environmental footprint” (Project Code: T2EDK-04794) under the framework of the action “Investment Plans of Innovation”, which is co-funded by Greece and the European Union (Funding number is: MIS 5069998) within the operational program “Competitiveness Entrepreneurship Innovation” (EPAnEK).

Data Availability Statement

Data is contained within the article.

Conflicts of Interest

The authors declare no conflict of interest.

Appendix A

Table A1. Extracted information from the selected studies of the review.
No.AuthorsCountryYearPlant SpeciesProtocolFunctional UnitSystem BoundariesSoftwareLCI MethodImpact Categories
1Abeliotis et al.Greece2016carnationISO 140441.5 million carnation stemscradle-to-gaten.d.CML 2 baseline 2000AD, OLD, GWP100, MAE, FAE, TECc, HT, PO, AC, ET
2Almeida et al.Italy2014tomatoISO 14040/441 kgcradle-to- gateSimaProIPCC GWP 2007 100yCF, WF, ED
3Antón et al.Netherlands2012tomatoISO 14040/441 tcradle-to-graveSimaPro v.7.2CML2001AD, AC, ET, GW, PO
4Antón et al.Spain2005tomatoISO 140401 kgcradle-to-graveTEAM 3.0n.d.ET, AC, CC, OLD, PO, NRRD, HT, AET, TET, WR
5Baptista et al.Portugal2017tomaton.d.1 tgate -to- gaten.d.n.d.GHG emissions
6Barla et. al.Greece2020lettuceISO 140441 kgcradle-to-farm gateSimaPro v.7CML 2 baseline 2000GWP100
7Bartzas et al.Spain, Italy2015lettuceISO 14040/441 kgcradle-to-gateGaBi 6CML2001AC, ET, GWP, OLD, PO, CED
8Blom et al.Netherlands2022lettuceIPCC1 kgcradle-to-graveSimaPro v.9.0.0IPCC GWP 100aGWP100
9Bonaguro et al.Italy2017cyclamenISO 140441 potted plantgate-to-gaten.d.CML2001AD, OLD, GWP100, MAE, FAE, TECc, HT, PO, AC, ET
10Bonaguro et al.Italy20164 ornamental plantsPAS2050, ISO 140441 plant in its containercradle-to-gateSimaPro v.7.3.3n.d.GWP
11Bosona et al.Sweden2018tomaton.d.1 tcradle-to-consumer gateSimaPro v.8.2ReCiPe (H)CED, GWP100
12Canaj et al.Italy2022zucchinin.d.1 tcradle-to-farm gateOpenLCA v.1.10.3ReCiPe (H)FPMF, FRS, FEC, FE, GW, HCT, HNCT, IR, LU, MEC, ME, MRS, OFHH, OFTE, SOD, TA, TEC, WC
13Cellura et al.Italy20125 fruit vegetablesISO 140401000 kg of packaged vegetablecradle-to-graveSimaPro v.7CML2001GW, OLD, PO, AC, ET, HT, FAE, MAE, TECc
14Chatzigeorgiou et al.Greece2022grapevineISO 140671 kg of vine leavescradle-to-farm gateSimaPro v.9.2.0.n.d.CF
15Corcelli et al.Spain2019tomatoISO 14040/441 m2 of flat rooftopcradle-to-graveSimaPro v.8.0.5ReCiPe Midpoint (H)CC, SOD, TA, FE, POF, TEC, WD, MD, FRS
16De Lucia et al.Italy2013BougainvilleaISO 140401 kgcradle-to-graveGaBi 4CML2010AD, GWP100, OLD, AC, ET, PO, EC
17Falla et al.Italy2020begonias, violasISO 14040/441 g of fresh edible flowerscradle-to-gateSimaPro v.8.5.0.0n.d.GWP, AC, ET, PO
18Frem et al.Italy2022ornamental plantsISO 14040/441000 potted plantscradle-to-farm gateOpenLCAReCiPe Midpoint (H)LU, GWP100, FRS, WD
19Fusi et al.Italy2016lamb’s lettuceISO 14040/441 bag with 130 gr lamb’s lettucecradle-to-gateSimaPro v.7.3.3IPCC 2006, Recipe Midpoint (H)/EuropeCC, SOD, HT, PO, TA, FE, ME, TEC, FEC, MEC, WD, FFD
20García García and García GarcíaSpain2022pepperISO 140401 tcradle-to-graveSimaPro v.9.1CML-IA Baseline 4.7AD, GW, OLD, HT, FAE, MAE, TECc, PO, AC, ET
21Grabarczyk et al.Poland2022potted flowersISO 14040/44(a) potted plants, (b) 1 m2 areacradle-to-farm gaten.d.IPCC 2006CF, CED
22Ilari et al.Italy20184 leafy vegetablesISO 14040/441 plant in traycradle-to-nursery gateSimaPro v.8.1CML 2 baseline 2000 v.2.05AD, AC, ET, GWP100, OLD, HT, FAE, MAE, TECc, PO
23Jukka et.al.Finland2022tomatoISO 14040/44/671 tcradle-to-gateGaBi v.9.2.1.68n.d.CF
24Lampert and MenradGermany2023poinsettiaPAS 2050-1, ISO 140671 potted poinsettiacradle-to-graveUmberto NXT CO2PCFCF
25Lazzerini et al.Italy2016ornamental plantsISO 14044, PAS 20501 m2 areacradle-to-gateGaBi 6CML2011GWP100
26Martínez-Blanco et al.Spain2011tomatoISO 140441 tsystem expansionSimaPro v.7.2.4CML2001AD, AC, ET, GW, OLD, PO, CED
27Martin-Gorriz et al.Spain2021tomatoISO 14040/44(a) 1 m2 cultivation area, (b) 1 kg of marketable tomatocradle-to-gateSimaPro v.9.1CML2001AD, AC, ET, GW
28Marttila et al.Finland2021tomato, cucumberISO 14040/44/67(a) 1 t tomatoes, (b) 1 t cucumbercradle-to- gateGaBi ts 9.5CML2001, GWP100GWP100
29Montero et al.Spain2014tomatoISO 140401 tn.d.SimaPro v.7n.d.CED, AD, GW, AC, ET, PO
30Mugnozza et al.Italy2007roseISO 14040/43/20100 cut stemscradle-to-gateGaBi 4CML2001AD, AC, ET, GWP100, OLD
31Muñoz et al.Spain2007tomatoISO 14040/441 kgcradle-to-farm gatev.7.0, 2006CML2001NRRD, GW, OLD, AC, ET, WC, EC
32Ntinas et al.Greece, Germany2017tomatoISO 14040/44(a) 1 kg tomatoes, (b) 1 m2 areacradle-to-farm gaten.d.IPCC 2006GWP100, CED
33Ntinas et al.Germany2020tomatoISO 14040/44(a) 1 kg tomato, (b) 1 m2 areacradle-to-farm gaten.d.IPCC 2007CF, CED, WUE
34Palma et al.France, Turkey2014processed tomaton.d.(a) 1 kg tomatoes, (b) 1 kg packed processed tomatoescradle-to-graveSimaProCML 2 baseline V2.05 worldCF, HT, ET
35Parada et al.Spain2021tomatoISO 140401 kgcradle-to-graveSimaPro v.9ReCiPe (H)GW, TA, FE, ME, FRS, CED, ECT
36Pérez Neira et al.Spain2018tomatoIPCC1 kg tomatoes delivered(a) cradle-to-regional distributional center; (b) cradle-to-farm gaten.d.equationsCF, CED
37Röös et al.Sweden2013tomatoIPCC10.4 kgcradle-to-farm gateSimaPro v.7.3.3IPCC 2007 GWP 100aCF
38Rufí-Salís et al.Spain2020common beanISO 140401 kgcradle-to-graveSimaPro v.9.0ReCiPe (H)GW, TA, FE, ME, FRS, MEC, TEC, FEC
39Russo and MugnozzaItaly2005tomatoISO 14040/43/49/47/481 kgcradle-to-gaten.d.CML2, 2000AD, GWP100, OLD, HT, FAE, TECc, PO, AC, ET
40Russo et al.Italy2008rose, cyclamenISO100 cut stemscradle-to-gateGaBi 4CML2001AD, AC, ET, GWP100, OLD, PO, EC
41Russo et al.Italy2008roses and cyclamensISO 14040/44(a) 100 cut stems (roses), (b) 6 pots of cyclamenscradle-to-gateGaBi 4CML2001AD, CC, OLD, AC, ET, PO, EC
42Sanjuan-Delmas et al.Spain2018tomatoISO 14040/441 kg tomatoes deliveredcradle-to-graveSimaPro v.8.2ReCiPe (H)CC, ECT, TA, FE, ME, FFD, TEC, FEC, MEC
43Sanyé-Mengual et.al.Spain2015tomatoISO 140441 kg(a) cradle-to-grave; (b) cradle-to-farm gate; (c) cradle-to-consumerSimaPro v.7.3.3ReCiPe Midpoint (H)GWP, CED, norm-ReCiPe
44Soode et al.Germany2015strawberriesPAS 2050/11 kgcradle-to-graveGaBi v.6.0, SPSSn.d.GWP100
45Soode et al.Germany2013poinsettiaPAS 2050, ISO 140671 potted plantcradle-to-graveGaBi 5IPCC 2007 GWP 100aGWP100
46Soode-Schimonsky et al.Germany, Estonia2017strawberryISO 14040/44/671 kgcradle to the point of saleGaBi 6PEFTEP, ME, POF, WD, HNCT, CC, OLD, AC, FE, FPMF, LT, HCT, IR, FAE, FFD
47Stajnko et al.Slovenia2016tomatoSPI1 kgn.d.SPIonWebn.d.GWP
48Torellas et al.Spain2012tomatoISO 140401 t of loose tomatoescradle-to-graveSimaPro v.7.2CML2001AD, AC, ET, GWP100, PO, CED
49aTorrellas et al.Spain2012tomatoISO 14040, ILCD1 tcradle-to-farm gateSimaPro v.7.2CML2001CED, AD, AC, ET, GW, PO
49b\\Hungary\\tomato\\1 t\\\\\\\\
49c\\Netherlands\\tomato\\1 t\\\\\\\\
49d\\Netherlands\\rose\\1000 rose stems\\\\\\\\
50Torres et al.Spain20174 vegetablesISO 14067, PAS 2050-11 kg of each productcradle-to-farm gateeFoodPrint EnvIPCC 2006CF
51Vermeulen and van der LansNetherlands2010tomatoDNSF20091 tcradle-to-gaten.d.n.d.CF
52Wandl and HaberlAustria2017ornamental plantsISO 14040/44(a) piece of product, (b) days of floweringcradle-to-grave, gate-to-gaten.d.IPCC 2006GWP
AET: Aquatic ecosystems toxicity, ECT: ecotoxicity, EC: energy consumption, ED: energy demand, FPMF: fine particulate matter formation, FFD: fossil fuel depletion, FRS: fossil resource scarcity, FAE: freshwater aquatic ecotoxicity, FEC: freshwater ecotoxicity, FE: freshwater eutrophication, HCT: human carcinogenic toxicity, HNCT: human non-carcinogenic toxicity, IR: ionizing radiation, MAE: marine aquatic ecotoxicity, MEC: marine ecotoxicity, ME: marine eutrophication, MD: metal depletion, MRS: mineral resource scarcity, OFHH: ozone formation human health, OFTE: ozone formation terrestrial ecosystems, OLD: ozone layer depletion, PO: photochemical oxidation, POF: photochemical ozone formation, PEF: product environmental footprint, SOD: stratospheric ozone depletion, SPI: sustainable process index, TA: terrestrial acidification, TET: terrestrial ecosystems toxicity, TEC: terrestrial ecotoxicity, TECc: terrestrial ecotoxicity (CML method), TEP: terrestrial eutrophication, WC: water consumption, WD: water depletion, WR: water resource, WUE: water-use efficiency.
Table A2. CF values, observed hotspots, and heating use in the selected studies.
No.AuthorsCF Value (kg CO2 eq) per Selected FUHotspotsHeatingRef.
1Abeliotis et al.47,400 kgelectricity for the flowers’ preservationNo[105]
2Almeida et al.Current: 2.28 kg; Conventional with natural gas: 3.59 kg; Waste Valorization scenario: 1.37 kg; Cogen: 2.69 kg;heating and CO2 fertilization, construction, coupled heating and CO2 provision, constructionYes[50]
3Antón et al.Avoided product method: 780 kg; Allocation method: 2000 kgclimate control system (natural gas for heating)Yes[102]
4Antón et al.Closed: 81.4 g; Open vs Closed: 1.12 (ratio)waste of biomass and plasticsNo[104]
5Baptista et al.Organic: 105.9 kg; Conventional: 122.18 kgGH materials, fertilizers, electricityNo[40]
6Barla et al.Winter: 3.549 kg; Spring: 2.775 kg; Winter–Spring: 2.173 kgelectricityNo[47]
7Bartzas et al. GH Lettuce Italy: 0.205 kg; GH Lettuce Spain: 0.225 kgcompost production, GH construction, energy consumption for climate controlYes[37]
8Blom et al.GH (soil): 1.211 kg; GH (hydroponic): 1.451 kgelectricity and fuel use, energy and resources used to produce the seedlingsYes[53]
9Bonaguro et al.Base scenario: 0.157 kg; Scenario 1—peat shipped from Germany: 0.177 kg; Scenario 2—peat shipped from Lithuania and Estonia: 0.139 kgplastic pot, GH structure, peat transportNo[100]
10Bonaguro et al.Poinsettia: 0.0619 kg; Zonal geranium: 0.0295 kg; Cyclamen: 0.0217 kgpot containers and diesel for heatingYes[61]
11Bosona et al.Fresh tomato value chain: 547.13 kg; Dried tomato value chain: 467.44 kgcultivation stage: energy for GH heating, irrigation and GH construction materials.
post-harvest stage: packaging and drying activities; transport stage: fuel consumption
Yes[90]
12Canaj et al.Farmer irrigation: 785.62 kg; Cloud-based DSS irrigation: 770.46 kg; Sensor-based irrigation: 770.45 kgirrigation, mechanizationNo[91]
13Cellura et al.Melon: 1427.5 kg; Pepper: 915.5 kg; Zucchini: 1571 kg; Tomato: 740 kg; Cherry tomato: 1245.9 kgGH materials, packaging and transportationsNo[107]
14Chatzigeorgiou et al.1.7P: 10.35 kg; S treatment: 79.2 kgenergy consumption, construction materials, perlite-zeolite substrateNo[121]
15Corcelli et al.17 kgfertilizers, substrate, RTG structureNo[122]
16De Lucia et al. Sewage sludge compost 70%: 150%; Sewage sludge compost 55%: 138%; Sewage sludge compost 40%: 120%; Sewage sludge compost 25%: 100%; Sewage sludge compost 0%: 48%SSC70 (peat free substrate)No[123]
17Falla et al.Begonia: 24.94 g (potted plant); 28.03 g (large container); 29.47 g (small container) Viola: 26.99 g (potted plant), 29.81 g (large container), 31.25 g (small container)small containers, propagation phase and young plant cultivation phase for begonia, young plant cultivation phase for violaYes[124]
18Frem et al.Novel and sustainable production model (NSM): 660.67 kg;
Conventional production model (CM): 665.42 kg
peat moss production, diesel, burned in agricultural machineryYes[103]
19Fusi et al.0.346 kgagricultural level: GH production
processing stage: high consumptions of energy, use of water
No[46]
20García García and García García 122 kgelectricity associated with the supply of water for irrigation, GH infrastructureNo[125]
21Grabarczyk et al.Coal: 366.6 kg/m2 and 1.245 kg/pot; Natural gas: 170.1 kg/m2 and 0.578 kg/pot; Wood pellets: 20.5 kg/m2 and 0.07 kg/pot; Wood chips: 18.4 kg/m2 and 0.063 kg/potheating with coal, heating with natural gasYes[75]
22Ilari et al.0.00253 kgthermoplastic and plastic materials, substrates extraction, fertilizers, pesticidesNo[126]
23Jukka et al.888 kgelectricity consumption, infrastructure, heatingYes[127]
24Lampert and Menrad1.27–2.31 kgyoung plant phase: transport by airplane and the rooting of cuttings; horticultural production and distribution: packaging, potting substrate, and electrical power;
consumer stage: small basket of goods and a non-combined shopping trip
Yes[60]
25Lazzerini et al.Quercus fellus: 0.5612 kg; Wisteria floribunda: 1.0197 kg; Nandina domestica: 3.7763 kg; Magnolia stellata: 2.8506 kg; Cupressocyparis leylandii: 2.0678 kg; Photinia fraseri red robin: 5.0107 kg; Pinus pinea 5.2969 kg CO2 eq/plant/yearfarm and container structures, diesel, fertilizers, potting mix, pots, transport, soil tillageNo[43]
26Martínez-Blanco et al.Mineral fertilizers: 153 kg; Compost and mineral: 119% morecompost production, mineral fertilizers productionNo[49]
27Martin-Gorriz et al.1.75–2.05 kgproduction and management of fertilizers, GH structure, and irrigation systemNo[74]
28Marttila et al.Tomato: 857–6523 kg; Cucumber: 1379–2951 kgheating with oil boiler and natural gas boiler, electricity, peatYes[128]
29Montero et al.(Avoided CF) PE recycling: −0.7012 kg; Valorization: −8.7557 kgGH structure, fertilizers, auxiliary equipmentNo[129]
30Mugnozza et al.Soilless GH, Pesticides: 85%, Soil cultivation GH, Pesticides: 53%Soil-less GH: heating systems, fertilizers; Soil-cultivation GH: pesticides, heating systems, fertilizersYes[92]
31Muñoz et al.0.0744 kgGH structureNo[109]
32Ntinas et al.Conventional heating system (Greece): 58.7 kg/m2 and 10.1 kg/kg; Hybrid solar energy saving system (Greece): 46.2 kg/m2 and 7.2 kg/kg. Standard variant (Germany): 10.6 kg/m2 and 0.7 kg/kg; IsoMax (Germany): 7.9 kg/m2 and 0.7 kg/kg; F-clean (Germany): 7.6 kg/m2 and 0.4 kg/kgnatural gas for heating, electricity, structure, electricity, fuelYes[20]
33Ntinas et al.Scenario 1—Conventional GH: 48.3 kg/m2, 2.5 kg/kg tomato; Scenario 2—Solar collector GH (no reused energy): 99.4 kg/m2, 4.1 kg/kg tomato; Scenario 3—Solar collector GH (reused energy): 47.5 kg/m2, 1.9 kg/kg tomato; Scenario 4—Solar collector GH (reused energy + excess energy transfer): −17.5 kg/m2, −0.7 kg/kg tomatoheating and structureBoth[45]
34Palma et al.France: 2.6987 kg; Turkey: 3.0635 kgpackaging and energy for steam production, fertilization (agriculture stage)Yes[35]
35Parada et al.Open management: 0.862 kg;
Recirculated management: 0.764 kg;
Recirculated management with further 15% freshwater input: 0.778 kg
fertilizers, energy, rainwater harvesting system, auxiliary equipment, structureNo[39]
36Pérez Neira et al.(Cradle-to-farm-gate) Heated: 1.33 kg; Unheated: 0.39 kg. (Cradle to regional distribution center) Heated: 2.07 kg; Unheated: 1.13 kguse of energy, infrastructure, fertilizersBoth[42]
37Röös et al.Sweden unheated: 0.22 kg CO2 eq/kg tomato; Sweden heated: 0.29 kg CO2 eq/kg tomato; Netherlands: 0.95 kg CO2 eq/kg tomato; Spain: 0.54 kg CO2 eq/kg tomatoeating non-seasonal, heated GH production, long-distance transportYes[54]
38Rufí-Salís et al.Closed-loop S0: 3.92 kg; Closed-loop S1: 2.42 kg; Closed-loop S2: 3.16 kg; Closed-loop S3: 1.91 kg; Linear system (no nutrient/water recovery): 2.58 kgclosed-loop system: iRTG structure, leachates system
linear system: rainwater harvesting surface, iRTG structure
No[130]
39Russo and MugnozzaGH soil: 90%; GH hydroponic: 100% energy consumption, steel, and glassNo[51]
40Russo et al.Rose soilless: 83% fossil fuel; Rose soil: 90%; Cyclamen: 63% baby plant productionheating fuel, baby plant productionYes[131]
41Russo et al.Farm A, Roses: 64% fuel; Farm B, Roses: 84% fuel; Farm C, Roses: 73% fuel; Farm D, Roses: 48%fuel, 45% structure; Farm E, Roses: 90% fuel; Farm F, Cyclamens: 62% Baby plant; Farm G, Cyclamens: 64% Baby plantroses: heating fuel, electricity, fertilizers, packaging, pesticides.
cyclamen: baby plant, electricity, fertilizers, packaging, pesticides
Yes[41]
42Sanjuan-Delmas et al.Spring crop 1: 0.61 kg; Winter crop: 1.41 kg; Spring crop 2: 0.56 kgconstruction of the rainwater harvesting system, and fertilizersNo[38]
43Sanyé-Mengual et al.(a) 2.42 kg (b) 0.216 kg (c) 0.78 kgstructure materials, maintenance stagesNo[48]
44Soode et al.0.1–10.2 kgcustomer shopping trip by private car, energy for product cleaning, electricity, heating, soil managementYes[132]
45Soode et al.PAS 2050:2011: 0.45–0.5 kg; ISO 14067: 0.53–0.58 kg; PARS 2011: 0.53–0.59 kgproduction of poinsettia plant, electricityYes[59]
46Soode-Schimonsky et al.3.53 kgelectricity for cooling/heating and the use of agricultural machinery including fuel burningYes[36]
47Stanjko et al.Geothermal: 0.018 kg; Natural gas: 0.5255 kgheating with natural gasYes[65]
48Torrellas et al.250 kgstructure, fertilizers, auxiliary equipmentNo[108]
49aTorrellas et al.250 kgstructure, climate control system, auxiliary equipment, and fertilizersYes[89]
49b\\Thermal energy: 440 kg; Natural gas; 5000 kg\\\\\\
49c\\Avoided electricity at CHP: 780 kg; Energy allocation at CHP: 2000 kg\\\\\\
49d\\1600 kg\\\\\\
50Torres et al.GH tomato: 293 gGH structure, fertilizers, and transportNo[62]
51Vermeulen and van der LansOrganic with CHP: 888 kg; Conventional with CHP: 784 kg; Conventional: 1760 kg; Organic: 1941 kggas boiler, gas CHP, fertilizer, transportYes[52]
52Wandl and HaberlCyclamen: 5.6 kg/piece; Amaryllis–Azalea: 3.6 kg/piece; Iris: 0.4 kg/day of floweringheating energy requirements, substrate, fuelYes[76]

References

  1. Steer, A. Resource Depletion, Climate Change, and Economic Growth. In Towards a Better Global Economy: Policy Implications for Citizens Worldwide in the 21st Century; University of Oxford: Oxford, UK, 2014; Volume 381. [Google Scholar]
  2. Fetting, C. The European Green Deal, ESDN Report; ESDN Office: Vienna, Austria, 2020. [Google Scholar]
  3. Chen, J.; Chepeliev, M.; Garcia-Marcia, D.; Iakova, D.; Roaf, J.; Shabunina, A.; van der Mensbrugghe, D.; Wingender, P. EU Climate Mitigation Policy; International Monetary Fund: Washington, DC, USA, 2020; ISBN 9781513552569. [Google Scholar]
  4. Bohringer, C. The Kyoto Protocol: A Review and Perspectives. Oxf. Rev. Econ. Policy 2003, 19, 451–466. [Google Scholar] [CrossRef]
  5. Parker, L. CRS Report for Congress Climate Change and the EU Emissions Trading Scheme (ETS): Looking to 2020; Congressional Research Service: Washington, DC, USA, 2010.
  6. European Environment Agency Technical Background Document-Accompanying the Report Trends and Projections in Europe 2021. 2021. Available online: https://www.eea.europa.eu/publications/trends-and-projections-in-europe-2021/technical-background-document (accessed on 5 October 2023).
  7. United Nations/Framework Convention on Climate Change. Adoption of the Paris Agreement. In Proceedings of the 21st Conference of the Parties, Paris, France, 30 November–12 December 2015. [Google Scholar]
  8. European Commission. The European Green Deal; European Commission: Luxembourg, 2019. [Google Scholar]
  9. Sikora, A. European Green Deal–Legal and Financial Challenges of the Climate Change. ERA Forum 2021, 21, 681–697. [Google Scholar] [CrossRef]
  10. Cifuentes-Faura, J. European Union Policies and Their Role in Combating Climate Change over the Years. Air. Qual. Atmos Health 2022, 15, 1333–1340. [Google Scholar] [CrossRef] [PubMed]
  11. European Council European Green Deal. Consilium. Available online: https://www.consilium.europa.eu/en/policies/green-deal/ (accessed on 30 October 2023).
  12. Dyrhauge, H.; Kurze, K. Making the European Green Deal Work; Taylor & Francis Ltd.: London, UK, 2023. [Google Scholar]
  13. Sandri, S.; Hussein, H.; Alshyab, N.; Sagatowski, J. The European Green Deal: Challenges and Opportunities for the Southern Mediterranean. In Mediterranean Politics; Taylor & Francis Ltd.: London, UK, 2023. [Google Scholar] [CrossRef]
  14. European Environment Agency Greenhouse Gas Emissions from Agriculture in Europe. Available online: https://www.eea.europa.eu/en/analysis/indicators/greenhouse-gas-emissions-from-agriculture?activeAccordion= (accessed on 30 October 2023).
  15. European Commission Effort Sharing 2021–2030: Targets and Flexibilities. Available online: https://climate.ec.europa.eu/eu-action/effort-sharing-member-states-emission-targets/effort-sharing-2021-2030-targets-and-flexibilities_en#documents (accessed on 30 October 2023).
  16. Dar, A.A.; Hameed, J.; Huo, C.; Sarfraz, M.; Albasher, G.; Wang, C.; Nawaz, A. Recent Optimization and Panelizing Measures for Green Energy Projects; Insights into CO2 Emission Influencing to Circular Economy. Fuel 2022, 314, 123094. [Google Scholar] [CrossRef]
  17. Pomoni, D.I.; Koukou, M.K.; Vrachopoulos, M.G.; Vasiliadis, L. A Review of Hydroponics and Conventional Agriculture Based on Energy and Water Consumption, Environmental Impact, and Land Use. Energies 2023, 16, 1690. [Google Scholar] [CrossRef]
  18. Vatistas, C.; Avgoustaki, D.D.; Bartzanas, T. A Systematic Literature Review on Controlled-Environment Agriculture: How Vertical Farms and Greenhouses Can Influence the Sustainability and Footprint of Urban Microclimate with Local Food Production. Atmosphere 2022, 13, 1258. [Google Scholar] [CrossRef]
  19. Fernández, J.A.; Orsini, F.; Baeza, E.; Oztekin, G.B.; Muñoz, P.; Contreras, J.; Montero, J.I. Current Trends in Protected Cultivation in Mediterranean Climates. Eur. J. Hortic. Sci. 2018, 83, 294–305. [Google Scholar] [CrossRef]
  20. Ntinas, G.K.; Neumair, M.; Tsadilas, C.D.; Meyer, J. Carbon Footprint and Cumulative Energy Demand of Greenhouse and Open-Field Tomato Cultivation Systems under Southern and Central European Climatic Conditions. J. Clean. Prod. 2017, 142, 3617–3626. [Google Scholar] [CrossRef]
  21. Morin, A.; Katsoulas, N.; Desimpelaere, K.; Karkalainen, S.; Schneegans, A. EIP-AGRI Focus Group Circular Horticulture. 2017. Available online: https://ec.europa.eu/eip/agriculture/sites/default/files/eip-agri_fg_circular_horticulture_starting_paper_2017_en.pdf (accessed on 5 November 2023).
  22. Aznar-Sánchez, J.A.; Velasco-Muñoz, J.F.; García-Arca, D.; López-Felices, B. Identification of Opportunities for Applying the Circular Economy to Intensive Agriculture in Almería (South-East Spain). Agronomy 2020, 10, 1499. [Google Scholar] [CrossRef]
  23. Timpanaro, G.; Urso, A.; Prato, C.; Foti, V.T. Evaluating the Potential for Development of Vegetable Nursery Industry: Analysis in an Important Vegetable Region in Italy. Am. J. Agric. Biol. Sci. 2015, 10, 74–82. [Google Scholar] [CrossRef]
  24. Girgenti, V.; Peano, C.; Baudino, C.; Tecco, N. From “Farm to Fork” Strawberry System: Current Realities and Potential Innovative Scenarios from Life Cycle Assessment of Non-Renewable Energy Use and Green House Gas Emissions. Sci. Total Environ. 2014, 473–474, 48–53. [Google Scholar] [CrossRef] [PubMed]
  25. ISO 14040:2006; Environmental Management-Life Cycle Assessment-Principles and Framework (ISO 14040). International Organization for Standardization: Geneva, Switzerland, 2006.
  26. Chainho, P.; Matos, H.A. Process Analysis Using Umberto Carbon Footprint Tool. In Computer Aided Chemical Engineering; Elsevier: Amsterdam, The Netherlands, 2012; pp. 810–814. [Google Scholar]
  27. Donthu, N.; Kumar, S.; Mukherjee, D.; Pandey, N.; Lim, W.M. How to Conduct a Bibliometric Analysis: An Overview and Guidelines. J. Bus. Res. 2021, 133, 285–296. [Google Scholar] [CrossRef]
  28. Grant, M.J.; Booth, A. A Typology of Reviews: An Analysis of 14 Review Types and Associated Methodologies. Health Inf. Libr. J. 2009, 26, 91–108. [Google Scholar] [CrossRef] [PubMed]
  29. Bibliometrix Biblioshiny. Available online: https://www.bibliometrix.org/home/index.php/layout/biblioshiny (accessed on 31 October 2023).
  30. K-Synth Srl Bibliometrix. Available online: https://www.bibliometrix.org/home/index.php (accessed on 31 October 2023).
  31. Leiden University Visualizing Scientific Landscapes. Available online: https://www.vosviewer.com/ (accessed on 31 October 2023).
  32. Callon, M.; Courtial, J.P.; Laville, F. Co-Word Analysis as a Tool for Describing the Network of Interactions between Basic and Technological Research: The Case of Polymer Chemsitry. Scientometrics 1991, 22, 155–205. [Google Scholar] [CrossRef]
  33. Zhang, Y.; Hua, W.; Yuan, S. Mapping the Scientific Research on Open Data: A Bibliometric Review. Learn. Publ. 2018, 31, 95–106. [Google Scholar] [CrossRef]
  34. Cobo, M.J.; López-Herrera, A.G.; Herrera-Viedma, E.; Herrera, F. An Approach for Detecting, Quantifying, and Visualizing the Evolution of a Research Field: A Practical Application to the Fuzzy Sets Theory Field. J. Informetr. 2011, 5, 146–166. [Google Scholar] [CrossRef]
  35. Palma, G.; Padilla, M.; Saheb, M.; Tatar, Y.; Tugulay, A.; Kellou, I.; Colvine, S. Environmental Impact of Processed Tomato in France and in Turkey. In Proceedings of the 9th International Conference on Life Cycle Assessment in the Agri-Food Sector (LCA Food 2014), San Francisco, CA, USA, 8–10 October 2014. [Google Scholar]
  36. Soode-Schimonsky, E.; Richter, K.; Weber-Blaschke, G. Product Environmental Footprint of Strawberries: Case Studies in Estonia and Germany. J. Environ. Manag. 2017, 203, 564–577. [Google Scholar] [CrossRef]
  37. Bartzas, G.; Zaharaki, D.; Komnitsas, K. Life Cycle Assessment of Open Field and Greenhouse Cultivation of Lettuce and Barley. Inf. Process. Agric. 2015, 2, 191–207. [Google Scholar] [CrossRef]
  38. Sanjuan-Delmás, D.; Llorach-Massana, P.; Nadal, A.; Ercilla-Montserrat, M.; Muñoz, P.; Montero, J.I.; Josa, A.; Gabarrell, X.; Rieradevall, J. Environmental Assessment of an Integrated Rooftop Greenhouse for Food Production in Cities. J. Clean. Prod. 2018, 177, 326–337. [Google Scholar] [CrossRef]
  39. Parada, F.; Gabarrell, X.; Rufí-Salís, M.; Arcas-Pilz, V.; Muñoz, P.; Villalba, G. Optimizing Irrigation in Urban Agriculture for Tomato Crops in Rooftop Greenhouses. Sci. Total Environ. 2021, 794, 148689. [Google Scholar] [CrossRef]
  40. Baptista, F.J.; Murcho, D.; Silva, L.L.; Stanghellini, C.; Montero, J.I.; Kempkes, F.; Munoz, P.; Gilli, C.; Giuffrida, F.; Stepowska, A. Assessment of Energy Consumption in Organic Tomato Greenhouse Production-a Case Study. In Proceedings of the Acta Horticulturae: III International Symposium on Organic Greenhouse Horticulture, Izmir, Turkey, 30 June 2017; Volume 1164, pp. 453–460. [Google Scholar]
  41. Russo, G.; Buttol, P.; Tarantini, M. LCA (Life Cycle Assessment) of Roses and Cyclamens in Greenhouse Cultivation. In Proceedings of the International Symposium on High Technology for Greenhouse System Management: Greensys 2007, Naples, Italy, 4–6 October 2007; Volume 801, pp. 359–366. [Google Scholar]
  42. Pérez Neira, D.; Soler Montiel, M.; Delgado Cabeza, M.; Reigada, A. Energy Use and Carbon Footprint of the Tomato Production in Heated Multi-Tunnel Greenhouses in Almeria within an Exporting Agri-Food System Context. Sci. Total Environ. 2018, 628–629, 1627–1636. [Google Scholar] [CrossRef] [PubMed]
  43. Lazzerini, G.; Lucchetti, S.; Nicese, F.P. Green House Gases(GHG) Emissions from the Ornamental Plant Nursery Industry: A Life Cycle Assessment(LCA) Approach in a Nursery District in Central Italy. J. Clean. Prod. 2016, 112, 4022–4030. [Google Scholar] [CrossRef]
  44. European Commission. The Tomato Market in the EU. In Vol. 1: Production and Area Statistics; European Commission: Luxembourg, 2022. [Google Scholar]
  45. Ntinas, G.K.; Dannehl, D.; Schuch, I.; Rocksch, T.; Schmidt, U. Sustainable Greenhouse Production with Minimised Carbon Footprint by Energy Export. Biosyst. Eng. 2020, 189, 164–178. [Google Scholar] [CrossRef]
  46. Fusi, A.; Castellani, V.; Bacenetti, J.; Cocetta, G.; Fiala, M.; Guidetti, R. The Environmental Impact of the Production of Fresh Cut Salad: A Case Study in Italy. Int. J. Life Cycle Assess. 2016, 21, 162–175. [Google Scholar] [CrossRef]
  47. Barla, S.A.; Salachas, G.; Abeliotis, K. Assessment of the Greenhouse Gas Emissions from Aeroponic Lettuce Cultivation in Greece. EuroMediterr. J. Env. Integr. 2020, 5, 29. [Google Scholar] [CrossRef]
  48. Sanyé-Mengual, E.; Oliver-Solà, J.; Montero, J.I.; Rieradevall, J. An Environmental and Economic Life Cycle Assessment of Rooftop Greenhouse (RTG) Implementation in Barcelona, Spain. Assessing New Forms of Urban Agriculture from the Greenhouse Structure to the Final Product Level. Int. J. Life Cycle Assess. 2015, 20, 350–366. [Google Scholar] [CrossRef]
  49. Martínez-Blanco, J.; Muñoz, P.; Antón, A.; Rieradevall, J. Assessment of Tomato Mediterranean Production in Open-Field and Standard Multi-Tunnel Greenhouse, with Compost or Mineral Fertilizers, from an Agricultural and Environmental Standpoint. J. Clean. Prod. 2011, 19, 985–997. [Google Scholar] [CrossRef]
  50. Almeida, J.; Achten, W.M.J.; Verbist, B.; Heuts, R.F.; Schrevens, E.; Muys, B. Carbon and Water Footprints and Energy Use of Greenhouse Tomato Production in Northern Italy. J. Ind. Ecol. 2014, 18, 898–908. [Google Scholar] [CrossRef]
  51. Russo, G.; Scarascia Mugnozza, G. LCA Methodology Applied to Various Typology of Greenhouses. In Proceedings of the International Conference on Sustainable Greenhouse Systems-Greensys 2004, Leuven, Belgium, 12–16 September 2005; Volume 691, pp. 837–844. [Google Scholar]
  52. Vermeulen, P.C.M.; Van Der Lans, C.J.M. Combined Heat and Power (CHP) as a Possible Method for Reduction of the CO2 Footprint of Organic Greenhouse Horticulture. In Proceedings of the I International Conference on Organic Greenhouse Horticulture, Bleiswijk, The Netherlands, 25 November 2011; Volume 915, pp. 61–68. [Google Scholar]
  53. Blom, T.; Jenkins, A.; Pulselli, R.M.; van den Dobbelsteen, A.A.J.F. The Embodied Carbon Emissions of Lettuce Production in Vertical Farming, Greenhouse Horticulture, and Open-Field Farming in The Netherlands. J. Clean. Prod. 2022, 377, 134443. [Google Scholar] [CrossRef]
  54. Röös, E.; Karlsson, H. Effect of Eating Seasonal on the Carbon Footprint of Swedish Vegetable Consumption. J. Clean. Prod. 2013, 59, 63–72. [Google Scholar] [CrossRef]
  55. ISO 14043; Environmental Management, Life Cycle Assessment, Life Cycle Interpretation. International Organisation for Standardisation: Geneva, Switzerland, 2000.
  56. ISO 14044:2006; Environmental Management—Life Cycle Assessment—Requirements and Guidelines. International Organisation for Standardisation: Geneva, Switzerland, 2006.
  57. ISO 14067:2018; Greenhouse Gases—Carbon Footprint of Products—Requirements and Guidelines for Quantification. International Organisation for Standardisation: Geneva, Switzerland, 2018.
  58. British Standards Institution. The Guide to PAS 2050:2011: How to Carbon Footprint Your Products, Identify Hotspots and Reduce Emissions in Your Supply Chain; BSI: London, UK, 2011; ISBN 9780580774324. [Google Scholar]
  59. Soode, E.; Weber-Blaschke, G.; Richter, K. Comparison of Product Carbon Footprint Standards with a Case Study on Poinsettia (Euphorbia Pulcherrima). Int. J. Life Cycle Assess. 2013, 18, 1280–1290. [Google Scholar] [CrossRef]
  60. Lampert, P.; Menrad, K. Sustainable Star? The Carbon Footprint of Christmas Stars and Its Variability along the Value Chain. Sustainability 2023, 15, 82. [Google Scholar] [CrossRef]
  61. Bonaguro, J.E.; Coletto, L.; Samuele, B.; Zanin, G.; Sambo, P. Environmental Impact in Floriculture: LCA Approach at Farm Level. In Proceedings of the XXIX International Horticultural Congress on Horticulture, Brisbane, Australia, 22 March 2016; Volume 1112, pp. 419–424. [Google Scholar]
  62. Torres, C.M.; Antón, A.; Ferrer, F.; Castells, F. Greenhouse Gas Calculator at Farm Level Addressed to the Growers. Int. J. Life Cycle Assess. 2017, 22, 537–545. [Google Scholar] [CrossRef]
  63. European Commission. Joint Research Centre. Institute for Environment and Sustainability. In International Reference Life Cycle Data System (ILCD) Handbook General Guide for Life Cycle Assessment: Detailed Guidance; Publications Office: Luxembourg, 2010; ISBN 9789279190926. [Google Scholar]
  64. Buendia, C.; Tanabe, E.; Kranjc, K.; Baasansuren, A.; Fukuda, J.; Ngarize, M.; Osako, S.; Pyrozhenko, A. 2019 Refinement to the 2006 IPCC Guidelines for National Greenhouse Gas Inventories Task Force on National Greenhouse Gas Inventories; Intergovernmental Panel on Climate Change: Geneva, Switzerland, 2019; ISBN 978-4-88788-232-4.
  65. Stajnko, D.; Berk, P.; Vindis, P.; Lakota, M. Decreasing Impact of Tomato Production by Introducing Renewable Energy. In DAAAM International Scientific Book; EBSCO: Ipswich, MA, USA, 2016; pp. 49–58. [Google Scholar]
  66. Narodoslawsky, M. Sustainable Process Index. In Assessing and Measuring Environmental Impact and Sustainability; Elsevier: Amsterdam, The Netherlands, 2015; pp. 73–86. [Google Scholar]
  67. Swiss Centre for Life Cycle Inventories Ecoinvent Database. Available online: https://ecoinvent.org/ (accessed on 10 November 2023).
  68. Sphera Solutions GaBi Software. Available online: https://sphera.com/ (accessed on 10 November 2023).
  69. Lopes Silva, D.A.; Nunes, A.O.; Piekarski, C.M.; da Silva Moris, V.A.; de Souza, L.S.M.; Rodrigues, T.O. Why Using Different Life Cycle Assessment Software Tools Can Generate Different Results for the Same Product System? A Cause–Effect Analysis of the Problem. Sustain. Prod. Consum. 2019, 20, 304–315. [Google Scholar] [CrossRef]
  70. Speck, R.; Selke, S.; Auras, R.; Fitzsimmons, J. Life Cycle Assessment Software: Selection Can Impact Results. J. Ind. Ecol. 2016, 20, 18–28. [Google Scholar] [CrossRef]
  71. Herrmann, I.T.; Moltesen, A. Does It Matter Which Life Cycle Assessment (LCA) Tool You Choose?—A Comparative Assessment of SimaPro and GaBi. J. Clean. Prod. 2015, 86, 163–169. [Google Scholar] [CrossRef]
  72. Schau, E.M.; Fet, A.M. LCA Studies of Food Products as Background for Environmental Product Declarations. Int. J. Life Cycle Assess. 2008, 13, 255–264. [Google Scholar] [CrossRef]
  73. Weidema, B.; Wenzel, H.; Econet, C.P.; Hansen, K. The Product, Functional Unit and Reference Flows in LCA; Danish Ministry of the Environment: København, Denmark, 2004.
  74. Martin-Gorriz, B.; Maestre-Valero, J.F.; Gallego-Elvira, B.; Marín-Membrive, P.; Terrero, P.; Martínez-Alvarez, V. Recycling Drainage Effluents Using Reverse Osmosis Powered by Photovoltaic Solar Energy in Hydroponic Tomato Production: Environmental Footprint Analysis. J. Environ. Manag. 2021, 297, 113326. [Google Scholar] [CrossRef]
  75. Grabarczyk, R.; Grabarczyk, S. Cumulative Energy Demand and Carbon Footprint of the Greenhouse Cultivation System. Appl. Sci. 2022, 12, 8786. [Google Scholar] [CrossRef]
  76. Wandl, M.T.; Haberl, H. Greenhouse Gas Emissions of Small Scale Ornamental Plant Production in Austria-A Case Study. J. Clean. Prod. 2017, 141, 1123–1133. [Google Scholar] [CrossRef]
  77. Kim, S.J.; Kara, S.; Hauschild, M. Functional Unit and Product Functionality—Addressing Increase in Consumption and Demand for Functionality in Sustainability Assessment with LCA. Int. J. Life Cycle Assess. 2017, 22, 1257–1265. [Google Scholar] [CrossRef]
  78. Ross, S.A.; Topp, C.F.E.; Ennos, R.A.; Chagunda, M.G.G. Relative Emissions Intensity of Dairy Production Systems: Employing Different Functional Units in Life-Cycle Assessment. Animal 2017, 11, 1381–1388. [Google Scholar] [CrossRef] [PubMed]
  79. Kokare, S.; Oliveira, J.P.; Godina, R. Life Cycle Assessment of Additive Manufacturing Processes: A Review. J. Manuf. Syst. 2023, 68, 536–559. [Google Scholar] [CrossRef]
  80. Li, T.; Zhang, H.; Liu, Z.; Ke, Q.; Alting, L. A System Boundary Identification Method for Life Cycle Assessment. Int. J. Life Cycle Assess. 2014, 19, 646–660. [Google Scholar] [CrossRef]
  81. Suh, S.; Lenzen, M.; Treloar, G.J.; Hondo, H.; Horvath, A.; Huppes, G.; Jolliet, O.; Klann, U.; Krewitt, W.; Moriguchi, Y.; et al. System Boundary Selection in Life-Cycle Inventories Using Hybrid Approaches. Environ. Sci. Technol. 2004, 38, 657–664. [Google Scholar] [CrossRef] [PubMed]
  82. Roer, A.G.; Korsaeth, A.; Henriksen, T.M.; Michelsen, O.; Strømman, A.H. The Influence of System Boundaries on Life Cycle Assessment of Grain Production in Central Southeast Norway. Agric. Syst. 2012, 111, 75–84. [Google Scholar] [CrossRef]
  83. Cherubini, E.; Franco, D.; Zanghelini, G.M.; Soares, S.R. Uncertainty in LCA Case Study Due to Allocation Approaches and Life Cycle Impact Assessment Methods. Int. J. Life Cycle Assess. 2018, 23, 2055–2070. [Google Scholar] [CrossRef]
  84. Renou, S.; Thomas, J.S.; Aoustin, E.; Pons, M.N. Influence of Impact Assessment Methods in Wastewater Treatment LCA. J. Clean. Prod. 2008, 16, 1098–1105. [Google Scholar] [CrossRef]
  85. Rejane, M.R.; Zortea, R.; Mendez, M.C.A.; Espinoza, M.R.C. New Frontiers on Life Cycle Assessment-Theory and Application; Petrillo, A., De Felice, F., Eds.; IntechOpen: London, UK, 2019; ISBN 978-1-83880-693-4. [Google Scholar]
  86. Alhashim, R.; Deepa, R.; Anandhi, A. Environmental Impact Assessment of Agricultural Production Using Lca: A Review. Climate 2021, 9, 164. [Google Scholar] [CrossRef]
  87. European Commission. Joint Research Centre. Institute for Environment and Sustainability. In International Reference Life Cycle Data System (ILCD) Handbook General Guide for Life Cycle Assessment: Provisions and Action Steps; Publications Office: Luxembourg, 2011; ISBN 9789279174513. [Google Scholar]
  88. Antón, A.; Torrellas, M.; Núñez, M.; Sevigné, E.; Amores, M.J.; Muñoz, P.; Montero, J.I. Improvement of Agricultural Life Cycle Assessment Studies through Spatial Differentiation and New Impact Categories: Case Study on Greenhouse Tomato Production. Environ. Sci. Technol. 2014, 48, 9454–9462. [Google Scholar] [CrossRef]
  89. Torrellas, M.; Antón, A.; Ruijs, M.; García Victoria, N.; Stanghellini, C.; Montero, J.I. Environmental and Economic Assessment of Protected Crops in Four European Scenarios. J. Clean. Prod. 2012, 28, 45–55. [Google Scholar] [CrossRef]
  90. Bosona, T.; Gebresenbet, G. Life Cycle Analysis of Organic Tomato Production and Supply in Sweden. J. Clean. Prod. 2018, 196, 635–643. [Google Scholar] [CrossRef]
  91. Canaj, K.; Parente, A.; D’imperio, M.; Boari, F.; Buono, V.; Toriello, M.; Mehmeti, A.; Montesano, F.F. Can Precise Irrigation Support the Sustainability of Protected Cultivation? A Life-Cycle Assessment and Life-Cycle Cost Analysis. Water 2022, 14, 6. [Google Scholar] [CrossRef]
  92. Mugnozza, G.S.; Russo, G.; De, B.; Zeller, L. LCA Methodology Application in Flower Protected Cultivation. In Proceedings of the XXVII International Horticultural Congress-IHC 2006: International Symposium on Advances in Environmental Control, Automation, Seoul, Republic of Korea, 13 August 2007. [Google Scholar]
  93. Ouazzani Chahidi, L.; Fossa, M.; Priarone, A.; Mechaqrane, A. Energy Saving Strategies in Sustainable Greenhouse Cultivation in the Mediterranean Climate–A Case Study. Appl. Energy 2021, 282, 116156. [Google Scholar] [CrossRef]
  94. Barbaresi, A.; Maioli, V.; Bovo, M.; Tinti, F.; Torreggiani, D.; Tassinari, P. Application of Basket Geothermal Heat Exchangers for Sustainable Greenhouse Cultivation. Renew. Sustain. Energy Rev. 2020, 129, 109928. [Google Scholar] [CrossRef]
  95. Boulard, T.; Raeppel, C.; Brun, R.; Lecompte, F.; Hayer, F.; Carmassi, G.; Gaillard, G. Environmental Impact of Greenhouse Tomato Production in France. Agron. Sustain. Dev. 2011, 31, 757–777. [Google Scholar] [CrossRef]
  96. Benis, K.; Reinhart, C.; Ferrão, P. Building-Integrated Agriculture (Bia) in Urban Contexts: Testing a Simulation-Based Decision Support Workflow. In Proceedings of the Building Simulation Conference Proceedings, San Francisco, CA, USA, 7–9 August 2017; Volume 5, pp. 2337–2346. [Google Scholar]
  97. Antón, A.; Torrellas, M.; Raya, V.; Montero, J.I. Modelling the Amount of Materials to Improve Inventory Datasets of Greenhouse Infrastructures. Int. J. Life Cycle Assess. 2014, 19, 29–41. [Google Scholar] [CrossRef]
  98. Nadal, A.; Llorach-Massana, P.; Cuerva, E.; López-Capel, E.; Montero, J.I.; Josa, A.; Rieradevall, J.; Royapoor, M. Building-Integrated Rooftop Greenhouses: An Energy and Environmental Assessment in the Mediterranean Context. Appl. Energy 2017, 187, 338–351. [Google Scholar] [CrossRef]
  99. Katzin, D.; Marcelis, L.F.M.; van Mourik, S. Energy Savings in Greenhouses by Transition from High-Pressure Sodium to LED Lighting. Appl. Energy 2021, 281, 116019. [Google Scholar] [CrossRef]
  100. Bonaguro, J.E.; Coletto, L.; Zanin, G. Environmental and Agronomic Performance of Fresh Rice Hulls Used as Growing Medium Component for Cyclamen persicum L. Pot Plants. J. Clean. Prod. 2017, 142, 2125–2132. [Google Scholar] [CrossRef]
  101. Vinci, G.; Rapa, M. Hydroponic Cultivation: Life Cycle Assessment of Substrate Choice. Br. Food J. 2019, 121, 1801–1812. [Google Scholar] [CrossRef]
  102. Antón, A.; Torrellas, M.; Montero, J.I.; Ruijs, M.; Vermeulen, P.; Stanghellini, C. Environmental Impact Assessment of Dutch Tomato Crop Production in a Venlo Glasshouse. In Proceedings of the XXVIII International Horticultural Congress on Science and Horticulture for People (IHC2010), Lisbon, Portugal, 22–27 August 2010. [Google Scholar]
  103. Frem, M.; Fucilli, V.; Petrontino, A.; Acciani, C.; Bianchi, R.; Bozzo, F. Nursery Plant Production Models under Quarantine Pests’ Outbreak: Assessing the Environmental Implications and Economic Viability. Agronomy 2022, 12, 2964. [Google Scholar] [CrossRef]
  104. Antón, A.; Montero, J.I.; Muñoz, P.; Castells, F. LCA and Tomato Production in Mediterranean Greenhouses. Int. J. Agric. Resour. Gov. Ecol. 2005, 4, 102–112. [Google Scholar] [CrossRef]
  105. Abeliotis, K.; Barla, S.A.; Detsis, V.; Malindretos, G. Life Cycle Assessment of Carnation Production in Greece. J. Clean. Prod. 2016, 112, 32–38. [Google Scholar] [CrossRef]
  106. Rasines, L.; Miguel, G.S.; Molina-García, Á.; Artés-Hernández, F.; Hontoria, E.; Aguayo, E. Optimizing the Environmental Sustainability of Alternative Post-Harvest Scenarios for Fresh Vegetables: A Case Study in Spain. Sci. Total Environ. 2023, 860, 160422. [Google Scholar] [CrossRef] [PubMed]
  107. Cellura, M.; Longo, S.; Mistretta, M. Life Cycle Assessment (LCA) of Protected Crops: An Italian Case Study. J. Clean. Prod. 2012, 28, 56–62. [Google Scholar] [CrossRef]
  108. Torrellas, M.; Antón, A.; López, J.C.; Baeza, E.J.; Parra, J.P.; Muñoz, P.; Montero, J.I. LCA of a Tomato Crop in a Multi-Tunnel Greenhouse in Almeria. Int. J. Life Cycle Assess. 2012, 17, 863–875. [Google Scholar] [CrossRef]
  109. Muñoz, P.; Antón, A.; Nuñez, M.; Paranjpe, A.; Ariño, J.; Castells, X.; Montero, J.I.; Rieradevall, J. Comparing the Environmental Impacts of Greenhouse versus Open-Field Tomato Production in the Mediterranean Region. Acta Hortic. 2008, 801, 1591–1596. [Google Scholar] [CrossRef]
  110. Mendoza-Fernández, A.J.; Peña-Fernández, A.; Molina, L.; Aguilera, P.A. The Role of Technology in Greenhouse Agriculture: Towards a Sustainable Intensification in Campo de Dalías (Almería, Spain). Agronomy 2021, 11, 101. [Google Scholar] [CrossRef]
  111. Schuch, I.; Dannehl, D.; Miranda-Trujillo, L.; Rocksch, T.; Schmidt, U. ZINEG Project-Energetic Evaluation of a Solar Collector Greenhouse with above-Ground Heat Storage in Germany. Acta Hortic. 2014, 1037, 195–201. [Google Scholar] [CrossRef]
  112. Khan, J.; Johansson, B.; Hildingsson, R. Strategies for Greening the Economy in Three Nordic Countries. Environ. Policy Gov. 2021, 31, 592–604. [Google Scholar] [CrossRef]
  113. Narayanan, V.K.; O’Connor, G.C. Encyclopedia of Technology and Innovation Management; John Wiley & Sons Ltd.: Hoboken, NJ, USA, 2010; ISBN 978-1-405-16049-0. [Google Scholar]
  114. Donati, F.; Tukker, A. Environmental Pressures and Value Added Related to Imports and Exports of the Dutch Agricultural Sector. Sustainability 2022, 14, 6057. [Google Scholar] [CrossRef]
  115. Zhang, X.; Lazin, F.A. The Agricultural Cooperation Between China and Israel-Case Study of Projects in Shandong Province. Asian J. Middle East. Islam. Stud. 2023, 17, 106–126. [Google Scholar] [CrossRef]
  116. Costa, J.M.; Reis, M.; Passarinho, J.A.; Ferreira, M.E.; Almeida, D.P.F. Microeconomic and Environmental Sustainability of Portuguese Greenhouse Horticulture: A Critical Assessment. International Symposium on New Technologies and Management for Greenhouses-GreenSys 2015, Evora, Portugal, 19–23 July 2015; Volume 1170, pp. 1117–1123. [Google Scholar]
  117. Bogoslov, I.A.; Lungu, A.E.; Stoica, E.A.; Georgescu, M.R. European Green Deal Impact on Entrepreneurship and Competition: A Free Market Approach. Sustainability 2022, 14, 12335. [Google Scholar] [CrossRef]
  118. Ampatzoglou, A.; Ampatzoglou, A.; Chatzigeorgiou, A.; Avgeriou, P. The Financial Aspect of Managing Technical Debt: A Systematic Literature Review. Inform. Softw. Technol. 2015, 64, 52–73. [Google Scholar] [CrossRef]
  119. R Core Team R: A Language and Environment for Statistical Computing; R Core Team R: Vienna, Austria, 2013.
  120. Laurent, A.; Olsen, S.I.; Hauschild, M.Z. Limitations of Carbon Footprint as Indicator of Environmental Sustainability. Environ. Sci. Technol. 2012, 46, 4100–4108. [Google Scholar] [CrossRef]
  121. Chatzigeorgiou, I.; Liantas, G.; Spanos, P.; Gkriniari, V.; Maloupa, E.; Ntinas, G.K. Hydroponic Cultivation of Vine Leaves with Reduced Carbon Footprint in a Mediterranean Greenhouse. Sustainability 2022, 14, 8011. [Google Scholar] [CrossRef]
  122. Corcelli, F.; Fiorentino, G.; Petit-Boix, A.; Rieradevall, J.; Gabarrell, X. Transforming Rooftops into Productive Urban Spaces in the Mediterranean. An LCA Comparison of Agri-Urban Production and Photovoltaic Energy Generation. Resour. Conserv. Recycl. 2019, 144, 321–336. [Google Scholar] [CrossRef]
  123. De Lucia, B.; Cristiano, G.; Vecchietti, L.; Rea, E.; Russo, G. Nursery Growing Media: Agronomic and Environmental Quality Assessment of Sewage Sludge-Based Compost. Appl. Environ. Soil. Sci. 2013, 2013, 565139. [Google Scholar] [CrossRef]
  124. Falla, N.M.; Contu, S.; Demasi, S.; Caser, M.; Scariot, V. Environmental Impact of Edible Flower Production: A Case Study. Agronomy 2020, 10, 579. [Google Scholar] [CrossRef]
  125. García, J.G.; García, B.G. Sustainability Assessment of Greenhouse Pepper Production Scenarios in Southeastern Spain. Agronomy 2022, 12, 1254. [Google Scholar] [CrossRef]
  126. Ilari, A.; Duca, D. Energy and Environmental Sustainability of Nursery Step Finalized to “Fresh Cut” Salad Production by Means of LCA. Int. J. Life Cycle Assess. 2018, 23, 800–810. [Google Scholar] [CrossRef]
  127. Jukka, L.; Miika, M.; Lauri, L.; Mirja, M.; Ville, U.; Lassi, L. A Financial and Environmental Sustainability of Circular Bioeconomy: A Case Study of Short Rotation Coppice, Biochar and Greenhouse Production in Southern Finland. Biomass Bioenergy 2022, 163, 106524. [Google Scholar] [CrossRef]
  128. Marttila, M.P.; Uusitalo, V.; Linnanen, L.; Mikkilä, M.H. Agro-Industrial Symbiosis and Alternative Heating Systems for Decreasing the Global Warming Potential of Greenhouse Production. Sustainability 2021, 13, 9040. [Google Scholar] [CrossRef]
  129. Montero, J.I.; Teitel, M. Developments in Covering Materials for Intensive Horticulture: Technical Properties and Recycling Opportunities. Acta Hortic. 2014, 1015, 269–280. [Google Scholar] [CrossRef]
  130. Rufí-Salís, M.; Petit-Boix, A.; Villalba, G.; Sanjuan-Delmás, D.; Parada, F.; Ercilla-Montserrat, M.; Arcas-Pilz, V.; Muñoz-Liesa, J.; Rieradevall, J.; Gabarrell, X. Recirculating Water and Nutrients in Urban Agriculture: An Opportunity towards Environmental Sustainability and Water Use Efficiency? J. Clean. Prod. 2020, 261, 121213. [Google Scholar] [CrossRef]
  131. Russo, G.; Scarascia, G.; De, M.B.; Zeller, L. Environmental Improvements of Greenhouse Flower Cultivation by Means of LCA Methodology. Acta Hortic 2008, 801, 301–308. [Google Scholar] [CrossRef]
  132. Soode, E.; Lampert, P.; Weber-Blaschke, G.; Richter, K. Carbon Footprints of the Horticultural Products Strawberries, Asparagus, Roses and Orchids in Germany. J. Clean. Prod. 2015, 87, 168–179. [Google Scholar] [CrossRef]
Figure 1. Final studies selection process.
Sustainability 16 00191 g001
Figure 2. Annual scientific production of studies in EU related to the GH CF.
Sustainability 16 00191 g002
Figure 3. Countries with most articles produced.
Sustainability 16 00191 g003
Figure 4. Country production of articles over time.
Sustainability 16 00191 g004
Figure 5. Collaboration network between EU countries that produce research in the GH CF.
Sustainability 16 00191 g005
Figure 6. Thematic clusters of the collected studies.
Sustainability 16 00191 g006
Figure 7. Co-occurrence network of author and index keywords.
Sustainability 16 00191 g007
Table 1. Bibliometric analysis setup.
GoalMethodologyMetadata
Descriptive information regarding collected studiesDescriptive statistics, plotsDocument number, sources, publication year, document citations, author keywords, keywords plus
Country-wise research landscapeDescriptive statisticsAuthor countries
Citation analysisDocument citations
Collaboration networksAuthor countries
Thematic axes from collected studiesCo-word analysis clusteringAuthor keywords
Cooccurrence networksAuthor keywords, keywords plus
Table 2. Basic information of the selected studies.
Main Information
Timespan2005:2023
Sources (Journals, Books, etc.)17
Documents50
Document Average Age7
Annual Growth Rate (%)−3.78
Average Citations Per Document37.1
Total References2008
Journal Papers41
Conference Papers9
Document Contents
Keywords Plus450
Author Keywords187
Authors and Author Collaboration
Total Authors164
Authors of Single-Authored Docs0
Single-authored docs0
Co-Authors Per Document4.44
Table 3. Most active journals.
Journal NameNumber of Articles
Journal of Cleaner Production14
Acta Horticulturae10
The International Journal of Life Cycle Assessment6
Agronomy3
Sustainability3
Journal of Environmental Management2
Science of the Total Environment2
Applied and Environmental Soil Science1
Applied Sciences1
Table 4. Number of citations of the most cited articles.
ArticleNumber of Citations
CELLURA M, 2012, J CLEAN PROD [107]149
TORRELLAS M, 2012, INT J LIFE CYCLE ASSESS [108]141
SANYÉ-MENGUAL E, 2015, INT J LIFE CYCLE ASSESS [48]133
MARTÍNEZ-BLANCO J, 2011, J CLEAN PROD [49]131
TORRELLAS M, 2012, J CLEAN PROD [89]109
SANJUAN-DELMÁS D, 2018, J CLEAN PROD [38]95
ANTÓN A, 2005, INT J AGRIC RESOUR GOV ECOL [104]86
NTINAS GK, 2017, J CLEAN PROD [20]82
BARTZAS G, 2015, INF PROCESS AGRIC [37]71
MUÑOZ P, 2008, ACTA HORTIC [109]64
Table 5. Number of countries’ studies citations.
CountryNumber of Citations
Spain835
Italy359
Germany167
Greece112
Sweden108
Disclaimer/Publisher’s Note: The statements, opinions and data contained in all publications are solely those of the individual author(s) and contributor(s) and not of MDPI and/or the editor(s). MDPI and/or the editor(s) disclaim responsibility for any injury to people or property resulting from any ideas, methods, instructions or products referred to in the content.

