Abstract
The transfer system has an extremely important influence on the operation management and economic benefits of the whole rail network. The paper selects evaluation indexes based on the analysis of transfer system time value influencing factors, excludes part of the indexes by using importance analysis and correlation analysis, and constructs the evaluation index system of rail transit transfer system using the STATA 16 software. Using a combination of the analytic hierarchy process (AHP) and CRITIC method, the evaluation indexes were comprehensively assigned. The time value evaluation model was established based on the matter-element extension evaluation model. Finally, Wuhan rail transit transfer stations Dazhi Road Station and Xunlimen Station are selected as examples for empirical analysis, and improvement measures are proposed. Unlike previous studies, this study introduces time value as a core indicator and uses a matter-element extension evaluation model for evaluation. Empirical analyses show that the proposed evaluation index system based on time value can better reflect the passenger experience as well as the efficiency of the transfer system. The selected matter-element extension evaluation model can better deal with the uncertainty between indicators and solve the multi-objective contradiction problem. The evaluation results of the model are consistent with the actual research results of the transfer station, and the evaluation model has better applicability.
1. Introduction
With the growth of per capita motor vehicle ownership and road traffic in China, the problem of road traffic congestion is becoming increasingly obvious, and there is an urgent need to prioritize the development of the public transport system to improve the utilization of transport resources and alleviate traffic congestion [1,2]. Urban rail transit has the characteristics of an exclusive right of way, high capacity, high environmental protection, punctuality, high efficiency, and comfort, etc. [3]; it belongs to public transport, which is recognized as green transport in the world and a mode of sustainable development. By the end of 2022, the total number of urban rail transit lines in China will reach 308, covering 55 cities, with a cumulative operating mileage of up to 9584 km [4]. According to the projection of available data, the operation scale of urban rail transit will continue to expand and play a crucial backbone role in public transport [5,6]. In the field of urban ecological civilization, the high-speed construction and development of the city is a great test of the urban ecological environment, and the development of urban rail transit can not only alleviate the traffic pressure and cultivate the consumption habits of green travel, but also crack the bottleneck constraints of resources and environment to a certain extent. As a critical area for collecting and diverting passenger flows and a central hub connecting various independent rail lines, the transfer system plays a vital role in the stable operation and operational efficiency of the whole rail network [7,8]. Therefore, studying the time value of urban rail transit transfer stations can help improve people’s traveling efficiency and ease the congestion of urban traffic, as well as alleviate the problems of urban land tension and energy depletion, which is beneficial to the realization of sustainable economic and social development.
There are many studies on urban rail transit transfer stations, most of which focus on transfer station architecture, passenger flow, and passenger satisfaction. Francisco Diez-Mesa used the clustering method to analyze the level of passenger satisfaction at each station in urban rail transit and studied the individual characteristics of passengers in the urban rail transit network. Using principal component analysis (PCA), various service factors of each category were obtained, the satisfaction level of each category was calculated, and the main differences between each category were identified [9]. Junghwa Kim conducted a satisfaction survey on the service facilities of the urban rail transit system through questionnaires from five perspectives: efficiency, economy, comfort, convenience, and safety. The level of transfer service was evaluated [10]. Emily Grisé studied the Canadian cities of Toronto and Hamilton based on spatial demarcation, history and space, and transit rail transit to evaluate the satisfaction of rail transit services in the region [11]. Mojtaba developed a train schedule optimization model with the objective of minimizing the waiting time of passengers at the station and solved the model. The algorithm proposed in the article was analyzed by examples and showed a significant improvement over the existing algorithms [12]. Jyoti Mandhani constructed a model for evaluating the level of service of rail transport using a causality-based approach, selected evaluation scores, Bayesian network and structural equation modeling methods, and partial least squares using 2390 travelers in the Delhi Metro in India [13]. Mao, CY argued that passengers’ perceived transfer distances at urban rail stations may be different from the actual transfer distances, based on which a novel machine learning framework was proposed for measuring perceived transfer distances at urban rail stations. The framework introduced a perceived transfer distance deviation ratio R, considering 32 metrics related to passengers’ personal attributes, transfer facilities, and transfer environments, and accurately evaluated R using the advanced XGBoost and SHAP models [14] Zhu, ZJ. In order to analyze the influencing factors of urban rail transit transfer flows, a method based on a nested logit flow distribution model was proposed to derive the transfer flows at seven transfer stations in Nanjing, China, using questionnaire surveys, transfer flow surveys, and smartcard data, taking into account the transfer choice behavior of passengers. The results showed that the relationship between the transfer passenger flow, and the economic, geographical and transport location is unclear [15]. To solve the problem of overcrowding at transfer stations during peak hours, Yin JT put forward a mathematical formula aiming to minimize the degree of overcrowding at stations during peak hours to generate the best-coordinated train schedule synchronously and use ALNS algorithm to find the best solution [16]. Li Ying mainly studied the dynamic distribution law of passengers, proposed the calculation method of the maximum accumulation of single-platform transfer stations, and finally obtained the calculation of the width of single-platform transfer stations [17]. Pei Yin studied the factors influencing the passenger flow of rail transit stations in Shanghai, China, using the entropy weight-grey correlation model. The model assumptions and the corresponding variables are proposed, including traffic accessibility, built environment, regional characteristics of the district to which the rail transit station belongs, conditions of the station, and spatial location, which affect the passenger flow of rail transit stations [18]. Based on the analysis of passenger flow transfer lines and main influencing factors in the station, Zhong Yiying determined the evaluation index of transfer efficiency in the station, built a non-uniform evaluation model of transfer efficiency in all directions of the station, and provided quantitative decision-making suggestions for improving the internal facilities of the station and passenger flow organization [19].
Some researchers have also focused on the transfer time at stations. Li, X proposed a novel model to optimize the first train timetable of an urban rail network with the objective of maximizing the satisfaction of passengers’ transfer waiting time, considering the relationship between transfer waiting time and passenger satisfaction [20]. Xu, RH developed a method for coordinating and optimizing train connections between different lines under the operating conditions of an urban rail network. The method enables the trains of different lines to form a good connection at the interchange station, which can shorten the waiting time of passengers and reduce the stranding of passengers [21]. Kim Hwang-Bae constructed a transfer impedance calculation model based on somatic transfer times at urban rail stations and calculated the transfer impedance at major urban rail stations in Korea. The results of the study showed that increasing the external walking distance by 100 m increases the transfer time by 2 min, increasing the internal walking distance by 100 m increases the transfer time by 3 min, increasing the number of stairs by 100 increases the transfer time by 4 min, and increasing the number of escalators decreases the transfer time by 1 min [22]. Feng, XS, considering the difficulty of improving transfer infrastructure, newly developed two sequential logistic regression models to explore practical ways to save the perceived transfer time of urban rail transit passengers. Through the verification, it is found that if the severe transfer congestion is released to an acceptable degree, the perceived transfer time of passengers will be effectively reduced. In addition, to significantly reduce the perceived transfer time, congestion on the platform must be eliminated [23]. Zheng, Jin Chu focused on the walking time of urban rail transit station access passengers from a statistical point of view, using Beijing underground stations as examples [24]. Wang proposed a complete optimization model for a conventional bus station layout and line network against the background of urban rail transit [25]. Yan, L obtained the transfer time by selecting the departure time of the previous station, the arrival time of the next station, and the train running time, and extracted the distributions of possible transfer routes during peak hours and off-peak hours using Gaussian Mixture Models, and finally proposed a comprehensive framework for estimating passengers’ transfer times and extracting their distributions and related transfer routes by using the WIFI probe data [26]. Cao, Rui studied the pedestrian flow characteristics of metro stations, platforms, transfer corridors, and transition staircases, established the maximum benefit function of transfer time, considered the pedestrian flow density and facilities, and proposed a model for calculating the accuracy and practicability of transfer time in order to improve the transfer efficiency [27].
In summary, most of the current research on rail transfer stations focuses on the safety and comfort of passengers when transferring, while the comprehensive value of time is relatively under-considered. This may lead to an incomplete assessment of the overall system, as passengers’ perception of time may be affected by a variety of factors, including waiting time, transfer time, and the total length of the entire journey. Considering that time and cost are more sensitive to passengers who transfer, this study establishes a complete evaluation system for the time value of the rail transit transfer system by considering a variety of influencing factors and indicators from the perspective of passenger perception.
The article first analyses the factors affecting the time value of transfer passengers in urban rail transit from three aspects: subjective factors, objective factors, and passenger perception. The evaluation indexes are selected based on expert inquiry and questionnaire survey, and some of the indexes are excluded by using importance analysis and correlation analysis to establish the evaluation index system. Secondly, combined with the characteristics of the rail transit transfer system, the hierarchical analysis method and the CRITIC method are selected for the combination assignment. Thirdly, the matter-element extension evaluation model is used to establish the rail transit transfer evaluation model based on time value. Finally, the validity of the model is verified by conducting on-site research on two typical rail transit transfer stations, the Dazhi Road Station and the Xunlimen Station.
On this basis, data collection and research were carried out on several other typical transfer stations of Wuhan Rail Transit, such as Xujiapeng Station, Sanyang Road Station, etc., to enrich the data of the indicator system. The results of the field research are consistent with the evaluation results of the model, which verifies the validity of the model and further improves the practical applicability of the evaluation model.
2. Construction of the Evaluation Index System
2.1. Analysis of the Transfer System Influencing Factors
The factors affecting the time value of rail transit transfer passengers are mainly in the following three aspects [28]:
Subjective factors generally refer to the factors that lead to the consumption of transfer time for the passengers’ own reasons.
Objective factors refer to the factors that cannot be changed by the individual’s subjective initiative.
Perceived time refers to the subjective perception of time by transfer passengers. Passenger perceived time is greater than the actual traveling time, and the higher time value of the transfer leads to a more sensitive perception of time by the traveler.
This paper will use these three aspects to analyze the factors affecting the time value of transfer systems.
2.1.1. Influence of Subjective Factors
- 1.
- Individual circumstances of passengers
A passenger’s transfer time is determined to some extent by walking speed [29]. There are a variety of influences on transfer times, and the degree of influence varies from person to person [30], making it difficult to quantify for everyone. For this reason, this thesis analyses walking time using field research.
- 2.
- Purpose of traveling
The purpose of traveling can generally be divided into two types: one is traveling due to work, and the other is due to tourism, visiting friends and relatives, leisure, and entertainment. In terms of traveling time, if the passenger is engaged in a time-critical activity, it will increase the time value of the passenger [31].
2.1.2. Influence of Objective Factors
Different transfer methods directly affect the transfer distance, passenger transfer walking time, and other factors [32]. According to the survey, transfer methods can be classified into the following five types. As shown in Figure 1:
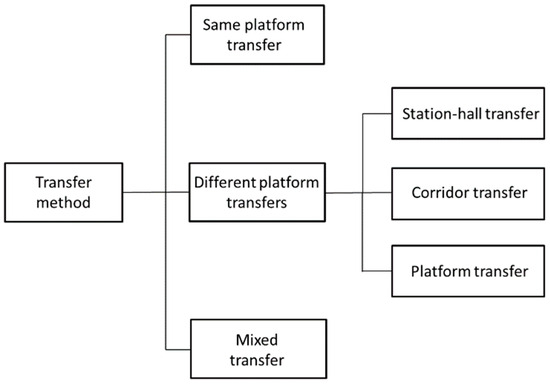
Figure 1.
Classification of transfer modes.
The number, design, and arrangement of various facilities in the station need to meet the needs of different passenger flows, and their reasonable connection is directly related to the traveling time, traveling safety, and traveling comfort of passengers.
2.1.3. Influence of Passenger Perception
- 1.
- Station environment factors
The station environment includes factors such as temperature, humidity, air quality, cleanliness, wall decorations, and lighting, which affect passengers’ psychological state and their perception of transfer time.
- 2.
- Environmental factors of passenger flow
Research has shown that a certain safe distance is needed between people. That is, passengers need a certain amount of space; if the space is small, it will make people feel uncomfortable as well as irritable [33], so the passengers perceive the transfer time as longer. Other factors include whether the density of passenger flow is too large and the speed of walking, among others.
2.2. Construction of the Rail Transit Transfer System Evaluation Index System
For the design of the evaluation indicator system, the first step is the preliminary selection of indicators, which is mainly obtained through expert consultation, field research, and analysis of influencing factors. The second step is the screening of indicators, applying the importance analysis and correlation analysis to eliminate some indicators. The third step is the construction of the evaluation index system, which is based on the screening results and describes the calculation method of each index and the criteria for the classification of evaluation levels.
2.2.1. Preliminary Selection of Indicators
Combining the analyses of the factors influencing the time value of the transfer system, the opinions of experts, and the information from field research and existing studies, the preliminary table of evaluation indicators, as shown in Table 1, can be designed and constructed:

Table 1.
Preliminary selection of evaluation indicators.
As shown in Table 1, based on the analysis of the time value influencing factors and the way of expert voting, 28 indicators are initially selected to become the initial evaluation indicator set, and the number of indicators is large, so it is necessary to screen the initial evaluation indicator set.
2.2.2. Indicator Screening
Indicator screening in the evaluation was conducted mainly by eliminating indicators that reflect overlapping information and by eliminating those that have less impact on the evaluation results. Indicator importance analysis consists of passengers and experts participating in the questionnaire survey, scoring to obtain the parameters of each indicator, and then using the critical value method to parameterize the statistics of each indicator to filter out the importance of each indicator. The mean and full frequency thresholds are “mean-standard deviation”, and the results of the indicator parameters are qualified if they are greater than the thresholds. When the coefficient of variation threshold is “mean + standard deviation”, the results of the indicator parameter are considered to meet the criteria if they are less than the threshold. Indicators that do not fulfill all three criteria are deleted, and if one or both criteria are not fulfilled, they will be determined on a case-by-case basis after comprehensive consideration. The questionnaire survey was conducted by selecting a random sample of passengers who needed to make transfers at transfer stations (especially those with multiple lines), not excluding various special groups, and the results of the questionnaire survey totaled 240. Experts in rail transport management were selected to conduct the survey, and 10 surveys were conducted. The final means, full score rate, and coefficients of variation for each indicator are shown in Table 2 and are based on 219 valid passenger questionnaires and 10 expert ratings, of which 40% are passenger ratings, and 60% are expert ratings.
Table 2.
Statistics on the results of evaluation indicator parameters.
The parameter thresholds are shown in Table 3:
Table 3.
Parameter thresholds for evaluation indicators.
From the calculation results, the mean value of the transfer sharing rate, emergency facilities, station facilities utilization rate, emergency handling timeliness, and station operation hours is less than 2.7909, the full score rate is less than 5.43%, and ranked the last 5, with the coefficient of variation greater than 0.3473, lower importance and poorer coordination. The above five indicators are excluded from the results of the questionnaire score analysis.
The least extreme variance (LEV) method was used to filter the indicators, in which barrier-free design, convenient facilities, and facility connectivity were ranked in the last three places and excluded.
The two indicators with large correlation coefficients may have similar information, which requires a comprehensive consideration of the actual significance of the indicators and the results of the analysis of the correlation coefficient of the indicators to exclude or merge the indicators. Pearson correlation coefficient and spearman correlation coefficient can reflect the strength of the correlation between the two variables.
The formula of Pearson correlation coefficient is shown in Formula (1):
The formula of spearman correlation coefficient is shown in Formula (2):
The strength of the correlation between two variables represented by the range of values of the correlation coefficient is shown in Table 4.
Table 4.
Strength of the correlation represented by the correlation coefficient.
The article on the importance of screening out the rest of the indicators questionnaire was analyzed using STATA 16, the correlation coefficient of 0.6 or more evaluation indicators have a strong representative correlation, need to be based on the results of the analysis and the actual situation of the indicators to be excluded or merged. The Pearson and spearman correlation analyses were carried out, respectively, and the strong and very strong correlation indicators are listed in Figure 2 below.
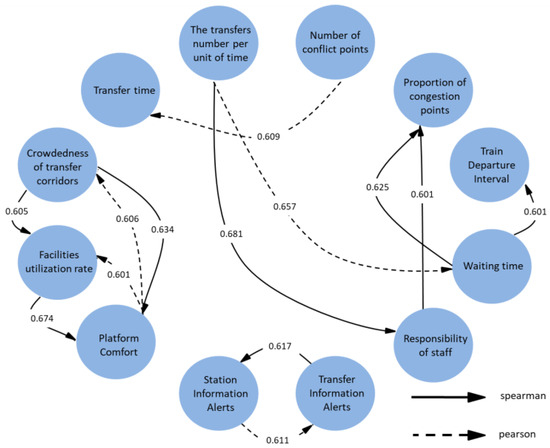
Figure 2.
Coefficients of the correlation analysis of strong and very strong correlation indicators.
The above indicators with correlation coefficients greater than 0.6 were analyzed, and seven indicators, namely, the number of transfers per unit of time, the crowdedness of transfer corridors, platform comfort, transfer information alerts, responsibility of staff, train departure interval, and the number of conflict points were deleted.
2.2.3. Establishment of an Evaluation Indicator System
Through in-depth analysis of the importance and relevance of the indicators, a series of representative key indicators were screened out, and the set of 28 preliminary selection indicators of influencing factors was expressed by 13 key indicators, and the evaluation indicator system of the rail transit transfer system based on time value was established, as shown in Figure 3. After the preliminary selection and screening of indicators, the finalized indicators are all directly and indirectly related to time value, which also proves the practical significance of using time value to evaluate the rail transit transfer system.
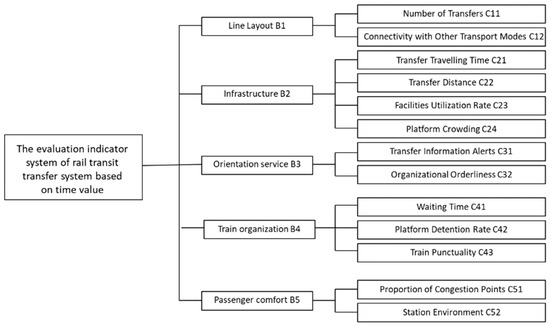
Figure 3.
Evaluation index system of rail transit transfer system based on time value.
2.2.4. Quantitative Analysis of Evaluation Indicators
When establishing a comprehensive multi-objective evaluation indicator system, indicators that are difficult to measure are often encountered, and it is even more difficult to solve these indicators by substituting them into a mathematical model. For this reason, it is necessary to quantify the indicators before evaluating them in order to eliminate, to the maximum extent possible, the impact of different indicator scales on the evaluation results. In the quantification process, a standardized method was used to unify the units of the indicators, and then the indicators were classified into four grades: excellent, good, middle, and poor.
- 1.
- Quantification of qualitative indicators
There are four qualitative indicators in the evaluation system, which are connectivity with other transport modes, transfer information alerts, organizational orderliness, and station environment. A questionnaire was distributed to passengers to collect data to quantify these four indicators. After the questionnaire was recovered, the average score was used as a value for the indicator, and the corresponding evaluation level is obtained. The scoring criteria are 8 to 10 points (very satisfied), 6 to 8 points (satisfied), 4 to 6 points (less satisfied), and 0 to 4 points (unsatisfied).
- 2.
- Quantification of quantitative indicators
- (1)
- Number of transfers C11
The number of transfers in large cities should not exceed 1.5 times, while in small and medium-sized cities should not exceed 1.3 times. According to the current actual situation of domestic transfer stations and the research of related literature, we can analyze this indicator, the specific number of transfers, and their grades, as shown in Table 5.
Table 5.
Number of transfers and impact analysis.
From Table 5, the indicator of the number of transfers can be divided into intervals: excellent (0 times), good (1 time), middle (2 times), and poor (3~5).
- (2)
- Transfer walking time C21
This indicator describes the time required for passengers to walk the distance between the drop-off point and the transfer boarding point, which is calculated using the following Formula (3):
According to the relevant literature research and an on-site research summary, the transfer time can be classified as the following intervals: excellent (0, 110 s], good (110 s, 210 s], middle (210 s, 320 s], poor (320 s, 600 s]).
- (3)
- Transfer distance C22
The indicator of transfer distance is calculated using the following Formula (4):
According to the on-site survey, passenger satisfaction is highest when the transfer walking distance is within 100 m. Therefore, each grade can be classified as excellent (0, 100 m), good (100, 200 m), middle (200, 300 m), and poor (300 m, 800 m).
- (4)
- Facility utilization rate C23
This indicator is the ratio of the actual frequency of utilization of equipment to the maximum utilization efficiency it can achieve in its current state. The equation for calculating this indicator is shown as Formula (5):
= Physical capacity of equipment occupied
= Existing capacity of equipment.
The higher utilization rate of the facilities indicates that the facilities are set up more reasonably, and the more efficiently and quickly passengers can complete the transfer process, which can be classified as excellent (0.8, 1], good (0.5, 0.8], middle (0.3, 0.5], and poor (0, 0.3].
- (5)
- Platform crowding C24
Platform congestion is an indicator that reflects the density of passenger flow for transfer. The equation for calculating this indicator is shown as Formula (6):
= Number of passengers per unit area of platform;
= Station passenger flow;
= Station area (m2);
Station crowding is inversely proportional to passenger comfort and satisfaction, which is classified as excellent (0, 0.8], good (0.8, 1.6], middle (1.6, 3.2], and poor (3.2, 5] by reviewing the data.
- (6)
- Waiting time C41
The transfer efficiency as well as the comfort level of passengers with short waiting times will be improved. The equation for calculating this indicator is shown as Formula (7):
= Arrival time interval between two routes (s);
The long waiting time directly affects the transfer time value and the satisfaction of passengers at the transfer station, so the waiting time indicator is classified as excellent (0 s, 30 s], good (30 s, 120 s], middle (120 s, 180 s], and poor (180 s, 600 s).
- (7)
- Platform detention rate C42
During the peak period, because of the high density of passenger flow on the platform, the number of passengers on the platform exceeds the maximum carrying capacity of the train, or the platform is overcrowded, resulting in some passengers not being able to take a ride in time and being stranded on the platform, thus preventing passengers from transferring and traveling quickly, and accelerating the passengers’ perception of time. This indicator is calculated as Formula (8):
= Percentage of people stranded at stations during peak hours.
= Number of people stranded on platforms during peak hours.
= Total number of people at the station during peak hours.
According to the relevant literature research, it can be classified as excellent (0, 0.1], good (0.1, 0.2], middle (0.2, 0.3], and poor (0.3, 0.6].
- (8)
- Train punctuality C43
The “Urban Rail Transit Operation and Management Code” stipulates that the train punctuality rate should be more than 98.5%, so the punctuality index is graded as excellent (99.5%, 100%), good (99.0%, 99.5%), middle (98.5%, 99.0%), and poor (98.0%, 98.5%).
- (9)
- Proportion of the congestion points C51
Passengers completing the transfer process need to use multiple transfer facilities to reach the target station, and during this process, queuing will occur if the station passenger flow is too large. Each transfer station may generate a different number of congestion points, so the ratio of the number of congestion points (P) is used for quantitative evaluation. The calculation formula is as Formula (9):
= Number of congestion points in stations;
= The number of places in the station where crowding may occur.
The four graded intervals were summarized as excellent (0, 0.3], good (0.3, 0.5], middle (0.5, 0.8], and poor (0.8, 1]).
3. Results and Discussions
3.1. Analysis of Indicator System Empowerment Method
This paper chooses the analytic hierarchy process (AHP) and CRITIC method for the subjective and objective combination of empowerment. The integration of the two can eliminate the subjective empiricism defects of the AHP and the randomness of the evaluation process, draw the advantage of objective conditions of the CRITIC method, reduce the overlap of information, and obtain a credible and effective combination of indicator weights. The CRITIC method can also be used to effectively make up for the shortcoming that the AHP does not consider the correlation between indicators.
3.2. Determination of Weights of Evaluation Indicators
3.2.1. Determination of Weights by the AHP
A hierarchical structure model of evaluation indicators is constructed in the Yaahp platform, which is divided into three layers: the first layer is the evaluation objective; the second layer is the guideline layer; and the third layer is each specific indicator, as shown in Figure 4.
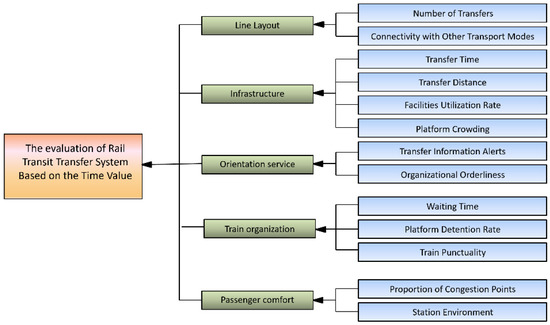
Figure 4.
Hierarchical model of evaluation indicators.
- 1.
- Construct the judgment matrix B
For relevant indicators at the same level, we use a scale of 1–9 to assign values to their relative importance, and the scales are defined as shown in Table 6:
Table 6.
Definition of importance scale values between elements.
- 2.
- Calculate the eigenroots and eigenroot vectors of the judgment matrix
= The largest characteristic root of the judgment matrix B
= The regularized eigenvector corresponding to
The questionnaire was issued to 15 experts, and after the results were counted and calculated, the scale assignment and eigenvectors of each indicator of the data are shown in Table 7, Table 8, Table 9, Table 10, Table 11 and Table 12 below:
Table 7.
Judgment table of first-level indicators.
Table 8.
Judgment table of line layout indicators.
Table 9.
Judgment table of infrastructure indicators.
Table 10.
Judgment table of orientation services indicators.
Table 11.
Judgment table of train organization indicators.
Table 12.
Judgment table of passenger comfort indicators.
- 3.
- Consistency test
The consistency of the matrix is represented by the consistency index CI, which is defined as shown in Formula (11):
where CI = 0 has full consistency; the smaller the CI is, the better the consistency is. Considering that the deviation in consistency may be caused by arbitrary reasons, the test coefficient CR is introduced to test the consistency of the judgment matrix, and the calculation of CR is obtained from Formula (12).
If CR > 0, the judgment matrix passes the consistency test, where RI is the random consistency index, which is related to the order of the judgment matrix, and can be obtained by looking up the table and its calculation method is shown in Formula (13).
The AHP was used to calculate the weight of each indicator, and the results are shown in Table 13:
Table 13.
Indicator weights of the AHP.
3.2.2. Determination of Weights by the CRITIC Method
According to the evaluation indicators, the transfer stations of Wuhan Metro Line 2 and Line 4 are investigated on-site. The specific data are shown in Table 14.
Table 14.
Wuhan rail transit transfer survey.
The objective weight of each indicator in the CRITIC method is calculated by the amount of information contained in the indicator data, which is expressed by the standard deviation and correlation coefficient between the indicators. Its specific steps are:
- 1.
- Non-dimensional processing
Because there are differences in different index dimensions, it is necessary to normalize these indicators.
For positive indicators (the larger the index value, the better), calculated as shown in Formula (14):
For negative indicators (the smaller the index value, the better), calculated as shown in Formula (15):
- 2.
- Finding indicator variability
Indicator variability is expressed in the form of the standard deviation, as shown in Formulas (16) and (17):
= The standard deviation of the j index.
- 3.
- Finding the conflict of indicator
The conflict of an indicator can be expressed by the correlation coefficient, as shown in Formula (18):
= the correlation coefficient between evaluation indicators i and j.
- 4.
- Request for the volume of information
The volume of information is shown in Formula (19):
- 5.
- Seeking objective weight
The objective weight is shown in Formula (20):
According to the above calculation process and combined with the results of the questionnaire survey, the objective weights of the indicators are calculated, and the specific values are detailed in Table 15:
Table 15.
Indicator weights of the CRITIC.
3.2.3. Determination of Composite Weights for Indicators
After the calculation of the subjective weights WAHP and objective weights WCRI, we applied the normalization method of multiplier synthesis to determine the weighting weights. Calculated as shown in Formula (21):
As a result of the above calculations, the weights of the indicators are calculated as shown in Table 16:
Table 16.
Comprehensive weighting table of indicators.
3.3. Establishment of the Evaluation Model
The purpose of this paper is to apply the hierarchical division range of each evaluation index in the established evaluation system and combine it with specific example data of transfer stations to evaluate them and draw the final evaluation conclusion. Considering the applicability of the relevant theories and evaluation calculation methods of the matter-element extension evaluation model, we decided to adopt this model to evaluate the transfer time value of the transfer station.
3.3.1. Determination of the Matter-Element Matrix
The matter-element extension evaluation model divides things into several matter elements, in , N represents the first-level evaluation index to be evaluated, C is the second-level index, and V is the numerical range of evaluation level corresponding to each second-level index, which is called the classical domain, and its corresponding matter-element is the classical domain matter-element. When all classical fields are bounded by V, the corresponding matter-element is a segment field matter-element, and there is one segment field matter-element for each first-level indicator. When all classical fields are bounded by V, the corresponding matter-element is a segment field matter-element, and there is one segment field matter-element for each first-level indicator. When V is used as the specific value corresponding to each level 2 indicator, the object element will be considered as the matter element to be evaluated.
The matter element matrix is represented as Formula (22):
3.3.2. Determination of the Classical Domain and Segment Field
- 1.
- Determination of the classical domain
The classical domain can be classified into four grades, which are excellent, good, middle, and poor, and the ranges of the values of these grades are specified by the individual evaluation indexes, which are denoted as , and, respectively. The classical domain matter-element can be expressed as Formula (23):
= Level j of the evaluation indicator;
= The n distinct features of ;
= The range of values for the i evaluation metric for the matter-element at that feature level.
- 2.
- Determination of the segment field
The segment field matter-element can be expressed as Formula (24):
= Evaluation ratings for evaluation quotes;
= The range of values of this segment field matter-element with respect to the characteristic ;
= Lower limit of the interval for the value of the i indicator;
= Upper limit of the interval for the value of the ith indicator
3.3.3. Determine the Matter-Elements to Be Evaluated and the Correlation Function
- 1.
- Determine the matter-elements to be evaluated
The correlation function is shown in Formula (25):
- 2.
- Determine the correlation function
The correlation function is shown in Formula (26):
= The correlation of the x matter-element to be evaluated, the j rank, and the i indicator.
Among them, the correlation formulas are shown in Formulas (27)–(29):
3.3.4. Determination of Integrated Relevance and Evaluation Level
- 1.
- Determination of integrated relevance
The integrated relevance can be determined by applying Formula (30):
where is the weight value of the indicator calculated by Formula (21). is the correlation value of the indicator calculated by Formula (26).
- 2.
- Determination of evaluation level
According to the principle of maximum affiliation, the target has the greatest degree of relevance under a certain level, which represents the greatest possibility of its occurrence under that level. The time value level of the transfer station can be determined by applying Formula (31):
3.4. Empirical Analysis
To verify the scientific rationality of the evaluation method, this paper selects the Wuhan Metro Dazhi Road transfer station and Xunlimen transfer station as the verification object and applies the matter-element extension evaluation model to evaluate them and define the time value grade of the transfer station.
3.4.1. Research on Transfer Station
Dazhi Road Station, located at the intersection of Jinghan Avenue and Stadium Street in Wuhan, is a transfer station between Wuhan Metro Line 1 and Line 6, which is a corridor transfer. Its daily passenger flow reaches 48,000, and many tourists transfer here. Dazhi Road Station has seven exits, namely A, B, C, D, E1, E2, F, and G. There is a bus stop about 120 m outside the metro station. The platforms of Line 1 are elevated, three-story sideways, while the platforms of Line 6 are underground, two-story island-type, connected by escalators. Passengers transferring need to travel from underground to the elevated level.
Xunlimen Station is a transfer station for Wuhan Rail Transit Line 1 and Line 2, which is a corridor transfer. With a single-day traffic flow of 190,000 passengers, there are 8 exits at Methodist Station, namely A, B, C, E, F, G, H, and J. It is convenient for bus transfers near the metro station.
The qualitative indicators are based on a questionnaire distributed to passengers to score each indicator, and the average score of each indicator is calculated based on the results of the survey as the numerical value of the indicator.
The specific values of the quantitative indicators are investigated using the questionnaire method, the on-site observation method, and the following method. The questionnaire method is used to obtain data on the number of transfers. The on-site observation method refers to the measurement of each quantitative indicator during a certain period of time, which is applicable to the indicators of the facility utilization rate, platform crowding, platform detention rate, train punctuality, and the proportion of congestion points. The following method refers to following a certain transfer passenger to complete the process of transfer and record the corresponding data. This method is applicable to the transfer walking distance, transfer time, and waiting time. In order to ensure the accuracy and objectivity of the survey results, a number of passengers of different ages and genders can be observed at a certain time.
Based on the on-site observation method, the following method, and the above-mentioned indicator quantification methods, a table of indicator quantities for the Dazhi Road station was calculated, as shown in Table 17:
Table 17.
Evaluation indicator values for Dazhi Road Station.
The table of indicator quantities for the Xunlimen station was calculated, as shown in Table 18:
Table 18.
Evaluation indicator values for Xunlimen Road Station.
3.4.2. Calculation of Transfer Station Evaluation
The first step is to list the classical field and segment field for the evaluation of the rail transit time value, where , , and refer to the four grades of excellent, good, middle, and poor, respectively:
The second step requires the establishment of the unit matrix to be evaluated, and the matrix of each transfer station to be evaluated is as follows:
Input the matter-elements to be evaluated into the matter-element model. According to the established classical and segment fields and the weights of each secondary indicator calculated in Table 16 and brought into Formula (30), the corresponding correlation degree of each secondary indicator can be calculated, as shown in Table 19 and Table 20.
Table 19.
Secondary indicator evaluation rating scale for the Dazhi Road Station.
Table 20.
Secondary indicator evaluation rating scale for the Xunlimen Station.
Calculate the comprehensive relevance and determine the assessment grade. The comprehensive relevance and grades of the five level 1 indicators are calculated according to Formulas (30) and (31), as shown in Table 21 and Table 22:
Table 21.
First-level indicator evaluation rating scale for the Dazhi Road Station.
Table 22.
First-level indicator evaluation rating scale for the Xunlimen Road Station.
The overall evaluation rating can be calculated based on the formula as shown in Table 23:
Table 23.
Overall evaluation levels for the Metro transfer stations.
3.4.3. Analysis of Evaluation Results
The Dazhi Road transfer station is laid out in an “L” shape with a relatively large station design. It has been in use for many years, but the facilities are well-equipped and basically do not have any problems such as malfunction or damage, and can basically meet the normal commuting demand during peak hours. The overall transfer time value of Dazhi Road Station is evaluated as good, with the first-level indicator line layout evaluated as excellent, infrastructure, train organization, and passenger comfort evaluated as good, and orientation service evaluated as middle, indicating that the comprehensive evaluation of Dazhi Road Station in its current state is relatively good, but further improvement is needed.
The Xunlimen transfer station is also arranged in an “L” shape, which has the problem of longer transfer distance and the current situation of larger passenger flow at the station, resulting in a slower traveling speed of passengers in the transfer, and more serious problems such as conflict of passenger flow in different directions. The overall transfer time value of the Xunlimen transfer station is evaluated as middle, in which the evaluation grade of the first-level indicator line layout is excellent, and the evaluation grades of infrastructure, orientation service, train organization, and passenger comfort are middle.
From the results of the fieldwork and interviews with transfer station staff, the Dazhi Road Station is relatively large and well-equipped and is not very crowded during peak hours. The Xunlimen Station has a longer transfer distance and fewer transfer facilities, and the lift entrances are often crowded, especially during peak hours. The results are consistent with the above evaluation results, and the accuracy of the evaluation model can be effectively verified.
4. Discussion
This paper took the time value of transfer in urban rail transit system as the research object and analyzed and researched mainly from the three aspects of the construction of an evaluation index system, the assignment of evaluation indexes, and the construction of an evaluation model. The main research results and conclusions are as follows:
- (1)
- Based on the trajectory of transfer passenger flow, the transfer system influencing factors were summarized into three aspects, namely, subjective factors, objective factors, and passenger perception factors. Each factor was further divided into a number of influencing factors, which mainly cover all aspects of the service received by transfer passengers at the transfer station and can be used as the basis for selecting indicators for evaluating the time value of transfer passengers.
- (2)
- Select evaluation indexes using preliminary selection and screening. The preliminary selection of indicators was based on the analysis of the factors affecting the time value of transfer passengers, and the screening of indicators was performed using the STATA 16 software to analyze the importance and relevance of the indicators to establish an evaluation system for the time value of the transfer system. The quantitative analysis of the indicators was carried out, and finally, the evaluation indicators were divided into four grades: excellent, good, middle, and poor.
- (3)
- Summarize and analyze the commonly used indicator assignment and evaluation methods, and for the characteristics of the urban rail transit transfer system, the AHP-CRITIC method was chosen to carry out weighting. The matter-element extension evaluation model was established and applied to the Wuhan Metro Dazhi Road Station and Xunlimen Station, which can effectively put forward the improvement measures and suggestions according to the evaluation level of the transfer station.
The article has the following limitations and presents recommendations for the next steps in research based on the current limitations.
- (1)
- Evaluation indicators. The urban rail transit transfer system is relatively complex, and the focus of evaluation is also different. This study mainly focuses on the optimal system efficiency of rail transit transfer, so it chooses the time value, which can better reflect the passenger’s feelings and system efficiency, as the core index and is somewhat limited in evaluating safety and comfort. Evaluation indicators can be designed to address the needs and preferences of different groups of passengers in the next step of the study so that the evaluation of transfer systems can be considered in a more personalized and differentiated way.
- (2)
- Evaluation model selection aspects. In the time value assessment, there may be certain factors that are difficult to quantify accurately or have uncertainty, and the matter-element extensible model can introduce flexibility into the model to better deal with such uncertainty. However, the matter-element extension evaluation model uses the maximum affiliation quasi-measure for evaluation, which has the limitation of being more subjective. Evaluation indicators can be designed to address the needs and preferences of different groups of passengers in the next step of the study so that the evaluation of transfer systems can be considered in a more personalized and differentiated way. Future research can further explore the combination of multiple evaluation models and utilize emerging technological tools, such as machine learning, to improve the accuracy and operability of rail transit transfer system evaluation.
Author Contributions
Conceptualization, X.Z.; methodology, W.X. and F.W.; software, X.C.; validation, X.Z.; formal analysis, Y.W.; data curation, W.X. and M.Y.; writing—original draft preparation, F.W. and X.C.; writing—review and editing, J.L. and Y.W.; investigation, J.L.; resources, M.Y.; project administration, F.W. and XZ. All authors have read and agreed to the published version of the manuscript.
Funding
This research was funded by the Wuhan Institute of Technology Postgraduate Education Innovation Fund, grant number CX2022183.
Institutional Review Board Statement
Not applicable.
Informed Consent Statement
Not applicable.
Data Availability Statement
All data covered in this paper are available from the corresponding author upon request.
Conflicts of Interest
The authors declare no conflict of interest.
References
- Tiwari, G.; Phillip, C. Development of public transport systems in small cities: A roadmap for achieving sustainable development goal indicator 11.2. IATSS Res. 2021, 45, 31–38. [Google Scholar] [CrossRef]
- Li, Z.; Gao, F.; Xiao, C.; Tang, J. The effects of the urban built environment on public transport ridership: Similarities and differences. Travel Behav. Soc. 2023, 33, 100630. [Google Scholar] [CrossRef]
- Pulido, D.; Darido, G.; Munoz-Raskin, R.; Moody, J. The Urban Rail Development Handbook; World Bank Publications: Washington, DC, USA, 2018. [Google Scholar]
- Lu, K.; Han, B.; Lu, F.; Wang, Z. Urban rail transit in China: Progress report and analysis (2008–2015). Urban Rail Transit 2016, 2, 93–105. [Google Scholar] [CrossRef]
- Li, X.; Love, P.E.; Luo, H.; Fang, W. A systemic model for implementing land value capture to support urban rail transit infrastructure projects. Transp. Res. Part A Policy Pract. 2022, 156, 90–112. [Google Scholar] [CrossRef]
- Bao, X. Urban rail transit present situation and future development trends in China: Overall analysis based on national policies and strategic plans in 2016–2020. Urban Rail Transit 2018, 4, 1–12. [Google Scholar] [CrossRef]
- Yang, A.; Wang, B.; Huang, J.; Li, C. Service replanning in urban rail transit networks: Cross-line express trains for reducing the number of passenger transfers and travel time. Transp. Res. Part C Emerg. Technol. 2020, 115, 102629. [Google Scholar] [CrossRef]
- Dou, F.; Zhang, H.; Yin, H.; Wei, Y.; Ning, Y. An Optimization Method of Urban Rail Train Operation Scheme Based on the Control of Load Factor. Sustainability 2022, 14, 14235. [Google Scholar] [CrossRef]
- Diez-Mesa, F.; de Oña, R.; de Oña, J. The effect of service attributes’ hierarchy on passengers’ segmentation. A light rail transit service case study. Transp. Res. Procedia 2016, 18, 234–241. [Google Scholar] [CrossRef]
- Kim, J.; Schmöcker, J.-D.; Yu, J.W.; Choi, J.Y. Service quality evaluation for urban rail transfer facilities with Rasch analysis. Travel Behav. Soc. 2018, 13, 26–35. [Google Scholar] [CrossRef]
- Grisé, E.; El-Geneidy, A. Where is the happy transit rider? Evaluating satisfaction with regional rail service using a spatial segmentation approach. Transp. Res. Part A Policy Pract. 2018, 114, 84–96. [Google Scholar] [CrossRef]
- Abdolmaleki, M.; Masoud, N.; Yin, Y. Transit timetable synchronization for transfer time minimization. Transp. Res. Part B Methodol. 2020, 131, 143–159. [Google Scholar] [CrossRef]
- Mandhani, J.; Nayak, J.K.; Parida, M. Interrelationships among service quality factors of Metro Rail Transit System: An integrated Bayesian networks and PLS-SEM approach. Transp. Res. Part A Policy Pract. 2020, 140, 320–336. [Google Scholar] [CrossRef]
- Mao, C.; Xu, W.; Huang, Y.; Zhang, X.; Zheng, N.; Zhang, X. Investigation of Passengers’ Perceived Transfer Distance in Urban Rail Transit Stations Using XGBoost and SHAP. Sustainability 2023, 15, 7744. [Google Scholar] [CrossRef]
- Zhu, Z.; Zeng, J.; Gong, X.; He, Y.; Qiu, S. Analyzing influencing factors of transfer passenger flow of urban rail transit: A new approach based on nested logit model considering transfer choices. Int. J. Environ. Res. Public Health 2021, 18, 8462. [Google Scholar] [CrossRef]
- Yin, J.; D’Ariano, A.; Wang, Y.; Yang, L.; Tang, T. Timetable coordination in a rail transit network with time-dependent passenger demand. Eur. J. Oper. Res. 2021, 295, 183–202. [Google Scholar] [CrossRef]
- Li, Y.; Mao, B.-H.; Du, P.; Chen, Z.-J. Platform Width Calculation at One-platform-transfer Station of Urban Rail Transit. J. Transp. Syst. Eng. Inf. Technol. 2016, 16, 148. [Google Scholar]
- Yin, P.; Cheng, J.; Peng, M. Analyzing the Passenger Flow of Urban Rail Transit Stations by Using Entropy Weight-Grey Correlation Model: A Case Study of Shanghai in China. Mathematics 2022, 10, 3506. [Google Scholar] [CrossRef]
- Zhong, Y.; Chen, J.; Liu, X. Evaluation model of transfer efficiency in rail transit station. In Proceedings of the 2019 12th International Conference on Intelligent Computation Technology and Automation (ICICTA), Xiangtan, China, 26–27 October 2019; IEEE: Piscataway, NJ, USA, 2019; pp. 492–495. [Google Scholar]
- Li, X.; Yamamoto, T.; Yan, T.; Lu, L.; Ye, X. First train timetabling for urban rail transit networks with maximum passenger transfer satisfaction. Sustainability 2020, 12, 4166. [Google Scholar] [CrossRef]
- Xu, R.; Song, X.; Zhou, F.; Wang, F. Synergistic Optimization Method for URT Network Train Connection Scheme in Peak and Off-Peak Periods. J. Adv. Transp. 2022, 2022, 6431231. [Google Scholar] [CrossRef]
- Kim, H.B.; Choi, J.H. Modelling of Transfer Impedance of Urban Rail Station. KSCE J. Civ. Environ. Eng. Res. 2010, 30, 11–15. [Google Scholar]
- Feng, X.; Hua, W.; Qian, X. Reducing Perceived Urban Rail Transfer Time with Ordinal Logistic Regressions. Promet-Traffic Transp. 2019, 31, 593–602. [Google Scholar] [CrossRef]
- Zheng, J.C.; Ji, C.X.; Gao, L. Research on walking time of transfer pedestrians in urban rail transit station. Appl. Mech. Mater. 2014, 610, 1053–1056. [Google Scholar] [CrossRef]
- Wang, F.; Ye, M.; Zhu, H.; Gu, D. Optimization Method for Conventional Bus Stop Placement and the Bus Line Network Based on the Voronoi Diagram. Sustainability 2022, 14, 7918. [Google Scholar] [CrossRef]
- Li, Y.; Nan, S.-R.; Guo, Y.; Zhu, C.-H.; Li, D. Detection and analysis of transfer time in urban rail transit system using WIFI data. Transp. Lett. 2023, 15, 634–644. [Google Scholar]
- Cao, R.; Ma, C.; Wang, Z. Passenger Traffic Organization Method of Urban Rail Transit Interchange. In Proceedings of the CICTP 2019, Nanjing, China, 6–8 July 2019; pp. 6299–6310. [Google Scholar]
- Chen, E.; Stathopoulos, A.; Nie, Y.M. Transfer station choice in a multimodal transit system: An empirical study. Transp. Res. Part A Policy Pract. 2022, 165, 337–355. [Google Scholar] [CrossRef]
- Eltved, M.; Lemaitre, P.; Petersen, N.C. Estimation of transfer walking time distribution in multimodal public transport systems based on smart card data. Transp. Res. Part C Emerg. Technol. 2021, 132, 103332. [Google Scholar] [CrossRef]
- Zhang, Z.; Huang, Z. Walking time distribution of transfer passengers based on proportional hazard model. In IOP Conference Series: Earth and Environmental Science; IOP Publishing: Bristol, UK, 2020; p. 072033. [Google Scholar]
- Wang, P.-C.; Hsu, Y.-T.; Hsu, C.-W. Analysis of waiting time perception of bus passengers provided with mobile service. Transp. Res. Part A Policy Pract. 2021, 145, 319–336. [Google Scholar] [CrossRef]
- Xiao, M.; Chien, S.; Hu, D. Optimizing coordinated transfer with probabilistic vehicle arrivals and passengers’ walking time. J. Adv. Transp. 2016, 50, 2306–2322. [Google Scholar] [CrossRef]
- Bissell, D. Passenger mobilities: Affective atmospheres and the sociality of public transport. Environ. Plan. D Soc. Space 2010, 28, 270–289. [Google Scholar] [CrossRef]
Disclaimer/Publisher’s Note: The statements, opinions and data contained in all publications are solely those of the individual author(s) and contributor(s) and not of MDPI and/or the editor(s). MDPI and/or the editor(s) disclaim responsibility for any injury to people or property resulting from any ideas, methods, instructions or products referred to in the content. |
© 2023 by the authors. Licensee MDPI, Basel, Switzerland. This article is an open access article distributed under the terms and conditions of the Creative Commons Attribution (CC BY) license (https://creativecommons.org/licenses/by/4.0/).