Abstract
Parachutes and other inflatable aerodynamic decelerators usually use flexible fabrics due to their lightweight and high load-carrying capacity. The behavior of fabrics during complex deformations is mainly influenced by their shear properties. The shear properties of fabric can be explained by the shear stiffness or shear modulus. The design optimization of these inflatable structures relies on a detailed knowledge of the mechanical properties of the fabric material. To investigate the effect of shear modulus on the inflatable shapes of parachute canopies, an arbitrary Lagrangian–Eulerian coupling method based on the incompressible computational fluid dynamics solver and structural solver LS-DYNA is proposed. Finite element methods are used to describe continuous materials such as fabrics and airflow fields. The effects of the shear modulus on the inflated parachute shapes are investigated from the macroscopic and microscopic scales. A comparison analysis reveals that different shear moduli have little effect on the overall shape and in-plane shear strain of the parachute, while they have significant effects on the in-plane stress distribution and wrinkles of the parachute. The methods and conclusions of this paper can provide some reference for the materials design of parachutes in preforming stage.
1. Introduction
Parachutes and other inflatable aerodynamic decelerators are used in many applications, such as vehicle recovery, Mars exploration, and airdrops, due to their small size, lightweight and low cost [1,2,3,4]. Parachute canopy is composed of flexible fabric materials, using woven fabrics designed to meet specific manufacturing or structural requirements. The thickness of the parachute canopy is so small relative to the geometric scale that the canopy can be regarded as a thin fabric material. The physical properties of the canopy material play an important role in the parachute modeling process. The shear stress causes shear deformation, fabric wrinkles, and even shear damage. The shear modulus of the fabric material is mainly related to the mechanical properties of the yarn and the geometric parameters of the fabric [5]. Understanding the effect of shear properties on the mechanical properties of parachute materials is essential for the proper optimization of the design of structural components.
Parachute fabrics are flexible materials composed of yarns interlaced together. Woven fabrics are made up of two sets of yarns interlaced perpendicularly. The yarns along the length of the fabric are called warp yarns, and the yarns along the width are weft yarns. Warp and weft yarns can be interwoven to form various fabrics with different patterns [6]. Fabrics can be formed from one or multiple materials to meet structural requirements. Therefore, the mechanical and physical properties of a textile fabric composed of a specific type of material depend primarily on how it is structured. The detailed modeling of the mechanical properties of woven fabrics has been extensively studied for decades [7,8]. However, due to their complex nature, the modeling of woven fabrics is relatively backwards compared to other materials [9]. The behavior of fabrics as composite orthogonal materials under loads is characterized by friction, crimp interchange, slip, and locking. Specifically, these behaviors refer to contact friction between overlapping yarns, undulations caused by warp and weft yarns crossing under applied loads, slip when yarns rotate due to shear, and locking when yarns stick together and can no longer rotate [10]. These behaviors are influenced by the type and manner of loadings, which are essential factors for fabric properties. However, these behaviors occur at the yarn and fiber levels. Studying yarn interactions requires a high level of detail at the cost of increased computational cost, which is not the focus of this paper.
Fabrics can be studied at the macroscopic, mesoscopic, and microscopic levels. Kabche et al. [11] measured the fabric modulus of inflatable beams through experimental tests and input the data to the finite element material model for predicting the bending response of the beams. The results show that the elastic moduli and shear moduli of fabrics vary with the inflation pressure, weave structure, and material properties of the fibers. Some researchers have proposed fluid–structure interaction (FSI) methods to simulate the nonlinear flexible behavior of parachute canopies [2,12,13,14]. Most studies concentrated on the parachute inflation process involving observations of opening times and stress distributions under various loading conditions and structural responses. Although much work has been performed in the field of parachute modeling, there is no universal material model that accurately captures all aspects of mechanical behaviors of canopy fabrics.
Much experimental work has been performed to determine the mechanical properties of fabrics. A review of several experimental methods for determining the elasticity and shear modulus of fabrics can be found in the literature [15]. While keeping other properties constant or zero, biaxial tensile, shear, and bias extension tests were used to measure one of these mechanical properties. Tanner applied the material data measured from tests to the FSI work. NASA and ILC Dover used similar test methods to explore better ways of describing the stiffness of coated woven fabrics to support ground testing programs for inflatable aerodynamic decelerators [16]. However, experimental studies have limitations regarding measurable quantities [17], so a more detailed characterization of fabric material properties would be necessary.
LS-DYNA is a widely used commercial non-linear finite element software package. Its material library has available material models for modeling the micro- and macro-mechanical behavior of fabrics. Tabiei and Ivanov proposed a fabric model at the yarn level (MAT_MICROMECHANICS_DRY_FABRIC) that considers yarn repositioning and the geometric shape of the fabric using homogenization techniques [18]. However, this material model is not used in this paper due to its high computational cost and the lack of unusual input parameters required by its published material data. In this paper, we use the standard fabric model (MAT_FABRIC) from the LS-DYNA material library, which is commonly employed for most structural analyses of fabrics. This macroscopic model uses Hooke’s law as the intrinsic constitutive equation, which ignores the microscopic interactions between yarn and fiber, making it more computationally feasible.
To the best of our knowledge, there is currently no literature examining the effect of shear stiffness on parachute inflation performance at the macroscopic scale. Inspired by previous studies, we study the effect of shear behavior on the inflation deformations of parachutes by fluid–structure interaction methods. The incompressible Computational Fluid Dynamics (CFD) solver is combined with the LS-DYNA finite element structure solver. The fluid–structure interface is solved by arbitrary Lagrangian–Eulerian (ALE) methods, where the fluid and structure meshes are independent, and the structure can cross a fixed fluid mesh [19]. The simulation tools utilized in this study have been validated against experimental results in previous works [13], demonstrating their accuracy in predicting structural deformations during inflation and aerodynamic performance in the steady descent phase of the parachute warhead system. This study provides quantitative and qualitative analyses of the FSI results, examining the macroscopic shapes and microscopic wrinkles of the parachute. This paper aims to provide feasible numerical methods and references for the design optimization of parachute materials.
The rest of this paper is organized as follows. Section 2 introduces the relationship between the shear modulus and shear behavior of parachutes, and the governing equations for FSI simulations. Section 3 presents the parachute model and material parameters used for the simulations, and the defined measurement criteria. Section 4 presents the simulation results of FSI simulations of the parachute inflation process, and Section 5 concludes this paper.
2. Experimental Methods
2.1. In-Plane Shear Behavior of Fabrics
The main difference between flexible fabrics and ordinary rigid bodies is the non-linear properties caused by a much lower shear stiffness than tensile stiffness [20]. There are several main reasons for the shear behavior of fabrics [21]:
- Deformation due to the rigid intersection of yarns when the shear force is insufficient to overcome friction;
- Yarn slip that occurs when shear force overcomes friction;
- Elastic deformation after the completion of slip.
In terms of shear stiffness, the shear modulus G is usually much smaller than the tensile modulus in the warp or weft direction. However, it may significantly contribute to the effective modulus in directions other than warp and weft [22]. To estimate the in-plane shear modulus of fabrics, many researchers [23,24,25,26] have employed bias extension tests to measure the linear Poisson’s ratio and elastic modulus in the warp and weft directions, with uniaxial stress tests in the bias direction to determine the tensile modulus, using the equation:
where , , and are the linear elastic moduli and the Poisson’s ratios in the warp and weft directions, respectively, and is the tensile modulus.
2.2. Governing Equations
Due to the relatively low instantaneous velocity in the fluid–structure interaction simulation of low-speed airdrop parachutes during airdrop experiments, the air is considered an incompressible fluid [27]. Consider that a domain is occupied by incompressible, viscous air with boundary , and is the structure domain with boundary . For simplification, the form of time is no longer shown below.
2.2.1. Structure Dynamics
Due to the large deformations in inflation, the canopy deformation is regarded as a geometrical nonlinear problem. The highly flexible fabric material is used to simulate the canopy structure. The governing equations for the structure domain are illustrated by
where is the material density, is the velocity of structure, is Cauchy stress tensor, and is the external body forces acting on the structure. There is no stress and strain of structure at the initial time.
Suspension lines are modeled using a discrete cable element from the LS-DYNA material library. The force generated by the suspension line is non-zero only if the line is in tension, and the tensile force can be calculated by the cable material stiffness and offset length. Considering the damping and nonlinear characteristics of lines, the dynamic governing equations are
where denotes the nonlinear tensile function of lines, is the damping coefficient, is the strain of lines, denotes the element offset, and represents the initial length and current length of the cable element, respectively.
The above equations are discrete in time. Based on the linear time discontinuous Galerkin strategy, a discrete form of the above structural equation can be obtained. The specific details can be found in [28].
2.2.2. Fluid Dynamics
The governing equations of the structure are affected by fluid loading, which is obtained by solving Navier–Stokes equations in the ALE coordinate system [29,30]. The incompressible, viscous airflow is described by the equations of mass, momentum, and energy conservation, as provided by Equations (4)–(6).
where is fluid density, is the external body force, and are fluid velocity and mesh velocity, respectively, and is the stress tensor defined by
where , , and are the pressure, identity tensor, and dynamic viscosity of the fluid, respectively. The ideal gas law is used to calculate the pressure:
where and are the air density and temperature, respectively, and and are specific heat capacities at constant pressure and volume, respectively.
To complete the Navier–Stokes Equations (4)–(6), the boundary conditions are defined as
where denotes the imposed Dirichlet condition of velocity on , is the outward normal of the fluid boundary, and is the externally applied Neumann condition of normal stress on .
2.2.3. Fluid–Structure Interaction Scheme
The incompressible CFD solver and structure solver LS-DYNA are fully coupled to realize FSI. The coupling is carried out with a balance at the interface between fluid and structural domains. Kinematic constraints at the interface guarantee identical velocities of fluid and structure, while dynamic constraints assure the stability of stresses.
where is the tensile force acting on the structure interface, and is the outer normal vector of the fluid–structure coupling interface. The above conditions are always met over time, so the fluid stress determines the deformations of structure domain.
The FSI calculation was initiated from the velocity inlet boundary. The fluid equations were solved first, and the calculated aerodynamic forces were transferred to the structure solver. Then, the structure solver was computed and passed the nodal displacements of the canopy as boundary conditions to the fluid solver based on the obtained fluid loading. The above process is repeated until convergence is reached, then the solution enters the next step. The fluid–structure interaction simulation process of the parachute inflation with ALE method is shown in Figure 1.
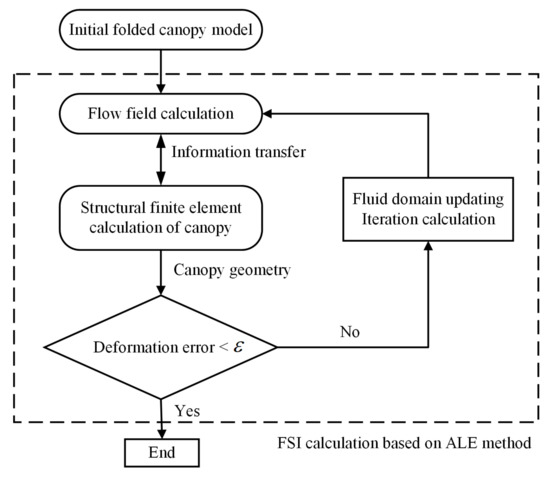
Figure 1.
Coupling process with ALE method.
After the canopy was fully inflated, the residuals converged to a value close to zero and remained stable. The aerodynamic coefficients of the final 1000 time steps were averaged to obtain the aerodynamic values at the current angle of attack. Each case was iterated for 25,000 steps with a time step of .
This paper utilized the high-performance scalability of the MPP capability of the LS-DYNA R10 solver, and the FSI simulations of the parachute inflation process were solved in parallel using a 32-core workstation, which greatly improved the efficiency of the solution.
3. Parachute Fluid–Structure Coupling Simulation
3.1. Parachute Geometry and Finite Element Model
In this paper, we discuss the development of a Disk-Gap-Band (DGB) parachute model, which is commonly used in the aerospace field. The geometry of the DGB parachute consisting of 48 suspension lines and 24 gores is presented in Figure 2. The specific geometric parameters are shown in Table 1.
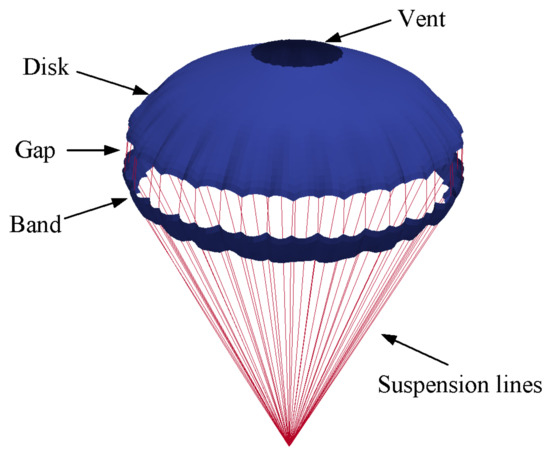
Figure 2.
Geometry of a Disk-Gap-Band parachute.

Table 1.
Geometric parameters of parachutes.
FSI simulations of the parachute opening process were carried out under wind tunnel experiment conditions. We only consider the lateral folding of the parachute, i.e., the inflation process starting from the deployment moment. The initial computer-aided design (CAD) models of the folded canopy and flow field are shown in Figure 3.
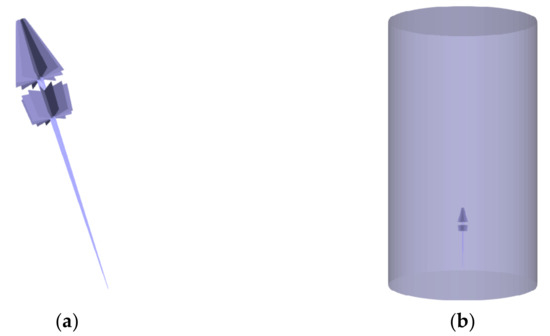
Figure 3.
Initial CAD models. (a) Parachute. (b) Flow field.
The CAD models used for the simulation were designed by CATIA software and were exported to the finite element tool for meshing to generate the finite element models, as shown in Figure 4. Specific simulation model parameters can refer to [31]. To avoid wall effects, the fluid domain was modeled as a cylinder with its boundaries far from the parachute canopy. The parachute canopy was divided by quadrilateral grids, and the flow field was meshed by hexahedron grids. The smaller the mesh, the better the accuracy in capturing complex fluid dynamics. Therefore, the mesh size of the fluid flow around the parachute should be as small as possible compared to that of the parachute canopy. However, finer meshes lead to higher computational costs. In order to create a trade-off between accuracy and computational effort, we used an incremental approach to divide the fluid mesh from the canopy center to the boundaries. the results of the mesh convergence study are presented in Section 3.4.
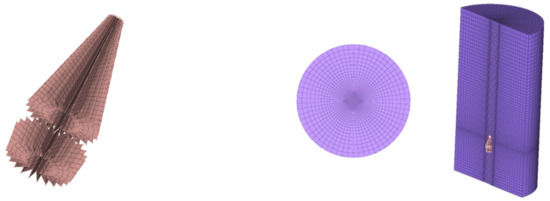
Figure 4.
Mesh models of parachute and flow field.
3.2. Material Parameters
The parachute canopy is made of a low permeability ripstop nylon fabric with polyester woven suspension lines. Relevant material data has been tested experimentally, and we chose the Type IV fabric specification from the literature [32]. The parameters used in the model are shown in Table 2, considering the fabric as isotropic material. The flow speed at the deployment stage is usually higher than that at the steady descent stage, and thus, a flow speed of 50 m/s was chosen to simulate the parachute inflating process. The simulation time was set to 0.8 s with a time step of 0.0001 s.
Table 2.
The parameters of numerical model.
The objective of this paper is to investigate the effect of shear modulus on the response of the inflatable deformations of the canopy. From the nominal value of the shear modulus, with the assumption of isotropy, provided in Equation (13), we decreased G until there were significant effects on the structural responses.
As shown in Table 3, five models named Model A–Model E with different values of G were tested by simulation.
Table 3.
Shear modulus of parachute models.
3.3. Defined Measurement Criteria
Three macroscopic measurement criteria were chosen to represent the overall inflated shape of the canopy, presented in Figure 5. To maintain the consistency of results and minimize measurement errors between different models, we selected the same nodes for measurements in each case.
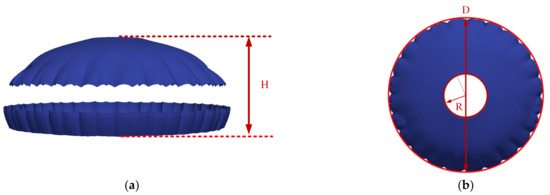
Figure 5.
Measurement criteria for canopy shape. (a) Height of canopy. (b) Canopy diameter and vent radius.
In order to compare the magnitudes of loads on the suspension lines, we chose seven lines numbered 1–7, and the corresponding lines numbered 1′–7′ in the opposite direction, which were located on the three connected canopy gores 1–3 of each model, as shown in Figure 6. Taking into account the special structure of the DGB parachute, each suspension line is divided into an upper gap part and a lower payload part. In the following section of simulation results, we conducted the statistical analysis of the tensile loads on the selected suspension lines.
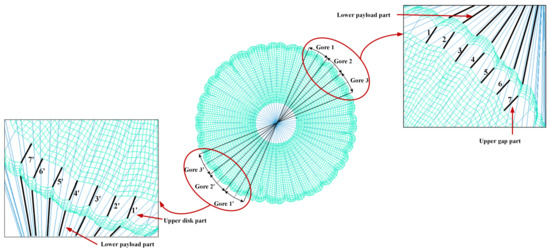
Figure 6.
The number of lines used for measurement.
Membranes will wrinkle along the edge due to the inability to support compressive stress. Understanding wrinkles is important because they can affect the deformation and stress distribution of the canopy, and thus, affect the overall performance of the parachute [33]. In order to analyze the influence of G on the canopy inflated shapes on a microscopic scale, three measurement criteria were defined for five connected wrinkles, numbered 1–5 and their opposite direction 1′–5′, on each model. These measurements were the height (h), radius (r) of the circle where the wrinkle is located, and the angle between the midpoint and two endpoints of the wrinkle. Figure 7 provides a visual representation of these measurements. To maintain consistency between models and minimize measurement errors, the same wrinkles were selected for measurements in each case.
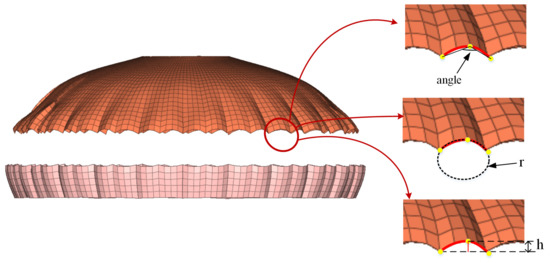
Figure 7.
Definition of measurement criteria for wrinkles.
3.4. Mesh Convergence Study
Based on prior experience in finite element modeling, we estimated an appropriate mesh coarseness for the initial model. As the mesh size changed from coarse to fine, we developed five different finite element models with mesh sizes ranging from 45 k to 230 k. After the parachute was fully inflated, the drag coefficients () of the canopy were extracted at t = 0.8 s and compared in Figure 8. The data showed that the drag coefficient varied with the refinement of the mesh model. The difference between the 120 k and 230 k mesh models was less than 3%, within an acceptable error range. Therefore, we selected the mesh model with 125,478 nodes and 121,350 elements for the subsequent shear modulus variation study.
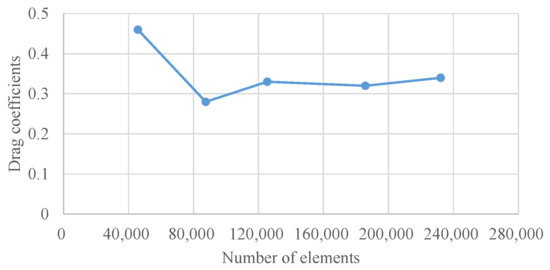
Figure 8.
Variation of the drag coefficients with the number of mesh elements.
4. Results and Discussion
Parachutes are stochastic systems with a large dispersion characteristic, and the canopy geometry can significantly affect its inflation performance. To investigate the effect of shear modulus on inflation deformations of the parachute canopy, this study was conducted using models with identical constructions and different shear moduli as presented in Table 3. This section first discusses the results of the opening process of the parachute, followed by an examination of the changes in the fabric on both macroscopic and microscopic scales with varying shear modulus.
4.1. Inflation Simulation
An important factor impacting the accuracy of the simulation results is the time taken for the parachute to reach a steady state. To determine the steady state of the canopy, the distance changes between two nodes along the projected diameter direction of the canopy edge, as shown in Figure 9, were recorded for five simulation models over time. It can be seen that the canopy reached a steady state in approximately 0.5 s and remained nearly constant for the rest of the time, with no significant oscillations observed.
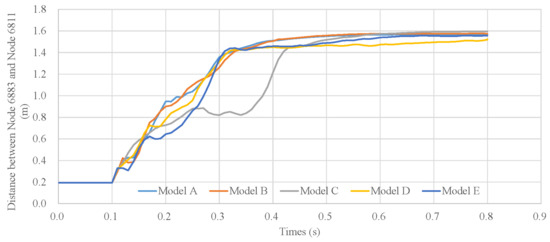
Figure 9.
Distance between two nodes along the diameter direction of the canopy edge changes with time.
Figure 10 shows the three-dimensional deformations of the parachute canopy from the initial deployment at 0.0 s until fully inflated at 0.6 s. At the start of inflation, the slots were nearly closed. The airflow entered the canopy from the bottom and gradually collected at the top, and spread to fill the entire canopy. As the canopy continued to inflate, the slots expanded, accelerating the inflation process. Eventually, the canopy opened completely to a hemispherical shape. The inflation time means the duration from the start of the airflow enters the canopy until it is fully opened. After inflation, the canopy may experience area oscillations due to unsteady airflows at high Mach numbers. However, the overall inflated shape of the canopy will converge to a stable state without much change in size. These results are consistent with simulation results of the parachute shape during inflation in reference [22], but the inflation time is slightly different, which may be due to inconsistencies in the shape and size of the parachute canopy. The FSI numerical simulation captured the opening process of parachutes effectively.
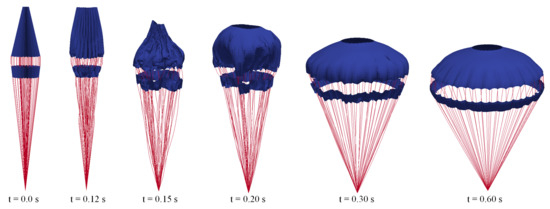
Figure 10.
3D simulation results of the parachute shapes during inflation.
The computational time of 0.6 s is considered the end of the fully inflated phase. In addition, all criteria, introduced in Section 3.3, will be analyzed on the parachute state at t = 0.8 s, where we can consider that the parachute is in a steady state.
4.2. Effects of Shear Modulus at Macroscopic Scale
4.2.1. Effect on Inflation Shape
As the primary measurement of steady canopy deformation is the inflated shape, this section examines the impact of changes in the shear modulus on the inflated shape of the parachute. Reducing the shear modulus causes the stiffness of the fabric material to decrease, leading to increased deformations of the parachute. Accordingly, a reduction of G is expected to result in an increase in canopy deformation. Figure 11 summarizes the measurement results of five models in Table 3 according to the measurement criteria for parachute shape defined in Section 3.3.
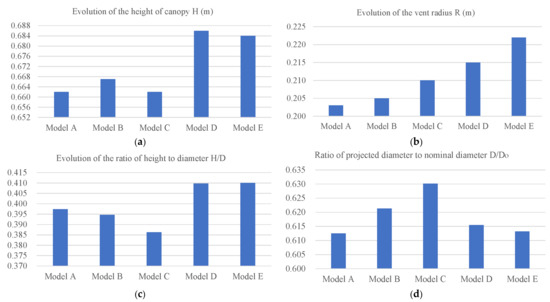
Figure 11.
Effect of shear modulus on canopy macroscopic dimensions. (a) Height of canopy. (b) Radius of vent. (c) Ratio of canopy height to diameter. (d) Ratio of canopy projected diameter to nominal diameter.
As shown in Figure 11a,b, the size of the canopy increased with the decrease of G, and the trend in the vent radius was obvious, with a maximum increase of 10% from 0.203 m in Model A to 0.222 m in Model E. Compared to the changes in canopy height, the increase in top vent radius is more sensitive to variations in G, which may result in more air inside the canopy flowing out from the vent, potentially altering the aerodynamic performance of the parachute. The impact of this parameter effect on stress distributions on the canopy is further analyzed in Section 4.2.2.
Recent research [34] suggests that a smaller length–width ratio of a parachute results in stronger deceleration ability and higher efficiency of the cruciform parachute. Based on the similar definition of the ratio of length to area, Figure 11c presents the height–diameter ratio H/D, which reveals that a reduction in the shear modulus leads to an increase in H/D. The maximum difference is 6.2% between Model C and Model D. Another indicator of drag efficiency in parachute design is the ratio of projected diameter to nominal diameter of the parachute [35], with a larger ratio indicating a greater drag coefficient. Figure 11d shows the variation of this ratio with the shear modulus, and the results demonstrate that the difference in the projected diameter of the canopy is not significant. The maximum difference is only 3.4% between Model A and Model C.
4.2.2. In-Plane Stress/Strain and Drag Characteristics
Figure 12 shows the stress contours distributed on the parachute canopy surface with different G. The central region near the top vent experiences higher stresses than the average of the entire canopy, which is consistent with the simulation results of [36]. At the nominal value of G = 189 MPa, the stress distributions on the surface of the canopy were locally uneven and asymmetrical along the projected diameter of the canopy. With the decrease of G, the maximum stress magnitude near the canopy vent increased from Pa to Pa. However, the stress distribution along the radial direction was gradually symmetrical and uniform. The increase in stress magnitudes near the canopy vent could be attributed to the increase in the top vent radius shown in Figure 11b. The larger radius causes a greater amount of airflow to move toward the vent, resulting in a high-mass shock impacting the canopy vent.
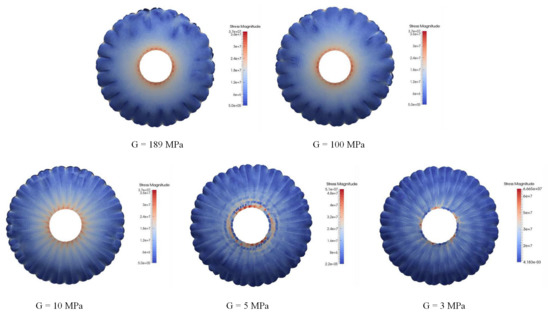
Figure 12.
Stress contours on parachute surface with varying shear moduli.
It is worth noting that the stress contours appear to show a “spiral” at MPa and become stronger at MPa. This evolution of shapes was attributed to the nonlinear behavior of the shear modulus of the parachute material, which correspondingly caused the increase of the canopy wrinkles, and this effect will be quantified in Section 4.3.
In Figure 13, the effects of shear modulus are quantitatively analyzed by the maximum and minimum values of shear stress and strain for different G. Comparing Model E with Model A, the maximum in-plane shear stress increased by 62%, and the minimum in-plane shear stress nearly doubled, increasing by about 108%; while the maximum and minimum values of in-plane shear strain increased by 24% and 32%, respectively. This shows that the effect of shear modulus on shear stress is greater than that on shear strain.
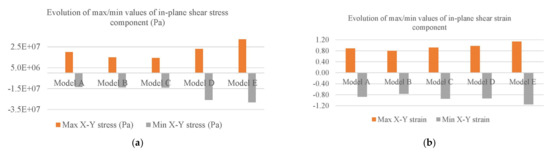
Figure 13.
Effects of shear modulus on the in-plane shear stress and strain components. (a) In-plane shear stress. (b) In-plane shear strain.
The magnitude of the drag coefficient reflects the resistance or deceleration performance of parachutes. We extracted the drag coefficients of five cases at t = 0.8 s, after the parachutes reached steady states, and the statistical results are illustrated in Figure 14. The decreasing trend of drag coefficients as G was similar to that of D/Do in Figure 11d. A larger projection area resulted in better resistance performance for the parachute. However, an increase in the top vent radius may cause a loss of aerodynamic drag on the canopy. Although the D/Do ratios of Model A and Model B were smaller than that of Model C, their vent sizes were also smaller, resulting in similar drag coefficients for Models A, B, and C. Conversely, the trend of H/D in Figure 11c was opposite to that of drag coefficients, confirming the hypothesis in Section 4.2.1 that the influence of the H/D ratio on deceleration efficiency was consistent with the length–width ratio in [35].
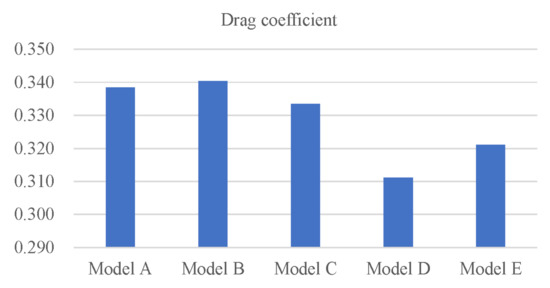
Figure 14.
Drag coefficients of fully inflated parachutes.
4.2.3. Axial Load in Suspension Lines
For better comparison, the suspension lines numbered 2–7 between three connected parachute gores, and symmetric lines 2′–7′ in the opposite direction shown in Figure 6, were selected. The average axial load values of these two sets of lines are presented in Figure 15. The results showed that the tension on the suspension lines gradually decreased as G reduced, which is roughly consistent with the trend of drag coefficient variation in Section 4.2.2. Specifically, Model E exhibited an average tension on lines 1–7 that was 9% less than that of Model A, while the average tension on lines 1′–7′ in the opposite direction was 7.3% less. In terms of tension symmetry, Model C demonstrated the most balanced symmetry, while the other models did not exhibit significant changes in tension symmetry.
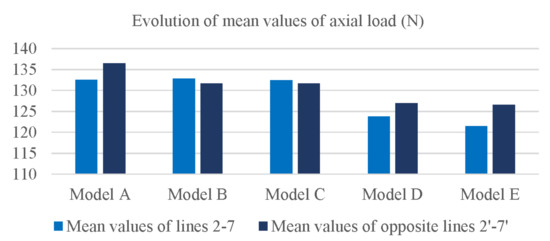
Figure 15.
Effect of shear modulus on axial load in suspension lines.
4.3. Effects of Shear Modulus at Microscopic Scale
To analyze the effects of shear modulus at the microscopic scale, we measured the size of the wrinkle zones in Figure 7, and histograms are provided in Figure 16.
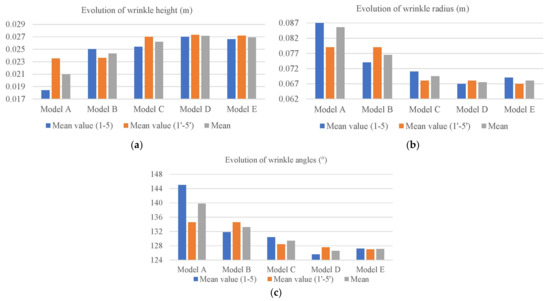
Figure 16.
Influence of shear modulus on the shape of wrinkles.
With the decrease of G, the height of wrinkles increased slightly and eventually reached a stable value. The difference between mean values of wrinkles 1–5 and wrinkles 1′–5′ decreased gradually, indicating an increase in canopy symmetry. Model E, which had the lowest G, exhibited more wrinkle deformations in terms of the reduction of angle and radius. The maximum increase of mean wrinkle height was 28% between Model A and Model E. The radius of curvature and angles where the edges of wrinkles occupied gradually decreased. Compared to Model A, the wrinkle angle of Model E decreased by 9%, and the wrinkle radius decreased by 21%. These findings are consistent with the study by Shanbeh et al. [37], who indicate that fabrics with low shear resistance produce high deformation wrinkles due to high locking angles.
5. Conclusions
The fluid–structure interaction method was used to analyze the effect of shear behavior on the inflation deformations and resistance characteristics of parachutes for the first time. Based on the simulation results for various shear moduli, the steady inflated shapes and structure dynamics were analyzed quantitatively and qualitatively at macroscopic and microscopic scales. The conclusions are summarized as follows:
- The most significant effect of the decrease in G on the steady-state inflation shape of the parachute canopy was an increase in the diameter of the top vent by about 10%. This led to an 81% increase in stress near the canopy top vent, which had an unfavorable effect on the drag coefficient.
- The reduction of G had a greater effect on the shear stress than the shear strain on the parachute surfaces. The minimum in-plane shear stress increased by nearly 108%, and the symmetry of the parachute canopy improved.
- The reduction of G resulted in a gradual decrease in the mean tension on the suspension lines, with a maximum difference of 9%.
- The reduction of G on the microscopic scale manifested as the increase of wrinkle deformations at the canopy edges, where the mean height of wrinkles increased by 28%. The influence on the aerodynamic distributions of the parachute surface needs further study.
In summary, the shear behavior has important influences on parachute performance. This underscores the need to consider in-plane shear modulus variations and explore the coupling between shear behavior and nonlinear tensile behavior in the pre-forming process of fabric materials for better parachute performance. Future works will concentrate on quantitative comparisons between experimental and numerical results sensitivity studies.
Author Contributions
Conceptualization, H.Z.; formal analysis, H.Z.; funding acquisition, J.T., Q.S. and Z.C.; investigation, D.S.; methodology, Q.S. and D.S.; software, Q.S.; supervision, J.T., Q.S., H.S., F.D. and X.Z.; validation, H.Z. and D.S.; writing—original draft, H.Z.; writing—review and editing, J.T. All authors have read and agreed to the published version of the manuscript.
Funding
This work was supported by the National Natural Science Foundation of China (Grant NoS.61973172, 61973175, 62003175, and 62003177), the Key Technologies Research and Development Program of Tianjin (Grant No.19JCZDJC32800), and Research and Innovation Project for Postgraduates in Tianjin (Grant No. 2021YJSO2B02); this project is also funded by the China Scholarship Council.
Institutional Review Board Statement
Not applicable.
Informed Consent Statement
Not applicable.
Data Availability Statement
Data sharing not applicable.
Acknowledgments
The data presented in this study are available on request from the corresponding author.
Conflicts of Interest
The authors declare no conflict of interest.
References
- Stein, K.; Benney, R.; Kalro, V.; Tezduyar, T.E.; Leonard, J.; Accorsi, M. Parachute fluid–structure interactions: 3-D computation. Comput. Methods Appl. Mech. Eng. 2000, 190, 373–386. [Google Scholar] [CrossRef]
- Kanai, T.; Takizawa, K.; Tezduyar, T.E.; Tanaka, T.; Hartmann, A. Compressible-flow geometric-porosity modeling and spacecraft parachute computation with isogeometric discretization. Comput. Mech. 2019, 63, 301–321. [Google Scholar] [CrossRef]
- Maślanka, P.; Aleksieiev, A.; Korycki, R.; Szafrańska, H.; Dąbrowska, A. Experimental and numerical determination of strength characteristics related to paraglider wing with fourier transform infrared spectroscopy of applied materials. Materials 2022, 15, 7291. [Google Scholar] [CrossRef]
- Zheng, Y.; Tao, J.; Sun, Q.; Sun, H.; Chen, Z.; Sun, M.; Duan, F. Deep-reinforcement-learning-based active disturbance rejection control for lateral path following of parafoil system. Sustainability 2023, 15, 435. [Google Scholar] [CrossRef]
- Williams, R.W. Measuring and Modeling the Anisotropic, Nonlinear and Hysteretic Behavior of Woven Fabrics. Ph.D. Thesis, The University of Iowa, Iowa City, IA, USA, 2010. [Google Scholar]
- Marrey, R.V.; Sankar, B.V. Micromechanical Models for Textile Structural Composites; NASA Contractor Report CR-198229; National Aeronautics and Space Administration: Washington, DC, USA, 1995.
- Tephany, C.; Soulat, D.; Gillibert, J.; Ouagne, P. Influence of the non-linearity of fabric tensile behavior for preforming modeling of a woven flax fabric. Text. Res. J. 2016, 86, 604–617. [Google Scholar] [CrossRef]
- Hill, J.L.; Braun, R. Implementation of a mesomechanical material model for IAD fabrics within ls-dyna. In Proceedings of the AIAA Aerodynamic Decelerator Systems (ADS) Conference, Daytona Beach, FL, USA, 25–28 March 2013. [Google Scholar]
- Vidal-Salle, E.; Boisse, P. 4—Modelling the structures and properties of woven fabrics. In Modelling and Predicting Textile Behaviour; Chen, X., Ed.; Woodhead Publishing: Sawston, UK, 2010; pp. 144–179. [Google Scholar]
- Lin, H.; Sherburn, M.; Crookston, J.; Long, A.C.; Clifford, M.J.; Jones, I.A. Finite element modelling of fabric compression. Model. Simul. Mater. Sci. Eng. 2008, 16, 035010. [Google Scholar] [CrossRef]
- Kabche, J.P.; Peterson, M.L.; Davids, W.G. Effect of inflation pressure on the constitutive response of coated woven fabrics used in airbeams. Compos. Part B Eng. 2011, 42, 526–537. [Google Scholar] [CrossRef]
- Gao, X.; Zhang, Q.; Tang, Q. Fluid–structure interaction and flight dynamics analysis of parachute–payload system during uncontrolled airdrop process. Proc. Inst. Mech. Eng. Part G J. Aerosp. Eng. 2018, 232, 2499–2512. [Google Scholar] [CrossRef]
- Zhu, H.; Sun, Q.; Tao, J.; Tan, P.; Chen, Z.; Dehmer, M.; Xie, G. Fluid-structure interaction simulation and accurate dynamic modeling of parachute warhead system based on impact point prediction. IEEE Access 2021, 9, 104418–104428. [Google Scholar] [CrossRef]
- Xue, X.; Wen, C.-Y. Review of unsteady aerodynamics of supersonic parachutes. Prog. Aerosp. Sci. 2021, 125, 100728. [Google Scholar] [CrossRef]
- Bassett, R.J.; Postle, R.; Pan, N. Experimental methods for measuring fabric mechanical properties: A review and analysis. Text. Res. J. 1999, 69, 866–875. [Google Scholar] [CrossRef]
- Lin, J.K.; Shook, L.S.; Ware, J.S.; Welch, J.V. Flexible Material Systems Testing; NASA Contractor Report CR-2010-AC89D; National Aeronautics and Space Administration: Washington, DC, USA, 2010.
- Clark, I.G.; Hutchings, A.L.; Tanner, C.L.; Braun, R.D. Supersonic Inflatable Aerodynamic Decelerators For Use On Future Robotic Missions To Mars. In Proceedings of the 2008 IEEE Aerospace Conference, Big Sky, MT, USA, 1–8 March 2008; pp. 1–17. [Google Scholar]
- Tabiei, A.; Ivanov, I. Computational micro-mechanical model of flexible woven fabric for finite element impact simulation. Int. J. Numer. Methods Eng. 2002, 53, 1259–1276. [Google Scholar] [CrossRef]
- Caldichoury, I.; Paz, R.; Del Pin, F. ICFD Theory Manual Incompressible Fluid Solver in LS-DYNA; Livermore Software Technology Corp.: San Francisco, CA, USA, 2014. [Google Scholar]
- Hu, J. Structure and Mechanics of Woven Fabrics; Elsevier: Amsterdam, The Netherlands, 2004. [Google Scholar]
- Sun, H.; Pan, N. Shear deformation analysis for woven fabrics. Compos. Struct. 2005, 67, 317–322. [Google Scholar] [CrossRef]
- Kilby, W. 2—Planar stress–strain relationships in woven fabrics. J. Text. Inst. Trans. 1963, 54, T9–T27. [Google Scholar] [CrossRef]
- Wu, Z.; Au, C.; Yuen, M. Mechanical properties of fabric materials for draping simulation. Int. J. Cloth. Sci. Technol. 2003, 15, 56–68. [Google Scholar] [CrossRef]
- Lo, W.; Hu, J. Shear properties of woven fabrics in various directions. Text. Res. J. 2002, 72, 383–390. [Google Scholar] [CrossRef]
- Morozov, E.; Vasiliev, V. Determination of the shear modulus of orthotropic materials from off-axis tension tests. Compos. Struct. 2003, 62, 379–382. [Google Scholar] [CrossRef]
- Shanahan, W.; Lloyd, D.; Hearle, J. Characterizing the elastic behavior of textile fabrics in complex deformations. Text. Res. J. 1978, 48, 495–505. [Google Scholar] [CrossRef]
- Gao, X.; Zhang, Q.; Tang, Q.; Yang, T. Fluid-structure interaction simulation of parachute in low speed airdrop. In Proceedings of the World Congress on Engineering, Wuhan, China, 31 May–2 June 2013; pp. 3–5. [Google Scholar]
- Bauchau, O.A. Flexible Multibody Dynamics; Springer: Berlin/Heidelberg, Germany, 2011; Volume 176. [Google Scholar]
- Winter, O.; Sváček, P. On numerical simulation of flexibly supported airfoil in interaction with incompressible fluid flow using laminar–turbulence transition model. Comput. Math. Appl. 2021, 83, 57–73. [Google Scholar] [CrossRef]
- Lee, H.; Xu, S. Fully discrete error estimation for a quasi-Newtonian fluid–structure interaction problem. Comput. Math. Appl. 2016, 71, 2373–2388. [Google Scholar] [CrossRef]
- Tutt, B.A.; Lowry, C. Design Overview of the Strengthened Mars 2020 Parachute Assembly. In Proceedings of the AIAA Aviation 2019 Forum, Dallas, TX, USA, 17–21 June 2019. [Google Scholar]
- Niemi, E.E., Jr. An Improved Scaling Law for Determining Stiffness of Flat, Circular Canopies; University of Massachusetts Lowell: Lowell, MA, USA, 1992. [Google Scholar]
- Ofir, Y.; Givoli, D.; Libai, A. An axisymmetric parachute model with wrinkling. J. Mech. Mater. Struct. 2011, 6, 417–442. [Google Scholar] [CrossRef]
- Cheng, H.; Ouyang, Y.; Zhang, Y.; Pan, J. Research on the influence of length-width ratio on cruciform parachute airdropping performance. J. Ind. Text. 2022, 51, 7694S–7713S. [Google Scholar] [CrossRef]
- Shanbeh, M.; Safar Johari, M.; Zarrebini, M.; Barburski, M.; Komisarczyk, A. Analysis of shear characteristics of woven fabrics and their interaction with fabric integrated structural factors. J. Eng. Fibers Fabr. 2019, 14, 1–13. [Google Scholar] [CrossRef]
- Knacke, T.W. Parachute Recovery Systems Design Manual; Naval Weapons Center: China Lake, CA, USA, 1987. [Google Scholar]
- Boustani, J.; Barad, M.F.; Kiris, C.C.; Brehm, C. Fully-coupled fluid-structure interaction simulations of a supersonic parachute. In Proceedings of the AIAA Aviation 2019 Forum, Dallas, TX, USA, 17–21 June 2019. [Google Scholar]
Disclaimer/Publisher’s Note: The statements, opinions and data contained in all publications are solely those of the individual author(s) and contributor(s) and not of MDPI and/or the editor(s). MDPI and/or the editor(s) disclaim responsibility for any injury to people or property resulting from any ideas, methods, instructions or products referred to in the content. |
© 2023 by the authors. Licensee MDPI, Basel, Switzerland. This article is an open access article distributed under the terms and conditions of the Creative Commons Attribution (CC BY) license (https://creativecommons.org/licenses/by/4.0/).