Abstract
The continuous expansion of green finance makes it a new scheme to stimulate economic vitality, but its stimulation path remains to be explored. Using the panel data of 30 regions in China from 2016 to 2020, this research utilized an entropy method to evaluate green finance and the sustainable development of the regional economy (SDRE), and then discussed their coupling coordination relationship and regional heterogeneity. The results show that: (1) The developments of green finance and SDRE in the eastern coastal regions are generally better than that of China’s inland regions. (2) If green finance and SDRE are at a high level, their coupling coordination will be enhanced. Otherwise, the coordination effect will be weakened. (3) The influence of green finance on SDRE has evident regional heterogeneity, and the influence is positive in the echelon with a high degree of green finance.
1. Introduction
In recent years, the rapid development of extensive production has not only established the bridge for economic take-off but also exposed the severe problems of resource waste and environmental pollution. While looking for solutions to the issues of high energy consumption and high pollution, countries worldwide are actively exploring solutions [1,2]. In September 2015, the United Nations Sustainable Development Summit put forward 17 goals to achieve sustainable development in fifteen years, encouraging sustainable development through innovative and high-quality investment. Therefore, in pursuing the coordinated development of economy and ecology, how to effectively guide the economy from high-speed growth to sustainable development has become a frequently discussed topic.
As a positive measure of ecological development, green finance incorporates environmental impact into investment risk assessment and uses environmental incentives to drive economic decision making [3]. Establishing the green financial system has initiated new economic growth points and enhanced environmental protection to the economy [4]. It is also an inevitable choice to promote the sustainable development of the regional economy (SDRE). In China, the development of the policy system of green finance has broad prospects. The report of the 20th National Congress of the Communist Party of China pointed out that China would improve the incentive and restraint mechanism of green finance and lay a solid foundation for sustainable economic development. Therefore, analyzing the relationship between green finance and the SDRE can determine the characteristics of regional development and promote the balanced development of various regions in order to drive overall economic health.
As regards choosing the method to measure green finance and SDRE, some research adopted an innovative green finance development index system and found that green finance activities could effectively deal with environmental damage by optimizing resource allocation [5,6,7,8,9,10]. Mohsin et al. (2020) [7] comprehensively assessed the development level of the green economy in developed and developing countries by building a low-carbon financial index system. Ren and Wu (2022) [8] used the global Malmquist–Luenberger productivity index to measure China’s green total factor energy efficiency and recommended promoting carbon neutrality. Wan et al. (2022) [9] used the national spatial model and neural network algorithm to analyze the incentive mechanism of green finance policies. Bai et al. (2022) [10] took economic growth and industrial structure as threshold variables to test the inhibition effect of green finance on carbon emissions.
Some studies proved that green finance played an accelerating role in carbon loss, and they confirmed that the long-term development of green finance would achieve economic decarbonization [11,12,13,14,15]. Flammer (2021) [12] believed in corporate green bonds’ own significance in improving environmental conditions and promoting healthy economic development. Ye et al. (2022) [13] used green technology innovation as an intermediary factor to explore the mutual promotion between green finance and green development, and analyzed its spatial spillover mechanism and heterogeneity. Lin et al. (2022) [14] believed that green bonds as an emerging financial tool could broaden the financing channels and stimulate green innovation. Wang et al. (2022) [15] assessed the causal relationship between green finance and sustainable development on a global scale, which supported the interaction theory between these.
In terms of the relationship between green finance and SDRE, some scholars believe that the threshold mechanism of green finance is conducive to narrowing the regional gap of sustainable development. Nevertheless, the inhibition effect of green finance on carbon intensity is affected by the structure of factors in different regions [16,17]. Zhou et al. (2022) [18] studied the impact of green finance on regional ecological development in China, and they found boundary differences among the eastern, central, and western regions. Yin and Xu (2022) [19] found that if green finance lagged behind economic growth, it would have an insignificant support on economic growth.
To sum up, most studies support the role of green finance in promoting SDRE. However, a multi-dimensional measurement still needs to reflect the development of green finance and SDRE in different regions in China. How can we systematically measure the level of green finance and SDRE multi-dimensionally? How do we accurately classify the echelons of coupling coordination between green finance and SDRE? How can we interpret regional heterogeneity from the relationship between green finance and SDRE? The above problems still need to be explored. This study used an entropy method to process panel data of 30 regions in China from 2016 to 2020, divided the regional echelons to deeply excavate the coupling coordination between green finance and SDRE, and further confirmed the influence mechanism of green finance on the SDRE.
The remainder of this study is organized as follows. Section 2 describes the data source and index construction, followed by Section 3, which discusses the comprehensive development level measurement and coupling coordination analysis of green finance and SDRE. Section 4 explores the influence mechanism and regional heterogeneity between green finance and SDRE through fixed-effect regression analysis. Section 5 is the robustness test, and Section 6 presents the conclusions and expectations.
2. Data Source and Index Construction
2.1. Data Source
We selected the panel data of 30 regions in China from 2016 to 2020 (excluding Tibet, Hong Kong, Macao, and Taiwan, since data in these areas of China are incomplete) as the research sample of the relationship between green finance and SDRE. The relevant data sources in our research are as follows:
- Green credit data come from the China Stock Market and Accounting Research (CSMAR) database and China Financial Statistics Yearbook.
- Green stock data come from the Wind database.
- Green insurance data come from China Insurance Yearbook.
- Other green finance indices data come from China Statistical Yearbook.
- The data on the SDRE are all from the China Statistical Yearbook.
2.2. Construction of Green Finance Indices
Zeng et al. (2022) [20] chose the issuance of urban green bonds as green financial proxy indices. Lee and Lee (2022) [21] selected the main products of green finance, such as green-oriented credit, securities, insurance, and investment, to construct green finance indices. Ge et al. (2022) [22] mentioned that it is a bit far-fetched to use the number of clean projects as a proxy variable in the measurement of carbon finance.
Based on the research above, we built an index system from two aspects, including environmental protection fund support and government support, to measure the comprehensive development level of green finance (see Table 1).

Table 1.
Measurement index system of green finance.
2.3. Construction of SDRE Indices
The premise of sustainable urban development is to realize the coordinated development of the three subsystems of economy, society and environment; therefore, the construction of a sustainable development index system should include four dimensions of ecology, society, economy and innovation [23]. Huan et al. (2021) [24] selected data from 15 countries committed to the United Nations Sustainable Development Goals (UNSDGS) and established country-level sustainable development quantification programs from four dimensions: social, economic, environmental, means of implementation, and cooperation. Based on the localization of the UNSDGS, Gao et al. (2021) [25] constructed a provincial-level sustainable development measurement system from three aspects: human well-being, resources and environment, and development power.
Based on the research above, this study comprehensively selected innovation ability, coordination and stability, green sustainability, dual openness, and achievement sharing as the secondary indices for measuring SDRE, containing 19 tertiary indices (see Table 2).
Table 2.
Measurement index system of SDRE.
3. Development and Coupling Coordination Measurement for Green Finance and SDRE
3.1. Development Level of Green Finance and SDRE
3.1.1. Entropy Method
Entropy value is a measure of uncertainty [26]. We used the entropy method to calculate the development of green finance and SDRE of 30 regions in China from 2016 to 2020. The calculation steps are as follows:
Before carrying out the entropy method, null and abnormal values should be eliminated. If the data direction is inconsistent, it is necessary to carry out data standardization based on positive and negative indices.
Positive processing:
Negative processing:
where yij is the jth index of the ith sample after processing, i = 1, 2…, n, j = 1, 2…, m.
The more information there is, the smaller the uncertainty is, and the information entropy value is smaller. Therefore, calculate the proportion of the ith sample to this index under the jth index (bij) as follows:
Calculate the entropy value ej of the index bij as follows:
where k is related to the sample size n, , 0 ≤ ej ≤ 1.
The entropy method needs to combine the information utility value provided by the entropy value to determine the weight. Therefore, calculate the information utility value (dj) of the jth index as:
Calculate the weight () of each index as follows:
The sample data was multiplied by the corresponding weight and accumulated, which is the “comprehensive score”. Calculate the comprehensive score (Si) of each sample as follows:
3.1.2. Comprehensive Score of Green Finance
We used the entropy method to calculate 10 tertiary indices of green finance, and the comprehensive scores of green finance development of 30 regions in China are shown in Table 3:
Table 3.
The comprehensive scores of green finance.
Results in Table 3 show that green finance in Beijing, Shanghai, Guangdong, Jiangsu, Shandong, and Zhejiang have an excellent ranking from 2016 to 2020. Among the top five regions, it is worth noting that Guangdong’s comprehensive score has increased from 0.286 to 0.346, with the fastest growth rate over 20%. This may be because these regions present the long-term stability of economic strength, and their strong economic resilience and rapid upgrading of their industrial structure have attracted a large amount of green capital investment, promoting a virtuous cycle between finance and green development.
The comprehensive scores of Hainan, Yunnan, Guizhou, and other regions ranked at the bottom of the list, with the scores all being lower than 0.15. However, according to the growth rate of the comprehensive scores, Guangxi has reached 10.22%, and Guizhou has reached 16.95%. Through the coordinated development of ecological protection and regional economic quality, the improved ecological efficiency has stimulated the potential of green finance, and the role of infrastructure optimization has gradually become prominent [27].
On the whole, there are prominent regional differences in green finance development. The coastal and developed regions lead the process of green finance, while most central and western regions in China remain lagging.
3.1.3. Comprehensive Score of SDRE
Through the calculation of 19 tertiary indices of SDRE, we obtained the comprehensive score of SDRE of 30 regions in China. The results are illustrated in Table 4.
Table 4.
The comprehensive score of SDRE.
Table 4 shows that Guangdong, Jiangsu, Zhejiang, Shanghai, Beijing, and Shandong are far ahead of each other in rankings, which may benefit from the favorable agglomeration function of the Bohai Economic Circle and the Zhuhai Economic Circle. Among them, Guangdong has the highest comprehensive score. Its score exceeded 0.5 every year. The possible causes of this result are as follows: the regional industrial division has provided the main driving force for Guangdong’s regional economic collaborative development, and Guangdong’s collaborative development level has evolved from the intermediate diffusion stage to the advanced symbiosis stage [28].
Table 4 also shows that the lower-ranked regions are concentrated in Gansu, Guizhou, Yunnan, Ningxia, etc., with average comprehensive scores ranging from 0.1 to 0.15. The causes of these results might be related to the geographical disadvantages since ancient times, the excessive dependence on the primary industry, which makes industrial restructuring a long process, and the gap in the level of sustainable comprehensive development.
Overall, there is a significant increase at the national level. The level of SDRE varies significantly among each region. Regions distributed in the eastern and coastal areas generally have a high ranking. In addition, the western and northeastern regions in China still have a large space for sustainable development.
3.2. Analysis of Coupling Coordination Degree between Green Finance and SDRE
To further identify the coupling coordination degree between green finance and SDRE in different regions, we established the coupling coordination degree model as follows:
where and are the comprehensive scores of green finance and SDRE, and are the coefficients, respectively. C represents the coupling degree. T represents the coordination index, and D represents the coupling coordination degree.
We divided the coupling coordination degree D into four levels: low coordination (0 < D ≤ 0.3, coordination level 1), basic coordination (0.3 < D ≤ 0.4, coordination level 2), good coordination (0.4 < D ≤ 0.6, coordination level 3), and excellent coordination (0.6 < D ≤ 1, coordination level 4). Table 5 provides the coupling coordination degree between green finance and SDRE.
Table 5.
Calculation results of coupling coordination.
From a macro perspective, the average level of coupling coordination has risen from 0.186 to 0.995, showing a significant improvement. The national coupling coordination degree has moved from low coordination to excellent coordination, and the sustainable construction of China’s regional economy has continued to improve.
It can also be seen from the results that there is time heterogeneity in the coupling coordination degree. From 2016 to 2017, continuous economic growth boosted the development of the green economy, and the national coupling coordination degree rose to good coordination. Then, the coupling coordination decreased in 2018 because the economy was in the initial transition period from high-speed development to high-quality development. In addition, the slowdown of economic growth and the adjustment of industrial transformation has reduced the degree of national coupling coordination in the short term. From 2019 to 2020, the coupling coordination degree of green finance and SDRE rapidly improved and reached excellent coordination with improving the quality of economic development.
To further analyze the regional differences in the coupling development of green finance and SDRE, we continued calculating the D-value of coupling coordination for the 30 regions of China (see Table 6).
Table 6.
D-value of coupling coordination degree of 30 regions.
To intuitively show the difference in coupling coordination between green finance and SDRE in each region, we created the combination Figure 1:
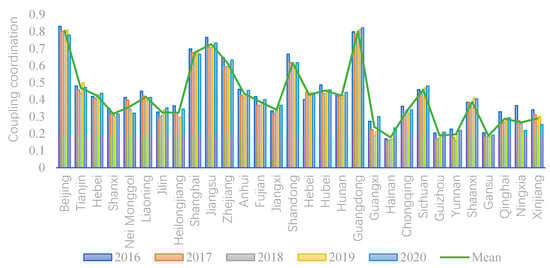
Figure 1.
Coupling coordination degree of 30 regions.
According to Figure 1, the regions with rapid economic growth present higher scores of green finance and SDRE and possess better development synchronicity. Regions with a high degree of coupling coordination, such as Beijing, Guangdong, Jiangsu, Shanghai, Zhejiang, and Shandong, also barely show annual fluctuation.
However, the coupling coordination results of the northeast, central and western regions are inferior to those of the eastern coastal region, which is consistent with the comprehensive development level of green finance and SDRE calculated above. When the comprehensive level of green finance and SDRE is a “high–high” type, the coupling coordination between them is enhanced. When the comprehensive level of green finance and SDRE is a “low–high” or “low–low” type, the regional coordination effect will be limited. Take Fujian Province as an example. As a coastal area in southeast China, it has made brilliant achievements in economic development. However, the development of green finance in this region is relatively backward compared with other regions, making its coupling coordination relatively low.
According to the above coupling coordination results, we can obtain the average coupling coordination of each region. The 30 regions in the study sample can be divided into four echelons, the echelon of 1st to 4th, containing regions of excellent coordination, good coordination, basic coordination, and low coordination.
Table 7 displays the classification of echelons by the average D-value.
Table 7.
Classification of echelon according to coupling coordination.
We used Amap (https://lbs.amap.com/, accessed on 1 January 2023) to make the spatial difference distribution map of the coupling coordination for each echelon. The left-side legend shows the range of coupling coordination values (see Figure 2). The D-value between green finance and SDRE in various regions is quite different. The coupling coordination between green finance and SDRE in eastern coastal areas and Beijing is relatively higher than in western inland, northeast, and central regions of China.
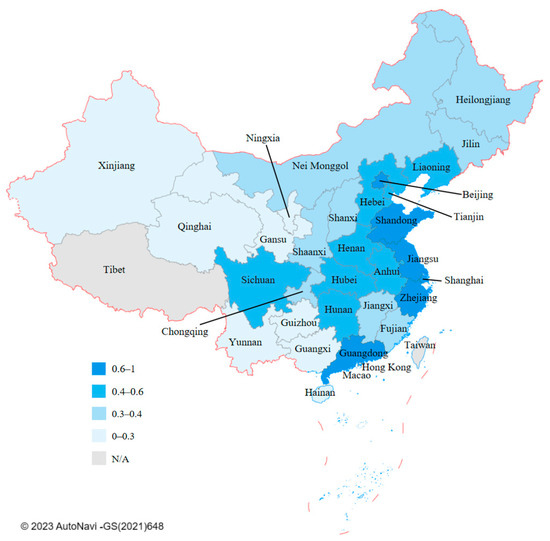
Figure 2.
Spatial difference of coupling coordination among 30 regions. Notes: The map conforms to the national standards for surveying, mapping and geographic information stipulated by the State Bureau of Surveying and Mapping of China. We did not calculate the D-value of Tibet, Hong Kong, Macao, and Taiwan, as these regions’ data were incomplete.
4. Panel Regression Analysis of Green Finance’s Impact on SDRE
Referring to the research of Liu et al. and Tang et al. [29,30], we added scientific research input, urbanization rate, and education expenditure level as control variables to construct the model, taking the comprehensive level of SDRE as the explained variable and the development of green finance as the core explanatory variable.
Considering the imbalanced developmental level among 30 regions in China, to make the empirical analysis results more effective, we establish the following regression model as follows:
where i and t denote the index of region and year; SDREit denotes the comprehensive level of regional economy sustainable development; GFinit denotes the comprehensive level of green finance development; Investit is the control variable that represents the scientific research input; Urbanit is the control variable that represents the urbanization rate; Educationit is the control variable that represents the education expenditure level; and εit is the stochastic error term.
4.1. Descriptive Analysis
We utilized stata16 software for statistical characteristics analysis to observe the sequence stability of each statistical index. Table 8 shows the statistical description of the variables:
Table 8.
The statistical description of variables.
Through the analysis in Table 8, we found that the maximum and minimum comprehensive scores of green finance and SDRE differ exponentially, indicating that the degree of green finance and SDRE in each region is significantly unbalanced, and showing spatial differences. The standard deviation of the control variables Invest and Education is small, indicating that the level of scientific research input and education expenditure in each region has slight volatility. The high standard deviation of the urbanization rate reflects the unevenness of urbanization construction among regions.
4.2. Pearson Correlation Test
We calculated the correlation coefficient between variables to check their linear correlation. Table 9 displays the Pearson coefficient of variables.
Table 9.
Pearson coefficient of variables.
The correlation coefficients among the variables were less than 0.8. The VIF test results of Urban, Invest, GFin, and Education are 3.180, 2.750, 2.140, and 1.650, respectively. All the variance inflation factors are less than 10, and the mean value is 2.43, indicating no serious multicollinearity.
Then, we conducted the Hausman test to select the random effect model or fixed-effect model. The Hausman test results show that the p-value < 0.01. Therefore, we chose the fixed-effect model.
4.3. Panel Data Regression Analysis
We discussed the influence of green finance on SDRE using the panel data of 30 regions in China from 2016 to 2020. By comparing the three regression models, including the ordinary least squares model (OLS), the random effect model (RE), and the fixed-effect model (FE), FE is finally determined as the model for this study. Table 10 provides the regression results of OLS, RE and FE.
Table 10.
Regression results of OLS/RE/FE.
According to the RE regression results, the core variable GFin shows positive feedback on the SDRE. The p-value of Invest is less than 0.01, and the coefficient is better than 2, meaning scientific research input plays a significant role in promoting the SDRE. As the Hausman test suggests the FE regression, we mainly discuss the FE results.
According to the FE regression results, the development of green finance (p < 0.05) can improve the comprehensive level of SDRE. Nevertheless, the coefficient is 0.2033. The coefficient of scientific research input is 1.8032 at the 1% significance level, indicating that it can vigorously promote SDRE. The level of education expenditure failed to show a significant impact, but the p-value of the urbanization rate was less than 0.01, meaning that it plays an important positive role.
4.4. Regional Heterogeneity Analysis
The geographical location and resource input of regions in China vary significantly, potentially affecting the relationship between variables. Therefore, we further explored the impact caused by regional differences based on the four echelons classification of Table 7. According to the Hausman test result, we selected the fixed-effect model for regression in different regions based on the green finance and SDRE levels. Table 11 provides the regression results of each echelon.
Table 11.
Regression results of each echelon.
Through the analysis of regression results, we can see that:
- (1)
- Compared with other regions, green finance in the 1st echelon in which regions have a significant role in promoting the SDRE. The p-value is less than 0.05 and the coefficient is 0.6947. Due to the increasingly mature financial industry, sound green finance policies, the green finance market in China is prosperous. The urbanization rate is significant at the 1% level, with a coefficient of 1.7988, while the level of scientific research input Invest and education expenditure Education has no significant influence. That might be because the development level of scientific innovation and urbanization in the 1st echelon regions have been maintained in a high state. These impacts have not been fully revealed.
- (2)
- Green finance shows a certain inhibition effect on the SDRE in the 2nd echelon regions, with a p-value less than 0.1 and a coefficient of −0.0894. The possible reason may be that the development of regional green finance in the 2nd echelon needs to catch up since the sustainable economy is still in the fundamental stage. An unreasonable industrial structure need to continuous restructure, superabundant energy-intensive industries also need more capital support for the transition to environmental friendly industries. In addition, the innovation cycle of scientific technology and education takes a long time to achieve; thus, it might not play an obvious role in the process of SDRE in the short term. Therefore, the coupling coordination between green finance and SDRE in the 2nd echelon needs to be strengthened.
- (3)
- Due to the geographical disadvantages of the 3rd and 4th echelon regions, green finance has problems such as late start and policy lag. It plays a minor role in promoting regional sustainability. However, the control variable Invest has significant positive feedback in the 4th echelon, possibly due to new scientific research forces have been introduced in economically backward regions recent years. The influence of education expenditure level is insignificant because the period of education investment return is longer, and it is only a tiny link in the SDRE.
5. Robustness Test
We launched the robustness test from three aspects:
- (1)
- The explained variable lags one phase to prove the original regression model’s reliability.
- (2)
- To confirm the rationality of the empirical analysis, the comprehensive level of SDRE was divided into two groups: the high stage and the primary stage.
- (3)
- To further verify the impact of green finance on the SDRE, the explanatory variable green financial development level was divided into two groups: good level and laggard level.
The results are as follows:
- (1)
- Results of the explained variable lag one phase. According to test Ⅰ in Table 12, the regression results of lagging the explained variable SDRE for one phase show that the core explanatory variables GFin and the control variables Invest, Urban, and Education are significantly verified, with p-values of less than 0.01. It proves that the original regression model is reliable.
Table 12. Regression results of the robustness test.
- (2)
- Grouping regression results of SDRE. The panel data were divided into two groups according to the median of the SDRE: the high stage and the primary stage for the robustness test. According to test Ⅱ in Table 12, green finance significantly impacts the SDRE in the two stages, which have passed the robustness verification. The GFin’s coefficient in primary stage is 0.0492, while in high stage is 0.6906, meaning that green finance has a more substantial promoting effect on the SDRE at the high stage.
- (3)
- Group regression results of green finance. According to test Ⅲ in Table 12, green finance is divided into two groups of regression: good level and laggard level. In the group of good level, green finance has a significant positive role in promoting SDRE. The p-value of GFin is less than 0.05, and the coefficient is 0.2258. Additionally, the control variables Invest, Urban, and Education are significantly verified with p-values of less than 0.01, which means our model can be considered stable. However, the green finance of the laggard level group has an insignificant impact on the SDRE, which may be due to the deviation effect caused by their low comprehensive ranking and relative imbalance. This finding corroborates the studies mentioned in the literature review [19]. The results show that the laggard level of green finance cannot be effectively connected with industrial restructuring and SDRE, resulting in the insignificant support of green finance on economic growth.
6. Conclusions and Expectations
As an emerging economic activity, green finance can effectively control and reduce carbon emissions, promote the upgrading of energy-intensive industries from the capital level, and help the economy achieve sustainable development.
This study carried out an in-depth analysis of green finance’s influence mechanism on SDRE, seeking a new scheme to accelerate the process of sustainable development. We used the entropy method to process panel data of 30 regions in China from 2016 to 2020 and tested the coupling coordination and regional heterogeneity between green finance and SDRE. Then, we divided the regional echelons according to coupling coordination and constructed a panel regression to empirically analyze the relationship between green finance and SDRE. The main conclusions are as follows:
- According to the comprehensive scores of green finance and SDRE calculated using the entropy method, the overall levels of green finance and SDRE have steadily improved from 2016 to 2020. Generally, most eastern coastal regions have been leading the ranking, while the development score of the central and western regions has increased but still lags significantly behind the former.
- The coupling coordination analysis shows that the eastern coastal region is mainly in good or excellent coupling coordination, the central regions are mainly at the basic coupling stage, and the western inland regions are mainly at a low level. The difference depends on the development level of green finance and SDRE.
- According to the analysis of regional heterogeneity, green finance has the most significant positive impact in the 1st echelon, followed by an insignificant role in the 3rd and 4th echelons. Nevertheless, it has a certain inhibition effect in the 2nd echelon, showing vigorous characteristics of regional heterogeneity.
This research measures the level of green finance and SDRE from a multi-dimensional system and accurately divides the echelons according to the coordination effect between green finance and SDRE. It provides theoretical support and effective suggestions for seeking suitable, characteristic, and diversified economic development modes for each region that considers the dual objectives of economic development and environmental protection. However, some aspects still need improvement, such as some regions’ green finance data not being fully disclosed and the database for measuring green finance development being limited.
Moreover, future research needs to extend the period of research data and explore the impact mechanism of green finance and sustainable development in different economic cycles. Research on sustainable development can also be refined from the macro to the micro level. The sustainable development of the economy can be explored from the perspective of corporate responsibility, corporate behavior, and corporate innovation. The post-COVID-19 era has shown great potential in enabling green development, and this theme could also be the focus of future sustainable development research.
Author Contributions
Conceptualization, H.M.; Methodology, H.M.; Software, X.M.; Investigation, Z.W.; Resources, Z.W.; Writing—Original draft, X.M.; Writing—Review & editing, H.M.; Supervision, X.W.; Project administration, H.M. and X.W.; Funding acquisition, H.M. All authors have read and agreed to the published version of the manuscript.
Funding
This research was funded by Qingdao Social Science Planning Project, grant number [QDSKL2201136] and Shandong Statistical Scientific Research Program, grant number [KT022].
Institutional Review Board Statement
Not applicable.
Informed Consent Statement
Not applicable.
Data Availability Statement
The data presented in this study are available from the Statistics Yearbooks and CSMAR database.
Conflicts of Interest
The authors declare no conflict of interest.
References
- Huang, Z.; Dong, H.; Jia, S. Equilibrium pricing for carbon emission in response to the target of carbon emission peaking. Energy Econ. 2022, 112, 106160. [Google Scholar] [CrossRef]
- Sadiq, M.; Amayri, M.A.; Paramaiah, C.; Mai, N.H.; Ngo, T.Q.; Phan, T.T.H. How green finance and financial development promote green economic growth: Deployment of clean energy sources in South Asia. Environ. Sci. Pollut. Res. 2022, 29, 65521–65534. [Google Scholar] [CrossRef]
- Mngumi, F.; Shaorong, S.R.; Shair, F.; Maqas, M. Does green finance mitigate the effects of climate variability: Role of renewable energy investment and infrastructure. Environ. Sci. Pollut. Res. 2022, 29, 59287–59299. [Google Scholar] [CrossRef]
- Jia, Q.X. The impact of green finance on the level of decarbonization of the economies: An analysis of the United States’, China’s, and Russia’s current agenda. Bus. Strategy Environ. 2022, 32, 110–119. [Google Scholar] [CrossRef]
- Zhou, X.G.; Tang, X.M.; Zhang, R. Impact of green finance on economic development and environmental quality: A study based on provincial panel data from China. Environ. Sci. Pollut. Res. 2020, 27, 19915–19932. [Google Scholar] [CrossRef]
- Wang, X.Y.; Zhao, H.K.; Bi, K.X. The measurement of green finance index and the development forecast of green finance in China. Environ. Ecol. Stat. 2021, 28, 263–285. [Google Scholar] [CrossRef]
- Mohsin, M.; Taghizadeh-Hesary, F.; Panthamit, N.; Anwar, S.; Abbas, Q.; Vo, X.V. Developing Low Carbon Finance Index: Evidence From Developed and Developing Economies. Financ. Res. Lett. 2020, 43, 101520. [Google Scholar] [CrossRef]
- Ren, S.Y.; Wu, H.T. Path to green development: The role environmental regulation and labor skill premium on green total factor energy efficiency. Green Financ. 2022, 4, 387–410. [Google Scholar] [CrossRef]
- Wan, Q.L.; Qian, J.E.; Yu, M.M. Analysis of Green Financial Policy Utility: A Policy Incentive Financial Mechanism Based on State Space Model Theory Algorithm. J. Sens. 2022, 2022, 5978122. [Google Scholar] [CrossRef]
- Bai, J.C.; Chen, Z.L.; Yan, X.; Zhang, Y.Y. Research on the impact of green finance on carbon emissions: Evidence from China. Econ. Res.-Ekon. Istraz. 2022, 35, 6965–6984. [Google Scholar] [CrossRef]
- Xing, L.N.; Li, J.; Yu, Z. Green Finance Strategies for the Zero-Carbon Mechanism: Public Spending as New Determinants of Sustainable Development. Front. Environ. Sci. 2022, 10, 925678. [Google Scholar] [CrossRef]
- Flammer, C. Corporate green bonds. J. Financ. Econ. 2021, 142, 499–516. [Google Scholar] [CrossRef]
- Ye, T.F.; Xiang, X.L.; Ge, X.Y.; Yang, K.L. Research on Green Finance and Green Development Based Eco-Efficiency and Spatial Econometric Analysis. Sustainability 2022, 14, 2825. [Google Scholar] [CrossRef]
- Lin, T.; Du, M.Y.; Ren, S.Y. How do green bonds affect green technology innovation? Firm evidence from China. Green Financ. 2022, 4, 492–511. [Google Scholar] [CrossRef]
- Wang, K.H.; Zhao, Y.X.; Jiang, C.F.; Li, Z.Z. Does green finance inspire sustainable development? Evidence from a global perspective. Econ. Anal. Policy 2022, 75, 412–426. [Google Scholar] [CrossRef]
- Huang, Y.M.; Chen, C.; Lei, L.J.; Zhang, Y.P. Impacts of green finance on green innovation: A spatial and nonlinear perspective. J. Clean. Prod. 2022, 365, 132548. [Google Scholar] [CrossRef]
- Zhang, J.; Ke, H.Q. The Moderating Effect and Threshold Effect of Green Finance on Carbon Intensity: From the Perspective of Capital Accumulation. Complexity 2022, 2022, 4273691. [Google Scholar] [CrossRef]
- Zhou, H.J.; Xu, G.Y. Research on the impact of green finance on China’s regional ecological development based on system GMM model. Resour. Policy 2022, 75, 102454. [Google Scholar] [CrossRef]
- Yin, X.L.; Xu, Z.R. An empirical analysis of the coupling and coordinative development of China’s green finance and economic growth. Resour. Policy 2022, 75, 102476. [Google Scholar] [CrossRef]
- Zeng, Y.T.; Wang, F.; Wu, J. The Impact of Green Finance on Urban Haze Pollution in China: A Technological Innovation Perspective. Energies 2022, 15, 801. [Google Scholar] [CrossRef]
- Lee, C.C.; Lee, C.C. How does green finance affect green total factor productivity? Evidence from China. Energy Econ. 2022, 107, 105863. [Google Scholar] [CrossRef]
- Ge, L.; Zhao, H.X.; Yang, J.Y.; Yu, J.Y.; He, T.Y. Green finance, technological progress, and ecological performance-evidence from 30 Provinces in China. Environ. Sci. Pollut. Res. 2022, 29, 66295–66314. [Google Scholar] [CrossRef]
- Li, Y.; Zhang, X.T.; Gao, X.X. An Evaluation of the Coupling Coordination Degree of an Urban Economy-Society-Environment System Based on a Multi-Scenario Analysis: The Case of Chengde City in China. Sustainability 2022, 14, 6790. [Google Scholar] [CrossRef]
- Huan, Y.Z.; Liang, T.; Li, H.T.; Zhang, C.S. A systematic method for assessing progress of achieving sustainable development goals: A case study of 15 countries. Sci. Total Environ. 2021, 752, 141875. [Google Scholar] [CrossRef]
- Gao, J.L.; Shao, C.F.; Chen, S.H.; Zhang, X.T. Spatiotemporal evolution of sustainable development of China’s provinces: A modelling approach. Ecosyst. Health Sustain. 2021, 7, 1965034. [Google Scholar] [CrossRef]
- Jin, H.; Qian, X.Y.; Chin, T.C.; Zhang, H.J. A Global Assessment of Sustainable Development Based on Modification of the Human Development Index via the Entropy Method. Sustainability 2020, 12, 3251. [Google Scholar] [CrossRef]
- Cheng, Z.; Zhao, T.Y.; Zhu, Y.X.; Li, H.S. Evaluating the Coupling Coordinated Development between Regional Ecological Protection and High-Quality Development: A Case Study of Guizhou, China. Land 2022, 11, 1775. [Google Scholar] [CrossRef]
- Chen, L.F.; Wu, H. Measuring the Level of Regional Economic Synergistic Development and Its Driving Factors. Emerg. Mark. Financ. Trade 2022, 1–18. [Google Scholar] [CrossRef]
- Liu, R.Y.; Wang, D.Q.; Zhang, L.; Zhang, L.H. Can green financial development promote regional ecological efficiency? A case study of China. Nat. Hazards 2019, 95, 325–341. [Google Scholar] [CrossRef]
- Tang, M.L.; Ding, J.N.; Kong, H.J.; Bethel, B.J.; Tang, D.C. Influence of Green Finance on Ecological Environment Quality in Yangtze River Delta. Int. J. Environ. Res. Public Health 2022, 19, 10692. [Google Scholar] [CrossRef]
Disclaimer/Publisher’s Note: The statements, opinions and data contained in all publications are solely those of the individual author(s) and contributor(s) and not of MDPI and/or the editor(s). MDPI and/or the editor(s) disclaim responsibility for any injury to people or property resulting from any ideas, methods, instructions or products referred to in the content. |
© 2023 by the authors. Licensee MDPI, Basel, Switzerland. This article is an open access article distributed under the terms and conditions of the Creative Commons Attribution (CC BY) license (https://creativecommons.org/licenses/by/4.0/).