1. Introduction
The study of the spatial configuration of hospitals, as major public facilities in cities, has increasingly gained attention in the fields of urban planning, geographic information science, and urban management in recent years. Scholars have conducted extensive research on hospitals’ accessibility [
1,
2,
3,
4], spatial service scope [
5,
6,
7,
8], and fair issues [
9,
10,
11] to assist urban planners and managers in evaluating and analyzing the effectiveness of hospital space configuration. The basic idea of these studies is to connect the demand location and the supply location and to investigate the characteristics of hospitals from the perspective of supply and demand balance. In these studies, researchers optimized the spatial layout of hospitals by quantifying the service level of hospitals and evaluating the supply–demand balance of the spatial allocation of urban medical resources, which not only helped to improve the fairness of medical resources of citizens but also enabled urban planning to allocate medical space from the “user perspective”, which represents the idea of being people-oriented.
However, the current urban construction planning usually has certain limitations and cannot achieve the above objectives well. For example, the construction planning of Chinese hospitals is based on the Planning Outline of the Chinese Medical and Health Service System (POCMHSS). Although the per capita beds and other indicators are considered from the perspective of users, it still stays at the stage based on the service radius and rigidity index. This “top-down” planning overemphasizes rigid markers, which in some cases cannot meet people’s actual needs. For example, in conventional planning, the scope of public facilities is modeled as circular, while the actual scope is shaped differently [
3]. Hospital classification and resource allocation are also based on POCMHSS and Chinese Hospital Hierarchical Management Measures (CHHMM). Even though regional and traffic conditions differ between hospitals of the same level, they all have the same service offerings and resource distribution. As a result, planning and actual circumstances diverge significantly [
12]. Due to the uneven distribution of medical resources, some hospitals may be overcrowded, while others may not be fully utilized or even empty. Therefore, this traditional method fails to accurately reflect the supply–demand balance and characteristics of hospital spatial services due to the models of patients’ medical treatment giving them insufficient consideration.
In addition, traditional research techniques rely on static data from sources such as travel surveys, medical records, and census data. On the one hand, it is difficult to gather massive confidential data; on the other hand, data collection is expensive, the sample size is small, and the accuracy is low [
13]. However, the extensive application of big data in urban planning provides the possibility for in-depth space configuration research. Scholars [
14] have extracted a large amount of data about traffic and human movement from various data to quantify the supply and demand relationship of public facilities space. Gao et al. [
15] used POI data to evaluate the spatial structure of the urban retail industry and the demands of residents. Li et al. [
16] evaluated the use of public service facilities through Sina micro-blog check-in data and found that the use of public service space was affected by the type of public facilities. Shi et al. [
17] used VGI data to identify the land function of Xi’an city in China and found that the accuracy of identification was 79.26%. Based on POI data and service pressure assessment, Rong Hao et al. [
18] quantified the distribution of urban population and activity intensity to improve the spatial layout of public facilities. In these studies, the methods of detecting urban public facilities based on multi-source data are widely used. They focus on the relationship between people and cities based on big data and “human-oriented” views. This bottom-up method makes up for the limitations of the traditional planning of Chinese hospitals and provides support for research methods for this article. In addition, while using big data, if there is no actual access to patients, it cannot fully reflect the actual supply and demand situation and characteristics of hospital space services. The advantages of big data and actual access should be integrated to provide a basis for reasonable planning.
Based on the medical treatment situation of comprehensive hospitals in Shenzhen and multi-source data, this study linked public facility attributes to the spatial distribution of residents from the perspective of supply and demand and analyzed the guidance of the spatial distribution of patients for urban planners and managers to optimize the spatial distribution and to alleviate traffic congestion while maintaining the supply of hospital services. It has important guiding significance from both economic and humanistic perspectives. The rest of this article is organized as follows.
Section 2 describes the data and processing, along with the research methodology and technical approach.
Section 3 discusses the results of quantifying the spatial service supply level of comprehensive hospitals and the extent of residents’ demand for medical care, and analyzes the characteristics of service blind areas. A new classification of comprehensive hospitals is made based on these results.
Section 4 and
Section 5 provide a discussion and conclusions.
2. Research Contents and METHODS
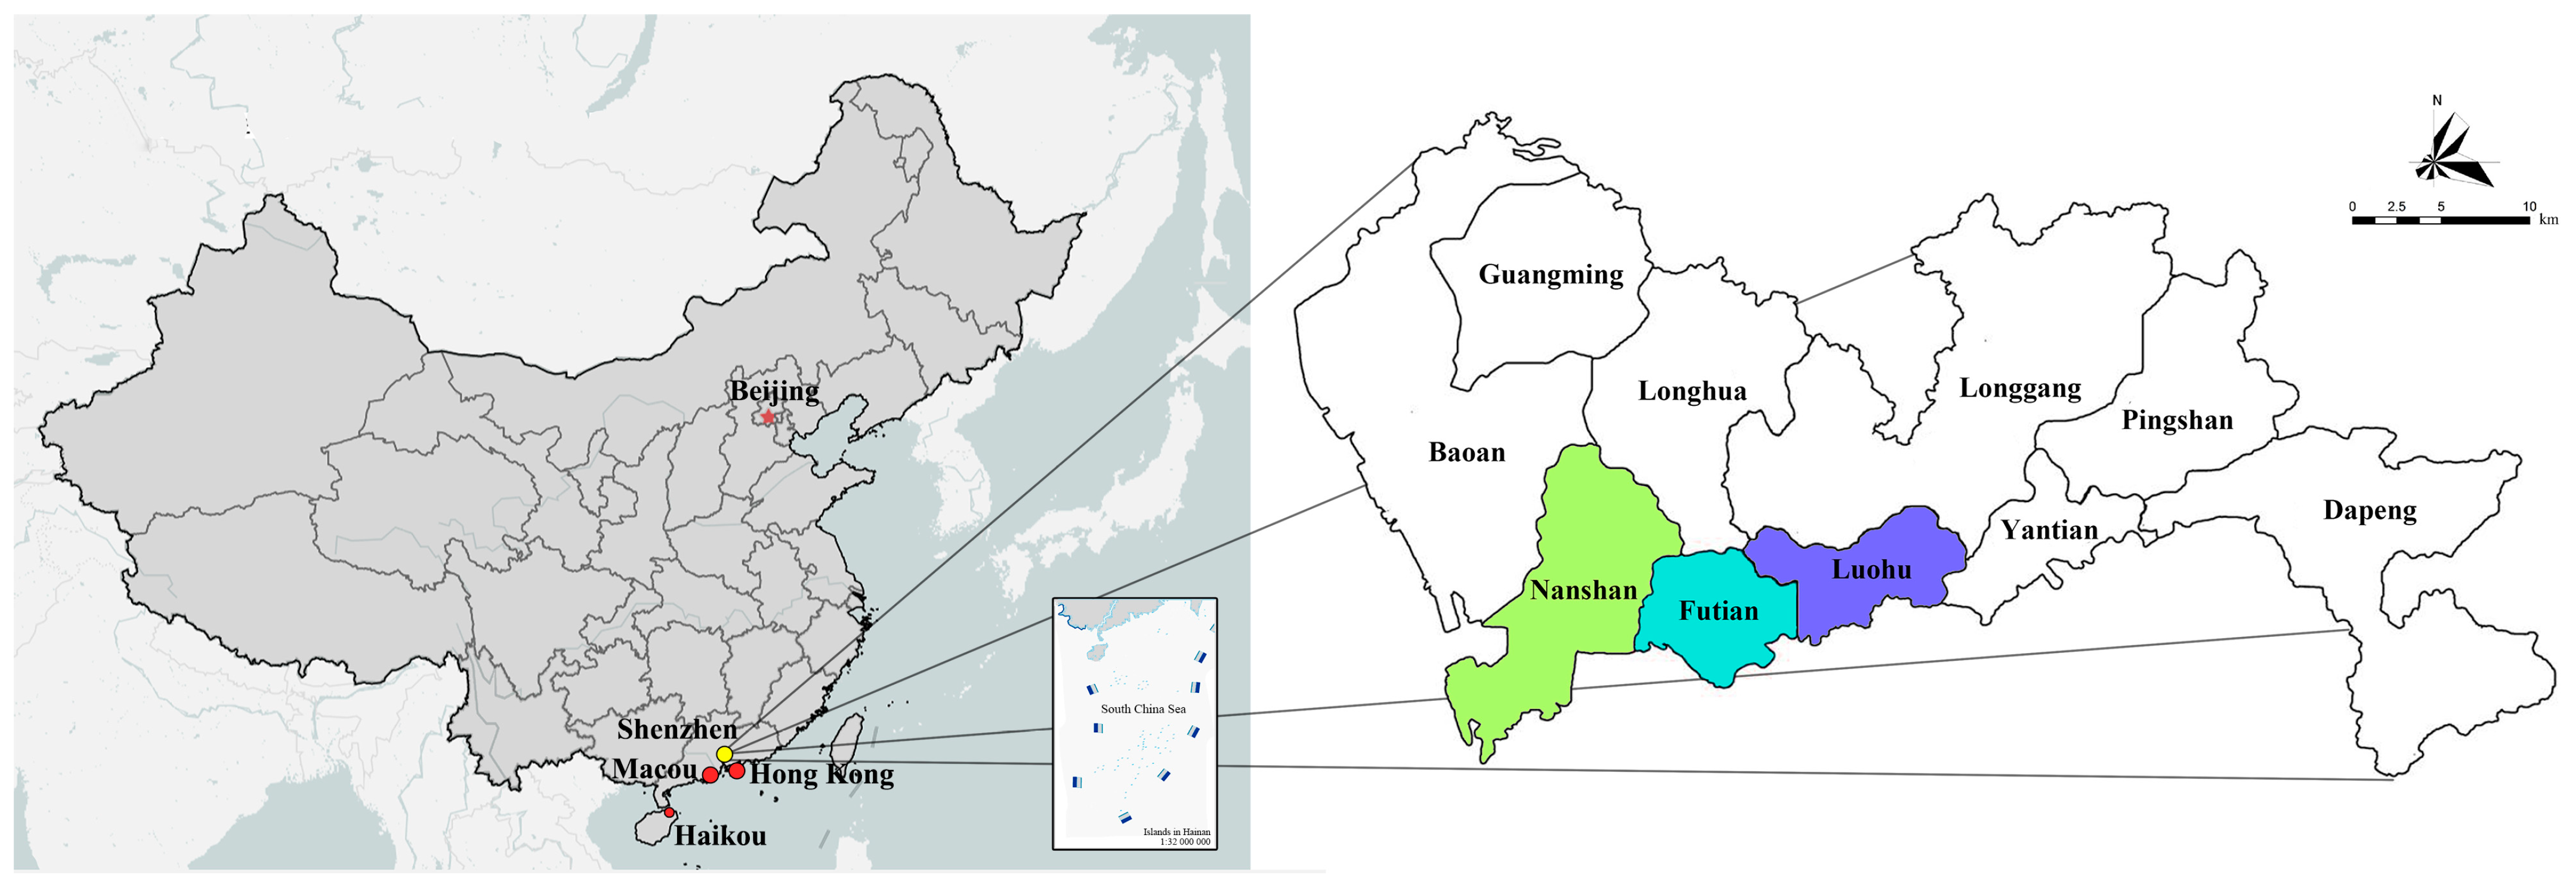
2.1. Research Area and Hospital
The study area of this work is the Nanshan, Futian, and Luohu districts in Shenzhen. Shenzhen is situated in the southern region of Guangdong Province and shares a southern border with Hong Kong, and is one of the core cities of the Guangdong–Hong Kong–Macao Greater Bay Area. It has the characteristics of large population density, a fast pace of life, and rapid economic and cultural development, so its hospital planning issues are more prominent and universal. In addition, this study focuses on the districts of Nanshan, Futian, and Luohu, which are the political, cultural, financial, and information centers of Shenzhen (
Figure 1). The data are more representative, and the total area of the study area is 339.55 km
2.
According to the Shenzhen 2021 Statistics Yearbook, comprehensive hospitals with similar sizes and functions were chosen for comparison and analysis in this study. According to the definition of China Comprehensive Hospital Construction Standards, a comprehensive hospital is a hospital with balanced strength and comprehensive development, various departments and auxiliary departments, and research capability and teaching ability. A total of 182 comprehensive hospitals are widely distributed in the study area, as shown in
Figure 2. In addition, in order to reduce interference, specialized hospitals (such as gynecology, otolaryngology, stomatology, and plastic surgery) and social health clinics with large differences in visitors are not included in this study.
2.2. Research Data
2.2.1. VGI Data
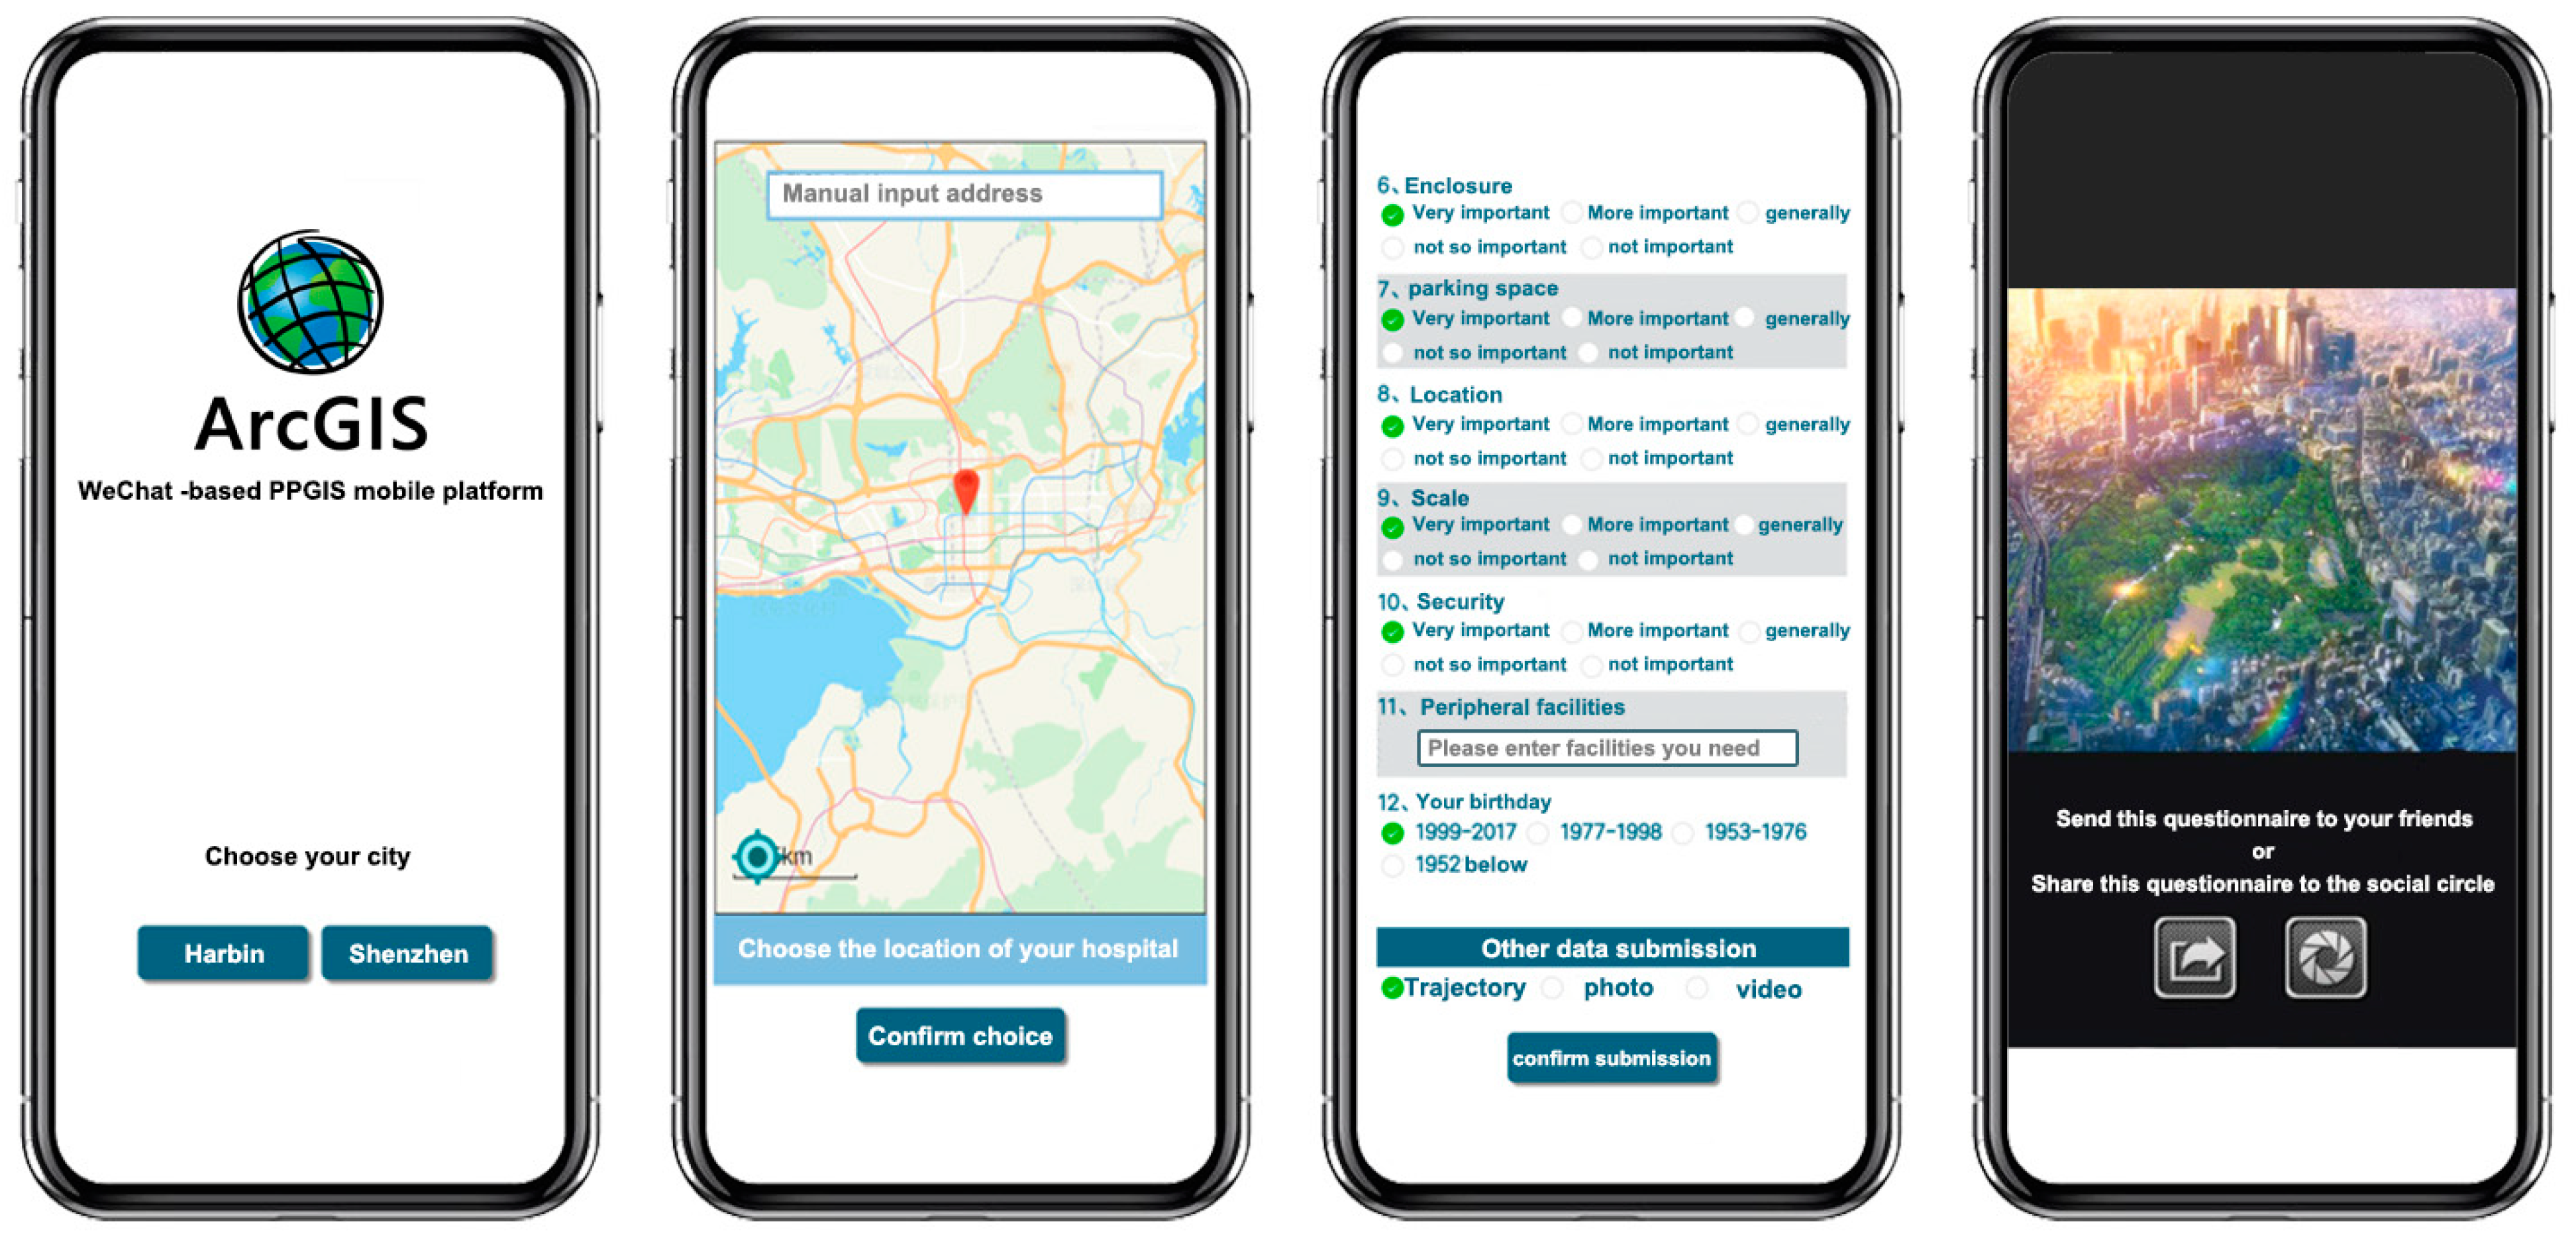
Volunteered geographic information (VGI) data were acquired using the public participation geographic information system (PPGIS) mobile terminal independently developed by our team. PPGIS is a data collection analysis platform based on the GIS platform. It can provide expert geographic information analysis and drawing tools to non-professional residents, enabling them to participate in crucial planning and decision-making. However, an independent application or a web website is necessary for the traditional PPGIS. To submit data, users must complete numerous complex challenges.
To obtain the resident’s VGI data conveniently, we adapted the PPGIS front end to the WeChat platform. WeChat is a social media platform with 1.2 billion users, with the largest number of users in China. Applications developed on WeChat platforms do not need to download and install separately. Furthermore, it can accurately locate the position of residents and share the survey questionnaire information with friends, thereby realizing the mobility of the PPGIS platform (
Figure 3).
The entire system function module is divided into two parts: the front end and back end (
Figure 4). The front end of the system links the API port of the Gaode map platform (similar to Google Maps) and embeds the function of the basic map. Users can directly call the map information. In addition, the system can obtain volunteer geographical location and personal attribute information. The information obtained can be saved in the cloud server. Researchers can process data and GIS space analysis by accessing the back end of the system.
PPGIS mobile terminals can be promoted through the WeChat web, WeChat social circles, Sina Weibo (similar to Twitter), and the web to obtain accurate VGI data. VGI data record the sign-in information of the residents, including the time, personal attributes, questionnaire information, geographical location, and other single-point static geographical information data. By digging massive VGI data samples, the actual situation of the patient’s visit to the hospital can be effectively reflected. VGI data objectively and truly reflect individual social attribute characteristics and their distribution in space, providing high-quality data for the characteristics of public facilities such as hospitals.
According to the “2020 Shenzhen Internet Development” [
19], by the end of 2020, the penetration rate of the Internet (including mobile phones and computers) of Shenzhen residents reached 93.2%. The 20–49-year-old group accounts for 82.1% of the overall netizens, while the people under the age of 20–50 and above account for 8.8% and 9.1%, respectively. There are insufficient limitations of people under 20 and over 50 years old in VGI data. To this end, we have selected six hospitals in the three districts for field surveys to supplement data. A total of 624 VGI data points were collected. In addition, we extracted from the PPGIS mobile terminal 57,912 VGI data points for six consecutive months from March to August of 2021. A total of 58,536 valid VGI data points were extracted in total, and the users’ portraits are shown in
Table 1.
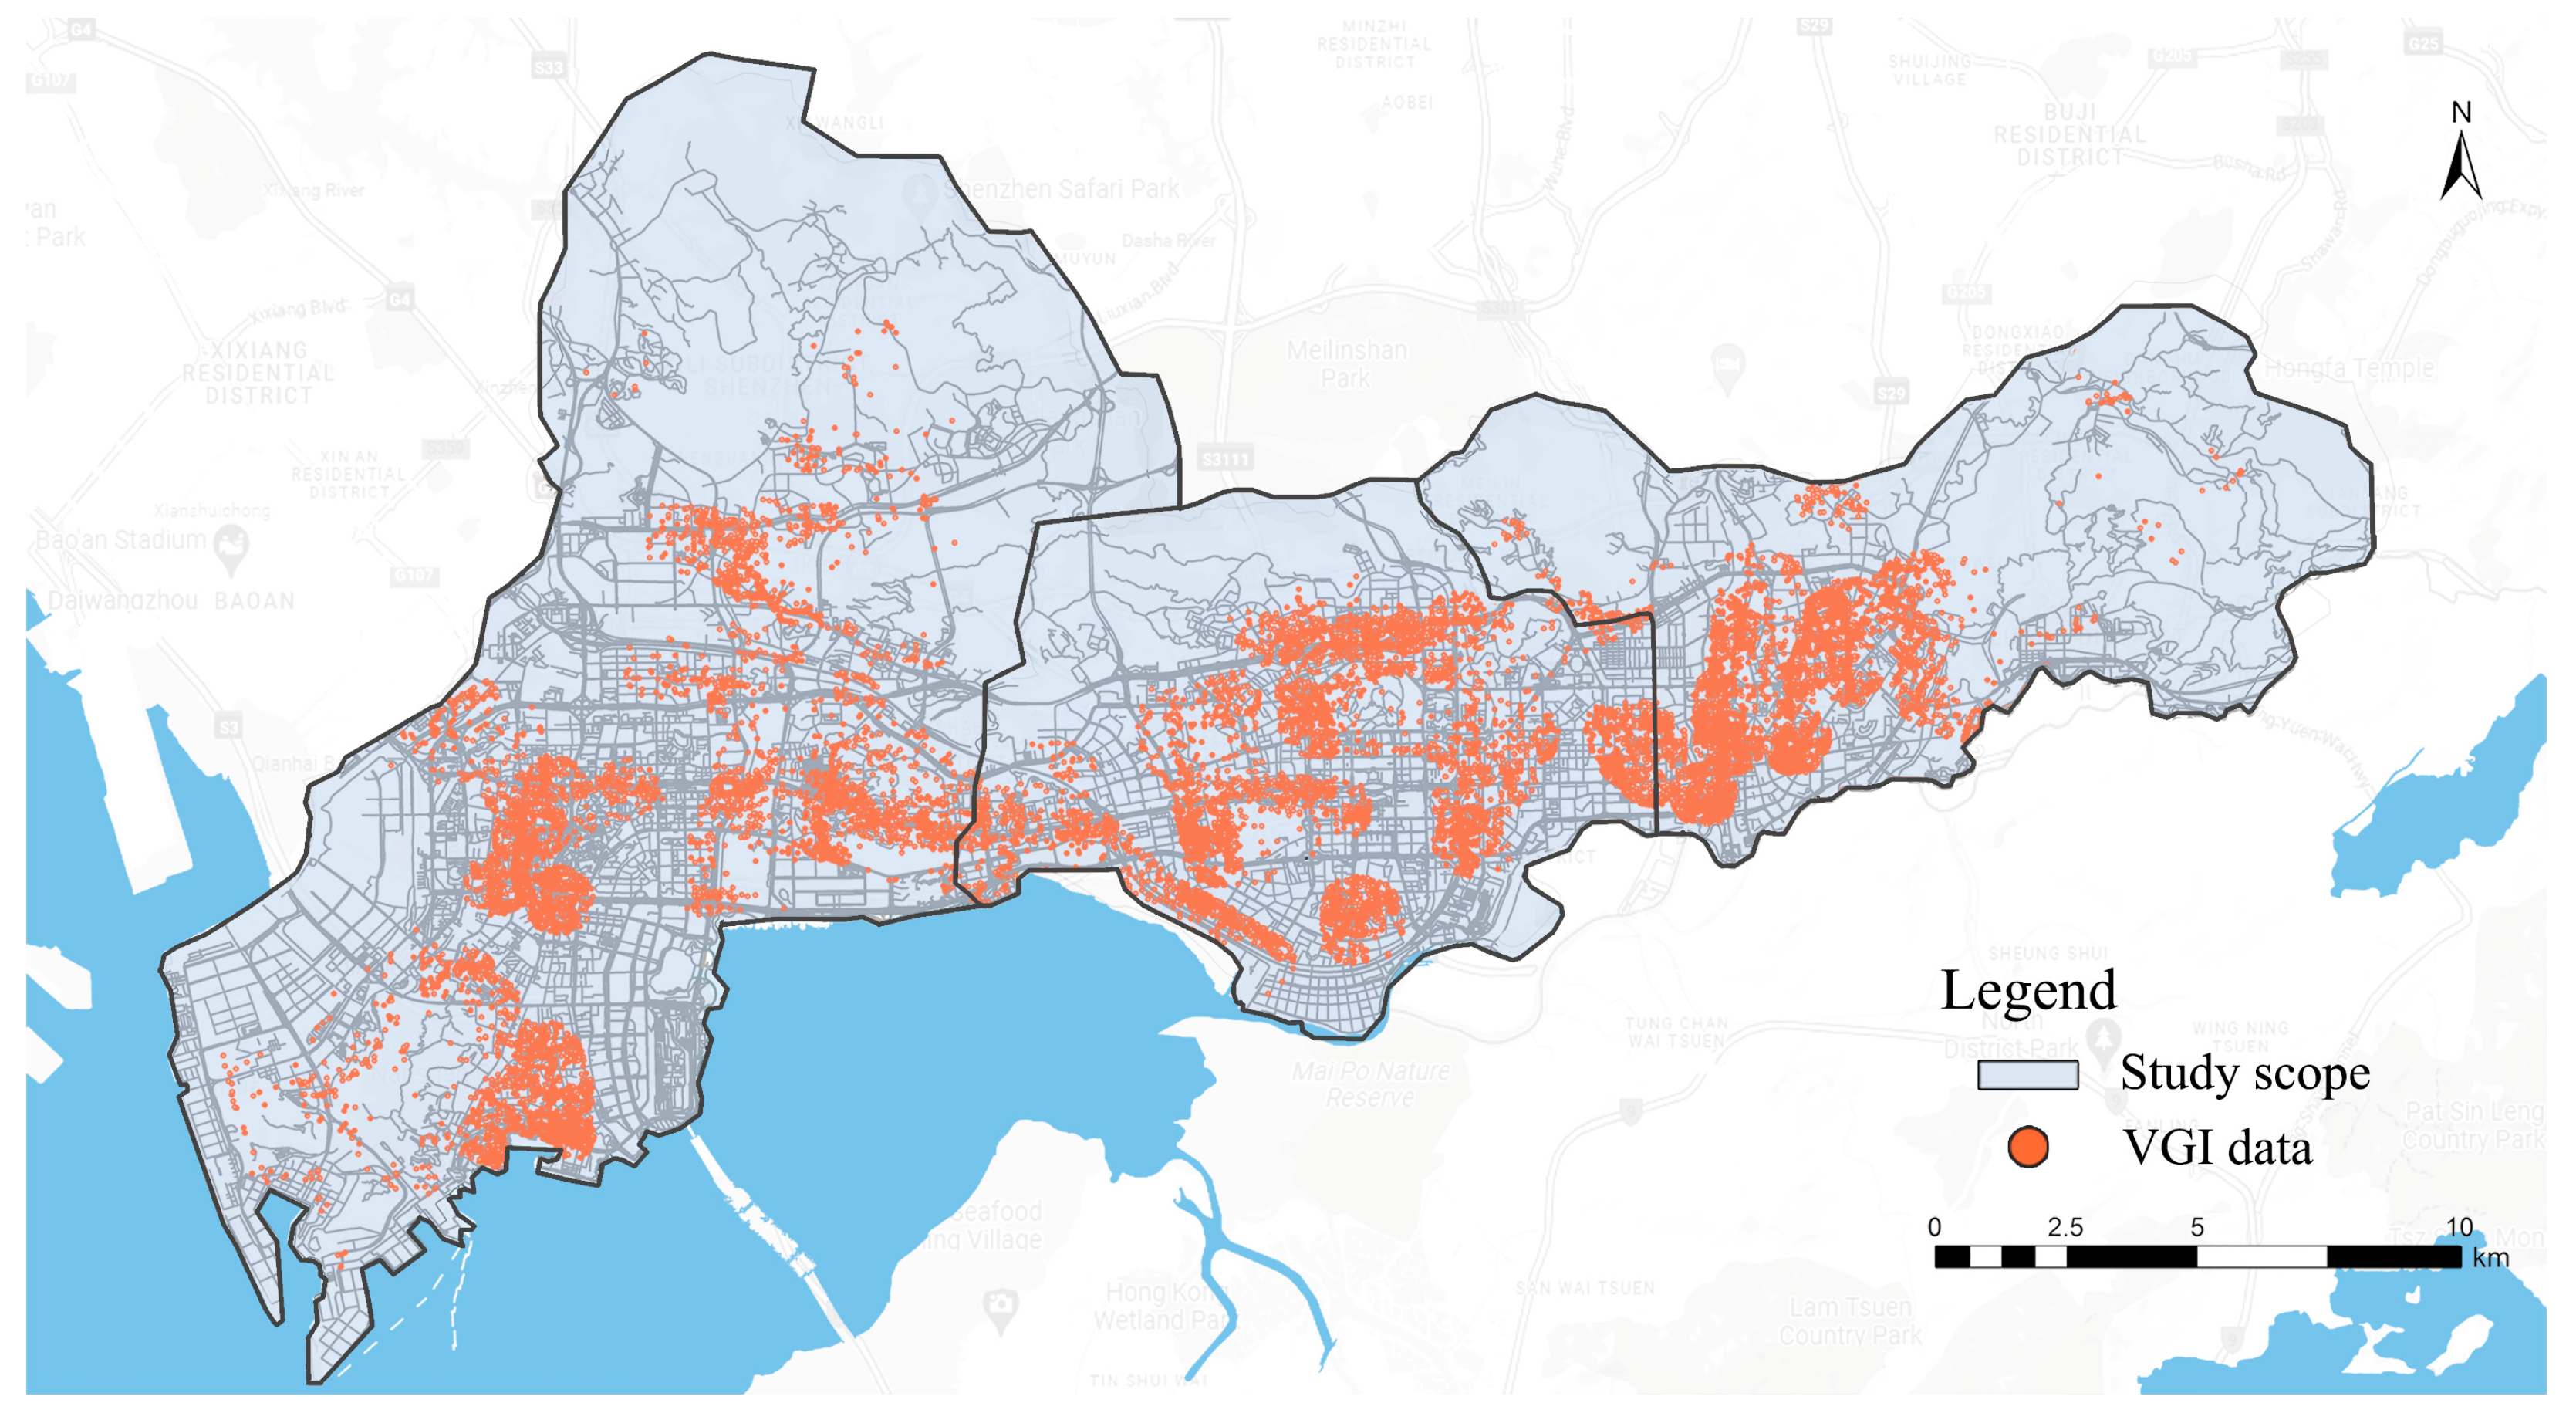
Because the extracted VGI data are more complicated and discrete, and the coordinates are Mars coordinates, the data cannot be directly analyzed by GIS. Therefore, the original data need to be prepared, and repeated data and errors need to be deleted. First, the coordinates of the data are converted from Mars coordinate to the WGS-84 coordinate system; second, the error and repeated information are deleted; finally, the pre-processed 57,124 VGI data are visually analyzed in the GIS cloud platform system and the result is shown in
Figure 5.
2.2.2. POI Data
Point of interest (POI) data are derivative data of navigation maps based on location. They contain spatial information on geographical entities. POI information includes name, category, longitude, latitude, and address. The advantage of POI data is that the information is clear and comprehensive. It can reflect the urban activities of city dwellers and is an important data source for urban analysis [
20].
The number of POI within the scope of hospital services can reflect the density and intensity of the flow of people around the hospital. It demonstrates the intensity of patients visiting the hospital within the scope of each hospital, which is the degree of medical needs of residents. POI data can better characterize residents’ medical needs for hospitals. The higher the density of POI, the greater the demand of residents. To sufficiently analyze the data, the hospital area in the electronic map data and POI attribute table need to be linked. In addition, link data need to be verified by space: POI data, hospital spatial location, and electronic map hospital data are superimposed. The artificial visual interpretation method is used for inspection, and the results are matched. The POI data are divided into 30 categories according to the code of land. However, there is still a difference between POI classification and traditional land function classification [
21]. Furthermore, the influencing factors are an important part of the analysis. According to previous studies [
22,
23], the POI type that has a greater impact on the hospital is selected, some interference factor with less activity intensity is eliminated, and the POIs with similar functions are integrated.
POI types such as education, culture and entertainment, commercial office, transportation facilities, residential buildings, and basic services have been selected. In the POI data obtained, the bus stops and subway sites in the transportation facility can reflect the accessibility of transportation. POI types such as education, culture and entertainment, business announcement, residential buildings, and basic services can be measured as direct measurement factors to obtain regional population distribution. Different people have different demands for hospitals, so they need to be given different weights. Therefore, the analytic hierarchy process (AHP) method is used to evaluate the weight of different POI types, and then the unified data information table is constructed (
Table 2). A total of 397,948 data points in the Nanshan, Futian, and Luohu districts were obtained from the API port of the Gaode Map Open Platform in 2019.
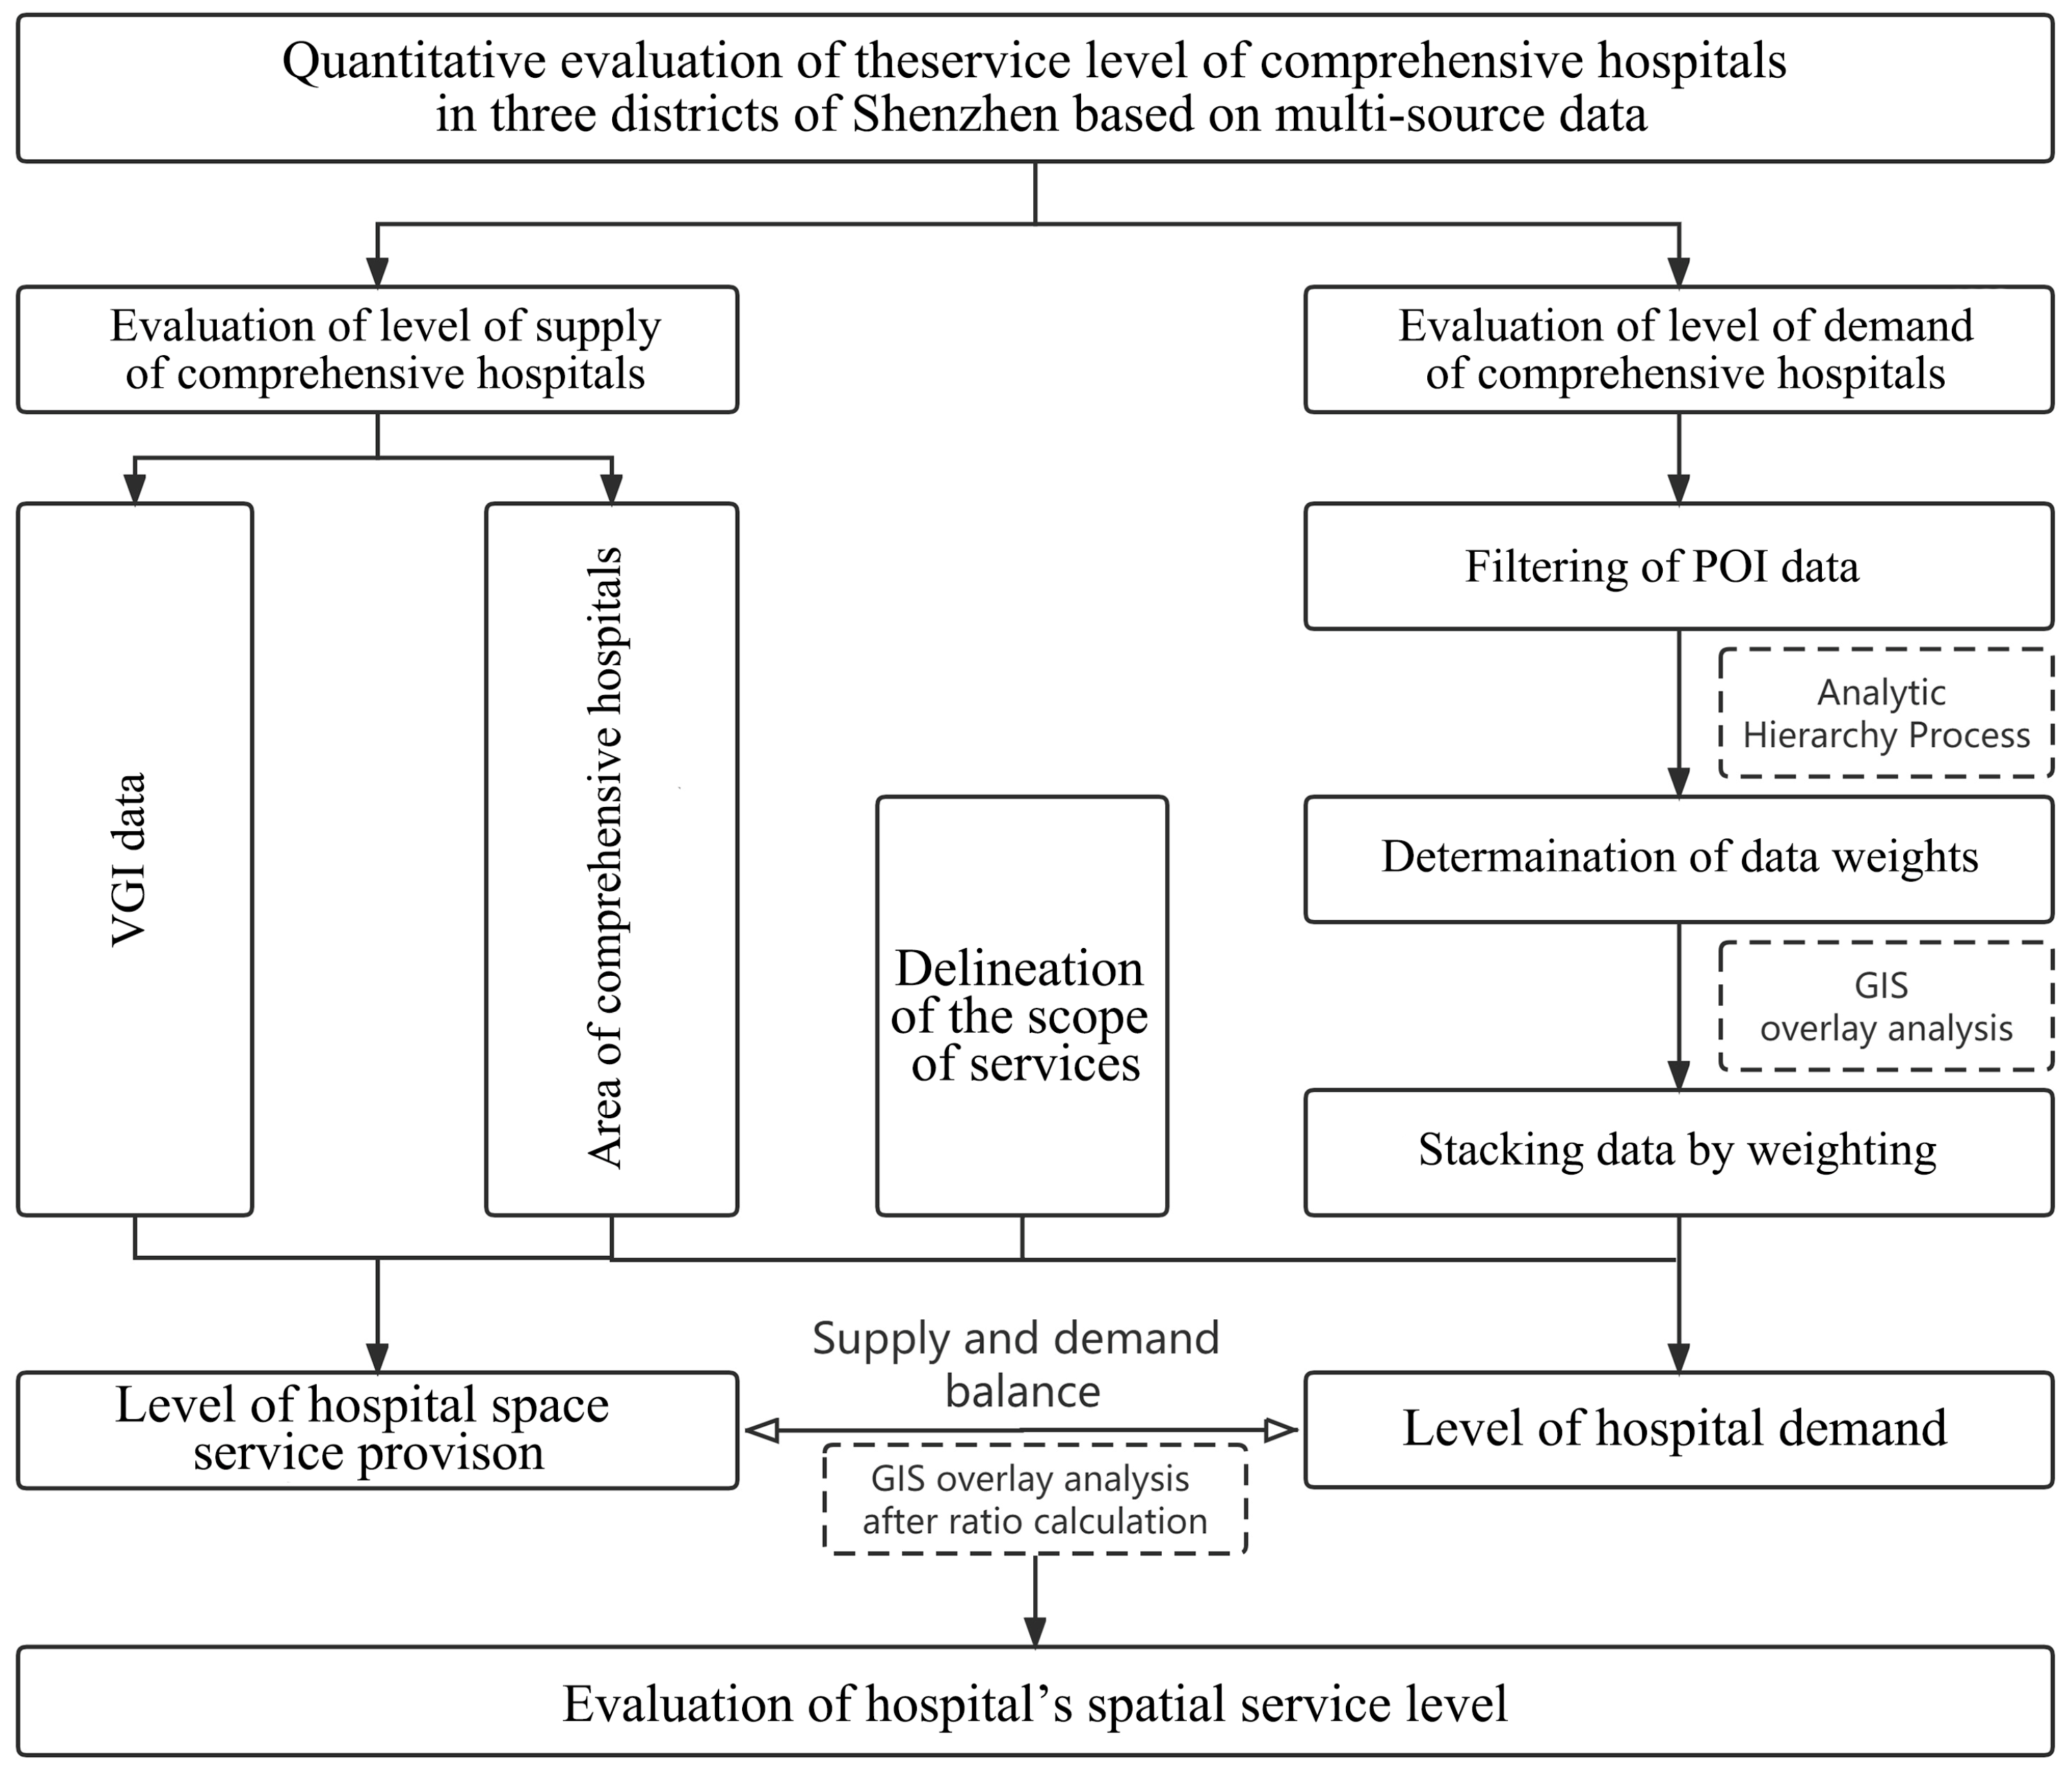
2.3. Methods
The research method includes the following three steps (
Figure 6):
Step 1: The service pressure indicator was used to characterize the spatial service supply level of the hospital [
13], and the ratio of VGI data to the hospital’s area data was used as a measure of the hospital’s supply level to obtain the spatial service supply level of the hospital.
Step 2: After the POI data within the city are filtered, a raster overlay calculation is performed according to the weight assignment in
Table 2 to obtain the service pressure within the hospital’s service area, i.e., the degree of demand for the hospital by the population.
Step 3: The ratio between the degree of supply and demand is used to quantify the hospital’s spatial service level. Hospitals are reclassified according to the level of service.
Figure 6.
Technical routes.
Figure 6.
Technical routes.
3. Results and Analyses
3.1. Quantitative Evaluation of Hospital Spatial Service Supply Level Based on VGI Data
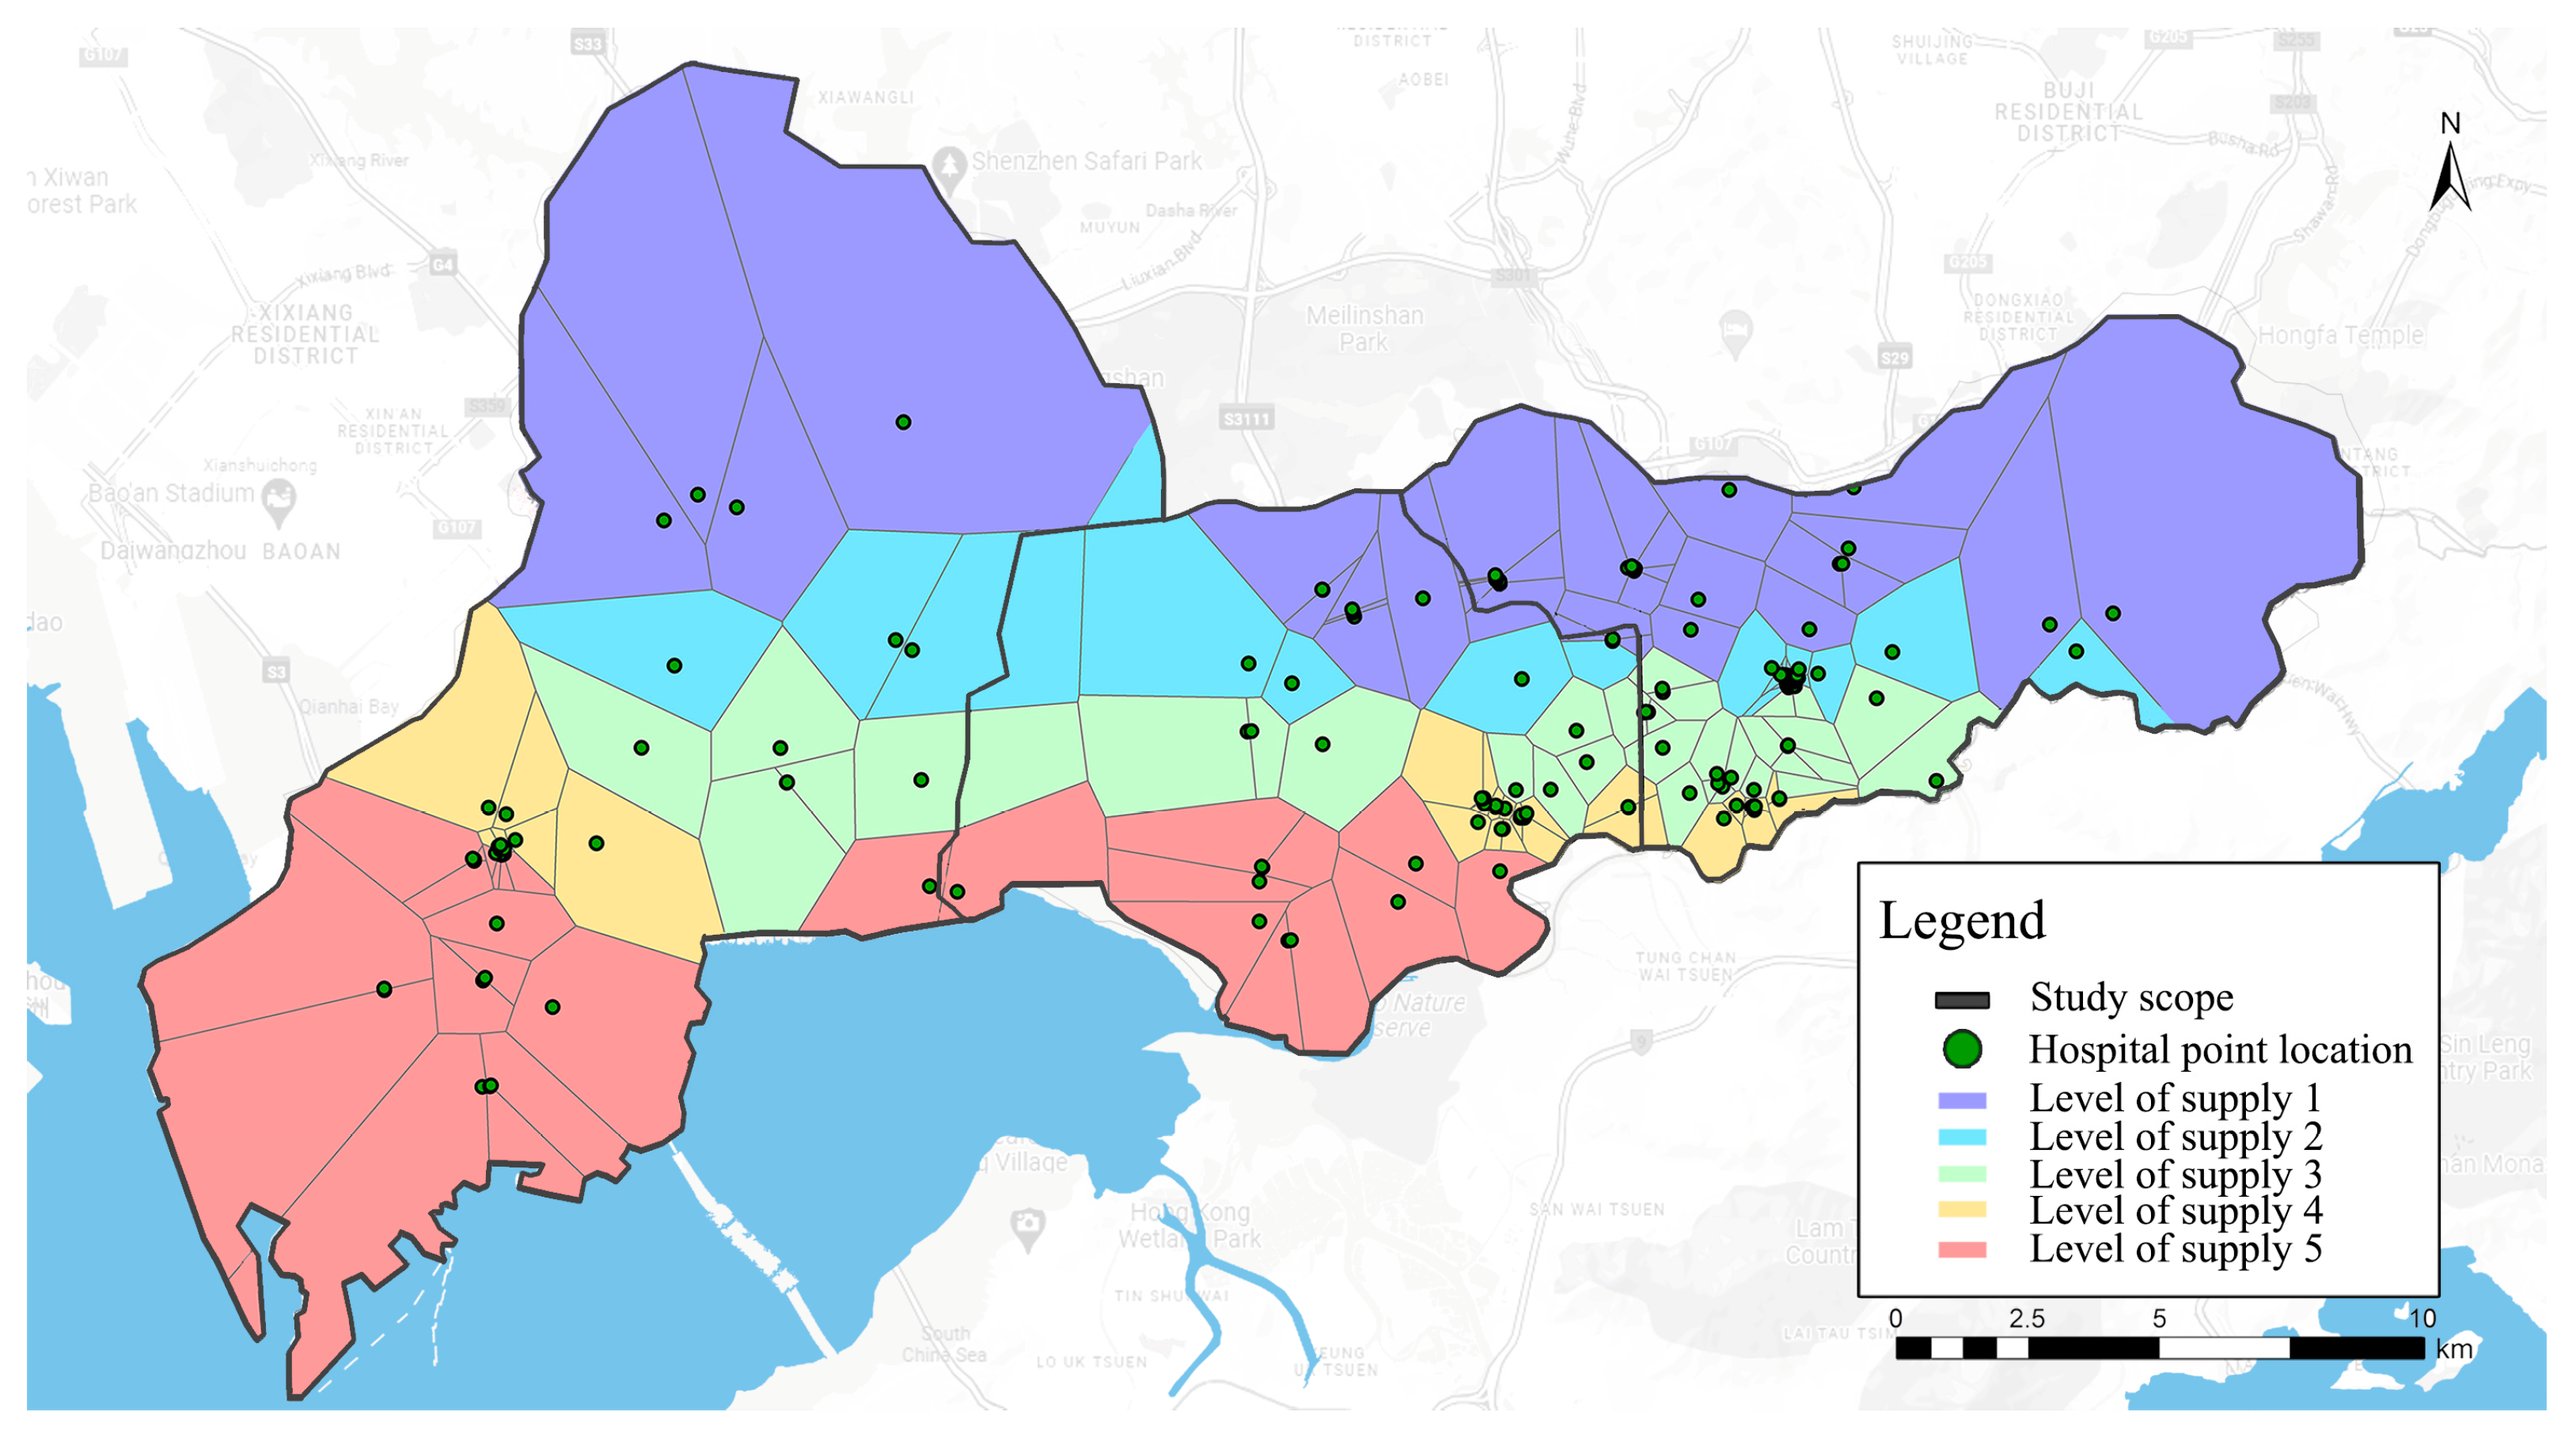
Based on the 58,536 VGI data points from comprehensive hospitals in three districts of Shenzhen, the ratio of VGI data to the area of the comprehensive hospital was calculated. This value is the supply level of the comprehensive hospital. In ArcGIS, the geographical information of the existing hospitals is converted into position points. These positions were generated as discrete points. They are the service scope of comprehensive hospitals. Subsequently, the supply level and service scope of the comprehensive hospital were linked. In ArcGIS, the data are graded and visualized by the natural section method to obtain the following results. As shown in
Figure 7, the greater the value of the level, the greater the service pressure of the comprehensive hospitals and the higher the medical needs of residents.
To figure out the balance of pressure, the people’s traffic thermal maps of Baidu Map (similar to Google Maps) were introduced to traffic thermal maps of the actual hospital visits. The traffic thermal map of Baidu Map can reveal the intensity of urban human activities in real time. Although it cannot be quantified in detail, it is widely used by scholars because it can reflect the density of the person in the unit time area [
13]. We selected the heating maps of the whole day except holidays and stacked them to obtain the intensity of the activity of objective human activities in the research area. Subsequently, the service scope and thermal map of the comprehensive hospitals were superimposed (
Figure 8). To verify the actual use of the hospital, we have selected 12 comprehensive hospitals in areas with levels of service pressure 2, 3, and 4 for field investigations. It was found that the service condition of comprehensive hospitals with service pressure level 3 was good. Therefore, service pressure level 3 is selected as the pressure balance level. Levels 1 and 2 are low-pressure levels, and levels 4 and 5 are high-pressure levels [
21]. The evaluation diagram of the spatial service pressure of the comprehensive hospital can intuitively display the supply of the comprehensive hospital. From
Figure 8, we find that comprehensive hospitals with traditional classification do not have the same service pressure and service scope.
The low-pressure levels are mainly concentrated in the north part, accounting for 43.02% of the whole study area. Most of these areas are used for residential, universities, and natural environments. In these areas, the population density is relatively low; therefore, the spatial service supply of comprehensive hospitals can easily meet the demands of residents. In contrast, the high-pressure level is in the south of the Nanshan district, the south of the Futian district, and the southwest of the Luohu district, accounting for 37.79% of the whole study area. The functions of these areas are commercial and office. High-quality hospitals are concentrated in the area, but the number of comprehensive hospitals is insufficient, the population density is large, and the traffic system is not perfect. All of the factors mentioned have resulted in the low space supply level of comprehensive hospitals.
From the evaluation results, the pressure of the spatial service of the comprehensive hospital in the north part is lower than that in the south, and the differences in the administrative districts are obvious. Compared to the comprehensive hospital in the Luohu district, the spatial service pressure in the Nanshan and Futian districts is significantly higher. The spatial distribution of the comprehensive hospital is unreasonable according to our study.
3.2. Evaluation of the Degree of Hospital Demands Based on POI Data
First of all, the research area is divided into 200 m × 200 m, 500 m × 500 m, and 1000 m × 1000 m space mesh for testing [
3]. The space unit grid of 500 m × 500 m is appropriate given the size of the hospital’s scale. Secondly, POI data related to the influencing factor are vectorized and grided in ArcGIS. Finally, according to the weight of
Table 2, the POI data are assigned to be superimposed. The degree of medical demand for residents within the scope of research is quantified, and they are graded with natural breakpoints. There are nine levels of medical treatment demand: low demand is levels 1–3, intermediate demand is levels 4–6, and high demand is levels 7–9 (
Figure 9).
To verify the results, Baidu thermal maps (all-day thermal maps on working days and non-working days are superimposed) were introduced for comparison (
Figure 10). It was found that they were almost consistent through manual visual interpretation, which confirms that the quantitative evaluation based on POI data can accurately characterize the degree of medical demands of residents.
The greater the value of the demand level, the higher the population density of the region, and the higher the demand of residents. Under the ideal state, high-demand areas should have a more intensive and high-quality service level of comprehensive hospitals. To better understand the demands of residents within the scope of research, the above results were imported into ArcScene for 3D visualization (
Figure 11). As shown in
Figure 11, levels 7–9 are high-demand areas, concentrated in the central and southern parts of the Nanshan district, the central and southern parts of the Futian district, and the southwest of the Luohu district. There are many high-density residential areas, office areas, and commercial areas in these regions, which need more large-scale comprehensive hospitals. High demand consumes huge environmental resources and has brought higher traffic pressure to the city. In summary, the spatial distribution of patients is related to the function of the corresponding land.
3.3. Classification of Hospitals from the Supply–Demand Balance Perspective
It can be seen that comprehensive hospitals are in different service areas, and their supply and demand for spatial services differ greatly. Therefore, we intended to classify the hospital based on the source of the patient. The traditional hospital classification is based on some standards proposed by hospital classification management standards. For example, according to the nature of the industry, hospitals can be divided into teaching hospitals, enterprise hospitals, and military hospitals. According to the service population, the hospital can be divided into pediatric hospitals, women’s hospitals, children’s hospitals, and elderly hospitals. According to professional conditions, hospitals can be divided into tumor hospitals and otolaryngology (ear, nose, laryngeal) hospitals [
24]. However, the above classification could not reflect the actual supply and demand of medical services, so we intended to classify hospitals according to the sources of patients. Compared with conventional hospital classification, our hospital classification is based on a human-centered emphasis. The supply and demand of spatial services can reflect the characteristics of the hospital well, which can be easily obtained from multi-source data.
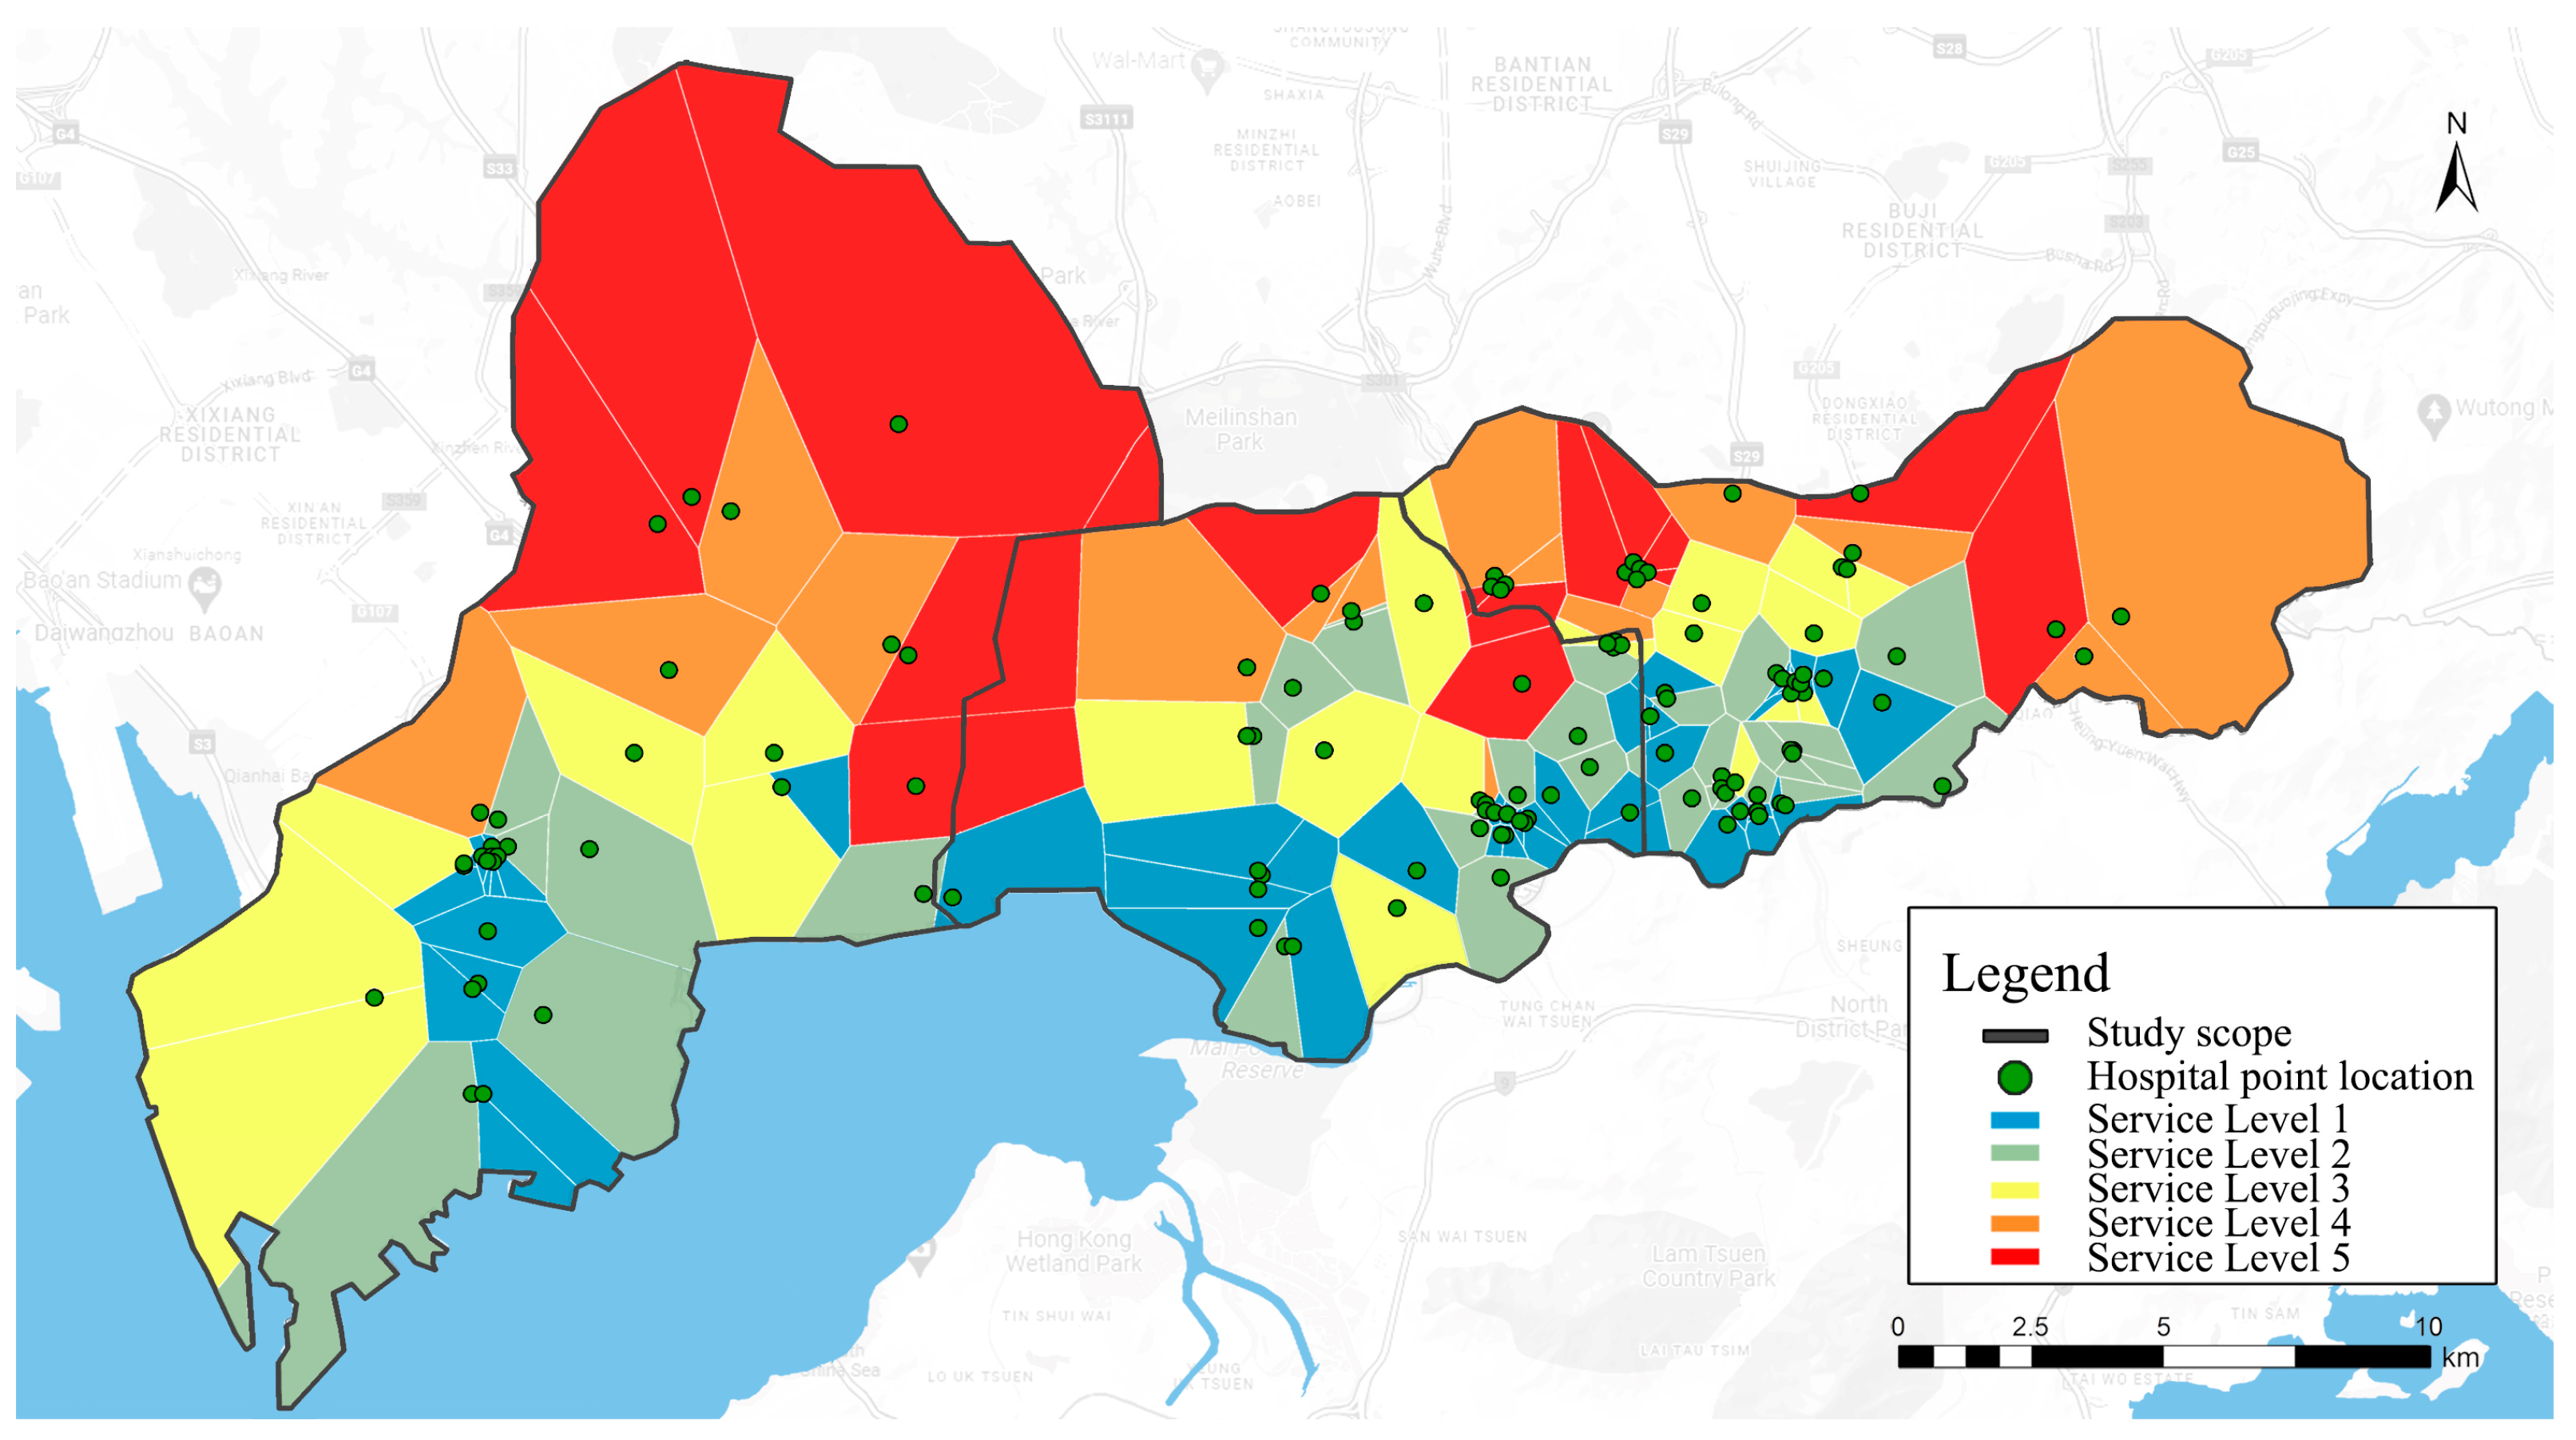
The location entropy method is used to analyze the service level of each comprehensive hospital. Location entropy is also called specialized rate, which is proposed and used by Hagget for location analysis. It is a way to effectively measure the spatial distribution of a certain regional element, which is widely used to evaluate the level of public facilities [
25].
The calculation formula of the comprehensive hospital service area entropy is:
where LQi represents the location entropy of the i-th comprehensive hospital, Ti represents the supply level of the i-th comprehensive hospital, Pi represents the degree of medical needs of citizens within the service scope of the i-th comprehensive hospital, T represents the total level of comprehensive hospitals within the study scope, and P represents the total demand of residents within the study scope. Location entropy represents the ratio of the service level of a comprehensive hospital to the average service level of all comprehensive hospitals. When the location entropy is greater than 1, the service level of the comprehensive hospital is higher than the average level. When the location entropy is less than 1, the service level of the comprehensive hospital is lower than the average level. The research of location entropy is mainly to screen a comprehensive hospital with low location entropy and find the blind spots of service. In this way, the supply–demand balance of the spatial services of the comprehensive hospitals in three districts of Shenzhen can be acquired, and the calculation results of the location entropy are visualized (
Figure 12).
With 0.4 as the interval [
26], the location entropy is further classified to evaluate the supply and demand of the overall spatial service (
Table 3).
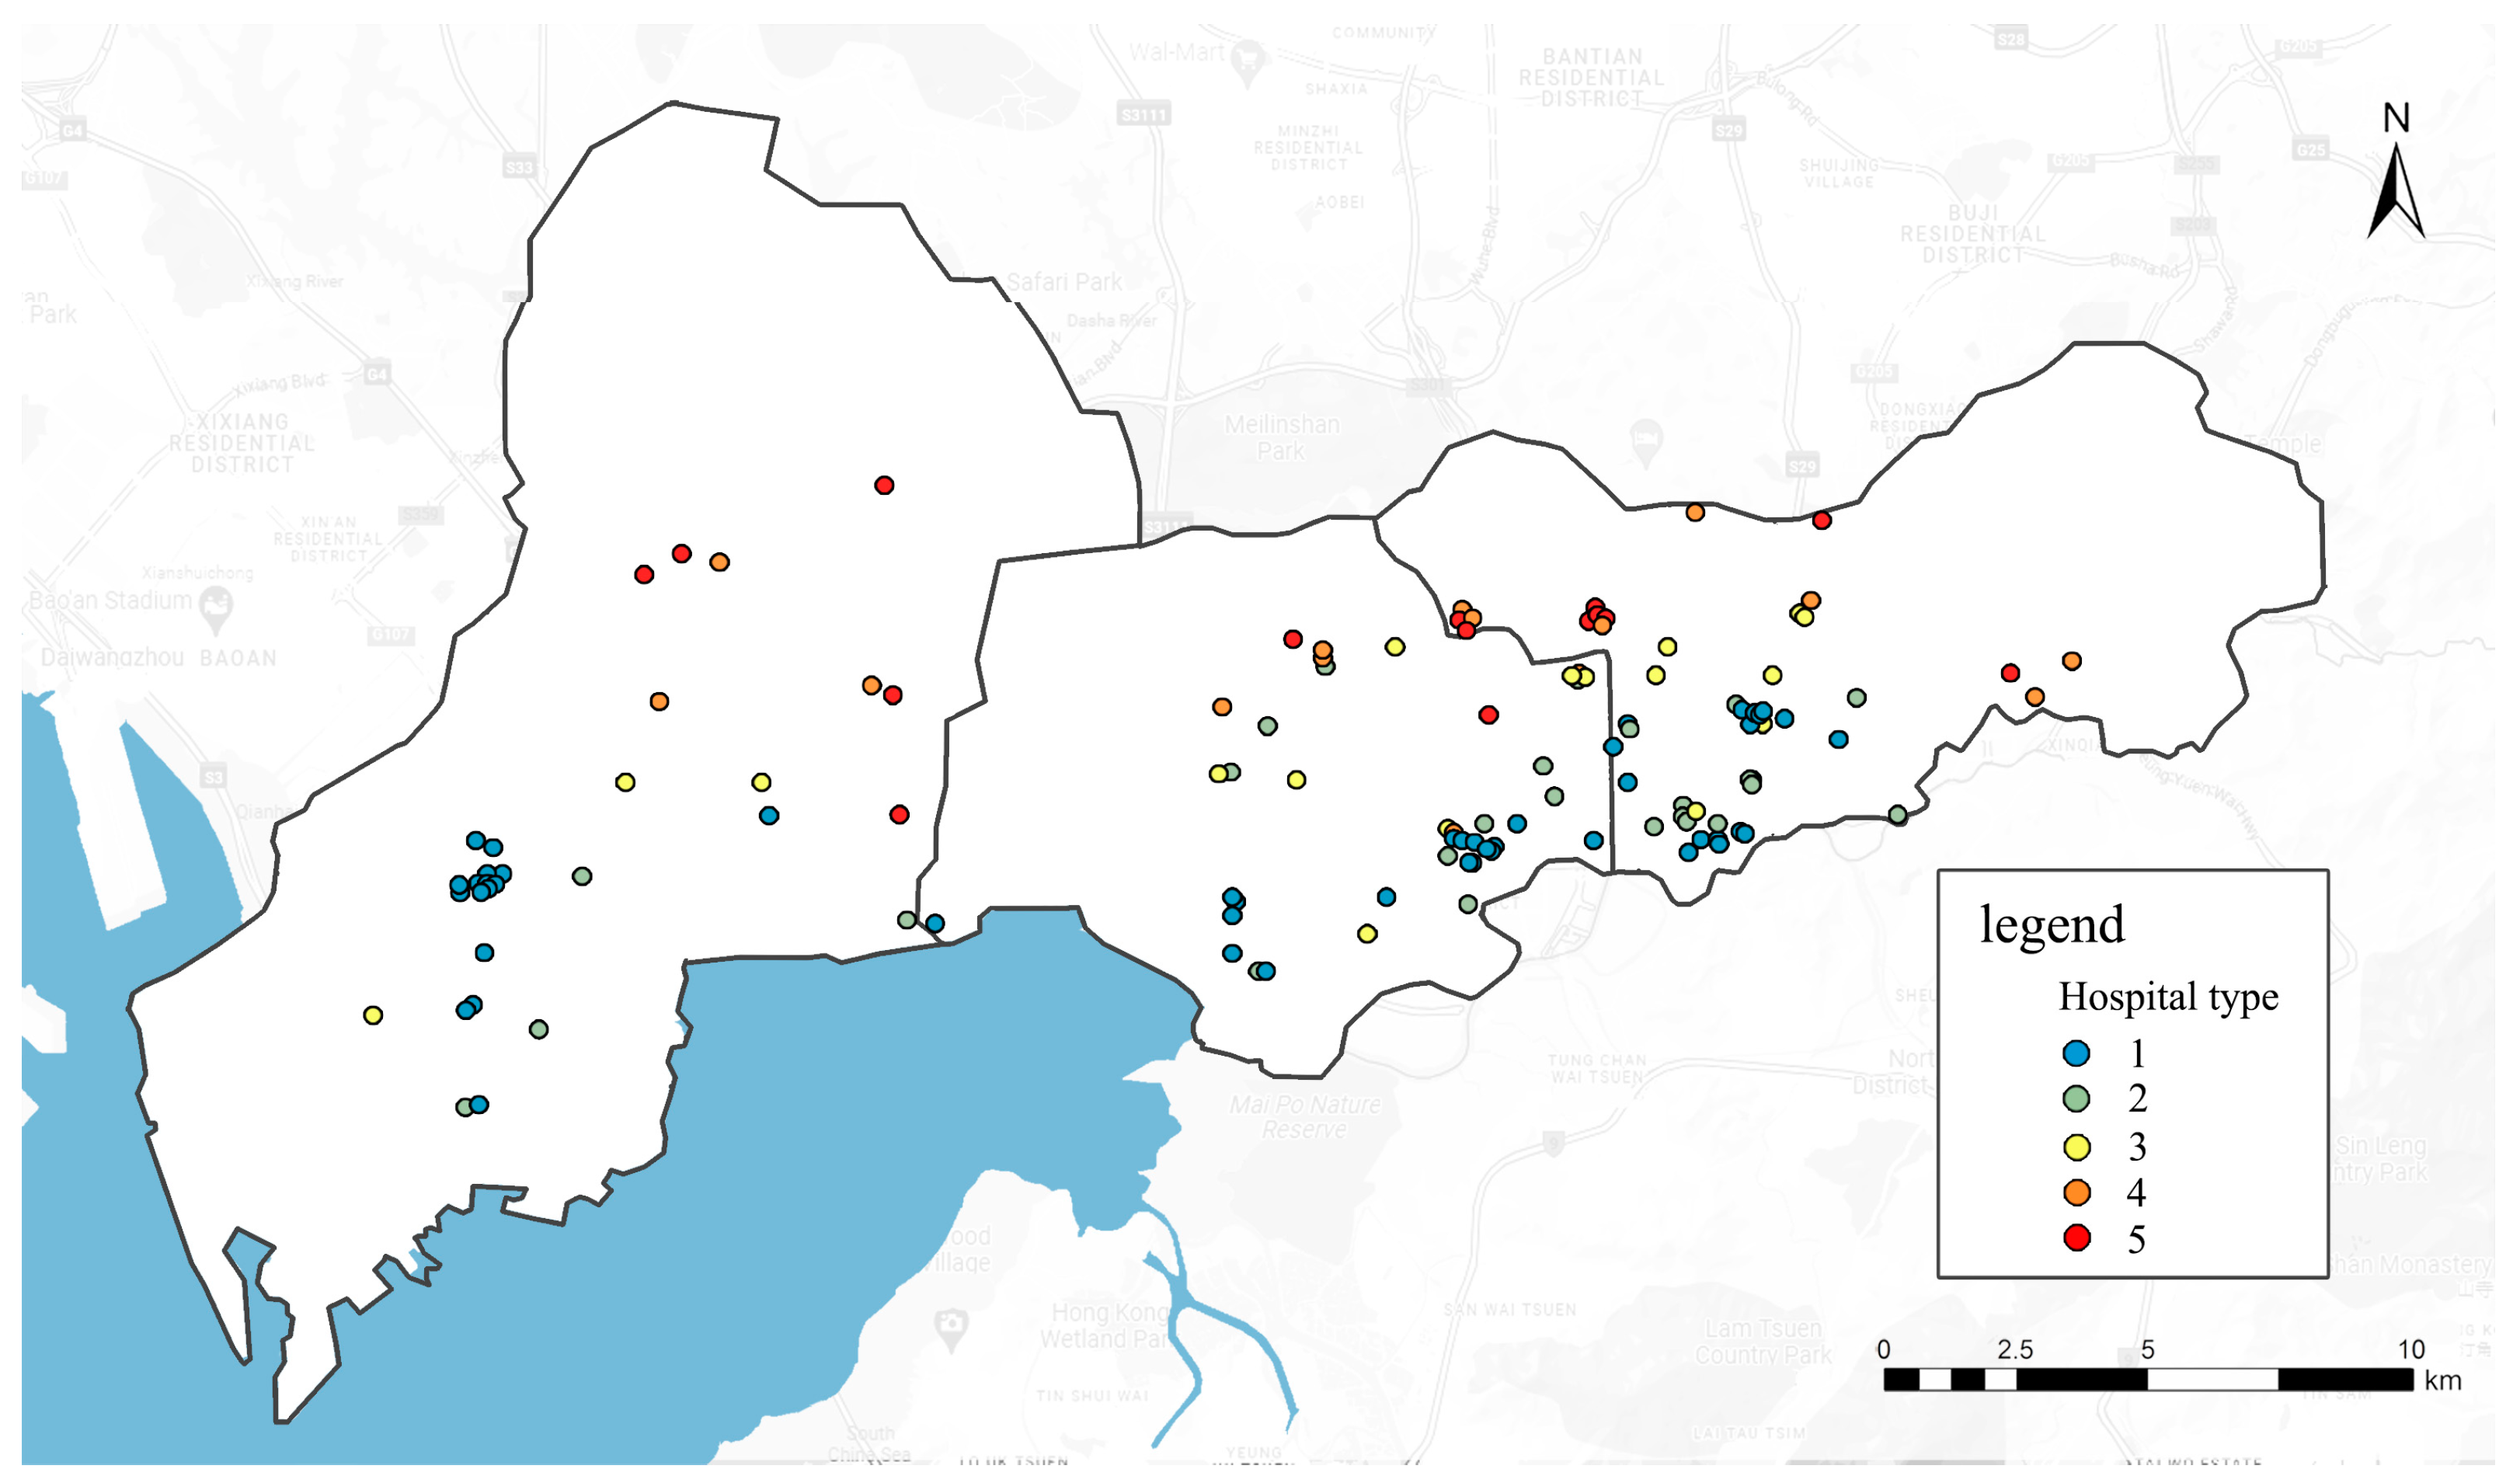
After the statistical analysis, it was found that there were 77 comprehensive hospitals with location entropy below 0.4, accounting for 42.3% of all hospitals. The proportion of comprehensive hospitals with imbalances between supply and demand of spatial service in the research area is large and mainly concentrated in the south of the three districts. There are 15 comprehensive hospitals with location entropy of more than 2.0, accounting for 8.2 of the total, mainly concentrated in the northern part of the three districts. Therefore, the supply and demand of the comprehensive hospitals in the three districts in Shenzhen are extremely uneven, and the planning of the central urban hospital demands to be further adjusted and optimized. According to the results, the comprehensive hospital was redivided into five classifications (
Figure 13) to assess the reasonableness of hospital service pressures and layouts.
4. Discussion
The characteristics of urban hospitals have always been a hot issue for urban planners and managers. The characteristics of the existing investigation of public facilities are mainly static data. This study aims to investigate the characteristics of the spatial services of the comprehensive hospital from a supply–demand perspective. Based on the VGI data and POI data extracted by the independent PPGIS mobile terminal, we have adopted an unsupervised classification method to study 182 hospitals located in the three districts of Shenzhen. According to the calculation results, these hospitals are divided into five classifications. The supply level of hospital spatial services, the distribution characteristics, and service blind spots of patients are also investigated.
From this study, it can be found that, first, the areas with good spatial services in the comprehensive hospital are concentrated in the north of the three districts. The reason is that the region is relatively primitive, consisting of a reservoir and other areas. Second, areas with high medical demands are concentrated in the south of the three districts. The distribution of patients is related to urban land functions. The population in the land with functions such as living, commercial, and office areas is particularly dense, and their medical demands are high. Third, the overlapped areas of levels 4–5 of service pressure in comprehensive hospitals and levels 7–9 of patients’ medical needs are the key areas of imbalance between the supply and demand of services in comprehensive hospitals and are prone to service blind spots (
Figure 14). Therefore, these areas need to be optimized. In our study, the service blind spots of the comprehensive hospitals are mainly concentrated in the south of the Nanshan district and the south of the Futian district. In the future, when urban managers and planners choose the location of the new comprehensive hospital, they should prefer areas within the range of service blind spots. When choosing land, urban managers and planners should try to choose the junction of two Thiessen polygons to build a new hospital, which can provide the greatest reach.
Compared with static data, the VGI data we used in this research contain a large amount of individual tracking data, which allows us to study the actual spatial distribution of patients and the supply of hospital space services. The classification method used in this study investigated the similarity between hospitals from the perspective of supply and demand balance, which is from a kind of bottom-up analysis perspective. By considering the actual supply and demand relationship between comprehensive hospitals and patients, the characteristics of hospitals can be better understood. The classification of the hospital in the past was a top-down plan. It does not fully consider the actual demands of residents. As a result, hospitals that need to be allocated more medical resources have not obtained resources, while some hospitals with lower medical demands have obtained a lot of medical resources. This study breaks through the limitation of traditional medical space planning and is carried out based on the use of the comprehensive hospital and the demands of residents’ medical treatment. Big data is used as the basis for quantitative evaluation. It can evaluate the supply and demand relationship and service level between comprehensive hospitals and residents more scientifically and quantitatively.
Many scholars have studied the classification of hospitals from different angles and methods. Some [
27] classified hospitals based on medical expenditure, which effectively eliminated the waste of medical resources. Liu et al. [
28] discussed the category of hospitals according to the emergency management system of medical equipment, which improved the distribution of medical equipment resources. Kong et al. [
24] extracted spatial interaction information from taxi data to classify 78 hospitals in the 6 districts in Beijing, optimized the allocation of medical resources, and relieved traffic pressure. The above studies have made important contributions to the classification of hospitals. However, these methods are not applicable to this study. The overall general medical standard of Shenzhen is low and its city structure is narrow, which increases the complexity and limitation of this study. This study applied flexible and accessible spatial and geographical big data to conduct data analysis more comprehensively and conveniently, and this method is applicable in many similar cities in the world. Through the reclassification of hospitals in this work, urban residents can have easier and more equitable access to medical resources and services. Compared with some published research, this study established a new preliminary research method based on the visualization of the supply–demand data of medical resources. In addition to studying its own factors, social factors also affect the balance of supply and demand of medical resources. Different regions, countries, and geographical environments will affect the category of hospitals.
The classification of hospitals should be people-oriented and depend on people’s activities, which can better reflect social perception. Human spatial behavior extracted through space geographical big data can better reveal the link process of time and space distribution and socioeconomic phenomena [
13]. Our research can provide an important scientific basis for decision makers, adjust the current space configuration of the hospital, provide residents with obtained medical services, and help urban traffic pressure caused by medical treatment.
Urban comprehensive hospital service-level evaluation and hospital classification methods under the perspective of supply and demand balance provide accurate suggestions for the adjustment and optimization of urban medical space planning in the future. Through empirical analysis of three districts of Shenzhen, this study provides a scientific basis and support for future planning decisions and spatial policies.
5. Conclusions
We take the three districts of Shenzhen as a case study. Based on VGI data and POI data, the characteristics of comprehensive hospitals are studied from the perspective of supply and demand balance. The data are acquired from Shenzhen for six consecutive months, including more than 57,912 VGI data points. After that, we quantitated the service pressure of 182 comprehensive hospitals from the study area and the demands of residents’ medical treatment. Meanwhile, the spatial distribution of patients and their activity intensity are described. By analyzing the supply of comprehensive hospitals and the superposition of patients’ demands, 182 comprehensive hospitals were reclassified. From this work, some results can be found: (1) according to the traditional classification of hospitals, the same type of comprehensive hospitals have different service scopes and service pressure; (2) the spatial distribution of patients is related to the function of the land; (3) the service blind area is located in the overlapping areas with high patient demand (levels 7–9) and comprehensive hospitals of high service pressure level (levels 4–5).
This study could help planners and urban managers improve the spatial distribution of hospitals. At the same time, a reclassifying hospital from the supply–demand balance perspective could optimize the management and allocation of medical resources. This research method improves the traditional planning methods of traditional Chinese hospitals.
There are some limitations to the study. VGI data obtained by the PPGIS mobile terminal cannot cover patients of all ages, nor can they cover patients without Internet access. In addition, the accuracy of the calculation results is closely related to the VGI data collection. The larger the amount of data, the wider the space covered and the more accurate the results. However, the whole process takes a long time and is limited by manpower, material resources, and promotion. In the next study, we will incorporate more data, such as shared bicycle data, taxi data, and public transport punch card records, to better understand the real-time situation of patients.
Finally, we combined the distribution characteristics of patients with the urban road traffic system to evaluate the area where the patient was congested due to medical treatment. Thus, it indirectly provides scientific recommendations for optimizing urban transportation systems and developing effective remedial measures.
Author Contributions
D.H.: writing—original draft, writing—review and editing, methodology, resources, software, formal analysis, funding acquisition. Q.Z.: methodology, resources, writing—review and editing, supervision, funding acquisition. L.P.: sample collection, measurement. All authors have read and agreed to the published version of the manuscript.
Funding
The National Natural Science Foundation Youth Project of China (52108024); Jiangsu University Natural Science Foundation, China (20KJB560028).
Institutional Review Board Statement
Not applicable.
Informed Consent Statement
Not applicable.
Data Availability Statement
Not applicable.
Conflicts of Interest
The authors declare no conflict of interest.
References
- Chuanyao, L.; Junren, W. A hierarchical two-step floating catchment area analysis for high-tier hospital accessibility in an urban agglomeration region. J. Transp. Geogr. 2022, 102, 103369. [Google Scholar]
- Tian, G.; Xiaoxin, X.; Qian, Y. Study on Hospital Service Accessibility of Rural Residents in China. Chin. J. Soc. Med. 2017, 34, 294–297. [Google Scholar]
- Quanyi, Z.; Xiaolong, Z.; Mengxiao, J. Research on Urban Public Green Space Planning Based on Taxi Data: A Case Study on Three Districts of Shenzhen, China. Sustainability 2019, 11, 1132. [Google Scholar]
- Desmond, K.; Kwame, M.A.; Vitalis, B.; Tivani, P.M. Geographical Accessibility to District Hospitals/Medical Laboratories for Comprehensive Antenatal Point-of-Care Diagnostic Services in the Upper East Region, Ghana. EClinicalMedicine 2019, 13, 74–80. [Google Scholar]
- Jia, P.; Xierali, I.M.; Wang, F. Evaluating and re-demarcating the Hospital Service Areas in Florida. Appl. Geogr. 2014, 60, 248–253. [Google Scholar] [CrossRef]
- Hu, Y.; Wang, F.; Xierali, I. Automated Delineation of Hospital Service Areas and Hospital Referral Regions by Modularity Optimization. Health Serv. Res. 2018, 53, 236–255. [Google Scholar] [CrossRef]
- Wang, Y.; Wu, C. Research on the Spatial Distribution and Accessibility of Medical Institutions in Wuhan Based on GIS. In Proceedings of the IOP Conference Series: Earth and Environmental Science, 2nd International Conference on Energy Saving and Environmental Protection and Civil Engineering, Xining, China, 18–20 June 2021; Volume 825, p. 7. [Google Scholar]
- Cao, N.; Li, H.; Tang, L. Fairness, effectiveness and coordination: The three perspections of understanding the allocation of medical resources in China. In Basic & Clinical Pharmacology & Toxicology; Wiley: Hoboken, NJ, USA, 2019. [Google Scholar]
- Taleai, M.; Sliuzas, R.; Flacke, J. An integrated framework to evaluate the equity of urban public facilities using spatial multi-criteria analysis. Cities 2014, 40, 5–69. [Google Scholar] [CrossRef]
- Chang, H.S.; Liao, C.H. Exploring an integrated method for measuring the relative spatial equity in public facilities in the context of urban parks. Cities 2011, 28, 361–371. [Google Scholar] [CrossRef]
- Matthias, G.; Luis, N.; Tristan, B.; Pia, M.F.; Brigitte, W. Fairness or efficiency-Managing this conflict in emergency medical services location planning. Comput. Ind. Eng. 2022, 173, 108664. [Google Scholar]
- Li, M.; Chen, W.; Ding, J. Study on The Medical Service Radius of Large comprehensive hospital. Prog. Mod. Biomed. 2013, 13, 5381–5386. [Google Scholar] [CrossRef]
- Quanyi, Z.; Xiaolong, Z.; Mengxiao, J. Spatial Accessibility of Urban Green Space Based on Multiple Research Scales: A Case Study of Futian District, Shenzhen. Ekoloji 2019, 107, 995–1006. [Google Scholar]
- Liu, Y.; Liu, X.; Gao, S.; Gong, L.; Kang, C.; Zhi, Y.; Chi, G.; Shi, L. Social sensing: A new approach to understanding our socioeconomic environments. Ann. Assoc. Am. Geogr. 2015, 105, 512–530. [Google Scholar] [CrossRef]
- Gao, Z.; Zhang, H. Spatial structure of the retail industry in Xining City based on POI data. Arid. Land Geogr. 2019. [Google Scholar]
- Li, F.; Dong, S.; Li, X. Research on the Spatial Distribution of Green Space Use in the Central City of Beijing: Empirical Analysis Based on Big Data. Chin. Landsc. Archit. 2016, 32, 122–128. [Google Scholar]
- Shi, W.; Gong, Y. Identification and Analysis of Urban Functional Areas Based on VGI Data. In Proceedings of the 2020 IEEE 5th International Conference on Cloud Computing and Big Data Analytics (ICCCBDA), Chengdu, China, 10–13 April 2020. [Google Scholar]
- Ronghao, Q.; Hang, Y.; Siling, W.; Qiyu, X.; Yajun, W. Urban Park Greenland Assessment and Planning Research Based on Baidu POI Data. Chin. Gard. 2018, 34, 32–37. [Google Scholar]
- Available online: https://www.sznews.com/news/content/2021–06/21/content_24315110.htm (accessed on 29 January 2022).
- Yeow, L.; Low, R.; Tan, Y. Point-of-Interest (POI) Data Validation Methods: An Urban Case Study. ISPRS Int. J. Geo-Inf. 2021, 10, 735. [Google Scholar] [CrossRef]
- Zhang, L. Research on POI Classification Standard. Bull. Surv. Mapp. 2012, 10, 82–84. [Google Scholar]
- Qi, R.; Yang, H.; Wang, S. Research on Urban Park Green Space Evaluation and Planning Based on Baidu POI Data. Chin. Landsc. Archit. 2018, 34, 32–37. [Google Scholar]
- Mu, H.; Gao, Y.; Wang, Z. Study on the Service Level and Fairness Evaluation of Urban Parks and Green Space from the Perspective of Supply and Demand Balance: Empirical Analysis Based on Big Data. Urban Dev. Res. 2019, 26, 10–15. [Google Scholar]
- Kong, X.; Liu, Y.; Wang, Y.; Tong, D.; Zhang, J. Investigating Public Facility Characteristics from a Spatial Interaction Perspective: A Case Study of Beijing Hospitals Using Taxi Data. ISPRS Int. J. Geo-Inf. 2017, 6, 38. [Google Scholar] [CrossRef]
- Medkov, J. Anonymization of geosocial network data by the (k,l)-degree method with location entropy edge selection. In Proceedings of the ARES 2020: The 15th International Conference on Availability, Reliability and Security, Virtual Event, Ireland, 25–28 August 2020. [Google Scholar]
- Mu, H.; Gao, Y.; Wang, Z. Research on the evaluation of service level and fairness of urban park green space from the perspective of supply and demand balance—An empirical analysis based on big data. Urban Dev. Res. 2019, 26, 6. [Google Scholar]
- Li, L.; Du, T.; Hu, Y. The effect of different classification of hospitals on medical expenditure from perspective of classification of hospitals framework: Evidence from China. Cost Eff. Resour. Alloc. 2020, 18, 35. [Google Scholar] [CrossRef] [PubMed]
- Liu, X.W.; Wang, M.; Yi, G.E. Hospital Classification:An Opportunity to Optimize the Emergency Management System of Medical Equipment. China Med. Devices 2013, 28, 85–86. [Google Scholar]
| Disclaimer/Publisher’s Note: The statements, opinions and data contained in all publications are solely those of the individual author(s) and contributor(s) and not of MDPI and/or the editor(s). MDPI and/or the editor(s) disclaim responsibility for any injury to people or property resulting from any ideas, methods, instructions or products referred to in the content. |
© 2023 by the authors. Licensee MDPI, Basel, Switzerland. This article is an open access article distributed under the terms and conditions of the Creative Commons Attribution (CC BY) license (https://creativecommons.org/licenses/by/4.0/).


