Abstract
This paper takes China’s economic data from 1978 to 2020 as a sample, combined with indicators such as a correlation coefficient, degree of deviation, and employment elasticity, to carry out a correlation analysis on employment structure, industrial structure, and economic growth. On this basis, a regression model is established to characterize the impact of economic structure deviation on economic growth, and the linkage relationship between employment structure, industrial structure, and economic growth is further explored through a vector self-regression model. The research results show that: the degree of deviation of China’s economic structure is weakening, and the economic structure is continuously optimized; the improvement of the degree of deviation of the economic structure has a significant contribution to China’s economic growth; the impact of the industrial structure on the employment structure is first strong and then slow; the impact of economic growth on the industrial structure is lagging and long-term; the impact of the optimization of the employment structure on economic growth is most obvious in the early stage; the impact of economic growth on the employment structure is more direct; the adjustment of the industrial structure shows a certain stickiness; and that economic transformation and high-quality development require continuous advancement. This paper describes the impact of structural deviation on economic growth and reveals the interactive impact of industrial structure, employment structure, and economic growth, which can provide decision-making reference for policy makers. Specifically, it includes formulating policies to realize skills spillover to improve the employment structure; formulating policies to promote industrial integration to optimize industrial structure; formulating policies to encourage innovation so as to promote the improvement of total factor productivity and then drive the adjustment and optimization of industrial structures and employment structures; and finally, encouraging policy makers to ensure the persistence and consistency of relevant policies so that the effects of relevant policies can be truly realized.
1. Introduction
After the reform and opening, China has experienced more than 40 years of development. The industrialization and urbanization process continues to advance, and the achievements of economic growth have attracted worldwide attention. The GDP in 2020 compared with 1978 increased by 38.8 times, and the economic scale ranked second in the world. At the same time, the economic structure has been continuously optimized. In 2020, the ratio of the output value of the three industries was 7.7:37.8:54.5, which has changed significantly compared with the three industrial structure of 27.7:47.7:24.6 in 1978. The industrial structure has changed from the “two, one, three” pattern in the early stage of reform, opening to the “three, two, one” pattern. In 1978, there were 401.52 million employed people in China, and by 2020, the employed population reached 750.64 million, and its structure has also undergone earth-shaking changes. The proportion of the employed population in the three industries has changed from 70.5:17.3:12.2 in 1978 to 23.6:28.7:47.7 in 2020, and the agricultural labor force continues to be released to the secondary and tertiary industries. Reforms in different fields and the improvement of economic operation mechanisms and operation efficiency will promote the flow of labor resources in different industries and fields, which in turn promotes the improvement of structure and the efficiency of factor allocation, which in turn drives economic growth. Brandt L, Hsieh C T, and Zhu X., 2008 also verified this and, combined with the stochastic frontier production function to decompose total factor productivity, found that structural changes play a substantial role in output growth, revealing that industrial structure reform can largely explain the overall trend of factor allocation efficiency in the process of industrial transformation [1]. Especially in the field of agricultural production, the process of resource reallocation from the agricultural sector to non-agricultural sectors in China (Dekle, R., and Vandenbrucke, G., 2012) shows the driving force of structural transformation [2]. Similarly, in the field of agricultural production, the transfer of labor to non-agricultural sectors has promoted the accumulation of material and human capital in non-agricultural sectors and promoted economic growth [3] (Cao, K. H., and Birchenall, J. A., 2013). In different developing countries, such as China and India, the productivity growth gap between them is mainly reflected in manufacturing and agriculture, while the productivity growth gap in service industry is very small [4] (Liu, H., and Yang, T., 2015). The Chinese part of these literatures mainly focuses on some industries in the economic field. In terms of the entire Chinese economy, is economic growth affected by the degree of synergy between the industrial structure and the employment structure? What is the specific impact? How does the mutual impact among the industrial structure, the employment structure, and economic growth fluctuate? This research literature is relatively sparse. Based on the research logic of “industrial structure-employment structure-economic growth”, this paper attempts to study the impact of economic internal structure coordination on economic growth from the perspective of China’s economy, and then explore the enlightenment for healthy and sustainable economic development from the linkage among the three.
The research motivation of this paper mainly reflects that China’s economy has achieved tremendous development after the reform and opening, and with the continuous development of China’s economy, the original development pattern has become more and more unsuitable for practical needs. Subsequently, supply-side structural reform and high-quality economic development is put on the agenda, whether it is supply-side structural reform or high-quality economic development, its essence is to promote economic growth through the transformation and upgrading of economic structure. The structures here include both industrial structure and employment structure; therefore, studying China’s industrial structure, employment structure, and economic growth is actually trying to explore the current high-quality development path of China’s economy from the perspective of the industrial structure and employment structure.
The innovation of this paper is mainly reflected in the fact that most of the previous research on China-related issues focuses on a certain province or industry, and lacks overall research over a long time span. This paper studies the relationship between the industrial structure, the employment structure, and economic growth in China’s overall economy over a long time span, and divides this long time span into two stages to compare the changes of some related indicators, and then explores the fluctuations of relevant indicators and the reasons behind them in this long time span. In the model, the impact of economic structure deviation on economic growth is estimated by establishing a regression model, and the model is revised in combination with the actual situation, and the linkage relationship between the employment structure, the industrial structure, and economic growth is further explored and tested by vector autoregressive model, so that the estimation results are closer to the actual situation and more robust than other existing studies. These are embodied in this paper by analyzing the degree of coordination between the employment structure and the industrial structure from multiple angles and by quantitatively portraying the impact of economic structural deviation on economic growth and more deeply revealing that the improvement of structural deviation can help economic growth. By constructing a vector autoregressive model (VAR) model, the impact and dynamic performance between industrial structure, employment structure, and economic growth are analyzed.
The academic contribution of this paper mainly reflects the overall study of the actual relationship between industrial structure, employment structure, and economic growth in the process of economic growth in the largest developing country over a relatively long time span, which further enriches the theoretical research and practical cases of economic structure and economic growth in academic terms, and also shows the differences between China and other countries in this field, laying a certain foundation for other scholars to conduct relevant research.
The research significance of this paper mainly reflects the following: by studying the relationship between China’s industrial structure, employment structure, and economic growth, it provides policy makers with policy suggestions in the process of structural transformation to promote economic growth, reduces the factor mismatch between the industrial structure and the employment structure, reduces the slowdown of economic growth caused by factor mismatch, and provides a theoretical basis and policy suggestions for achieving “stable growth” under the condition of high-quality economic development in China.
The next writing framework of this paper is as follows: Section 2 puts forward relevant ideas through a literature review and theoretical analysis of the relationship between industrial structure, employment structure, and economic growth. Section 3 introduces the data sources, research methods, and variable definitions of this paper, and conducts a general analysis of the main variables.
2. Literature Review
2.1. Industrial Structure and Employment Structure
The acceleration of the economic growth and structural transformation of human society has also promoted the continuous development of theories such as economic growth and industrial structure. William Petty noted the difference in income levels between different industries earlier, and pointed out the trend of industrial structure evolution in his famous Political Arithmetic [5]: the manufacturing sector earns more than the agricultural sector, and the commercial sector earns more than the manufacturing sector; Adam Smith also reflected the idea of industrial development and structural evolution when discussing the industrial sector, industrial development, and the order of sectors that should be paid attention to in capital investment in An Inquiry Into the Nature and Causes of the Wealth of Nations [6], and at the same time pointed out that “the improvement of human capital has a significant positive effect on social and economic development”. In terms of quantitative analysis, the further use of statistical analysis and empirical research methods to confirm the intrinsic relationship between the distribution of the employed population in the tertiary industry and the change of economic structure was completed by Colin Clark in The Conditions of Economic Progress [7]: with the growth of per capita income level and economic and social development, the labor force of the primary industry will gradually shift to the secondary and tertiary industries in turn. Simon Kuznets made a more thorough quantitative analysis of the relationship between per capita output value and structural change from the two aspects of labor structure and sector output value structure, based on the actual data of each country in different income groups, and deeply studied the relationship between economic growth and industrial structure in Modern Economic Growth: Findings and Reflections. [8]. He found that the change range of the proportion of labor in the three industrial sectors was not completely consistent with the change in the proportion of national income. After that, the new method gradually played a role in the study of economic structure, Leontief in Domestic production and foreign trade: The American capital position re- examined [9] pioneered the use of input–output analysis to study the US economic structure, analyze the development of the national economy, and predict the prospects of structural change, and obtained the conclusion that the relationship between the production sectors of developed economies is closer and broader than that between the production sectors of underdeveloped economies. The above theory covers the law of industrial development and the economic and technological connection between industries, which is a classic theoretical summary of industrial economic development and an important theoretical support for the research of this paper.
In recent decades, China has carried out domestic reform and opening-up in different economic fields, with the continuous expansion of industrial scale and the optimization of industrial structure. In the study of the localization of industrial economic development, many scholars have made unremitting research on this, from the early attention to the changes in the economic structure and the linkage analysis of the industrial structure and employment structure, to the later quantitative research on the traceability and extension application of factor dynamics, and the research content and research level have been deepened. In the early 1980s, the adjustment of the industrial structure was viewed dialectically from the perspective of comprehensive balance (Liu Guoguang, 1981) [10]. The adjustment of the industrial structure is driven by science and technology, and the technological revolution is the guide, which then brings about changes in the industrial structure and labor employment (Chen Yue, 1984) [11]. With the development of industrial modernization, about half of the agricultural labor force will be transferred to other industrial sectors, and the employment structure will undergo fundamental changes (Hong Yingfang, 1985) [12].
Most of these research results are qualitative judgments based on the observation of real economic structures at home and abroad in practice. In the new century, with the improvement of the technical level of economic analysis, the attention to employment structures and industrial structures is more in-depth, and the methods and research objects are more diversified. For example, combined with the three industrial classifications, the factor intensity, and deviation share method, the economic growth in the change of the industrial structure has been studied (Luo Ruoyu and Zhang Longpeng, 2013) [13]. It is believed that capital-driven economic growth will cause disharmony between the industrial structure and the employment structure and the convergence of the industrial structure [13]. Further, to study the correlation between different departments, input–output tables can be used to build a theoretical model of the synergy between industrial structures and employment, and measure the synergy between industrial structures and employment structures (Zhu Tong and Pang Lei, 2015) [14]. In terms of synergistic effect measurement, the measurement results of different provinces have certain similarities. The measurement results of the coupling effect between the industrial structure and the employment structure of Shandong Province show that the overall coordination degree of the industrial structure has been significantly improved (Xia Jianhong and Jiao Weihong, 2018) [15]. In Zhejiang Province, the changing direction of the industrial structure has a significant impact on employment (Tan Lan, 2011) [16]. The direction of change in the industrial structure is positively correlated with employment (Lichao, Tao, Songyan, Zhang, Jing, and Xu., 2019) [17]. The structural deviation of Guangdong Province also tends to be balanced, and the industrial structure shows a slow upward trend (Zhang J. W., Gao Y. B., Nan L I, et al., 2016) [18]. Combined with indicators such as employment elasticity and structural deviation, the coordination between the industrial structure and the employment structure is compared in Fujian and Taiwan, and it can be seen that the tertiary industry in the two places has a relatively strong ability to absorb employment, but the coordination between the industrial structure and employment structure in Taiwan is better than that in Fujian (Lin Fabin et al., 2021) [19]. If extended to the level of a country, the coordinated development of the industrial structure and the employment structure is also an important issue (Tran, T. and Doan, T., 2018) [20]. Vietnam’s data from 1995 to 2013 show that the industrial structure and employment structure are in an unbalanced state, the coordination coefficient fluctuates greatly, and the overall coordination is poor (Hung, D. H., Zhang, J., and Mirza, S. S., 2015) [21]. According to Chinese data from 2010 to 2019, the coordination between China’s industrial structure and employment structure has generally shown a “first suppressed and then raised”, especially after 2012, and the level of coordination has continued to increase (Ji Qiang, Basen Dasi, 2020) [22]. Most of the above literature studies on China are on partial provinces or over a short period of time, and this paper will observe the synergy between China’s industrial structure and employment structure over a longer time span.
2.2. Structural Deviation and Economic Growth
There are many research achievements in economic structure and economic growth (Constantine, C., 2017; Che, N. X., 2012; Stel, A.V. et al., 2005; Wang, R. et al., 2020; Rajan, R. G. and Zingales, L., 2001; Junior, A. B. et al., 2020) [23,24,25,26,27,28], creating employment opportunities, promoting economic growth and industrial evolution are important reading materials for policymakers and relevant researcher (Audretsch, D. and Thurik, R., 1999) [29]. Population structure is an important part of economic growth (Motkuri, V. and Veslawatha, S. N., 2013; Soni, S. and Subrahmanya, M., 2020) [30,31]. If the population structure is differentiated by age, the population structure can affect economic growth through various channels (Wongboonsin, K., and Phiromswad, P., 2017) [32]. In terms of the impact of economic structure on economic growth, the micro data of South Korea’s manufacturing industry shows that changes in South Korea’s economic structure are conducive to productivity growth, but small and medium-sized industries and large enterprises have different vitality at different stages. (Singh and Lakhwinder., 2004) [33]. The local economic structure of France also has a differentiated impact on industry and service industry (Combes and Pierre-Philippe., 2000) [34]. If the economic growth and industrial structure of China and Russia are compared, China’s faster economic growth mainly benefits from the manufacturing industry, while Russia mainly benefits from the service industry, mining industry and oil and gas exploitation industry (Zhao, Jingfeng and Tang, Jianmin, 2018) [35].
As for the deviation between the employment structure and the industrial structure, and the impact of this deviation on economic growth, Chinese scholars pay more attention than foreign scholars. The deviation between industrial structures and employment structures is one of the manifestations of factor mismatch. If the trend of industrial structure rationalization is measured in combination with the deviation coefficient of industrial structures and employment structures, it is found that China has a reverse linkage relationship between industrial structure rationalization and economic growth from 1989 to 2002, which can be explained from the perspectives of population fluctuation, technology shock, urbanization rates, foreign investment, and so on (Chen Xi and Mu Huaizhong, 2014) [36]. The deviation of Shanghai’s industrial structure does hinder its economic growth rate, and there is an obvious “structural burden” in the process of economic growth (Wang Tao et al. 2015) [37]. Some industries in Shanxi Province also have similar problems. The structural deviation of Shanxi’s secondary industry plays a positive role in promoting GDP growth, while the primary and tertiary industries are to the contrary. Shanxi’s resource allocation is improper due to resource scarcity (Wu Sibin and Liu Xifa, 2015) [38]. Some scholars believe that the rationalization of the industrial structure is an important threshold variable for the relationship between the advanced industrial structure and economic growth. Based on the rationalization of the industrial structure, the advanced industrial structure should be promoted, and the transformation and upgrading of the industrial structure should be used to provide new opportunities for economic growth (Che Minghao, et al., 2015) [39]. For the tertiary industry, the increase in China’s per capita GDP has a long-term positive impact on the decline of the deviation degree of the tertiary industry structure, but the impact is small. Changing the mode of economic growth, promoting the supply side structural reform of the tertiary industry, and increasing human capital investment will help economic growth correct the deviation from the unbalanced error (Zhou Jian and Zhang Guiwen, 2019) [40]. Previous scholars have demonstrated that the deviation of economic structures leads to resource mismatch and economic decline, and whether the transformation of the industrial structure provides impetus for economic growth, or how much loss the structural deviation brings, is an urgent concern under the “stable growth” of China’s economy.
2.3. Industrial Structure, Employment Structure and Economic Growth
In recent years, ensuring stable economic growth, adjusting industrial structures, and promoting social and economic reform have been the general direction of China’s macroeconomic policies (Zhang, Y. J., Liu, Z., Zhang, H., and Tan, T. D., 2014) [41]. The upgrading of the industrial structure is related to economic fluctuations (Zhang, D. and Chen, L, 2019) [42]; high-quality macroeconomic policies are necessary for economic growth (Ju, J. Lin, J. Y., and Wang, Y., 2015) [43]. When the government formulates industrial policies, it should pay attention to the interaction between structural indicators and economic growth, and promote the rationalization of industrial structures (Anlin and Li., 2019) [44]. Industrial structures, employment structures, and economic growth are important variables in the process of economic development (Carree, M.A.; A.R. Thurik., 1999) [45]. The three restrict and promote each other, and a reasonable economic structure will promote economic growth, and economic growth will also contribute to the optimization of an economic structure. Using econometric models to further explore the relationship between the three, such as a VECM model, combined with the data of Shaanxi Province, it is found that the industrial structure will affect the improvement of the employment structure in the short term (Chen Feng, 2008) [46]. It can also be used to measure the synergy effect of the two through the industrial structure deviation and the synergy coefficient of the employment structure, and it is found that China’s employment crowding out effect exists in the primary industry, and the employment absorption effect exists in the secondary and tertiary industries, of which the manufacturing, construction, health, social security, culture, sports, and entertainment industries have strong absorption capacity, and can promote the coordinated development of the economy through the improvement of the independent innovation ability of the tertiary industry (Zhu Tong, Pang Lei, 2015) [14]. The vector autoregressive model has also been widely used in related research. Taking Hebei Province as the object of investigation, the research reflects the important role of steady growth and structural adjustment in Hebei (Zheng Hongling et al., 2018) [47]. If it is facing the whole country, there is indeed a long-term relationship between China’s industrial structure, employment structure, and economic growth changes, and if the economy wants to develop at a high quality, it is necessary to accelerate structural adjustments and deal with the relationship with economic growth (Wang Yongming, 2018) [48].
The above literature provides important references for follow-up research. At present, under the influence of the COVID-19, China’s economy is facing universal triple pressures of shrinking demand, supply shocks, and weakening expectations. Difficulties and challenges are superimposed and resonated. In order to weaken the impact of the uncertain external environment, we must stimulate endogenous momentum and maintain the stable and healthy operation of the economy. The industrial structure and employment structure are related to the optimization and reconfiguration of production factors, which is a necessary condition for achieving healthy economic development. Therefore, this paper will specifically depict the actual relationship between China’s industrial structure, employment structure, and economic growth; discover the rules; and provide policy suggestions for China’s supply-side structural reform and high-quality economic development. At the same time, as the largest developing country, China’s research on this issue can also provide a model and idea for the vast number of developing countries to achieve high-quality development through economic transformation and upgrading.
Specifically, this paper will analyze the correlation coefficient, deviation degree, and employment elasticity index, and on this basis, establish a regression model to describe the impact of the deviation degree of economic structure on economic growth, and further study the linkage among employment structure, industrial structure, and economic growth with a vector autoregressive model.
3. Date and Methods
3.1. Data Sources
This paper uses the 43-year time series data of China from 1978 to 2020. All the data are from the China Statistical Yearbook and the website of the National Bureau of statistics. The variables involved in this paper, such as GDP and its composition, employed population and its composition, and GDP index, are officially released data. Other relevant indicators, such as correlation coefficients, structural deviations, employment structure changes, industrial structure changes, and other indicators, were calculated by the authors. In addition, some nominal variables have also eliminated the price factor and carried out constant price treatment, such as the treatment of fixed capital investment.
3.2. Methods
3.2.1. High Satisfaction Condition Configuration Analysis
With the changes in social development, technological change, factor input, and other modes of production, the linkage change of employment structure and industrial structure is objective, and there is an internal relationship between factor input and output structure, which is manifested as the correlation between the employment structure and the change of industrial structure. Based on the correlation coefficient of the two, we can further explore the law of change between them. The calculation formula of correlation coefficient is:
In Formula (1): r is the correlation coefficient between the proportion of added value of the three industries and the proportion of employment of the three industries; INi is the proportion of the added value of the three industries in the national economy; EMj is the employment proportion of the three industries.
3.2.2. Structural Deviation
Structural deviation can measure the symmetry between the structure ratio of added value of each industry and the proportion of employment structure, and its Formula (2) is as follows:
Structural deviation of an industry = the composition of the added value of each industry/the employment composition of the corresponding industry − 1
The structural deviation degree of the whole economy is calculated by the sum of the absolute value of the deviation degree of each industrial structure. Further, by observing the positive and negative situation of the structural deviation, we can roughly understand the labor transfer situation. When the structural deviation degree of an industry is positive, it means that the proportion of employment is lower than that of the industry, and the industry has the possibility of absorbing labor; when the structural deviation degree of an industry is negative, it means that the proportion of employment is higher than that of the industry, which means due to the surplus of employed labor, it is possible to transfer it to other industries.
3.2.3. Employment Elasticity
Employment elasticity is measured by the degree to which employment growth reflects changes in economic growth, that is, the change in employment growth that can be brought about when the economic growth rate increases by one percentage point. Its Formula (3) is:
Employment elasticity = employment growth rate/economic growth rate
If the index is positive, the greater the value, the stronger the driving effect of economic growth on employment. If the index is negative, there are two situations: if the economic growth is positive and the employment growth is negative, there is a phenomenon of surplus labor transferring to other industries in this industry; if the economic growth is negative and the employment growth is positive, the industry is in the stage of expansion, which has a certain attraction for labor migration. According to the trend of world economic development, with the improvement of labor productivity and the change of enterprise employment mode, the employment elasticity will gradually decrease.
3.2.4. C-D Production Function
Since the C-D production function was first proposed, it has been widely used in the field of economics. When considering the impact of structural deviations on economic growth, the paper sets the formula based on the C-D production function as follows:
In the process of China’s development from a traditional dual economy to a modern economic system, the mobility of labor has reduced the spatial mismatch of labor and promoted the continuous improvement of labor productivity. However, market segmentation and lagging labor mobility still exist, which distorts the allocation of resources and affects economic growth. In terms of macroeconomic operation, it is mainly reflected in the deviation of industrial structure and employment structure, which will aggravate the distortion of social resource allocation, which in turn will affect the increase in productivity, and the impact of structural deviation on economic growth in the short term is not obvious, but it will eventually affect the high-quality growth of the economy in the long term. The coordinated development of industrial structure and employment structure is conducive to the improvement of productivity, and to a certain extent, it is also conducive to economic growth, with the continuous expansion of economic scale, the deviation between industrial structure and employment structure has been improved, and the promotion of economic growth has also been revealed.
Y represents output, K represents capital, L represents employment, DE represents structural deviation, and u represents random perturbation terms. Considering the comparability and practical application of variables, Y and K are converted at constant prices. In order to mitigate the effects of data heteroscedasticity and make the equation more economical, the logarithmic form is taken on both sides of the original function, and the formula becomes:
α, β representing the output elasticity of capital and labor, we can use this regression model to measure the return to scale of input and output, as well as the impact of structural deviation on economic growth.
3.2.5. Vector Autoregressive (VAR) Models
Due to the interaction between employment structure, industrial structure, and economic growth variables, it is suitable to use VAR to build a model. This model was proposed by Sims in 1980 and has been widely used since then. The VAR model is to treat the endogenous variable as a vector, and then does its regression on the lag term. Its mathematical expression is:
The law of development of the world’s major economies is that economic growth will promote the transfer of labor from low-productivity to high-productivity sectors, bringing about changes in the employment structure. At the same time, economic growth is accompanied by capital accumulation, technological progress, and the expansion of international trade, which has also triggered changes in the industrial structure. The rationalization of industrial structures and employment structures is an effective allocation of resources in various sectors, and rational allocation of resources is one of the driving forces for productivity improvement, which also drives economic growth.
According to the relationship between employment structure, industrial structure, and economic growth, Zt is an element in matrix composed of employment structure change degree θE, industrial structure change degree θI, and economic growth rate Gt. A1, A2, …, Ak are the coefficients to be estimated; k is the autoregressive lag order; Vt is the disturbance vector. The degree of structural change in the endogenous variable matrix is calculated by using the total angle of employment or industrial structure changes in different periods. The calculation formulas for the degree of change in employment structure θE and the degree of change in industrial structure θI are as follows:
4. Results and Analysis
4.1. Correlation Results and Analysis
4.1.1. Correlation Coefficient and Analysis of Employment Structure and Industrial Structure
In order to compare whether the synergistic relationship between China’s industrial structure and employment structure has changed, this paper divides the time span into two, 1981–2000 and 2001–2020, the data of each 20 years before and after the calculation of the correlation coefficient. The correlation coefficient calculation results are shown in Table 1.

Table 1.
Correlation Coefficient between Industrial Structure and Employment Structure.
The data in Table 1 shows that in the first stage, the proportion of the added value of the three industries is positively correlated with the proportion of their own employment. Among them, the correlation coefficient between the proportion of added value of the primary industry and the proportion of employment in the primary industry is 0.9644. The correlation coefficient of the secondary industry is 0.3478, but not significant. The correlation coefficient of the tertiary industry is 0.8765. It shows that output and input are related in the same direction. In the second stage, the correlation coefficients between the proportion of the added value of the primary and tertiary industries and their own employment proportion are 0.9693 and 0.9822, respectively, showing a highly positive correlation, while the correlation coefficient between the proportion of added value of the secondary industry and the proportion of employment of the secondary industry is −0.3791, which is a negative correlation and is significant at the significance level of 10%. Comparing the two stages, the correlation coefficient between China’s primary and tertiary industrial structure and employment structure has increased, showing that the synergy is closer. Due to technological innovation, the synergy of the secondary industry has changed due to the absorption effect and crowding out effect. Especially in recent years, the employment crowding out caused by technological progress is more obvious.
In the first stage, the employment proportion of the first industry is negatively correlated with the added value proportion of the second and third industries, and the absolute value of the correlation coefficient with the third industry is 0.8984, which is greater than the absolute value of the correlation coefficient with the second industry of 0.5268. It indicates that with the reform of the rural economic system and the development of agricultural productivity, the rural surplus labor force will be released and transferred to the second and third industries, and the transfer to the third industry is more obvious. In the second stage, the employment proportion of the primary industry is negatively correlated with the added value of the tertiary industry, and the absolute value of the correlation coefficient reaches 0.9291. The correlation between economic development and the labor transfer of the primary industry is also closer, which is consistent with the law of world economic development.
The employment proportion of the second and third industries is negatively related to the added value proportion of the first industry, but it is different from the added value proportion of the second industry in the two stages, which is mainly related to the development stage of the second industry. Because the industrial development has different absorption and crowding out effects on labor employment in the labor-intensive stage and the technology intensive stage, it shows a different correlation in the two stages. The correlation direction and correlation strength represented by the rest of the data in the table are related to the industry’s ability to absorb labor, the nature of technology, and the development trend of the industry, and show the transfer effect of the employed population. It can be seen from the above analysis that, according to the change of the correlation coefficient, it can be inferred that the synergistic relationship between China’s industrial structure and employment structure is improving.
4.1.2. Structural Deviation and Analysis
After years of development, the deviation of China’s three industrial structures has changed from −0.61, 1.76, and 1.02 in 1978 to −0.67, 0.32, and 0.14 in 2020. The overall structural deviation has dropped from 3.38 in 1978 to 1.13 in 2020. The overall deviation shows a downward trend, the industrial structure is gradually optimized, and the structural changes are becoming more and more reasonable. The structural deviation of the primary industry was negative from beginning to end, and has fluctuated around −0.7 in recent years. The proportion of added value and employment in the primary industry has both declined, but the proportion of employment has declined more slowly, indicating that labor in the primary industry’s productivity is relatively low, and there is still room for rural surplus labor to be transferred outward. The structural deviation of the secondary industry has always been positive, from 1.76 in 1878 to 0.32 in 2020. In the past two decades, the structural deviation of the secondary industry has been declining, and the employment structure has continued to improve, but its value is higher than the degree of structural deviation is greater than that of the tertiary industry, which is related to the internal composition of the secondary industry. The secondary industry is mostly capital-intensive enterprises and is weaker than the tertiary industry in terms of employment absorption. The deviation degree of the tertiary industry structure is all positive, and its value fluctuates and shows a downward trend as a whole. In recent years, the degree of structural deviation has been around 0.15, the lightest deviation, which is also related to the strong employment capacity of the tertiary industry. From the above analysis, we can see that, according to the changes in the overall economic structure and the deviation of the three industrial structures, it is again judged that the synergistic relationship between China’s industrial structure and employment structure is improving.
4.1.3. Employment Flexibility and Analysis
With the advancement of technology, the improvement of industrial efficiency, and the adjustment of economic structures, the employment elasticity tends to decline. China’s employment elasticity fluctuates greatly, especially since the beginning of the new century, and population mobility has continued to be active, corresponding to the dramatic changes in employment elasticity. Employment elasticity reached a positive all-time high of 126.55 in 2013 and a negative all-time low of −184.29 in 2015. Considering the reality of economic development, after joining the WTO in the 21st century, China’s economic growth rate has been above double digits for many consecutive years. It has a strong demand for labor employment, and its employment elasticity coefficient is also above double digits. Economic growth has brought a strong impact on employment absorbing space. Later, along with the adjustment of China’s economic structure and the transformation of its economic development mode, under the background of supply-side structural reform, the shift of economic growth rate and the pursuit of high-quality development began. In 2015, the employment elasticity coefficient changed from positive to negative. With the rapid development of new technologies such as information technology and artificial intelligence, the employment elasticity coefficient was negative for many years since then, but the absolute value of the employment elasticity is decreasing to −4.33, which also means that new technologies, new formats, and new business models have also spawned new employment spaces. With the all-round development of China’s economy and society, the continuous impact and resolution of new things on employment has indeed improved the synergy between China’s industrial structure and employment structure.
4.2. Results and Analysis of the Impact of Structural Deviation on Economic Growth
4.2.1. Initial Regression
In order to test the impact of structural deviation on economic growth in the process of China’s economic development, this paper combines the C-D production function, according to the model proposed above, and uses Chinese data from 1978 to 2020 to perform regression. The results are as follows:
Note: The values in brackets represented the accompanying probability of the t-statistic value of the regression coefficient.
The regression results show that the R2 is 0.9973, the F statistic is 4609.725, and the overall model is significant. Combining with the observation of the t statistic, the impact of capital and labor on output is significant. From the regression equation, the output elasticity of capital is about 0.6859, and the output elasticity of labor is about 0.8354. The sum of the two is greater than 1, and the economy is in a stage of increasing returns to scale. The influence coefficient of structural deviation on output is −0.0928, which is also significant at the 10% significance level, but the D-W statistic is 0.4678, and the model has autocorrelation. Therefore, the model needs to be further revised, and the residual sequence is regressed based on the initial regression model, and the estimated value of the autocorrelation coefficient is 0.778695, and the regression results are corrected by the generalized difference method.
4.2.2. Corrected Regression
The corrected regression results are as follows:
Note: The values in brackets represented the accompanying probability of the t-statistic value of the regression coefficient.
The regression results show that R2 is 0.9748, and the F statistic is 477.1147. Combined with the observation of the t statistic corresponding to each variable, the impact of capital, labor, and structural deviation on output is significant. From the regression equation, the output elasticity of capital is about 0.6868, the output elasticity of labor is about 0.6686, the sum of the two is greater than 1, and the economy is in the stage of increasing returns to scale, but the effect of increasing returns to scale is weaker than that without dealing with autocorrelation. The influence coefficient of structural deviation on output is −0.1052, which is also significant at the 5% significance level. The D-W statistic is 1.4154. After checking the table dl < DW ≤ du, it is impossible to determine whether the model has autocorrelation, so using the LM test, its LM statistic is 3.7372, and it is judged that there is no autocorrelation at the 5% significance level.
The above results also show that the influence coefficient of structural deviation on output is −0.1052, which is also significant at the 1% significance level, and its 95% confidence interval is (−0.1557, −0.0547). The estimation results show that in the industrial structure, for every 1 increase in the deviation degree, the output will decrease by about 0.1557% to 0.0547%. This reflects that the increase in structural deviation will reduce the efficiency of resource allocation, and generally have a restrictive effect on economic growth. From 1978 to 2019, the overall structural deviation has decreased by 2.1486, with an average annual decrease of 0.0511, which means that the optimization of the economic structure has an impact of about 0.0054 on the increase in output, that is, about 0.54% of the total output is a structural optimized contribution. From this, it can be judged that with the development of China’s economy, the deviation of the economic structure is improving, and the improvement of the deviation of the economic structure has a significant contribution to economic growth.
4.3. VAR Model Variable Linkage Empirical Results and Analysis
Based on the VAR model, this paper analyzes the interaction between employment structure, industrial structure, and economic growth. Firstly, the statistical description of variables and unit root test are carried out, then the lag order and stability test of the model are determined, and finally the impulse response analysis and variance analysis are carried out.
4.3.1. Statistical Description of Variables and Unit Root Test
Before performing regression analysis on the interaction between variables based on VAR model, the distribution characteristics of the data should be observed first, considering the special impact of COVID-19 and the lag variables used in VAR model. The time period of China’s empirical data is 1979–2019. Table 2 gives the results of the descriptive statistics of relevant variables.
Table 2.
Descriptive statistical analysis results of each variable.
As shown in Table 2, the mean value of the employment structure change is 1.424839, the standard deviation is 0.812547, the maximum value is 3.225378, which occurred in 2013, the minimum value is 0.155183, which occurred in 1982, the skewness coefficient is 0.259154, and the kurtosis coefficient is 1.999366. The mean value of the industrial structure change degree is 2.412209, the standard deviation is 1.345822, the maximum value is 7.223292, which occurred in 1992, the minimum value is 0.204029, which occurred in 2010, the skewness coefficient is 1.231243, and the kurtosis coefficient is 5.247163. The average economic growth rate is 9.387805, the standard deviation is 2.718289, the maximum value is 15.2, which occurred in 1984, the minimum value is 3.9, which occurred in 1990, the skewness coefficient is 0.215379, and the kurtosis coefficient is 2.617013.
Next, the unit root test is performed on the variable to determine whether the variable is a stable variable. ADF is used for the unit root test. The results of the ADF test for three time series variables are shown in Table 3. At the significance level of 5%, the variables are stable and can be modeled by var.
Table 3.
Inspection results of unit root.
4.3.2. Lag Order Selection and Stability Analysis
Determining the lag order is the next task of establishing the VAR model. Eveiws software is used to judge the lag order of the VAR model. The model needs to obtain the optimal solution between the information acquisition and the reduction of degrees of freedom. The software lists the results of the five inspection methods LR, FPE, AIC, SC, and HQ. In Table 4, the inspection with the most * numbers is the optimal order. The five different inspection methods show that the optimal lag order is the second order so a VAR(2) model should be established.
Table 4.
Optimal lag order of VAR model.
On the basis of the sequence stationarity test, the stability of the VAR(2) model is observed again. It can be judged from Table 5 that the reciprocals of all the root modules are within the unit circle, which means that the model is stable.
Table 5.
Optimal lag order of VAR model.
4.3.3. Impulse Response Function
The impulse response function is used to describe the trajectory of the influence of random disturbance items on endogenous variables. After adding a shock of unit standard deviation to the disturbance items, the impulse response results of endogenous variables are generated. The specific impulse response image is shown in Figure 1.
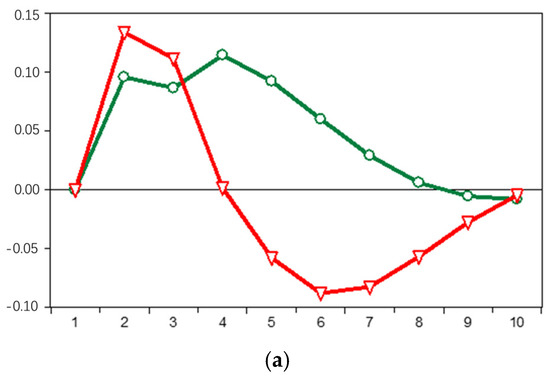
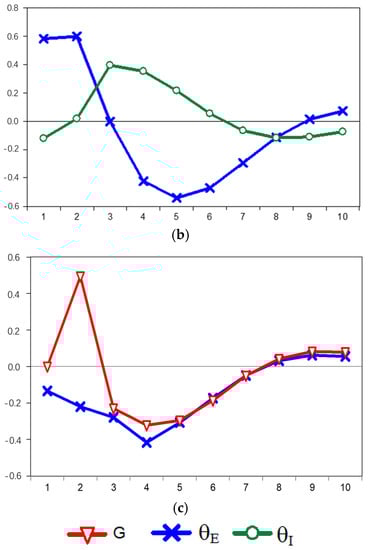
Figure 1.
Impulse response image. (a) Response of θE to Cholesky One S.D. Innovations. (b) Response of θI to Cholesky One S.D. Innovations. (c) Response of G to Cholesky One S.D. Innovations.
Figure 1a shows the impact of the industrial structure and economic growth on the employment structure. The two lines represent the impact response of θI and one standard deviation change in G to θE, respectively. Obviously, changes in the industrial structure directly affect the changes in employment positions in different industries, and the employment structure changes accordingly. The impact of this impact on the employment structure first gradually increases and then gradually slows down, and it has gradually declined since the fifth period. The impact of economic growth on the employment structure is also first strong and then weak, and the fifth period began to become negative, but the impact was very weak. Overall, the impact of the industrial structure on the employment structure is stronger than the changes brought about by economic growth, and this change is most obvious in the third and fourth periods.
Figure 1b shows the impact of the employment structure and economic growth on the industrial structure. The two lines, respectively, indicate the impact response of θE and a standard deviation change of G on θI. The impact of the employment structure and economic growth changes on the industrial structure is relatively weak, and the impact of employment structure changes on the industrial structure has experienced a process from negative to positive, which is related to the large scale of population flow in China in the later period. With the improvement of employment environment, the industrial structure has also been gradually optimized. The impact of economic growth on the industrial structure was positive at the initial stage, and the impact was large. After that, the impact of economic growth on the industrial structure changed from negative to positive. This shows that the impact of economic growth on the industrial structure is lagging and long-term, and reflects the complexity and arduousness of eliminating backward production capacity and structural optimization.
Figure 1c shows the impacts of the employment structure and the industrial structure on economic growth. The two lines, respectively, represent the impact response of θE and θI with a standard deviation change to G. The change of employment structure has a positive impact on the initial stage of economic growth. With the passage of time, the impact changes from positive to negative and then to positive, showing more complex fluctuations. Compared with the impact of the industrial structure on economic growth, the impact of the employment structure on economic growth is greater than that of the industrial structure. The impact of changes in factor input structure on the economy is relatively obvious. The impact of employment structure optimization on economic growth is most obvious in the first and second period, while the impact of the industrial structure on economic growth is most obvious in the third and fourth period.
4.3.4. Variance Decomposition
Variance decomposition is conducted to decompose the forecast mean square error of the system into the contribution made by the shocks of each variable in the system. Figure 2 shows the time path of the variance decomposition of variables. The contribution of structural shocks to changes in endogenous variables in the variable sequence can be observed through the diagram, which is used to express the dynamic characteristics of the model.
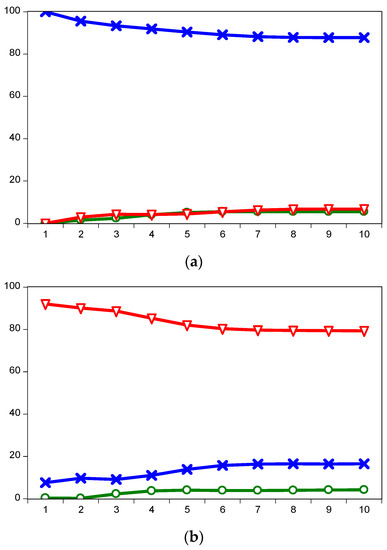
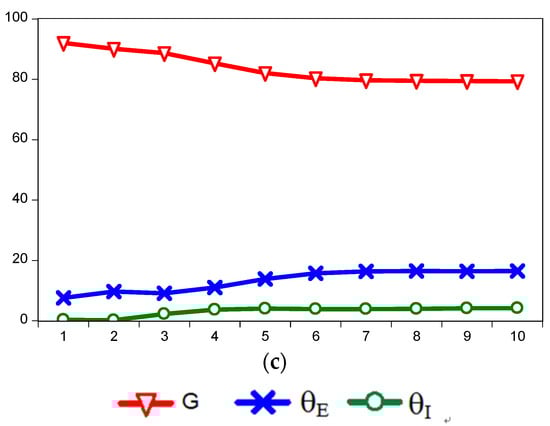
Figure 2.
Variance decomposition image. (a) Variance Decomposition of θE. (b) Variance Decomposition of θI. (c) Variance Decomposition of G.
Figure 2a is the variance decomposition time path of θE. More than 80% of the forecast mean square error of θE is carried by itself from the first period to the tenth period. The contribution rates of θI and G to θE are all below 10%, but their contribution levels are on the rise. At the same time, the contribution of the industrial structure to the mean square error of the employment structure is slightly smaller than that of economic growth, which also shows that changes in economic growth have a more direct impact on the employment structure.
Figure 2b is the variance decomposition time path of θI. Most of the forecast mean square error of θI is carried by itself, showing a gradual downward trend, while the contribution of the employment structure and economic growth to the industrial structure shows a gradual upward trend. The sum of the two is as high as more than 40%, especially in the later period. The contribution of the employment structure to the industrial structure is stable at more than 20% after the sixth period, and the contribution of economic growth to the industrial structure is stable at more than 20% after the fourth period. This shows that the contribution of economic growth to the industrial structure has been increasing with the passage of time. It also shows the stickiness of China’s industrial structure adjustment, and that structural optimization, transformation, and upgrading cannot be achieved in one move, which is durable.
Figure 2c is the variance decomposition time path of G. More than 70% of the forecast mean squared error of G is carried by itself, followed by θE and θI; the variance decomposition time path of G to itself has been positive and declining, and the contribution rate of the 10th period is 79.33%. The contribution of the employment structure and the industrial structure in the 10th period was 16.47% and 4.19% respectively, which indicates that the impact of changes in employment structure on economic growth is more obvious than that of industrial structure on economic growth, and reflects the important significance of China’s structural adjustment on long-term and stable economic development.
5. Discussion
The employment structure, industrial structure, and economic growth, which describe the characteristics of the times of economic change, are also hot issues for academic circles and news media. All the findings in this paper lead to the following considerations.
First, the synergistic relationship between China’s industrial structure and employment structure is improving, and the conclusions are consistent with those of Xia Jianhong and Jiao Weihong (2018) [15], Ji Qiang and Bassen Dasi (2020) [22], Tao, L., Zhang, S. and Xu, J (2019) [17]. The possible reason is that the adjustment of the industrial structure has promoted the transfer of labor in different industrial sectors. The labor flow will also bring about the optimization of labor employment, income, and self-value, and promote further change of the industrial structure. The linkage development of the two is not only the endogenous power of economic development, but also the result of economic development. In addition, the fluctuation range of China’s employment elasticity is obvious, which is like the observation of Lin Fabin et al. (2021) [19]. The possible reason is that China’s population base is large and the population flow is active. Affected by the economic system reform, the improvement of labor productivity, and the continuous emergence of new technologies and new formats, China’s employment elasticity coefficient is slowing down.
Second, the improvement of economic structural deviation is conducive to economic growth, which is consistent with the conclusion of Zhou Jian and Zhang Guiwen (2019) [40]. The possible reason is that with the continuous development of China’s economy, the structural imbalance has been alleviated, the coordination has gradually improved, and the overall structural deviation has been weakened. In particular, the data of the tertiary industry shows that the structural deviation is the smallest, and its strong employment absorption capacity. It plays an important role in improving the employment structure and optimizing the allocation of resources. At the same time, the results of its empirical analysis are like those of Wang Tao et al. (2015) [37], Wu Sibin and Liu Xifa (2015) [38], Hung D H, Zhang J and Mirza S S (2015) [21], that is, structural deviation will lead to the misallocation of resources, becoming an obstacle to economic development. The possible reason is that the deviation of the industrial structure and the employment structure will hinder the free flow of production factors, and this friction will reduce the efficiency of resource allocation, thereby affecting economic growth.
Third, the mutual impact of industrial structure, employment structure, and economic growth is complex and lasting, which can be presented by impulse response and variance analysis, which is like the research conclusions of Zheng Hongling et al. (2018) [47] and Wang Yongming (2018) [48]. The possible reason is that the continuous advancement of reform, opening-up, and market-oriented reform has made the productivity of various fields constantly improve, and accelerated the transfer of labor among the three industries. China’s economic scale has continuously expanded, and the rapid economic growth and structural adjustment and change have occurred for many years. The change of the economic structure is also one of the driving forces that cause economic growth fluctuations. Industrial structure, employment structure, and economic growth are closely related. Economic growth can be promoted based on the rationalization of economic structure, and economic growth is also the driving force of economic structure transformation and upgrading. These trends and characteristics in this paper provide a sample for developing countries, and provide some reference information for exploring the linkage between employment structure, industrial structure, and economic growth in theory.
6. Conclusions
6.1. Research Conclusions
Based on summarizing the relevant studies, this paper first summarizes and analyzes China’s employment structure, industrial structure, and economic growth, and makes a correlation analysis in combination with the correlation coefficient, structural deviation degree, and employment elasticity. Then, it explores the impact of structural deviation on economic growth, carries out regression analysis with the help of C-D production function, and finally analyzes and studies the employment structure, industrial structure, and economic growth with a VAR model. The dynamic relationship between variables was further observed by impulse response and variance decomposition. The conclusions are as follows: (1) The output proportion of China’s secondary and tertiary industries and their contribution to economic growth have significantly increased; the economic structure has been continuously optimized, and the synergy between employment structure and industrial structure has become closer. (2) The increase in structural deviation will reduce the efficiency of resource allocation. Since China’s reform and opening, the overall structural deviation has decreased by 0.0511 on average every year, which means that about 0.54% of the total output is contributed by structural optimization. (3) The impact of the industrial structure on the employment structure is gradually stronger and slower, and the impact on economic growth is more obvious at the initial stage; the impact of economic growth on the industrial structure is lagging and long-term; the impact on the employment structure is first strong and then weak; the impact of the change of employment structure on the industrial structure is related to the migration of the employed population among industries; and the impact of the optimization of the employment structure on economic growth is most obvious in the initial stage. (4) Most of the prediction mean square errors of the employment structure, industrial structure, and economic growth are carried by themselves. The change of economic growth has a more direct impact on the employment structure. The adjustment of the industrial structure shows a certain stickiness. The adjustment of structure is of great significance to stable growth. However, structural optimization is relatively long-lasting, and economic transformation and high-quality development need to be gradually promoted.
6.2. Management Implications
The relevant implications of this study include: (1) Taking skills spillover as a model to improve employment opportunities. China has a large floating population. Local governments at all levels should encourage returnees with professional knowledge and skills, fully exploit the comparative advantages of human factors, and support enterprises with different employment absorption flexibility to promote technology spillover and knowledge spillover with differentiated tax, financial support, and other policies, so as to form a demonstration, assistance, and driving effect on the surrounding economy. It has also boosted the economy and employment and alleviated some social problems. (2) We will promote the optimization of the industrial structure by focusing on industrial integration. Industrial integration is a new force for carrying out supply side structural reform and cultivating new economies and new driving forces. With the promotion of high-quality economic development, only through cross-border integration, joint complementarity, and collaborative innovation can the three industries further optimize the industrial ecology and continuously promote the optimization of industrial structures in the process of industrial integration. (3) Promoting the high-quality development of China’s economy through innovation. Innovation can not only promote the improvement of total factor productivity, but also drive the adjustment of the industrial structure and the optimization of the employment structure. The high-quality economic development driven by innovation covers both economic growth and structural optimization. In the future, we will continue to improve the science and technology innovation policy, actively layout future industries, cultivate innovative enterprises with international competitiveness, and empower high-quality development and economic structure optimization. (4) Ensuring that the relevant policy effects are truly realized with the durability and consistency of policies. The impact of economic growth on industrial structure found in this paper is lagging and long-term, the impact of employment structure optimization on economic growth is most obvious in the early stage, and the adjustment of industrial structure shows a certain stickiness, which objectively requires that policies must have a certain time span, and must achieve the durability and consistency of relevant policies, only in this way can the effect of relevant policies be maximized.
6.3. Research Deficiencies and Prospects
There are still some shortcomings in this study. For example, in the use of data, subject to the availability and comparability of data, the use and analysis of interprovincial panel data is not carried out, and only Chinese time series empirical data are selected, which may make the results too macroscopic and offer a lack of detailed analysis of specific regions, and the research conclusions may be more suitable for the overall economic development of developing countries. In addition, the analysis of China’s national-level sequence data is based on certain basic assumptions, which may ignore the differences in labor structure and industrial structure and how spillover effects between provinces will interact with each other.
Therefore, in future research, the comparative analysis of the eastern, central, and western regions, the difference of linkage law between different regions, and the comparative study of different degrees of difference between different regions based on China’s provincial panel data are issues to be further explored, and are worth continuing to explore in the future.
Author Contributions
Conceptualization, C.Z. and H.Z.; methodology, H.Z. and C.Z.; software, H.Z.; validation, C.Z., H.Z. and S.W.; formal analysis, H.Z.; investigation, C.Z.; resources, C.Z. and H.Z.; data curation, H.Z.; writing—original draft preparation, H.Z. and C.Z.; writing—review and editing, C.Z., H.Z. and S.W.; visualization, S.W.; supervision, C.Z.; project administration, C.Z. and H.Z.; funding acquisition, C.Z. All authors have read and agreed to the published version of the manuscript.”
Funding
This research was funded by Shangqiu Normal University’s research start-up fund supporting project “Research on the development mechanism and path of agricultural land and financial integration under the ‘separation of three rights’” (700179) and Major project of Basic research of philosophy and social sciences in colleges and universities of Henan Province (No. 2022-JCZD-17) and Tangshan Normal University’s research fund supporting project “Research on the economic linkage and spillover effect of Beijing Tianjin Hebei region” (2021A08).
Institutional Review Board Statement
No applicable.
Informed Consent Statement
No applicable.
Data Availability Statement
No new data were created in this study. Data sharing is not applicable to this research.
Conflicts of Interest
The authors declare no conflict of interest.
References
- Brandt, L.; Hsieh, C.T.; Zhu, X. Growth and structural transformation in China. China’s Great Econ. Transform. 2008, 683–728. [Google Scholar] [CrossRef]
- Dekle, R.; Vandenbroucke, G. A quantitative analysis of China’s structural transformation J. Econ. Dyn. Control 2012, 36, 119–135. [Google Scholar] [CrossRef]
- Cao, K.H.; Birchenall, J.A. Agricultural productivity, structural change, and economic growth in post-reform China. J. Dev. Econ. 2013, 104, 165–180. [Google Scholar] [CrossRef]
- Liu, H.; Yang, T. Explaining the productivity growth gap between China and India: The role of structural transformation. Dev. Econ. 2015, 53, 100–121. [Google Scholar] [CrossRef]
- Petty, W. Political arithmetick, or a Discourse Concerning the Extent and Value of Lands, People (and) Buildings, 1st ed.; Robert Clavel: London, UK, 1690; pp. 96–97. [Google Scholar]
- Adam, S. An Inquiry into the Nature and Causes of the Wealth of Nations; Createspace Independent Pub: Colorado Springs, CO, USA, 1776; pp. 155–187. [Google Scholar]
- Clark, C. The Conditions of Economic Progress; Macmilan & Co., Ltd.: London, UK, 1940; pp. 135–166. [Google Scholar]
- Simon, K. Modern Economic Growth: Findings and Reflections. Am. Econ. Rev. 1973, 63, 247–258. [Google Scholar]
- Leontief, W. Domestic production and foreign trade: The American capital position re- examined. Proc. Am. Philos. Soc. 1953, 97, 332–349. [Google Scholar]
- Liu, G.G. On the adjustment of China’s industrial structure. J. Shaanxi Univ. Financ. Econ. 1981, 2, 1–4. [Google Scholar]
- Chen, Y. Technological revolution, industrial structure and employment. Econ. Probl. 1984, 6, 23–25. [Google Scholar]
- Hong, Y.F. On the transformation of employment structure in China. Popul. J. 1985, 6, 80–83. [Google Scholar]
- Luo, R.Y.; Zhang, L.P. Research on economic growth in the change of industrial structure in Western China. Res. Financ. Econ. Issues 2013, 9, 30–36. [Google Scholar]
- Zhu, T.; Pang, L. Economic Growth, Industrial Structure and Employment Structure Synergy’s Effect Analysis. Rev. Ind. Econ. 2015, 2, 28–35. [Google Scholar]
- Xia, J.H.; Jiao, W.H. Study on Coupling Effect between Industrial Structure and Employment Structure in Shandong Province. Econ. Probl. 2018, 10, 65–71. [Google Scholar]
- Tan, L. A Cluster-Analysis of the Employment Structure Deviation for the 11 Cities in Zhejiang Province. In Advanced Materials Research: Part 1; Trans Tech Publications Ltd.: Wollerau, Switzerland, 2011; pp. 540–543. [Google Scholar]
- Tao, L.; Zhang, S.; Xu, J. Analysis of Industrial Structure Change and Employment Effect in Zhejiang Province. Open J. Soc. Sci. 2019, 7, 426–432. [Google Scholar] [CrossRef]
- Zhang, J.W.; Gao, Y.B.; Nan, L.I. Research on the Employment Effect of Industrial Structure Changes in Guangdong Province: An Empirical Analysis Based on Spatial Econometric Model. J. Guizhou Educ. Univ. 2016, 32, 5–11. [Google Scholar]
- Lin, F.B.; Wu, D.J.; Huang, J.W. A Comparative Study of the Relationship between Industrial Structure and Employment Structure in Fujian and Taiwan. Fujian Trib. 2021, 5, 176–186. [Google Scholar]
- Tran, T.; Doan, T. Industrialization, Economic and Employment Structure Changes in Vietnam during Economic Transition; MPRA Paper No. 26979; MPRA: Munich, Germany, 2010; Volume 11, pp. 1–14. [Google Scholar]
- Hung, D.H.; Zhang, J.; Mirza, S.S. Industrial Structure and Employment Structure Coordination in Viet Nam. J. Econ. Sustain. Dev. 2015, 6, 78–84. [Google Scholar]
- Ji, Q.; Basen, D. Research on Time and Space Distribution of Coordination Degree between Industrial Structure and Employment Structure in China. Henan Soc. Sci. 2020, 28, 103–114. [Google Scholar]
- Constantine, C. Economic structures, institutions and economic performance. J. Econ. Struct. 2017, 6, 2. [Google Scholar] [CrossRef]
- Che, N.X. Factor Endowment, Structural Coherence, and Economic Growth; IMF Working Papers; International Monetary Fund: Washington, DC, USA, 2012; Volume 12. [Google Scholar]
- Stel, A.V.; Carree, M.; Thurik, R. The Effect of Entrepreneurial Activity on National Economic Growth. Small Bus. Econ. 2005, 24, 311–321. [Google Scholar] [CrossRef]
- Wang, R.; Qi, Z.; Shu, Y. Multiple relationships between fixed-asset investment and industrial structure evolution in China–Based on Directed Acyclic Graph (DAG) analysis and VAR model. Struct. Chang. Econ. Dyn. 2020, 55, 222–231. [Google Scholar] [CrossRef]
- Rajan, R.G.; Zingales, L. Financial Systems, Industrial Structure, and Growth. Oxf. Rev. Econ. Policy 2001, 17, 467–482. [Google Scholar] [CrossRef]
- Junior, A.B.; Faria, W.R.; Montenegro, R.G.; Bahia, D.S.; Gonçalves, E. Research and development, productive structure and economic effects: Assessing the role of public financing in Brazil. Econ. Model. 2020, 90. [Google Scholar]
- Audretsch, D.; Thurik, R. Innovation, Industry Evolution and Employment; Tinbergen Institute Discussion Papers; Cambridge University Press: Cambridge, UK, 1999; Volume 8, pp. 1–12. [Google Scholar]
- Motkuri, V.; Veslawatha, S.N. Growth and Structure of Workforce in India: An Analysis of Census 2011 Data. MPRA Pap. 2013, 64, 1–20. [Google Scholar]
- Soni, S.; Subrahmanya, M. Empirical Study of Industrial Classification, Structure, and Factor Intensity: An Enquiry into Dwindling Labor Intensity in a Labor-Surplus Economy. Emerg. Econ. Stud. 2020, 6, 201–213. [Google Scholar] [CrossRef]
- Wongboonsin, K.; Phiromswad, P. Searching for empirical linkages between demographic structure and economic growth. Econ. Model. 2017, 60, 364–379. [Google Scholar] [CrossRef]
- Singh, L. Technological Progress, Structural Change and Productivity Growth in Manufacturing Sector of South Korea. World Rev. Sci. Technol. Sustain. Dev. 2004, 1, 37–49. [Google Scholar] [CrossRef]
- Combes, P.P. Economic Structure and Local Growth: France, 1984–1993. J. Urban Econ. 2000, 47, 329–355. [Google Scholar] [CrossRef]
- Zhao, J.; Tang, J. Industrial structure change and economic growth: A China-Russia comparison. China Econ. Rev. 2018, 47, 219–233. [Google Scholar] [CrossRef]
- Chen, X.; Mu, H.Z. Research on the rationalization of China’s industrial structure and its relationship with economic growth. Rev. Econ. Res. 2014, 46, 20–29. [Google Scholar]
- Wang, T.; Shi, D.; An, J. An Empirical Study on the Relationship between Industrial Structure Deviation and Economic Growth in Shanghai—Based on a New Index Judging Industrial Structure Deviation. East China Econ. Manag. 2015, 29, 17–23. [Google Scholar]
- Wu, S.B.; Liu, X.F. Contribution to economic growth and industrial research Measure—Deviate advantage in Shanxi Province. J. Guizhou Univ. Financ. Econ. 2015, 2, 84–91. [Google Scholar]
- Che, M.H.; Deng, X.L.; Chen, B.D. Rationalization and Improvements of Industrial Structure and Economic Growth: From the Perspective of Threshold Effect. J. Manag. 2019, 32, 12–20. [Google Scholar]
- Zhou, J.; Zhang, G.W. Dynamic relationship between economic growth and rationalization of the third industrial structure: International comparison and Enlightenment. Chongqing Soc. Sci. 2019, 3, 64–78. [Google Scholar]
- Zhang, Y.J.; Liu, Z.; Zhang, H.; Tan, T.-D. The impact of economic growth, industrial structure and urbanization on carbon emission intensity in China. Nat. Hazards 2014, 73, 579–595. [Google Scholar] [CrossRef]
- Zhang, D.; Chen, L. Environmental Regulation, Upgrading of Industrial Structure and Economic Fluctuation: An Empirical Study of Dynamic Panel Threshold. J. Environ. Econ. 2019. [Google Scholar] [CrossRef]
- Ju, J.; Lin, J.Y.; Wang, Y. Endowment structures, industrial dynamics, and economic growth. J. Monet. Econ. 2015, 76, 244–263. [Google Scholar] [CrossRef]
- Anlin, L. Empirical Study on the Relationship Between Industrial Structure and Economic Growth. In Proceedings of the 4th International Conference on Economy, Judicature, Administration and Humanitarian Projects, Kaifeng, China, 12–14 September 2019; Volume 1, pp. 842–845. [Google Scholar]
- Carree, M.A.; Thurik, A.R. Industrial structure and economic growth. In Innovation, Industry, Evolution and Employment; Cambridge University Press: Cambridge, UK, 1999; pp. 86–110. [Google Scholar]
- Chen, F. An Empirical Analysis of Economic Growth and Evolution of Industrial Structure and Employment Structure—The Empirical Research Based on Shaanxi Case. J. Stat. Inf. 2008, 8, 79–85. [Google Scholar]
- Zheng, H.L.; Liu, Z.M.; Lu, L.L. Linkage Analysis of Employment Structure, Industrial Structure and Economic Growth in Hebei Province. Areal Res. Dev. 2018, 37, 63–68. [Google Scholar]
- Wang, Y.M. Research on the relationship between economic growth and changes in industrial structure and employment structure--An Empirical Analysis Based on VAR model. J. Gansu Adm. Inst. 2018, 3, 87–97. [Google Scholar]
Disclaimer/Publisher’s Note: The statements, opinions and data contained in all publications are solely those of the individual author(s) and contributor(s) and not of MDPI and/or the editor(s). MDPI and/or the editor(s) disclaim responsibility for any injury to people or property resulting from any ideas, methods, instructions or products referred to in the content. |
© 2023 by the authors. Licensee MDPI, Basel, Switzerland. This article is an open access article distributed under the terms and conditions of the Creative Commons Attribution (CC BY) license (https://creativecommons.org/licenses/by/4.0/).