Abstract
The rapid increase in urbanization has brought about a great deal of ecological problems, and thus the systematic protection of the environment is vital. Ecological security patterns are important for maintaining regional ecological stability and sustainable urban development. Human disturbance is a key factor affecting the stability and sustainable development of ecosystems. This paper constructs an ecological security pattern and evaluates the degree of human disturbance in Fuzhou City. Through a comprehensive analysis of both of these factors, the ecological priority restoration areas in Fuzhou were identified. The study shows that (1) there are 40 ecological source areas in Fuzhou, with a total area of 4556.48 km2; 83 ecological corridors, with a total distance of 179.33 km; and 30 ecological nodes. (2) The human disturbance degree score in the study area is between 0 and 0.8. The degree of human disturbance forms two larger major cores in Cangshan District, Gulou District, and Fuqing City. (3) The scores for the degree of human disturbance with ecological sources range from 0 to 0.42. The high-priority areas in the study area are distributed at the edges of ecological sources and form two high-scoring aggregation areas in Fuqing City and Jinan District. These corridors have a high degree of human disturbance with scores between 0 and 0.56. The I and II priority areas are mostly found in longer corridors in Fuqing City and Cangshan District near coastal or urban centers, and the III priority areas are mainly distributed in ecological corridors near the inland. The human disturbance degree scores of the nodes range from 0.01 to 0.27, and the nodes with higher grades were mainly distributed in the northeast, southeast, northwest and southwest of the study area.
1. Introduction
Human disturbance is an important factor that affects ecosystems. The most intuitive manifestation of human disturbance is the rapid urbanization process and population growth, land-use expansion, and economic agglomeration [1]. The dramatic influx of human activities has an increasingly serious impact on the function and structure of the ecosystem, causing various ecological problems, such as ecological degradation, landscape fragmentation, the loss of ecological diversity, and soil erosion [2,3]. These problems seriously affect the ecological security and sustainable development of cities. In response to these problems, in 2019, the United Nations announced the “Decade of Ecosystem Restoration 2021–2030”, which proposes large-scale restoration of degraded and damaged ecosystems [4], and in 2021, China included ecological restoration as an important tool to promote new urbanization [5]. The systematic process of ecological restoration should become the focus of future academic research.
In traditional ecological restoration research, studies have mostly targeted single-habitat or single-element restoration. A large number of ecological restoration studies have focused on water [6], forests [7], soil erosion [8], and the restoration of abandoned mining sites [9]. These studies are mostly conducted through field surveys or instrumental observations, and then ecological restoration strategies are proposed. However, due to the lack of consideration on a regional scale, ecological systems, and ecological element correlation, there are good local effects but low overall benefits or even declining ecosystem service functions. Evidently, large-scale ecological evaluation has significant advantages in systematic ecological restoration.
At present, ecological evaluations at large scales focus on ecological sensitivity [10], ecological environmental quality [11], ecological importance [12,13], ecological risk [14], ecological vulnerability [15], and other aspects of evaluation, identifying areas that need to be protected or restored by classifying the evaluation results into levels. These studies emphasize the ecological pattern and state, and less consideration is given to the ecological processes [16,17]. Ecological security patterns combine spatial patterns, ecological processes, and scales in a more comprehensive way than other macroscopic studies. The concept of ecological security patterns was introduced in the 20th century in response to the ecological problems associated with rapid urbanization [18,19]. Ecological security patterns refer to landscape elements, spatial locations, and linkages that are critical to maintaining the health and safety of ecological processes [20,21]. Researchers believe that ecological security patterns with less human interference are important for sustainable urban development. Currently, the standard paradigm of “ecological source identification—building a resistance surface—extracting corridors” is used to construct an ecological security pattern, which can be widely used in various scales and is proven to be effective [22,23,24]. The identification of ecological sources and the construction of ecological corridors are the focuses of ecological security pattern research. For the identification of ecological sources, researchers initially used ecological reserves and important ecological patches as sources, and models such as the morphological spatial pattern analysis (MSPA), eco-environmental quality (Invest), and pressure–state–response (PSR) have been introduced to identify sources [25,26,27]. The construction of a resistance surface is key to identifying ecological corridors. Initially, researchers mostly took advantage of land use as a resistance surface for identifying corridors, but as time progressed, researchers gradually found that, due to the mixed nature of land use, this method cannot accurately identify ecological corridors. Therefore, researchers now utilize nighttime light, normalized difference vegetation index (NDVI), slope and other data to modify ecological corridors [28,29]. There are several methods used for ecological corridor identification, such as circuit theory, minimum cumulative resistance (MCR) and MSPA, but the MCR model is the most widely used model [24,30,31,32]. After constructing the ecological security pattern, researchers often optimized it by combining landscape indices, circuit theory, or distribution characteristics. For example, Ma et al. showed that urban ecological security patterns have significant relationships with landscape indices, such as size, shape, quantity, type, and spatial configuration, and that the regulation of landscape indices can improve regional ecosystems [33]. Peng et al. identified key points in ecological corridors in Yunnan Province using circuit theory and optimized ecological security patterns through the protection or restoration of ecological key points [34]. Hu et al. constructed the ecological security pattern of Pearl River Delta and classified priority identification according to the differences in its distribution [35]. These studies have important significance for maintaining ecological security and ensuring sustainable urban development, but they ignore the impact of human disturbance on ecological security patterns.
Human activities are the most significant factors affecting ecology [36]. The ecological security pattern combined with the human disturbance factors can accurately determine the location and scale of ecological repair, which has a guiding significance for the improvement of regional ecology. At present, most studies consider human disturbance factors in ecological corridors, such as ecological barrier points and break points. Huang et al. identified ecological barrier points in Jinan City based on circuit theory and ecological security patterns and proposed a conservation strategy [22]. Fan et al. used the same approach to identify ecological barrier points in Wuhan City and proposed an optimization strategy [37]. Lv et al. identified ecological barrier points and “pinch” points in Chongqing City, and determined ecological restoration strategies based on the location of key points [38]. Tang et al. identified the ecological corridor break points of the Huai yang Grand Canal by the MSPA method, and identified the breaks as the key ecological restoration areas [39]; Xu et al. identified the change patterns of ecological break points in Beijing through landscape connectivity and proposed ecological planning strategies [40]. Researchers mostly focus on identifying the obstacles and fracture points in ecological corridors and the restoration of these points to improve biological flow and enhance overall ecological stability. However, such studies lack the assessment of human disturbance factors of ecological sources and nodes. The overall human disturbance assessment of the study area can effectively identify the degree of disturbance in ecological sources, corridors, and nodes. Therefore, this method can systematically identify priority areas of the overall ecological security patterns and facilitate subsequent specific policy formulation.
In summary, the systematic restoration of ecology is a key issue in today’s academic community, and the combination of ecological security patterns and human disturbance factors to determine ecological priority areas has clear advantages. Therefore, this paper takes Fuzhou City as a case study, constructs its ecological security pattern and anthropogenic disturbance assessment, and determines ecological priority areas using a combination of the two factors. This paper provides theoretical support for future ecological restoration practices.
2. Study Area and Data Sources
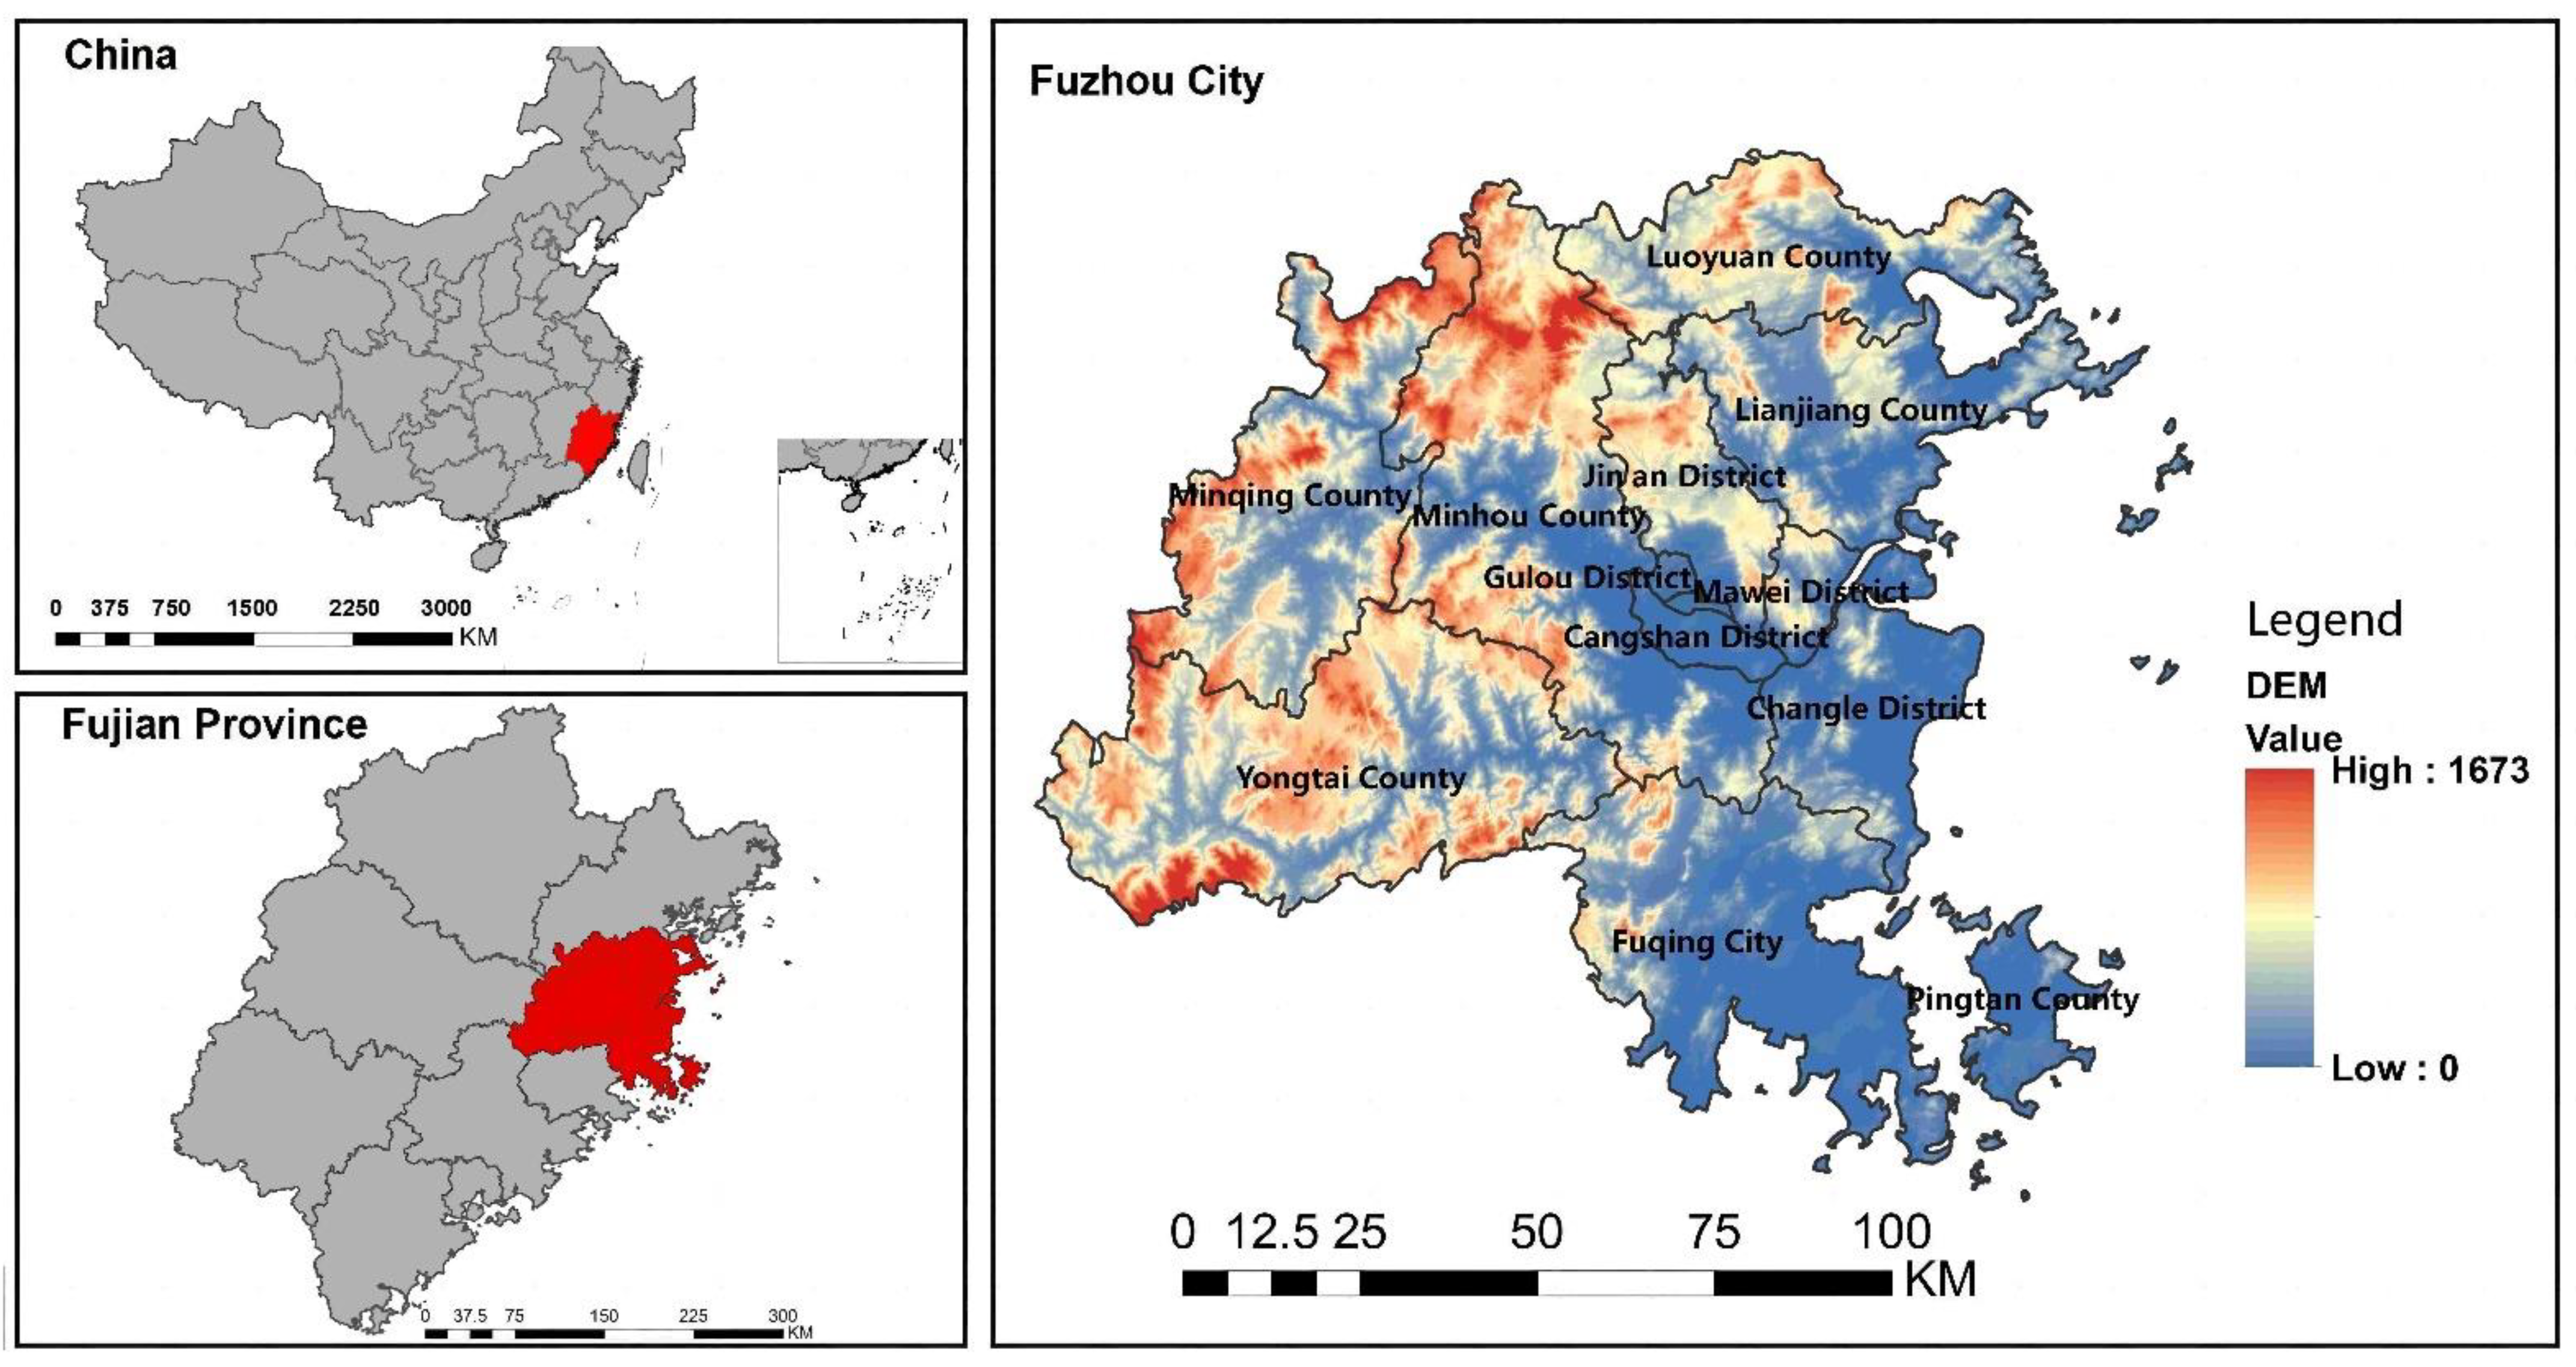
2.1. Study Area
Fuzhou City is the capital of Fujian Province, located in the southeastern coastal region of China, with a geographical location of 25°15′–26°39′ N and 118°08′–120°31′ E. It covers 13 administrative districts—Gulou District, Taijiang District, Cangshan District, Jinan District, Mawei District, Changle District, Minhou County, Lianjiang County, Luoyuan County, Minqing County, Yongtai County, Pingtan County, and Fuqing City—and has a total area of 11,968 km2. It is an important cultural, political and economic hub on the southeastern coast of China, as well as an important port of commerce for the whole country. Fuzhou is a typical estuarine basin, surrounded by mountains on three sides and facing the sea on one side. It is a coastal city with 72.68% of its district covered by mountainous areas, and these geographical factors mean that its land use is compact. Over the past 10 years, Fuzhou has experienced a significant increase in population and urbanization [41,42]. The growing human disturbance poses a serious threat to the ecological environment. In 2022, Fuzhou’s 14th Five-Year Plan for Ecological Protection reported that the management and restoration of Fuzhou’s ecology lacks systematicity. Its ecological problems remain serious, and there is an urgent need to propose and implement practical and effective ecological restoration strategies (see Figure 1).
Figure 1.
Study area.
2.2. Data Sources
(1) The 2020 land-use data encompass 10 land-use types: cultivated land, woodland, grassland, shrubland, wetland, water body, tundra, artificial surfaces, bare land, glaciers, and permanent snow (http://www.globallandcover.com/ (accessed on 1 June 2020)). (2) GDEMV3 30M resolution digital elevation data were mostly used to obtain slope and topographic relief factors (http://www.gscloud.cn/ (accessed on 3 June 2020)). (3) Landsat 8 OLI_TIRS satellite digital products were obtained for vegetation cover in the study area (http://www.gscloud.cn/ (accessed on 12 June 2020)). (4) Road network data were obtained from the Open Street Map platform, which mainly includes road and rail vector data and is mostly used for the analysis of road network density (https://www.openstreetmap.org (accessed on 13 June 2020)). (5) Population density data sources for 2020 were assessed at the following link (https://www.worldpop.org (accessed on 23 June 2020)), and (6) POI data were sourced from Baidu Map (https://map.baidu.com/ (accessed on 27 June 2020)). (7) NPP-VIIRS night light data were collected from National Oceanic and Atmospheric Administration (https://eogdata.mines.edu/products/vnl/ (accessed on 1 January 2021)). The relevant calculations were performed by processing the data accordingly with 30 × 30 m precision raster data.
3. Research Methodology
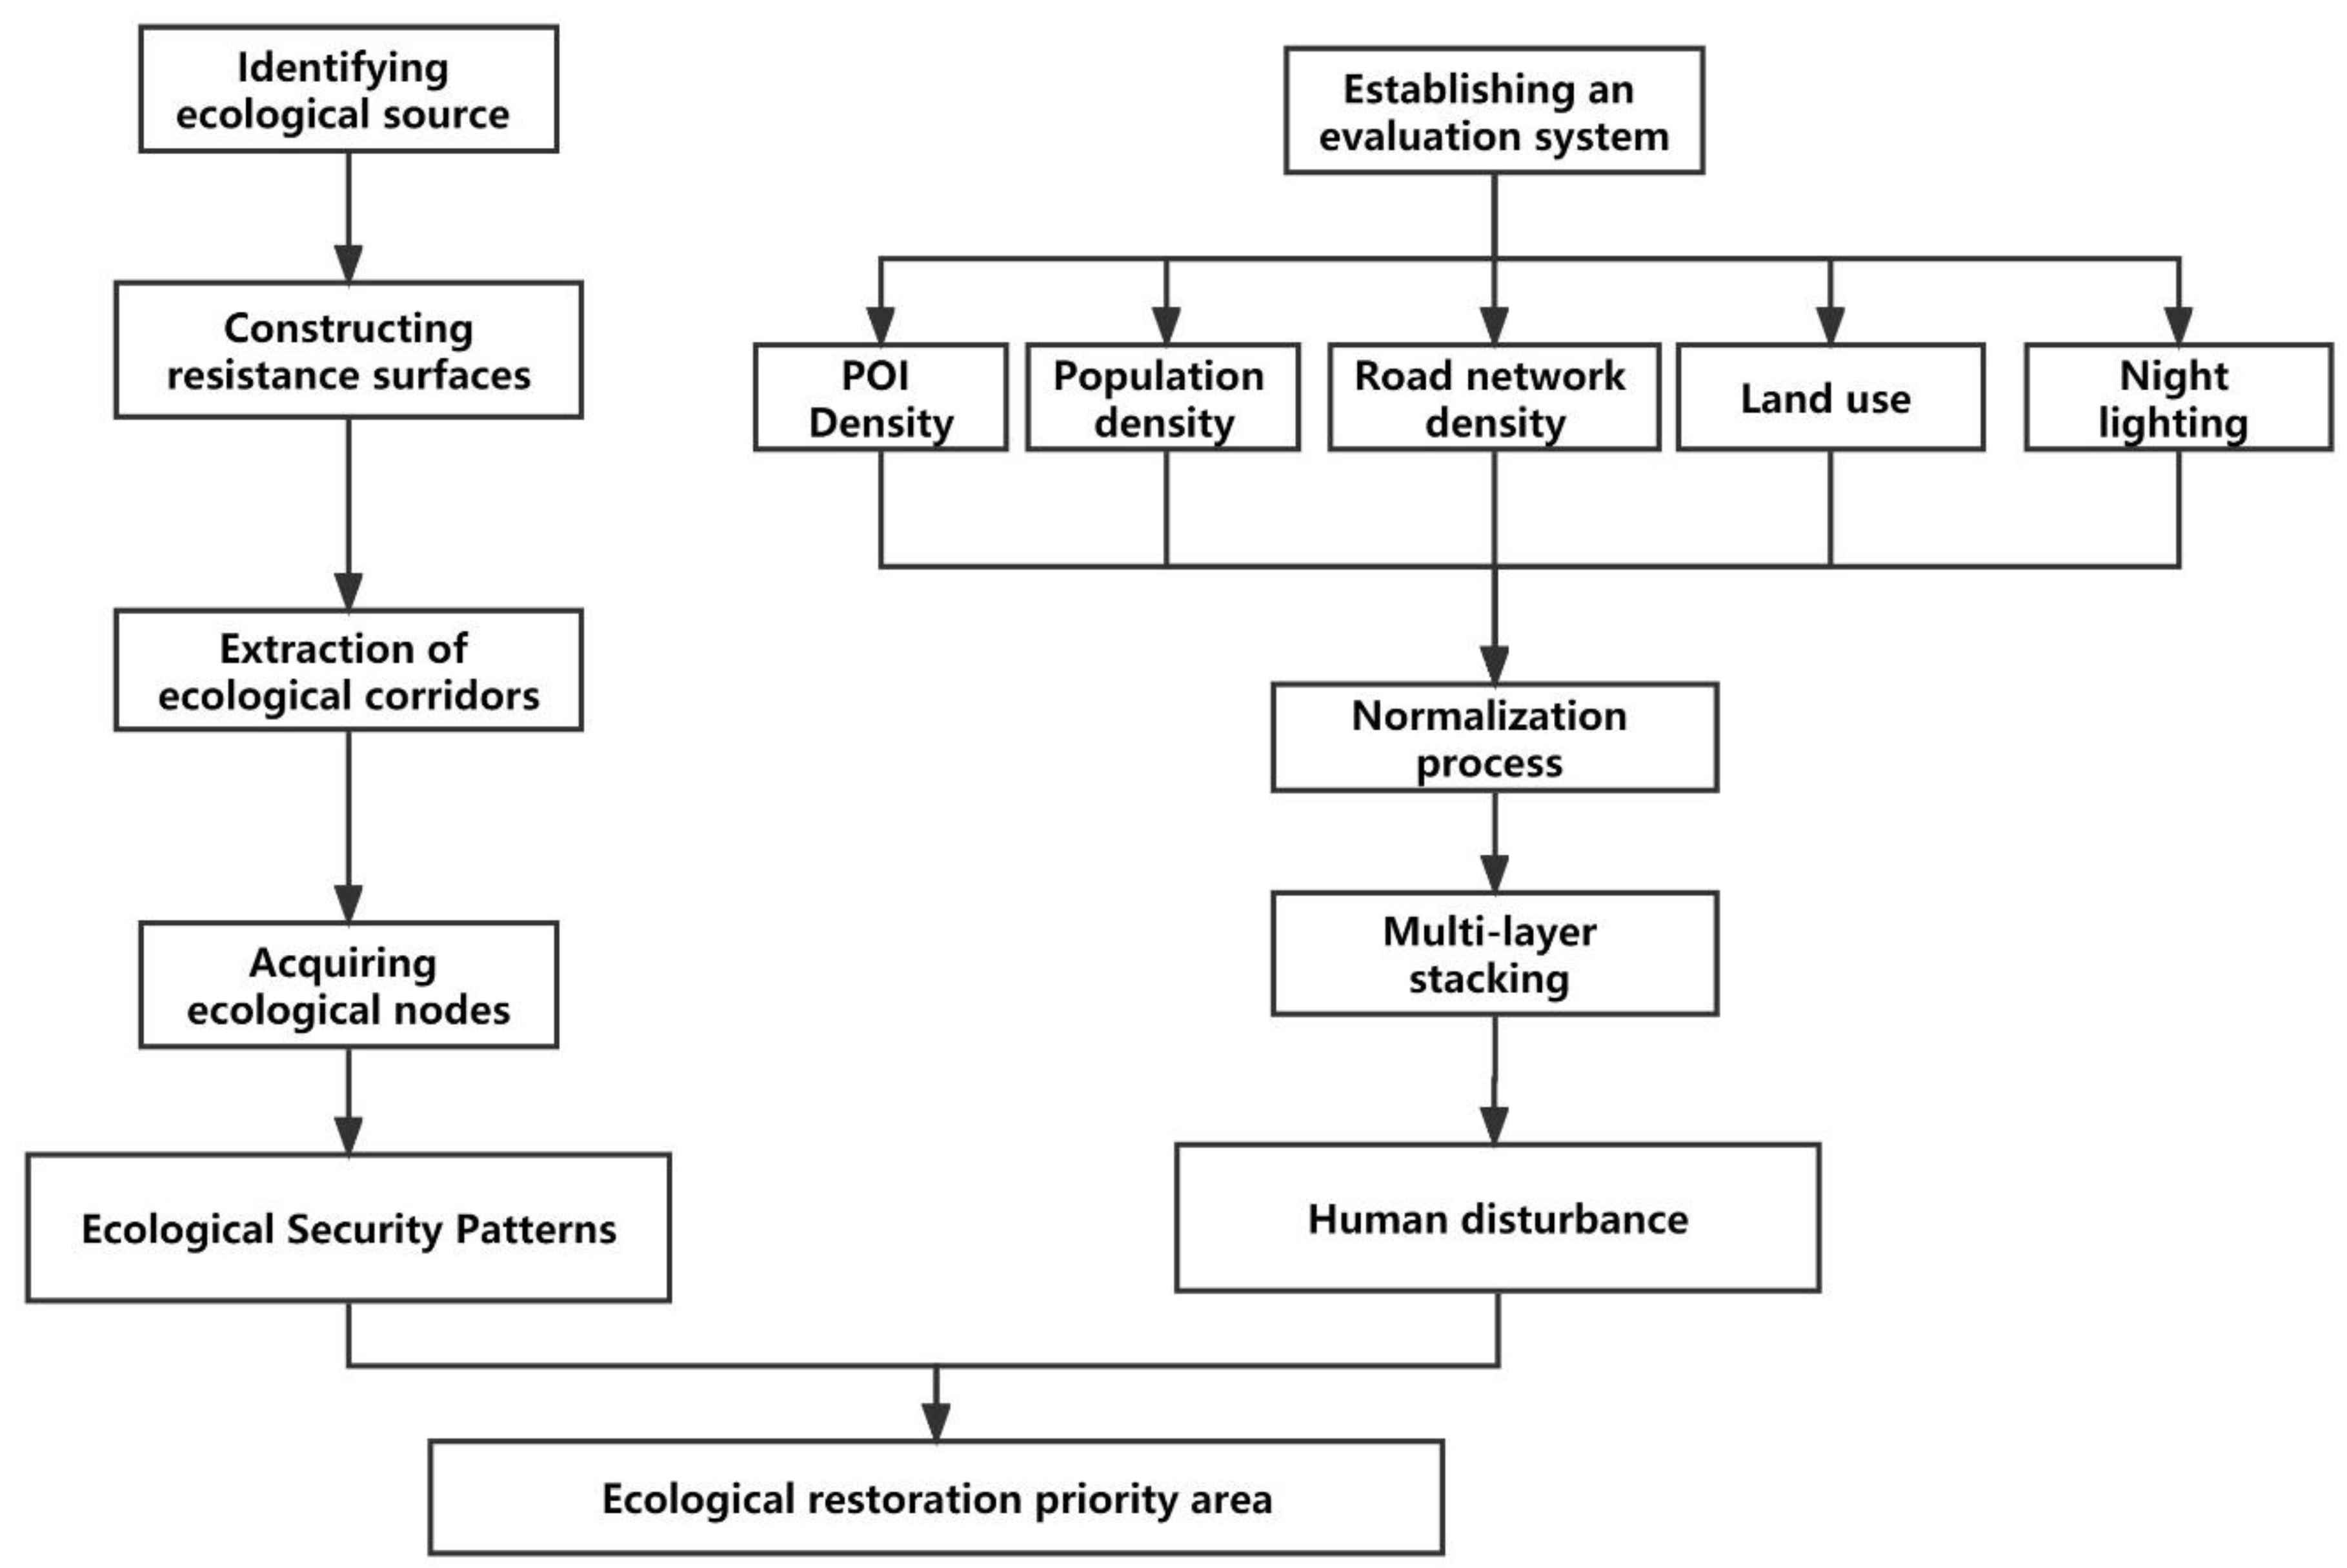
3.1. Research Framework
As shown in Figure 2, the research framework can be divided into three main parts. (1) The ecological source was identified through MSPA, the resistance surface was constructed, the ecological corridor was determined via the MCR model combined with the resistance surface, and the ecological pinch point was confirmed via circuit theory and used as an ecological node. In this way, the ecological security pattern of a source–corridor–node region was constructed. (2) The human disturbance evaluation model was established; POI density, population density, road network density, land use and night lighting were taken as the influence factors; and the factors were standardized and superimposed to obtain the human disturbance evaluation distribution map. (3) Through a comprehensive analysis of the ecological security pattern and human disturbance, the priority restoration areas of ecological sources, ecological corridors, and ecological nodes were determined.
Figure 2.
Research framework.
3.2. Ecological Security Pattern
3.2.1. Ecological Source Identification
MSPA is a mathematical morphology-based classification processing method [43]. It is based on mathematical morphological principles, such as erosion and expansion [43,44,45], and divides binary raster images into seven elements based on the Euclidean distance threshold between raster cells (Table 1). Among these elements, the core can provide a larger habitat for species and has an important ecological significance, and it has been widely used in the study of landscape ecology as an ecological source. In this study, woodlands with good ecological service functions were used as the “foreground” and remaining land was used as the “background” for analysis. The 30 × 30 m raster map of land-use types was converted into a binary image of foreground and background by ArcGIS, and then processed into seven landscape elements by the Guidos Toolbox software [46]. The probability index of connectivity (dPC) indicates the ability of ecological patches to maintain ecological patterns and has been widely used for source identification. With reference to related studies, cores above 100 hm2 were selected in this study to calculate their dPC, the distance threshold was set as 1500 m and the connectivity probability was 0.5. The cores with dPC > 1 were selected as ecological sources [47].
Table 1.
Landscape types of MSPA and their meanings.
3.2.2. Ecological Corridor Identification
Indicator species are important indicators of the biodiversity, integrity and ecological quality of an area. Changes in their habitat conditions can produce dramatic responses. With reference to related studies, vulpes was selected as an indicator species in this study [48,49]. Ecological networks were constructed by simulating their migration paths. Ecological corridors are low-resistance pathways between ecological sources that can facilitate the movement of biological flows between ecological sources. The MCR model was proposed by Knaapen et al. [50]. It is now widely used in urban planning and ecological security pattern construction due to its good practicality and scalability. The model identifies the lowest resistance path between two sites as an ecological corridor by calculating the resistance to be overcome between the source and its destination, using the following equation:
where MCR is the minimum cumulative resistance value , which represents the spatial distance of species from the ecological source to landscape unit i; indicates the landscape unit’s resistance coefficient to species’ migration. f denotes the positive correlation between the minimum cumulative resistance and ecological processes. Traditional resistance surfaces are constructed by simulating ecological resistance based on the land-use characteristics of patches. In order to assess resistance more accurately, this paper draws on relevant studies [44,51,52,53,54] to incorporate parameters, such as land use, slope, topographic relief, and NDVI, and obtains their weights using the AHP method (Table 2).
Table 2.
Resistance factors and classification.
3.2.3. Ecological Node Identification
Linkage Mapper Tools was developed by Brad McRae’s team of senior landscape ecologists at The Nature Conservancy and has been widely used in ecological conservation planning. Linkage Mapper Tools is a collection of commonly used ecological analysis tools [55,56]. The Pinchpoint Mapper Tool has been widely used to identify ecological corridor nodes.
3.3. Human Disturbance Evaluation
3.3.1. Human Disturbance Evaluation Model
Based on previous studies, eight indicators were initially selected: building density, distances from road, integration, POI density, road network density, population density, land use, and night lighting [57,58,59]. By distributing questionnaires to experts, five representative indicator tables were created (Table 3). As shown in Table 3, the evaluation model was constructed through Yaahp, and questionnaires were again distributed to 30 experts in urban planning, landscape ecology and landscape architecture, and the average weights obtained from the 30 questionnaires were used as the weights of each factor for this study (Table 3). Finally, it is difficult to perform stacking calculations because of the different attributes of the indicator factors. To facilitate the calculation, we normalized each indicator to “0–1” by using the raster calculator in ArcGIS.
Table 3.
Human disturbance factor weights.
3.3.2. Human Disturbance Evaluation
The obtained data were processed using ArcGIS, and finally calculated using a multi-factor superposition analysis. The calculation formula is as follows [60,61]:
where is the human disturbance evaluation score; is the total number of evaluation factors; represents the different evaluation factors; is the single-factor weight; and is the factor standardization score.
3.3.3. Human Disturbance Classification
Natural breakpoint classification methods use statistical Jenk optimization methods to obtain boundary points that minimize the sum of internal variances at each level [62]. The natural breakpoint classification method distinguishes the classification intervals based on the natural grouping inherent in the data to maximize the variance between the different categories [63]. This method has been widely applied to related studies [64,65]. After obtaining the human disturbance evaluation, its scores of ecological source sites, ecological corridors and ecological nodes were obtained by the mask extraction tool in ArcGIS. Then, we used the natural breakpoint method to classify the extracted human disturbance scores into classes I (extremely high), II (high), III (medium), IV (low), and V (very low).
4. Research Results
4.1. Ecological Security Pattern
4.1.1. Ecological Source Identification
The types of landscape patterns were identified based on MSPA (Figure 3). As shown in Figure 3, the core was used as the basis for selecting ecological sources. The dPC of cores over 100 hm2 was analyzed using the Conefor2.6 software, and parts of dPC ≥ 1 were selected as the sources for this study (Figure 4). As shown in Figure 4, there were 40 ecological sources with a combined area of 4556.48 km2, accounting for 81.76% of the core area. The distribution of ecological sources in Fuzhou city had a less central and more peripheral distribution, were less coastal, and more inland. As shown in Table 4, the largest ecological sources were in Yongtai, Minhou, and Minqing counties, which are at the inland edge of the study area. These are followed by Lianjiang, Luoyuan County, and Fuqing City, which are located in the coastal fringe area of the study range. The smallest areas were Jin’an District, Changle District and Mawei District, which were distributed in the coastal or closer to the urban center. This distribution characteristic is closely related to the geographical conditions of Fuzhou. Fuzhou is a mountainous city, and its mountainous areas gradually become less distributed when moving from inland to the sea. These less mountainous areas are suitable for construction, and thus gradually form human settlements, while the more mountainous areas are mostly forested and continue to form the habitats for many animals.
Figure 3.
MSPA landscape pattern.
Figure 4.
Ecological sources.
Table 4.
Ecological sources area statistics.
4.1.2. Ecological Corridor Identification
- Comprehensive Resistance Surface Construction
According to Table 3, all kinds of factors were processed to obtain various types of factors of resistance surfaces (Figure 5). There are more construction sites in the urban center and coastal regions of the study area, and the factors showed higher resistance scores in these areas (Figure 5a). Topographic relief affects the migration of animals, and the greater the topographic relief, the greater the resistance to migration. The topographic relief was higher in the interior of the study area and outside urban centers (Figure 5b). The slope has an important influence on animal migration. The higher the NDVI, the lower the migration resistance, and the lower the vegetation cover in the urban center and coastal areas of the study area, the higher the resistance (Figure 5d). Integrated resistance values were obtained by superimposing Equation (2) (Figure 6). These integrated resistance values ranged from 1 to 8.64, and the high-scoring areas were continuously distributed over a large area in urban centers and coastal areas, and sporadically distributed inland.
Figure 5.
Single-factor resistance surface: (a) land use, (b) topographic relief, (c) slope, and (d) NDVI.
Figure 6.
Comprehensive resistance.
- 2.
- Ecological Corridor Identification
The cumulative cost distance distribution map was obtained using Equation (1) (Figure 7). The cumulative cost distance achieved its maximum score in the coastal area of Fuqing, followed by a higher resistance in the urban center area of the Cangshan District, and the overall cumulative cost was smaller in other areas. On this basis, ecological corridors in the study area were identified (Figure 8). Due to the large and compact distribution of ecological sources in this region, several shorter corridors formed. On the contrary, coastal and urban center areas had fewer ecological sources and larger ecological source distances; therefore, a small number of longer corridors were formed. There were 83 corridors with a total of 179.33 km. The lengths of ecological corridors in Minqing County, Minhou County, Yongtai County, and Changle City were greater than 20 km, followed by Fuqing City, Luoyuan County, Lianjiang County, Mawei District and Cangshan District, which had corridors of 5–20 km. The lowest number of corridors was found in Jinan District, Gulou District, Taijiang District and Pingtan County, with length between 0 and 1.7 km (Table 5).
Figure 7.
Cumulative cost distance.
Figure 8.
Ecological corridor.
Table 5.
Ecological corridor length statistics.
4.1.3. Ecological Node Identification
The pinch point currents of the study area were analyzed by Linkage Mapper Tools (Figure 9). The high scoring areas of the pinch point currents were mainly distributed at the edges of the study area. The current distribution map was graded by the natural segment point method, and it was divided into classes: I (extremely high), II (high), III (medium), IV (low), and V (very low). The areas with a high rank have higher importance, and the class I areas with pinch point currents are considered ecological nodes (Figure 10). As shown in Table 6, there were 30 ecological nodes, which were distributed in seven administrative regions of the study area, and the regions where the highest number of nodes were found, in descending order, are as follows: Luoyuan County, Minqing County, Fuqing City, Minhou County, Yongtai County, Lianjiang County, and Changle District. These nodes are stepping stones within the whole ecological pattern and are important for the ecological stability of the study area.
Figure 9.
Pinch point current.
Figure 10.
Ecological nodes.
Table 6.
Ecological node statistics.
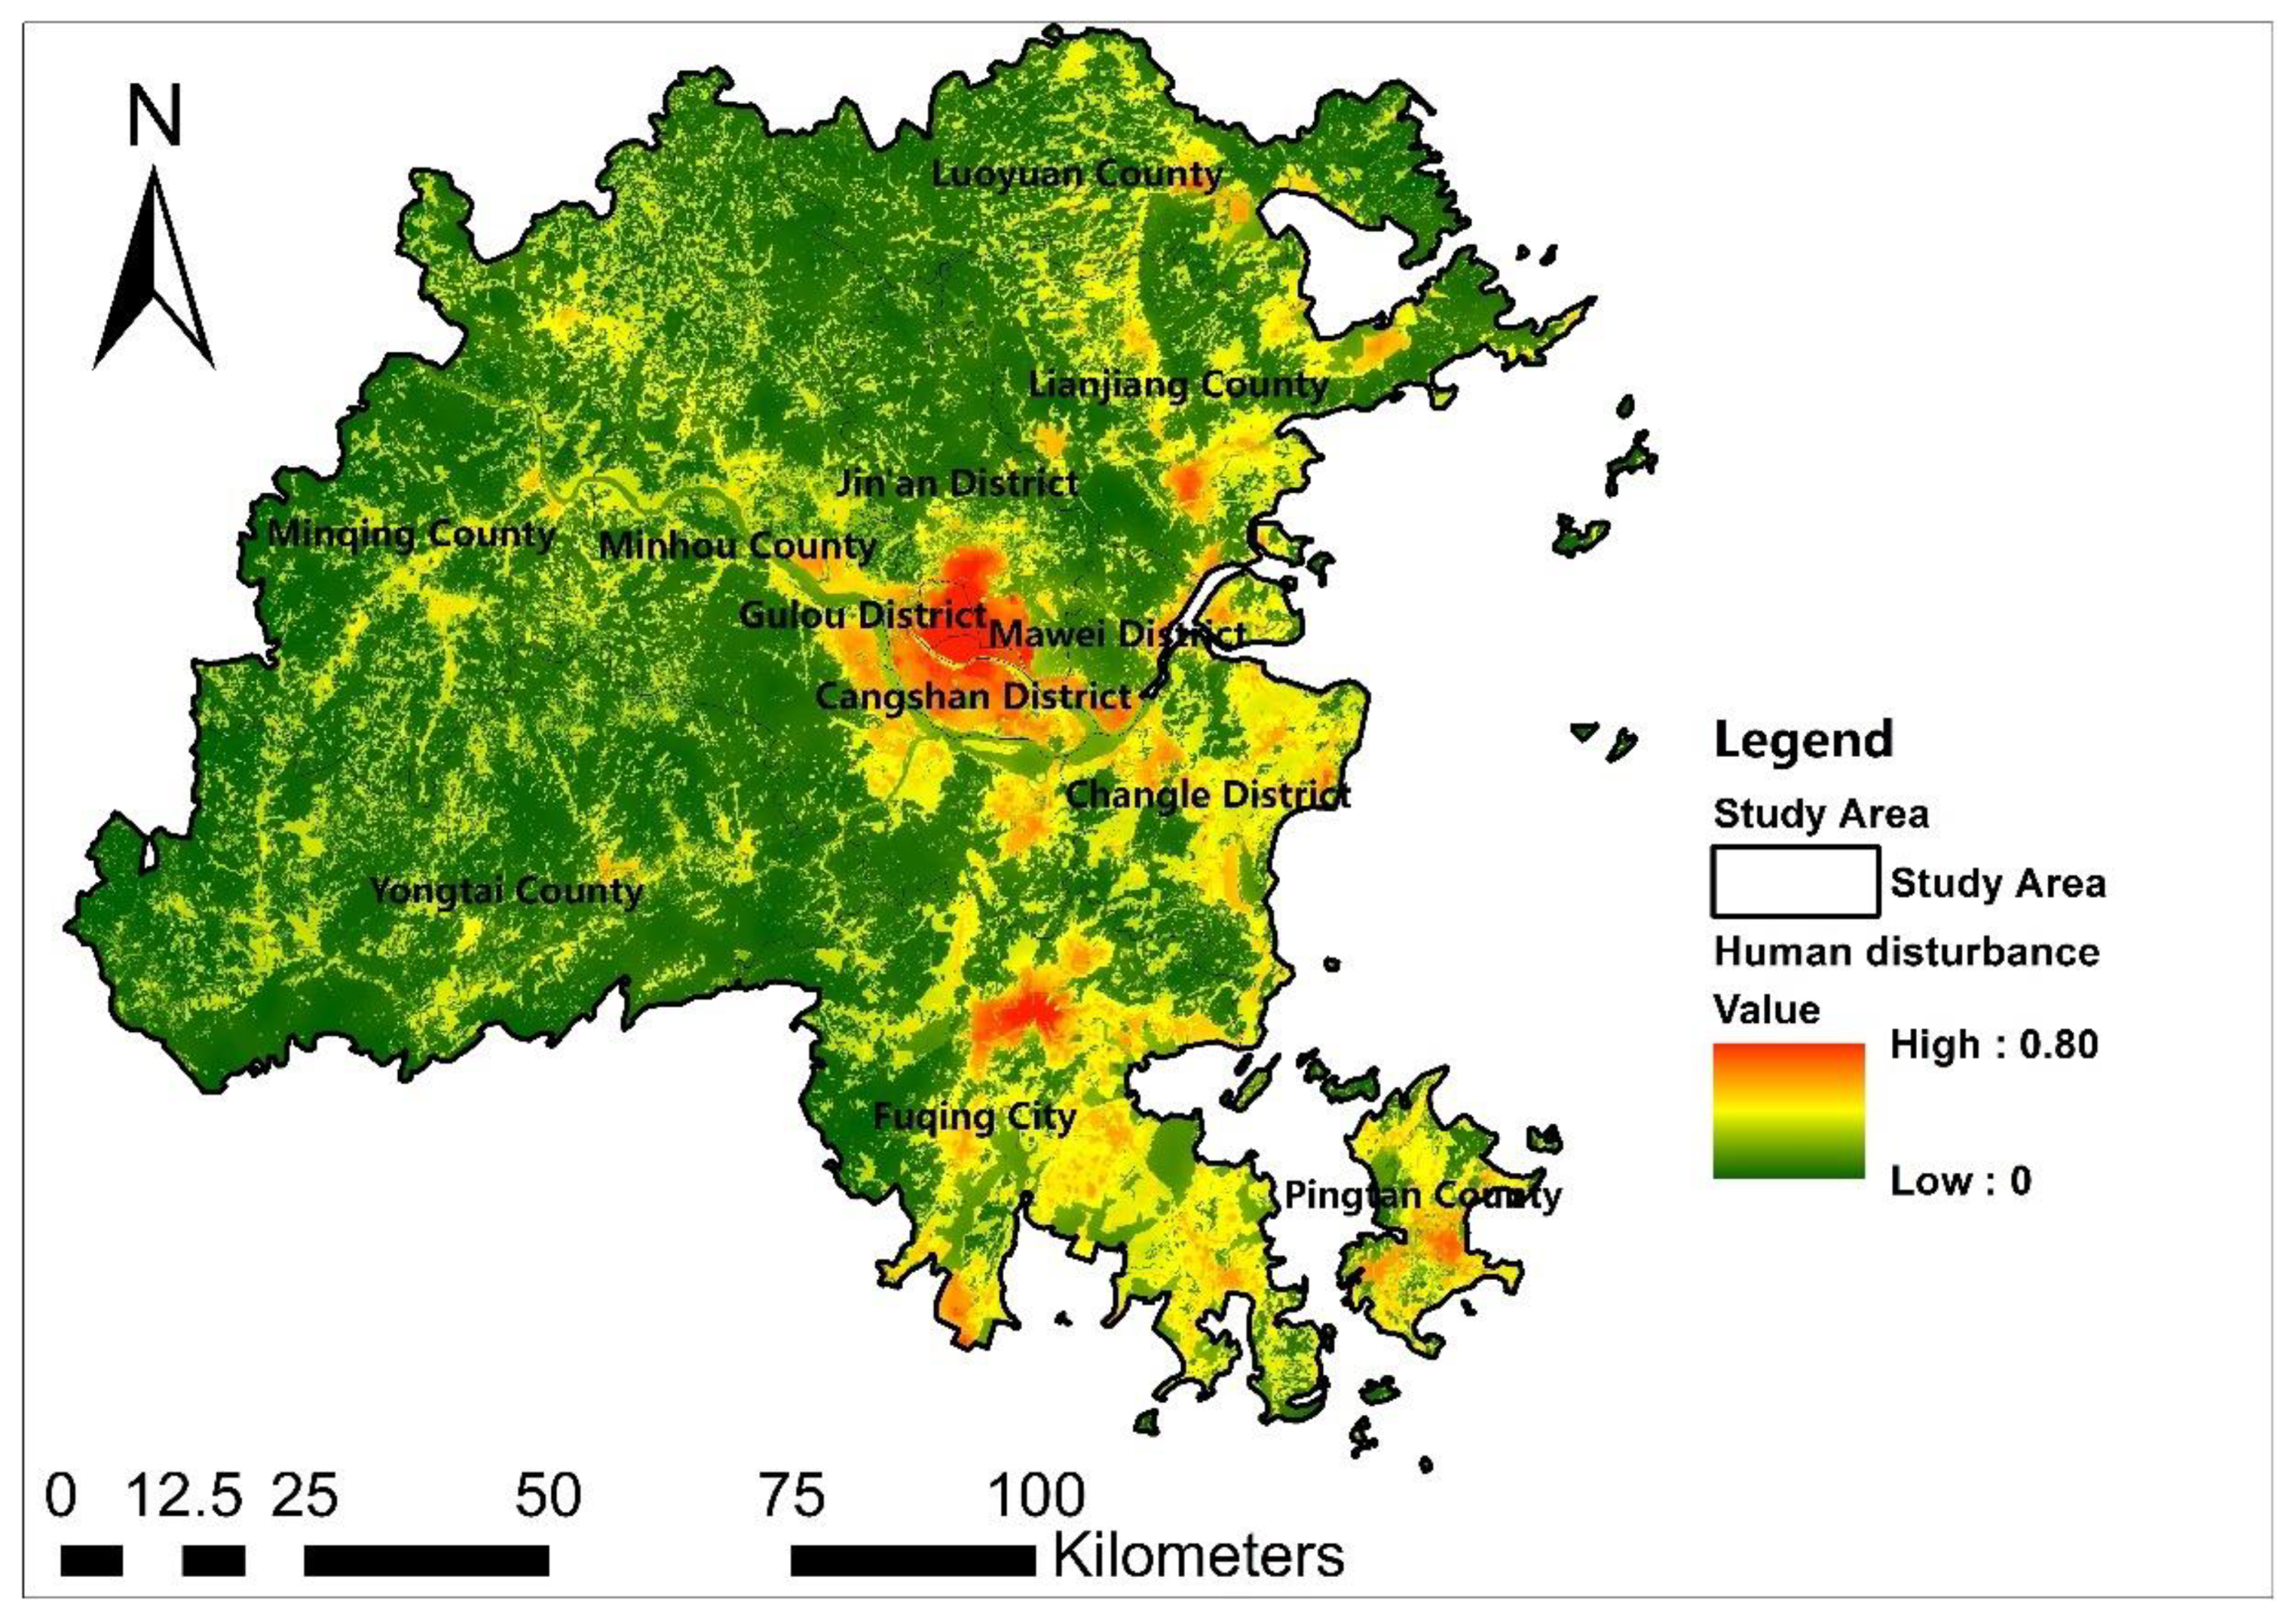
4.2. Human Disturbance Assessment Results
Based on the established human disturbance evaluation model, the corresponding factors were processed (Figure 11). POI density was high in Gulou District and Kurashan District, and the rest of its regional density was low (Figure 11a). Land-use scores were higher in the areas centered on Gulou and Changshan and in coastal areas (Figure 11b). Night light had the highest score in Cangshan District, Gulou District, and Fuqing City. The next highest night light scores were recorded in the coastal area of Changle District (Figure 11c). The population density of the study area is mainly concentrated in Cangshan District, Gulou District, and Fuqing City (Figure 11d). The road network density was highest in and around Gulou District and in the central area of Fuqing City (Figure 11e). The human disturbance assessment was obtained via superimposition, according to Equation (2) (Figure 12). As shown in Figure 12, the human disturbance degree scores in the study area ranged from 0 to 0.8. The degree of human disturbance formed two large major cores of human disturbance in Cangshan District, Gulou District, and Fuqing City, followed by four subcores in Luoyuan County, Lianjiang County, and Pingtan County. A large number of contiguous areas with a high degree of human disturbance formed in the coastal area, while other areas had a low degree of human disturbance. Fuzhou is a mountainous and coastal city, and the suitability of urban centers for construction is high, thus forming a human concentration. Fishing and shipping are important trade formations in Fuzhou, and these trades attract human concentration, thus forming a large contiguous human disturbance area in the coastal area.
Figure 11.
Human disturbance factor: (a) POI density, (b) land use, (c) night light, (d) population density, and (e) road network density.
Figure 12.
Human disturbance.
4.3. Ecological Restoration Priority Areas
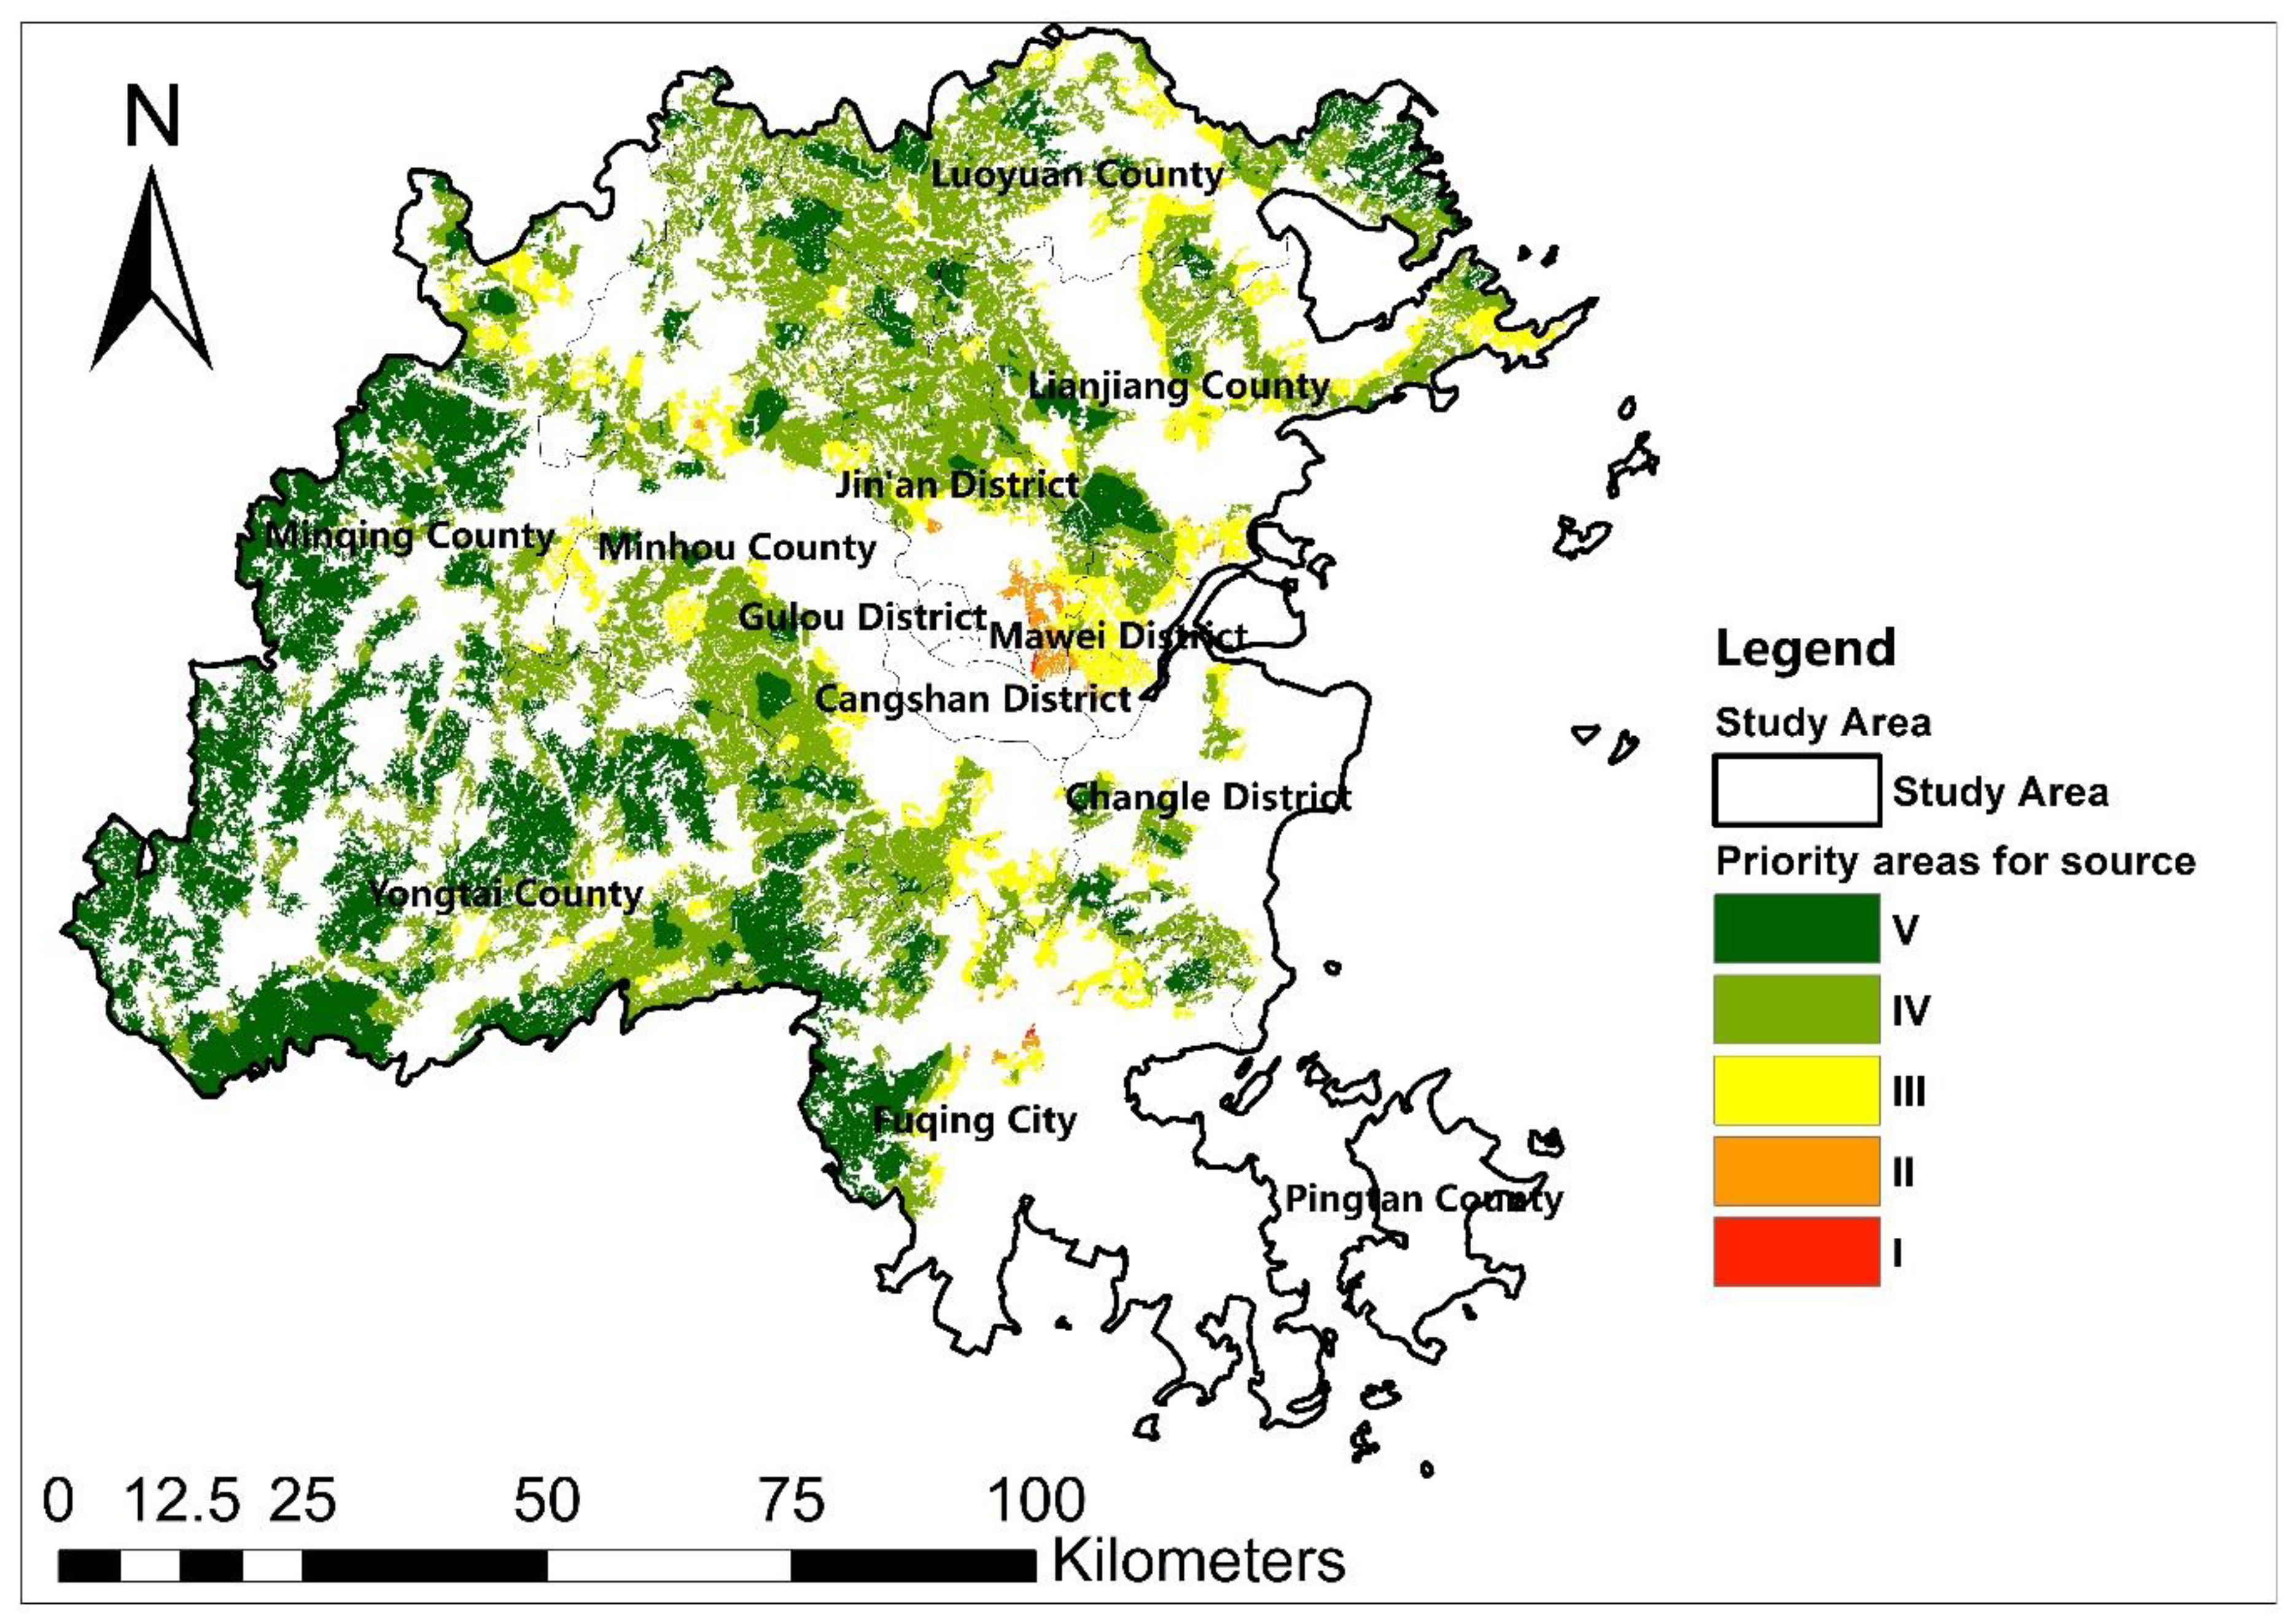
4.3.1. Ecological Source Priority Area Identification
As shown in Figure 13, the human disturbance values in the ecological source area were extracted and divided into classes I (extremely high), II (high), III (medium), IV (low), and V (very low) by the natural breakpoint method. The high-grade priority areas in the study area were distributed at the edges of the ecological source areas, and two high-grade aggregation areas formed in Fuqing City and Jinan District. The statistics of the area of ecological sources with different grades of human disturbance are shown in Table 7. The table shows that the degree of human disturbance to ecological sources ranged from 0 to 0.42, which was generally small compared to the maximum value of human disturbance of 0.8. The I priority area had an area of 15.17 km2 and was mainly distributed in Minhou County, Jin’an District, Yongtai County, Minqing County, Luoyuan County, Fuqing City and Lianjiang County. The II priority area had an area of 55.32 km2, mainly in Jin’an District, whose area was 26.34 km2, accounting for 47.61% of the overall class II priority area, while remaining areas had smaller differences, ranging from 0 to 6.6 km2. The III priority area had an area of 545.10 km2, among which, Minhou and Lianjiang counties had the largest area; the total area of these two counties accounted for 46.71% of the whole priority area. Other areas were distributed between 19.67 and 58.39 km2. Priority areas I, II and III are subject to strong human disturbance, and the intensification of human activities leads to ecological degradation in these areas (Table 7).
Figure 13.
Priority restoration areas for ecological sources.
Table 7.
Area statistics of priority restoration areas for ecological sources.
4.3.2. Ecological Corridor Priority Area Identification
As shown in Figure 14, the human disturbance values of the ecological corridor areas were extracted and divided into the following classes using the natural breakpoint method: I (extremely high), II (high), III (medium), IV (low), and V (very low). Class I and II priority areas were mostly found in the longer corridors, such as Fuqing City and Cangshan District near the coastal or urban centers, and the III priority areas were mainly distributed in the corridors near the inland (Figure 14). The priority areas of different levels of corridors were counted, and their scores ranged from 0 to 0.56. The class I corridor priority restoration areas totaled 4.09 km and appeared in four districts, and the average length of corridors in Fuqing City was 3.92 km, accounting for 95.84% of the main protected area. The II corridor priority restoration area had a total length of 19.9 km, covering 10 districts and counties, mainly in Fuqing City and Changle City, both of which accounted for 49.30% of its length. This was followed by Changshan District, Mawei District and Luoyuan County, with the length of these three regions accounting for 47.00%, while other areas were less distributed. The total length of the III corridor priority restoration area was 46.85 km, and was mainly distributed in Minhou and Minqing, both of which had a total length of 24.2 km, accounting for 51.65% of the whole region. This was followed by Changle District, Yongtai County, Luoyuan County, and Fuqing City. These areas had length values between 3.32 and 6.66 km, and the remaining areas did not exceed 2 km (Table 8).
Figure 14.
Ecological corridor priority restoration areas.
Table 8.
Length statistics of priority ecological corridor restoration areas.
4.3.3. Ecological Node Priority Area Identification
As shown in Figure 15, the human disturbance values of the ecological corridor area were extracted and divided into classes I (extremely high), II (high), III (medium), IV (low), and V (very low) using the natural breakpoint method. The nodes with higher grades were mainly distributed in the northeast, southeast, northwest and southwest regions of the study area. As shown in Table 9, the human disturbance degree scores of the nodes ranged from 0.01 to 0.27, among which six priority nodes of grade I were distributed in Fuqing City, Minqing County, Lianjiang County and Yongtai County. There were four level II priority restoration nodes distributed in Luoyuan County, Fuqing City, and Yongtai County, and there were six level III priority restoration nodes distributed in Luoyuan County, Yongtai County, Changle District, Lianjiang County, and Minqing County.
Figure 15.
Ecological node priority restoration areas.
Table 9.
Ecological node priority restoration area statistics.
4.4. Ecological Security Pattern Key Restoration Area
4.4.1. Ecological Source Key Restoration Area
Ecological sources are important areas for animals to survive and breed. Due to the continuous outward expansion of the city, ecological sources form highly zoned aggregations at the edges in contact with built-up areas of the city (Figure 13). These areas are subject to a high degree of human disturbance and first need to be assessed for ecology and then protected and restored. At the same time, for subsequent development and construction, these areas should be subject to low development intensity and less ecological disturbances. The first three levels of priority areas are areas that need priority protection, and thus these areas were counted (Table 10). The areas most in need of priority restoration were Minhou County and Lianjiang County, both of which had an area of more than 100 km2; followed by Jinan District, Luoyuan County, Fuqing City and Mawei District, which had priority areas of 50–70 km2; and finally, Minqing County, Yongtai County and Changle District, which had priority areas of between 20 and 50 km2.
Table 10.
Class I–III ecological sources priority restoration area statistics.
4.4.2. Ecological Corridor Key Restoration Areas
Ecological corridors are important paths for animal migration, and their connectivity is essential for securing the migration of biological flows. The first three levels were counted, and the total length was 70.9 km. Minhou County, Fuqing City, Minqing County and Changle City were the areas that required the most attention, and the lengths of corridors with serious anthropogenic disturbances in these areas were more than 10 km. Luoyuan County and Yongtai County also required attention, and the length of human-disturbed corridors in these areas was 5–10 km. Finally, Yongtai County, Changshan District, Mawei District, Lianjiang County and Jinan District required the least attention, and the lengths of human disturbance corridors in these areas were 1–5 km (Table 11). For these areas, ecological diagnosis should be developed first, and ecological barriers to the ecological corridor should be removed to ensure normal ecological flows.
Table 11.
Class I–III ecological corridor length statistics.
4.4.3. Ecological Nodes Key Restoration Areas
Ecological nodes are ecological stepping stones that play an important role in ensuring the connectivity of ecological corridors and preventing ecological degradation. Statistics on the first three levels of strong human disturbance show that four nodes were affected in Luoyuan County and Yongtai County, three nodes with large human disturbance factors in Fuqing City and Minqing County, two nodes in Lianjiang County, and one node in Changle District (Table 12). For these important nodes, protection efforts should be strengthened, and different protection strategies should be proposed according to the node land use.
Table 12.
Class I–III ecological nodes priority restoration area statistics.
5. Discussion
5.1. Comparison with Other Studies
Ecological restoration has been the focus of academic research. Initially, researchers assessed the ecological sensitivity [66,67], ecological risk [68], ecological suitability [69,70] or ecological quality [71] of the area, and then classified the ecological status of the study area in a hierarchy, and proposed priority restoration solutions based on the results of the classification. These studies tend to place more emphasis on the ecological state of the land. Compared with the above studies, the ecological security pattern is more flexible and can take into account not only the ecological status of the land but also the ecological flow [72]. In the meantime, due to the richness of the elements of the ecological security pattern, researchers can start to restore the area through ecological sources, ecological corridors, and ecological nodes. For example, An et al. constructed an ecological security pattern in eastern Menghai County and proposed to improve the ecological connectivity by adding ecological stepping stones [17]. Wang et al. constructed a security pattern in Shenzhen to optimize the regional ecological network by increasing the area of ecological sources [73]. Guo et al. constructed the ecological security pattern of Harbin and proposed an optimal scheme of “four belts, four districts, one axis, nine corridors and multi-centers” according to its distribution characteristics [74]. These studies focus on systematically optimizing urban ecology by adjusting some components of the ecological security pattern. These studies are vital to ensuring the ecological security of urban areas but fail to consider larger regions. The present study precisely classifies the priority restoration areas of ecological sources, corridors, and nodes through a comprehensive analysis of ecological security patterns and human disturbances, and this can be beneficial for an ecological restoration assessment.
5.2. Ecological Development Strategy of Fuzhou City
Urbanization and population growth inevitably lead to outward urban expansion, which can easily result in impacts on ecological security patterns. Unlike inland plains cities, Fuzhou is a mountainous coastal city, and its urban periphery is mostly composed of ecological land and lacks buildable land for outward expansion. Therefore, its mandatory outward expansion due to enhanced human activities is likely to disrupt the ecological security pattern and lead to ecological degradation. Ecological corridors are most seriously subject to human disturbance, so they should be restored first. The areas of ecological corridors with the strongest human disturbance can be surveyed, and ecological barriers can be removed by changing the path or piercing the holes according to the actual situation. The next area that should be restored is the ecological source. The areas with high human disturbance in the ecological source are mainly located at the edges of the built-up areas, which are caused by urban expansion. Later urban planners can prioritize the use of land resources in the built-up areas, and the government should advocate the renewal of the urban stock instead of always building new ones outwardly. The least disturbed by humans are ecological nodes. For ecological nodes, policy making can determine the type of ecological nodes through field investigation, and then propose protection mechanisms.
5.3. Deficiencies and Further Research Directions
Based on the perspective of human disturbance, the priority areas for ecological restoration can be understood more comprehensively, but there are some limitations to this study. (1) We used dPC to screen ecological sources, but the threshold value of dPC has not been determined by the academic community. Therefore, our study is based on previous studies with similar scales to determine values, which may have some errors. (2) The importance of ecological security patterns was not considered when the ecological priority area was determined in this study. The importance of ecological security patterns is also very important for the determination of ecological priority areas, which is the focus of this follow-up study.
6. Conclusions
Human disturbance is the most significant factor affecting ecological degradation. Studying the degree of human disturbance of sources, corridors and nodes in the ecological security pattern can precisely determine priority areas for restoration.
The study shows that there are 40 ecological sources in Fuzhou, with a total area of 4556.48 km2, showing fewer urban centers and coastal areas, and more inland and peripheral areas. There are 83 ecological corridors with a total area of 179.33 km, which are more frequently distributed and shorter in inland areas and more sparsely distributed and longer in the coastal areas. There are 30 ecological nodes, which are mainly distributed in the peripheral regions of the study area.
Meanwhile, the human disturbance degree score in the study area ranged from 0 to 0.8. The degree of human disturbance formed two large major cores of human disturbance in the Cangshan District, Gulou District, and Fuqing City, followed by four secondary cores in Luoyuan County, Lianjiang County, and Pingtan County. A large number of contiguous areas with a high degree of human disturbance formed in the coastal region.
Finally, the ecological priority restoration areas in Fuzhou were identified via a comprehensive analysis of ecological security patterns and human disturbances. The score of the degree of human disturbance to ecological sources ranged from 0 to 0.42, high-grade priority areas in the study area were distributed at the edges of ecological source sites, and two high-scoring aggregation areas formed in Fuqing City and Jinan District. The corridors have a high degree of human disturbance, with scores between 0 and 0.56. The I and II priority areas are mostly found in longer corridors such as Fuqing City and Cangshan District near the coast or urban centers, and the III priority areas are mainly distributed in the corridors near inland areas. The human disturbance degree scores of nodes ranged from 0.01 to 0.27, and the nodes with higher grades were mainly distributed in the northeast, southeast, northwest and southwest regions of the study area. In addition, we counted the areas where ecological sources, ecological corridors and ecological nodes were severely disturbed by human beings. Based on these results, areas of ecological priority for restoration and related development strategies were identified.
In this study, the ecological security pattern of Fuzhou city was constructed, and the degree of human disturbance in Fuzhou city was also assessed. The integrated ecological security pattern and the degree of human disturbance can effectively identify the priority restoration areas of ecological sources, corridors and nodes in Fuzhou. With the data from the above study, we can determine the priority of ecological restoration, the key restoration areas, and use them to develop a sustainable urban development strategy for the future.
Author Contributions
Conceptualization, H.P. and S.K.; methodology, H.P., S.K. and B.J.; software, S.K. and B.J.; validation, H.P., S.K. and B.J.; writing—original draft preparation, H.P., S.K. and B.J. All authors have read and agreed to the published version of the manuscript.
Funding
This research was funded by the Fuzhou Social Science Planning Major Project, grant number 2017FZA02.
Institutional Review Board Statement
The study did not require ethical approval.
Informed Consent Statement
Informed consent was obtained from all subjects involved in the study.
Data Availability Statement
The data presented in this study are available on request from the corresponding author. The data are not publicly available due to privacy.
Conflicts of Interest
The authors declare no conflict of interest.
References
- Newman, E.A. Disturbance ecology in the Anthropocene. Front. Ecol. Evol. 2019, 7, 147. [Google Scholar] [CrossRef]
- Gaynor, K.M.; Hojnowski, C.E.; Carter, N.H.; Brashares, J.S. The influence of human disturbance on wildlife nocturnality. Science 2018, 360, 1232–1235. [Google Scholar] [CrossRef] [PubMed]
- Beale, C.M. The behavioral ecology of disturbance responses. Int. J. Comp. Psychol. 2007, 20, 111–120. [Google Scholar] [CrossRef]
- Waltham, N.J.; Elliott, M.; Lee, S.Y.; Lovelock, C.; Duarte, C.M.; Buelow, C.; Simenstad, C.; Nagelkerken, I.; Claassens, L.; Wen, C.K. UN decade on ecosystem restoration 2021–2030—What chance for success in restoring coastal ecosystems? Front. Mar. Sci. 2020, 71, 1–5. [Google Scholar] [CrossRef]
- Lu, X.; Zhang, S.; Xing, J.; Wang, Y.; Chen, W.; Ding, D.; Wu, Y.; Wang, S.; Duan, L.; Hao, J. Progress of air pollution control in China and its challenges and opportunities in the ecological civilization era. Engineering 2020, 6, 1423–1431. [Google Scholar] [CrossRef]
- Wang, W.-H.; Wang, Y.; Sun, L.-Q.; Zheng, Y.-C.; Zhao, J.-C. Research and application status of ecological floating bed in eutrophic landscape water restoration. Sci. Total Environ. 2020, 704, 135434. [Google Scholar] [CrossRef]
- Molin, P.G.; Chazdon, R.; Frosini de Barros Ferraz, S.; Brancalion, P.H. A landscape approach for cost-effective large-scale forest restoration. J. Appl. Ecol. 2018, 55, 2767–2778. [Google Scholar] [CrossRef]
- Borrelli, P.; Alewell, C.; Alvarez, P.; Anache, J.A.A.; Baartman, J.; Ballabio, C.; Bezak, N.; Biddoccu, M.; Cerdà, A.; Chalise, D. Soil erosion modelling: A global review and statistical analysis. Sci. Total Environ. 2021, 780, 146494. [Google Scholar] [CrossRef]
- Wei, Z.; Hao, Z.; Li, X.; Guan, Z.; Cai, Y.; Liao, X. The effects of phytoremediation on soil bacterial communities in an abandoned mine site of rare earth elements. Sci. Total Environ. 2019, 670, 950–960. [Google Scholar] [CrossRef]
- Strand, P.; Larsson, C.-M. Delivering a framework for the protection of the environment from ionising radiation. In Radioactive Pollutants; EDP Sciences: Les Ulis, France, 2022; pp. 131–146. [Google Scholar]
- Fakher, H.-A. Investigating the determinant factors of environmental quality (based on ecological carbon footprint index). Environ. Sci. Pollut. Res. 2019, 26, 10276–10291. [Google Scholar] [CrossRef]
- Peng, J.; Wang, A.; Luo, L.; Liu, Y.; Li, H.; Hu, Y.n.; Meersmans, J.; Wu, J. Spatial identification of conservation priority areas for urban ecological land: An approach based on water ecosystem services. Land Degrad. Dev. 2019, 30, 683–694. [Google Scholar] [CrossRef]
- Fitzpatrick, C.R.; Salas-González, I.; Conway, J.M.; Finkel, O.M.; Gilbert, S.; Russ, D.; Teixeira, P.J.P.L.; Dangl, J.L. The plant microbiome: From ecology to reductionism and beyond. Annu. Rev. Microbiol. 2020, 74, 81–100. [Google Scholar] [CrossRef]
- Xu, M.; Huang, H.; Li, N.; Li, F.; Wang, D.; Luo, Q. Occurrence and ecological risk of pharmaceuticals and personal care products (PPCPs) and pesticides in typical surface watersheds, China. Ecotoxicol. Environ. Saf. 2019, 175, 289–298. [Google Scholar] [CrossRef]
- Zhang, Q.; Wang, G.; Yuan, R.; Singh, V.P.; Wu, W.; Wang, D. Dynamic responses of ecological vulnerability to land cover shifts over the Yellow River Basin, China. Ecol. Indic. 2022, 144, 109554. [Google Scholar] [CrossRef]
- McClure, M.L.; Hansen, A.J.; Inman, R.M. Connecting models to movements: Testing connectivity model predictions against empirical migration and dispersal data. Landsc. Ecol. 2016, 31, 1419–1432. [Google Scholar] [CrossRef]
- An, Y.; Liu, S.; Sun, Y.; Shi, F.; Beazley, R. Construction and optimization of an ecological network based on morphological spatial pattern analysis and circuit theory. Landsc. Ecol. 2021, 36, 2059–2076. [Google Scholar] [CrossRef]
- Kongjian, Y. Landscape ecological security patterns in biological conservation. Acta Ecol. Sin. 1999, 19, 8–15. [Google Scholar]
- Dong, R.; Zhang, X.; Li, H. Constructing the ecological security pattern for sponge city: A case study in zhengzhou, china. Water 2019, 11, 284. [Google Scholar] [CrossRef]
- Liu, D.; Chang, Q. Ecological security research progress in China. Acta Ecol. Sin. 2015, 35, 111–121. [Google Scholar] [CrossRef]
- Xiao, D.; Chen, W. On the basic concepts and contents of ecological security. J. Appl. Ecol. 2002, 13, 354–358. [Google Scholar]
- Huang, J.; Hu, Y.; Zheng, F. Research on recognition and protection of ecological security patterns based on circuit theory: A case study of Jinan City. Environ. Sci. Pollut. Res. 2020, 27, 12414–12427. [Google Scholar] [CrossRef] [PubMed]
- Gao, J.; Du, F.; Zuo, L.; Jiang, Y. Integrating ecosystem services and rocky desertification into identification of karst ecological security pattern. Landsc. Ecol. 2021, 36, 2113–2133. [Google Scholar] [CrossRef]
- Li, J.; Xu, J.; Chu, J. The construction of a regional ecological security pattern based on circuit theory. Sustainability 2019, 11, 6343. [Google Scholar] [CrossRef]
- Wei, Q.; Halike, A.; Yao, K.; Chen, L.; Balati, M. Construction and optimization of ecological security pattern in Ebinur Lake Basin based on MSPA-MCR models. Ecol. Indic. 2022, 138, 108857. [Google Scholar] [CrossRef]
- Peng, J.; Pan, Y.; Liu, Y.; Zhao, H.; Wang, Y. Linking ecological degradation risk to identify ecological security patterns in a rapidly urbanizing landscape. Habitat Int. 2018, 71, 110–124. [Google Scholar] [CrossRef]
- Wang, L.; Pang, Y.S. A review of regional ecological security evaluation. Appl. Mech. Mater. 2012, 178, 337–344. [Google Scholar] [CrossRef]
- Dai, L.; Liu, Y.; Luo, X. Integrating the MCR and DOI models to construct an ecological security network for the urban agglomeration around Poyang Lake, China. Sci. Total Environ. 2021, 754, 141868. [Google Scholar] [CrossRef]
- Zhang, C.; Jia, C.; Gao, H.; Shen, S. Ecological Security Pattern Construction in Hilly Areas Based on SPCA and MCR: A Case Study of Nanchong City, China. Sustainability 2022, 14, 11368. [Google Scholar] [CrossRef]
- Nie, W.; Xu, B.; Yang, F.; Shi, Y.; Liu, B.; Wu, R.; Lin, W.; Pei, H.; Bao, Z. Simulating future land use by coupling ecological security patterns and multiple scenarios. Sci. Total Environ. 2022, 859, 160262. [Google Scholar] [CrossRef]
- Wang, F.; Yuan, X.; Zhou, L.; Zhang, M. Integrating ecosystem services and landscape connectivity to construct and optimize ecological security patterns: A case study in the central urban area Chongqing municipality, China. Environ. Sci. Pollut. Res. 2022, 29, 43138–43154. [Google Scholar] [CrossRef]
- Wang, Y.; Qu, Z.; Zhong, Q.; Zhang, Q.; Zhang, L.; Zhang, R.; Yi, Y.; Zhang, G.; Li, X.; Liu, J. Delimitation of ecological corridors in a highly urbanizing region based on circuit theory and MSPA. Ecol. Indic. 2022, 142, 109258. [Google Scholar] [CrossRef]
- Ma, L.; Bo, J.; Li, X.; Fang, F.; Cheng, W. Identifying key landscape pattern indices influencing the ecological security of inland river basin: The middle and lower reaches of Shule River Basin as an example. Sci. Total Environ. 2019, 674, 424–438. [Google Scholar] [CrossRef]
- Peng, J.; Yang, Y.; Liu, Y.; Du, Y.; Meersmans, J.; Qiu, S. Linking ecosystem services and circuit theory to identify ecological security patterns. Sci. Total Environ. 2018, 644, 781–790. [Google Scholar] [CrossRef]
- Hu, M.; Li, Z.; Yuan, M.; Fan, C.; Xia, B. Spatial differentiation of ecological security and differentiated management of ecological conservation in the Pearl River Delta, China. Ecol. Indic. 2019, 104, 439–448. [Google Scholar] [CrossRef]
- Buxton, R.T.; Lendrum, P.E.; Crooks, K.R.; Wittemyer, G. Pairing camera traps and acoustic recorders to monitor the ecological impact of human disturbance. Glob. Ecol. Conserv. 2018, 16, e00493. [Google Scholar] [CrossRef]
- Fan, F.; Wen, X.; Feng, Z.; Gao, Y.; Li, W. Optimizing urban ecological space based on the scenario of ecological security patterns: The case of central Wuhan, China. Appl. Geogr. 2022, 138, 102619. [Google Scholar] [CrossRef]
- Lv, L.; Zhang, S.; Zhu, J.; Wang, Z.; Wang, Z.; Li, G.; Yang, C. Ecological Restoration Strategies for Mountainous Cities Based on Ecological Security Patterns and Circuit Theory: A Case of Central Urban Areas in Chongqing, China. Int. J. Environ. Res. Public Health 2022, 19, 16505. [Google Scholar] [CrossRef]
- Tang, F.; Zhou, X.; Wang, L.; Zhang, Y.; Fu, M.; Zhang, P. Linking ecosystem service and MSPA to construct landscape ecological network of the Huaiyang Section of the Grand Canal. Land 2021, 10, 919. [Google Scholar] [CrossRef]
- Xu, J.; Wang, J.; Xiong, N.; Chen, Y.; Sun, L.; Wang, Y.; An, L. Analysis of Ecological Blockage Pattern in Beijing Important Ecological Function Area, China. Remote Sens. 2022, 14, 1151. [Google Scholar] [CrossRef]
- Hu, X.; Xu, H. A new remote sensing index for assessing the spatial heterogeneity in urban ecological quality: A case from Fuzhou City, China. Ecol. Indic. 2018, 89, 11–21. [Google Scholar] [CrossRef]
- Huang, B.-X.; Chiou, S.-C.; Li, W.-Y. Landscape pattern and ecological network structure in urban green space planning: A case study of Fuzhou city. Land 2021, 10, 769. [Google Scholar] [CrossRef]
- Saura, S.; Vogt, P.; Velázquez, J.; Hernando, A.; Tejera, R. Key structural forest connectors can be identified by combining landscape spatial pattern and network analyses. For. Ecol. Manag. 2011, 262, 150–160. [Google Scholar] [CrossRef]
- Ye, H.; Yang, Z.; Xu, X. Ecological corridors analysis based on MSPA and MCR model—A case study of the Tomur World Natural Heritage Region. Sustainability 2020, 12, 959. [Google Scholar] [CrossRef]
- Chang, Q.; Liu, X.; Wu, J.; He, P. MSPA-based urban green infrastructure planning and management approach for urban sustainability: Case study of Longgang in China. J. Urban Plan. Dev. 2015, 141, A5014006. [Google Scholar] [CrossRef]
- Vogt, P.; Riitters, K. GuidosToolbox: Universal digital image object analysis. Eur. J. Remote Sens. 2017, 50, 352–361. [Google Scholar] [CrossRef]
- Yang, X.; Li, S.; Zhu, C.; Dong, B.; Xu, H. Simulating urban expansion based on ecological security pattern—A case study of Hangzhou, China. Int. J. Environ. Res. Public Health 2021, 19, 301. [Google Scholar] [CrossRef]
- Larivière, S.; Pasitschniak-Arts, M. Vulpes vulpes. Mamm. Species 1996, 1–11. [Google Scholar] [CrossRef]
- Contesse, P.; Hegglin, D.; Gloor, S.; Bontadina, F.; Deplazes, P. The diet of urban foxes (Vulpes vulpes) and the availability of anthropogenic food in the city of Zurich, Switzerland. Mamm. Biol. 2004, 69, 81–95. [Google Scholar] [CrossRef]
- Knaapen, J.P.; Scheffer, M.; Harms, B. Estimating habitat isolation in landscape planning. Landsc. Urban Plan. 1992, 23, 1–16. [Google Scholar] [CrossRef]
- Hu, C.; Wang, Z.; Wang, Y.; Sun, D.; Zhang, J. Combining MSPA-MCR Model to Evaluate the Ecological Network in Wuhan, China. Land 2022, 11, 213. [Google Scholar] [CrossRef]
- Wang, X.; Xie, X.; Wang, Z.; Lin, H.; Liu, Y.; Xie, H.; Liu, X. Construction and Optimization of an Ecological Security Pattern Based on the MCR Model: A Case Study of the Minjiang River Basin in Eastern China. Int. J. Environ. Res. Public Health 2022, 19, 8370. [Google Scholar] [CrossRef]
- Mei, Y.; Sun, Y.; Wang, Q.; Liu, Q.; Zhang, L. Construction of Green Space Ecological Network in Jinan City Based on MSPA and MCR Model. Pol. J. Environ. Stud. 2021, 31, 3701–3711. [Google Scholar] [CrossRef]
- Li, Y.-Y.; Zhang, Y.-Z.; Jiang, Z.-Y.; Guo, C.-X.; Zhao, M.-Y.; Yang, Z.-G.; Guo, M.-Y.; Wu, B.-Y.; Chen, Q.-L. Integrating morphological spatial pattern analysis and the minimal cumulative resistance model to optimize urban ecological networks: A case study in Shenzhen City, China. Ecol. Process. 2021, 10, 1–15. [Google Scholar] [CrossRef]
- Gallo, J.A.; Greene, R. Connectivity Analysis Software for Estimating Linkage Priority; Conservation Biology Institute: Corvallis, OR, USA, 2018. [Google Scholar]
- McRae, B.H.; Dickson, B.G.; Keitt, T.H.; Shah, V.B. Using circuit theory to model connectivity in ecology, evolution, and conservation. Ecology 2008, 89, 2712–2724. [Google Scholar] [CrossRef]
- Cremonesi, G.; Bisi, F.; Gaffi, L.; Zaw, T.; Naing, H.; Moe, K.; Aung, Z.; Gagliardi, A.; Wauters, L.A.; Preatoni, D.G. Evaluation of human disturbance on the activity of medium-large mammals in Myanmar tropical forests. Forests 2021, 12, 290. [Google Scholar] [CrossRef]
- Ellenberg, U.; Mattern, T.; Seddon, P.J. Heart rate responses provide an objective evaluation of human disturbance stimuli in breeding birds. Conserv. Physiol. 2013, 1, cot013. [Google Scholar] [CrossRef]
- Bennett, V.J.; Fernández-Juricic, E.; Zollner, P.A.; Beard, M.J.; Westphal, L.; Fisher, C.L.L. Modelling the responses of wildlife to human disturbance: An evaluation of alternative management scenarios for black-crowned night-herons. Ecol. Model. 2011, 222, 2770–2779. [Google Scholar] [CrossRef]
- Zhang, S.; Tan, J.; Liu, J.; Wang, J.; Tara, A. Suitability Prediction and Enhancement of Future Water Supply Systems in Barwon Region in Victoria, Australia. Land 2022, 11, 621. [Google Scholar] [CrossRef]
- Wang, H. Regional assessment of ecological risk caused by human activities on wetlands in the Muleng-Xingkai Plain of China using a pressure–capital–vulnerability–response model. Wetl. Ecol. Manag. 2022, 30, 111–126. [Google Scholar] [CrossRef]
- Wu, Z.H.; Li, T. The comprehensive performance evaluation of the high-tech development zone: Analysis based on the natural breakpoint method. Stat. Inf. Forum 2013, 28, 82–88. [Google Scholar]
- Janssen, C.P.; Brumby, D.P. Design and make aware: Virtues and limitations of designing for natural breakpoints in multitasking settings. Accid. Anal. Prev. 2009, 41, 115–122. [Google Scholar]
- Peng, J.; Ma, J.; Du, Y.; Zhang, L.; Hu, X. Ecological suitability evaluation for mountainous area development based on conceptual model of landscape structure, function, and dynamics. Ecol. Indic. 2016, 61, 500–511. [Google Scholar] [CrossRef]
- Xie, Y.; Lv, X.; Liu, R.; Mao, L.; Liu, X. Research on port ecological suitability evaluation index system and evaluation model. Front. Struct. Civ. Eng. 2015, 9, 65–70. [Google Scholar] [CrossRef]
- Shi, Y.; Li, J.; Xie, M. Evaluation of the ecological sensitivity and security of tidal flats in Shanghai. Ecol. Indic. 2018, 85, 729–741. [Google Scholar] [CrossRef]
- Olafsdottir, R.; Runnström, M.C. A GIS approach to evaluating ecological sensitivity for tourism development in fragile environments. A case study from SE Iceland. Scand. J. Hosp. Tour. 2009, 9, 22–38. [Google Scholar] [CrossRef]
- Suter, G.W., II. Ecological Risk Assessment; CRC Press: Boca Raton, FL, USA, 2016. [Google Scholar]
- Behr, D.M.; Ozgul, A.; Cozzi, G. Combining human acceptance and habitat suitability in a unified socio-ecological suitability model: A case study of the wolf in Switzerland. J. Appl. Ecol. 2017, 54, 1919–1929. [Google Scholar] [CrossRef]
- Chen, H.-s.; Liu, G.-s.; Yang, Y.-f.; Ye, X.-f.; Zhou, S. Comprehensive evaluation of tobacco ecological suitability of Henan Province based on GIS. Agric. Sci. China 2010, 9, 583–592. [Google Scholar] [CrossRef]
- Borja, A.; Basset, A.; Bricker, S.; Dauvin, J.-C.; Elliot, M.; Harrison, T.; Marques, J.; Weisberg, S.; West, R. Classifying ecological quality and integrity of estuaries. In Treatise on Estuarine and Coastal Science; Elsevier: Amsterdam, The Netherlands, 2012. [Google Scholar]
- Dong, G.; Liu, Z.; Niu, Y.; Jiang, W. Identification of Land Use Conflicts in Shandong Province from an Ecological Security Perspective. Land 2022, 11, 2196. [Google Scholar] [CrossRef]
- Wang, S.; Wu, M.; Hu, M.; Fan, C.; Wang, T.; Xia, B. Promoting landscape connectivity of highly urbanized area: An ecological network approach. Ecol. Indic. 2021, 125, 107487. [Google Scholar] [CrossRef]
- Guo, R.; Wu, T.; Liu, M.; Huang, M.; Stendardo, L.; Zhang, Y. The construction and optimization of ecological security pattern in the Harbin-Changchun urban agglomeration, China. Int. J. Environ. Res. Public Health 2019, 16, 1190. [Google Scholar] [CrossRef]
Disclaimer/Publisher’s Note: The statements, opinions and data contained in all publications are solely those of the individual author(s) and contributor(s) and not of MDPI and/or the editor(s). MDPI and/or the editor(s) disclaim responsibility for any injury to people or property resulting from any ideas, methods, instructions or products referred to in the content. |
© 2023 by the authors. Licensee MDPI, Basel, Switzerland. This article is an open access article distributed under the terms and conditions of the Creative Commons Attribution (CC BY) license (https://creativecommons.org/licenses/by/4.0/).


