Abstract
Multiple factors need to be considered when allocating water resources, among which water scarcity risk is often ignored. However, the unmet water demand of upstream sectors with high water dependency will exacerbate water scarcity, and lead to potential economic risk to the industrial chain. To solve it, we propose a method to quantify the intermediate virtual water scarcity risk transfer via the intermediate use matrix and Leontief inverse matrix, and apply it to virtual water trade in China in 2018. Meaningful conclusions are drawn as follows: (i) Although the water-use efficiency of all sectors in China increased steadily from 2007 to 2018, the overall input concentration of virtual water scarcity risk showed a rising trend, reflecting the gradual increase in the vulnerability of the industrial chain to water shortage. (ii) The virtual water scarcity risk in China mainly transferred through the secondary industry. The secondary industry accounted for 51.8% of the output and 71.8% of the input in the intermediate virtual water transfer, while 77.0% and 74.7%, respectively, in intermediate virtual water scarcity risk output and input. (iii) From 2007 to 2018, agriculture, chemical industry, metallurgy, electricity and heat supply always ranked as the top four of intermediate virtual water scarcity risk output sectors. As their downstream sectors, the construction industry, metallurgy, and other services are stable within the top four input sectors. (iv) The virtual water scarcity risk upstream transmitted is significantly dispersed after the intermediate inputs process, indicating that abundant import relationships are conducive to reduce the risk taken in. From the perspective of intermediate input, this paper argues that it is necessary to both ensure the water supply of the upstream source sectors and disperse the downstream import sources. Moreover, enriching industrial structures and closing production linkages between sectors is also beneficial for promoting sustainable economic development.
1. Introduction
Water is an indispensable resource for human society [1]. Nowadays, water crises have become a top global risk [2,3]. Water scarcity affects industrial and agricultural production, causing a wide range of social and economic problems [4,5,6], including swater scarcity risk (WSR), an essentially supply-chain-wide risk for the economy [7,8]. Virtual water trade to alleviate local water stress by trading makes the local water scarcity risk (LWSR) break the geographical and industrial boundaries, posing a significant potential risk to distant regional economies and sectors, which is known as virtual water scarcity risk (VWSR) [9,10]. VWSR spreads between sectors during production; therefore, when upstream sectors lose the guarantee of water use, a huge impact will be brought on downstream sectors and even the whole industrial chain [11,12]. However, this water scarcity is not rooted only in the limitation of water resources in physical terms, but also originates in social factors, e.g., flawed water planning and management approaches, and unsustainable economic [13,14]. In order to avoid exacerbating water scarcity and support sustainable development, it is necessary to rationalize the allocation of water resources among industries. China’s economy is growing rapidly; however, there are imbalances in industrial development, and the potential economic losses in the trade chain should be noted. Therefore, it is urgent to explore the transfer characteristics of virtual water scarcity risk in Chinese sectors.
In recent years, scholars have studied the rational allocation of water resources through the virtual water scarcity risk and achieved remarkable results [15,16,17]. Hoekstra et al. [18] evaluated the “water resource import risk” by assessing the water sustainability of the source regions of imported goods in trade. It was found that half of the virtual water imports in the UK came from regions with water shortage; therefore, the UK may be at risk of future declines in imports of some goods or no imports at all. Rushforth et al. [19] assessed virtual water risk in Flagstaff, USA, and found that virtual water resources there are more vulnerable to water scarcity than to local resources, since the average water stress of their virtual water trading partners exceeds their own water stress. Chini et al. [20] and Djehdian et al. [21] studied indirect and direct water use across the U.S. and elaborated on the interaction between inter-city trade and water shortage across cities, finding that indirect water use dominated total water inflows to cities, and that urban water shortages are largely influenced by water-scarce states upstream of the supply chain. To quantify the risk transfer from upstream to downstream regions in trade, Qu et al. [12] proposed a calculation method for quantifying VWSR based on the input–output method. The virtual water scarcity risks among major countries in the world were analyzed, and the major countries and industries with export and import risks were identified respectively. Based on this method, Zhao et al. [22] studied the global virtual water scarcity risk transfer under two climate change scenarios, and identified the countries and industries with the greatest impact of local water shortage on foreign economic systems. Cao et al. [23] quantified the VWSR in northeast China transfer, noting that VWSR trade was active within the northeast and outward VWSR transfer mainly went to coastal areas. Zhao et al. [11] quantified the VWSR in China’s provinces, pointing out that the chemical industry in Shanghai and Anhui, and the textile industry in Jiangsu were the main export industries of VWSR, while the communication equipment and computer industries in Zhejiang and Jiangsu were the largest importers. Yao et al. [24] improved the calculation method of VWSR, calculated the VWSR transfer network in China’s energy system, and pointed out that Henan, Anhui, Guangdong and other places were the main import places of VWSR in the energy system, and the import sources were mainly Xinjiang, Shanxi and Shaanxi. Wang et al. [25] extended the concept of virtual water scarcity risk to trade-related water scarcity risk (TWSR), and measured the TWSR transfer between the Belt and Road countries and China. It is pointed out that most of China’s TWSR came from the Belt and Road countries, and the share of TWSR imported from the Belt and Road countries was steadily increasing.
The abovementioned studies have accumulated rich achievements; however, these always focus only on final demand or do not distinguish between final consumption and intermediate use, therefore lacking specific consideration of the virtual water scarcity risk caused by intermediate input transfer. During actual production, the majority of sectors are not produced independently, but are interconnected. Intermediate input means the products of one department will become production materials of another department in the next period [26]. Intermediate input products and final consumption products are different parts of the supply chain, both of which can lead the VWSR to be transmitted across sectors [27,28]. Separate accounting of can reveal the inter-industry supply and demand linkages, and support the recognition of the cross-industry transfer characteristics of virtual water scarcity risk. Therefore, we established a method to quantify the intermediate virtual water scarcity risk transfer and evaluate the risk index for each sector, and analyzed the inter-industry transfer pattern of intermediate virtual water scarcity risk in China in 2018. This paper provides a new perspective with reference significance for the study of rational water resources allocation among sectors.
2. Methods and Data
2.1. Data
This paper has taken into account the virtual water scarcity risk transfer between Chinese sectors in 2007, 2010, 2012, 2015, 2017 and 2018, for which the newest input–output data are available from the China input–output tables released by the China Bureau of Statistics [29,30,31,32,33,34]. The agricultural water-use data from the China Statistical Yearbook are selected as water-use data of the primary industry, while the water use of the secondary and tertiary industries was calculated based on the water-use ratio of each sector from the 2008 China Economic Census Yearbook [35], combined with economic growth projections.
2.2. Industry Classification
In this paper, the detailed sectoral classifications in the China input–output tables are combined into 30 sectors with reference to industrial classification for national economic activities [36], and the specific industry classifications are shown in Table 1.

Table 1.
Industry classification table.
2.3. Methods
2.3.1. Water Input–Output Model
- (i)
- Water-use Coefficient
The direct water-use coefficient of sector is calculated by dividing its total amount of direct water consumption by its total input . It reflects the direct or the first-round effects of the sectoral interaction in the economy [37,38]. The direct water-use coefficient matrix can be obtained as in Equation (1).
The complete water-use coefficient is equal to the product of the row vector of the direct water-use coefficient matrix and the inverse matrix of W. Leontief [39]. It reflects the overall water-use efficiency, including direct and indirect water consumption. In Equation (2), A is the diagonal matrix of the direct water-use coefficient.
- (ii)
- Calculation of Inter-sector Virtual Water Transfer
The inter-sector virtual water transfer Tk is calculated according to Equations (3) and (4).
is the complete water consumption matrix of sector , is the diagonal matrix composed of the direct water consumption coefficient, is the intermediate transfer matrix, and is the diagonal matrix composed of the complete water consumption coefficient. From the row direction, the element represents the virtual water transported from sector to sector , and the row sum is equal to the total virtual water transported from sector to each sector. In the column direction, represents the virtual water volume received by sector from sector , and represents the total virtual water volume received by sector from other sectors.
2.3.2. Virtual Water Scarcity Risk Model
- (i)
- Quantification of Water Scarcity Risk
In water-scarce regions, industries face potential economic losses due to production reduction or even shutdown out of insufficient water supply. This risk is related mainly to the degree of local water scarcity and the dependence of the sector’s production activities on water resources. Based on this perspective, Qu et al. [12] developed the methodology presented below to quantify the potential economic losses of industries due to water scarcity.
In Equation (5), represents the potential economic loss of in region due to water shortage. represents the water deprivation risk of region. represents the water dependence of the production of sector in region , which is the proportion of economic losses when the unit water supply is reduced. is the basic output of sector in region under normal conditions.
The water deprivation risk reflects the local water endowment, which is the decline proportion of local water supply that might be caused by water shortage. It can be estimated via the water stress index (), as in Equation (6).
In Equation (6), is the water stress index of region , which can comprehensively reflect the local water shortage. is the parameter that controls the gap between regions, and the larger the parameter is, the larger the gap between regions. is the ratio of total water resources and the annual water supply in region , which obeys the log-normal distribution. The formula is expressed as in Equations (8) and (9).
Water dependency represents the percentage reduction in economic output for a 1% reduction in water supply for production activities in sector , and is estimated using water-use intensity , as shown in Equation (10).
is the ratio of water consumption to GDP for sector . The parameter controls the critical point of , and will grow rapidly to 1 when the zero boundary is exceeded.
- (ii)
- Virtual Water Scarcity Risk Transfer
Qu et al. [12] used the Ghosh input–output model [40] to calculate the value of virtual water scarcity risk caused locally and transferred to other regions, and Yao et al. [24] combined the local water scarcity risk with the Leontief input–output model to quantify the virtual water scarcity risk from the perspective of final demand. In actual production, the vast majority of production for each sector does not take place independently, but is interconnected. This means that a portion of each sector’s product will not be consumed as a final product, but become a production material of another sector again, which is known as the intermediate input product. The virtual water scarcity risk transfer for sector is the sum of the intermediate input transfer risk for sector and the final consumption transfer risk for sector , as shown in Equation (11).
Both intermediate and final consumption products are part of the supply chain, being able to cause the to be transmitted across sectors. Previous studies have tended to only focus on or . However, can reveal supply and demand linkages between sectors, thus revealing the inter-sector transfer characteristics of the. Therefore, it is necessary to establish a method to quantify the. Based on a former study, we calculated the via the intermediate use matrix and Leontief inverse matrix, as shown in Equations (12) and (13).
In the formula, is the intermediate transfer matrix located in the first quadrant. is the intermediate virtual water scarcity risk transfer matrix, the row direction of which corresponds to the amount of risk output by the intermediate products of the sector , while the column direction reflects the input amount.
- (iii)
- Intermediate Virtual Water Scarcity Risk Transfer Index
In the formula, represents the industry-wide average virtual water scarcity risk transfer, while is the virtual water scarcity risk transfer of the sector . Likewise, and represent the of the industry-wide average and the sector , respectively.
The sector in which the virtual water scarcity risk transfer per unit GDP is beyond the average value will result in a positive . When the transfer direction is outward, we call the exceeded virtual water scarcity risk output index. When the transfer direction is inward, we call the exceeded virtual water scarcity risk input index. Accordingly, for sector with a negative , which means its virtual water scarcity risk transfer per unit GDP is within the average value, is also called the safe virtual water scarcity risk output index for the outputs, and the safe virtual water scarcity risk input index for the inputs.
- (iv) Herfindahl Index
The Herfindahl index is used to evaluate the concentration of virtual water scarcity risk input of the sector . The higher the is, the more concentrated the import sources of the, which means the poorer the ability to resist the water shortage that occurred in the upstream sector is, and the more vulnerable sector is to the .
In the formula, is the virtual water scarcity risk transferred from sector to sector .
2.4. Flow Chart
In order to clearly illustrate the technical route of this paper, a flowchart was drawn as shown in Figure 1.
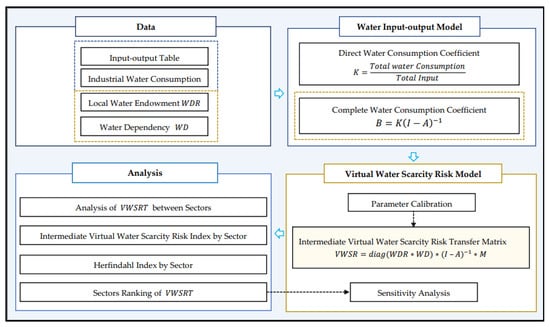
Figure 1.
Flowchart for assessing intermediate virtual water scarcity risk transfer.
3. Results
3.1. Virtual Water Trade of Sectors in China
3.1.1. Water-use Coefficient
To evaluate the water efficiency of various sectors, Figure 2 presents the complete water-use coefficients ( for short) and the direct water-use coefficients ( for short) for each sector in China, respectively.
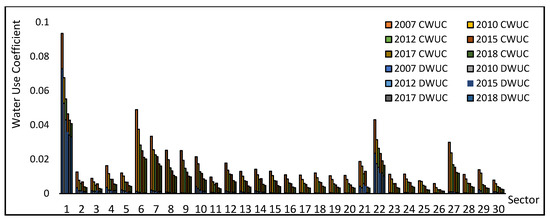
Figure 2.
Water use coefficient of sectors in China in selected year between 2007 to 2018 (units: m³/RMB).
From 2007 to 2018, the water-use coefficients for all Chinese sectors showed a stepwise decrease year by year, reflecting the yearly improvement in water-use efficiency and the effective implementation of water conservation. During this period, agriculture (the digital index in Figure 2 is 1, the same as below) had been a particularly water-intensive sector due to high water consumption requirements such as irrigation. In 2007, the complete water-use coefficient for agriculture (1) reached 0.0934 m³/RMB, as shown in Figure 2.
In 2018, the sectors with low water-use efficiency in China included agriculture (1) from the primary industry, food and tobacco (6), textile (7), electricity and heat supply (22) from the secondary industry, and restaurant and accommodation (27) from the tertiary industry. Among them, agriculture (1) and electricity and heat supply (22) mainly used water directly; therefore, these had a high consumption and dependence on water resources. The service sectors in the tertiary industry used water efficiently and are mainly indirect.
From the perspective of improving overall water-use efficiency, sectors with lower complete water-use coefficients can generate higher economic output. However, industry production needs to meet both national final consumption demand and the intermediate input requirements of downstream industries. The allocation of water resources needs to take it into account the overall economic efficiency, the final consumption demand of products from the sector itself, and the intermediate input needs of downstream sectors. Previous studies have yielded a number of findings based on a final consumption perspective, and we will refine the industry classification and examine the intermediate virtual water scarcity risk transfer between sectors.
3.1.2. Intermediate Virtual Water Transfer between Sectors
Intermediate virtual water transfer assesses the amount of virtual water flowing through sectors. As can be seen from Figure 3, the transfer of intermediate virtual water in China mainly occurs in the secondary industry, which accounts for 51.8% of outputs and up to 71.8% of inputs.
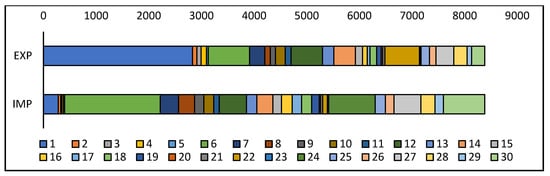
Figure 3.
Intermediate virtual water transfer by sector in China in 2018 (units: m3).
The main output sectors of intermediate virtual water include agriculture (1) (33.8%) belonging to the primary industry, food and tobacco (6) (9.4%), electricity and heat supply (22) (7.9%) and the chemical industry (12) (7.1%), which belong to the secondary industry. The main input sectors include the food and tobacco (6) (21.7%), and construction (24) (10.5%) sectors from the secondary industry, and other services (30) (9.4%) from the tertiary industry.
In order to reflect in more detail, the intermediate virtual water transfer between Chinese sectors greater than 3 billion m3 in 2018 is plotted in Figure 4, in billion m3. The left part reflects the output flows, while the right part shows the input.
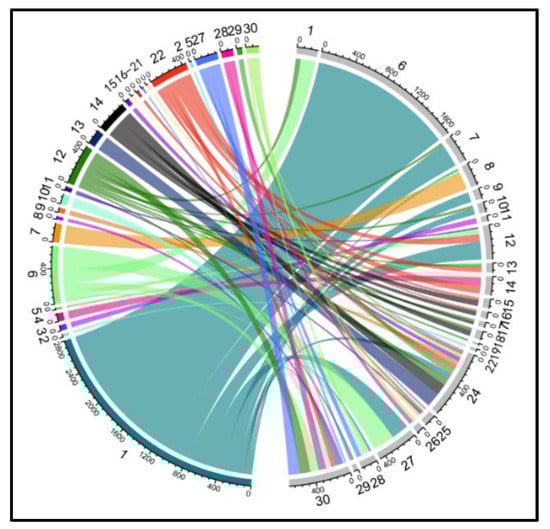
Figure 4.
Intermediate virtual water transfer between industries in China in 2018 (units: billion m3).
As can be seen from Figure 4, 60.8% of the intermediate virtual water output from agriculture (1) flows to food and tobacco (6), while 22.8% of the intermediate virtual water from the food and tobacco (6) sector flows back to agriculture (1), and 33.2% flows to the restaurant and accommodation (27) sector, constituting the most significant flows of intermediate virtual water transfer in China. From the input perspective, the production linkage between upstream and downstream industries can be observed. For example, 94.8% of the intermediate virtual water flows into the food and tobacco (6) sector and 83.0% of flows into the textile (7) industry originate from agriculture (1), respectively, which is due to the fact that the main raw materials of these two sectors are agricultural products. Similarly, 70.1% of the inflow of the apparel leather (8) sector comes from the textile (7) sector, and the intermediate virtual water flowing into restaurant and accommodation (27) comes from the agriculture (1) and the woodworking and furniture (9) sectors at a proportion of 40.8% and 51.1%, respectively. The flow of intermediate virtual water actually reflects the main factors of production in each sector, which are often irreplaceable. However, the virtual water content per unit of product can be reduced by increasing the water-use efficiency of the main upstream source sectors outputting virtual water scarcity risk. In this way, the main upstream sectors will account for a lower proportion of the virtual water sources of the downstream sectors, which helps to reduce the impact brought to downstream sectors when the upstream sectors face water shortages.
3.2. Virtual Water Scarcity Risk Transfer of sectors in China
3.2.1. Parameter Calibration
Parameters are calibrated to find the most appropriate and . The calculation results of of each province under different parameters are analyzed as shown in Figure 5. is less than 1% in 80% of provinces when = 0.5, and greater than 1% in 30% of provinces when = 1.5. When = 1, about 30% of provinces have sufficiently small to be considered negligible, and 30% of provinces have greater than 10%, which fits better with the distribution of. Similarly, the and distributions fit better when = 2, as shown in Figure 6. Therefore, we calculate the intermediate virtual water scarcity risk transfer of Chinese sectors in the scenario where = 1 and = 2 in this paper.
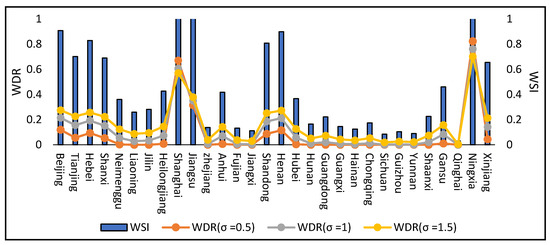
Figure 5.
WSI and corresponding WDR for province under different σ in China.
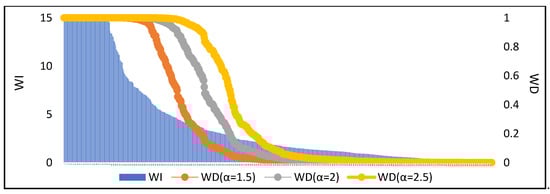
Figure 6.
WI and corresponding WD for province under different α in China.
3.2.2. Sectors’ Ranking of Intermediate Virtual Water Scarcity Risk Transfer
To analyze the interannual level of intermediate virtual water scarcity risk transfer among sectors in China, Figure 7a,b rank the top ten sectors in terms of output and input, respectively, from 2007 to 2018. As can be seen from the figures, the output of virtual water scarcity risk in the agriculture, chemical industry, electricity and heat supply sectors consistently remained in the top four, indicating that these sectors were where virtual water scarcity risk in Chinese supply chain originated. With a high long-term dependence on direct water use, these sectors will bring a shock to the whole economic system once facing a large reduction in production in case of water shortage. Therefore, in order to improve the resilience of these source sectors to deal with water shortages, on the one hand, it is important to advance their water conservation technology to minimize their own water demand. On the other hand, it is also necessary to ensure that their basic water needs are met, so as to avoid the transmission of economic risks downstream from their water shortages and production cuts.
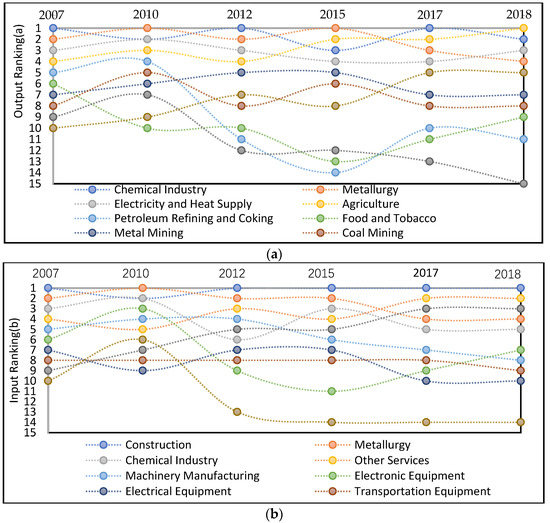
Figure 7.
(a) Sectors’ ranking of intermediate virtual water scarcity risk output in China in selected year between 2007 to 2018. (b) Sectors’ ranking of intermediate virtual water scarcity risk input in China in selected year between 2007 to 2018.
In terms of virtual water scarcity risk input for each sector, construction, metallurgy, and other services (30) were stable within the top four from 2007 to 2018. These three sectors have high reliance on specific production factors, such as from construction to metallurgy, metallurgy to electricity and heat supply, other services (30) to restaurant and accommodation (27) and agriculture. It is difficult to reduce their risk intake by changing the imports’ source in the process of intermediate inputs; thus, these downstream sectors have high risk of virtual water scarcity input. In terms of sector distribution, the output ranking of virtual water scarcity risk in metallurgy, chemical industry, coal mining, metal mining and other heavy industry sectors were positioned more forward compared to the input. From 2007 to 2018, the overall production technology and water conservation ability of heavy industry had improved, as evidenced by a fall in the ranking of heavy industries in both virtual water scarcity risk input (e.g., machinery manufacturing) and output (e.g., non-metallic mining, petroleum refining and coking). Meanwhile, risk input from textile sector continued to decline, while risk input from the food and tobacco sector and output from the paper printing and stationery sector gradually increased.
3.2.3. Sensitivity Analysis
To verify the validity of the results, this paper analyzed the robustness of the ranking of virtual water scarcity risk output and input for each domestic industry in China. We set parameter to vary between [0.5, 1.5], while the parameter was set to vary between [1.5, 2.5]. A total of 100 pairs of parameter combinations were taken to recalculate the ranking of virtual water scarcity risk output and input between Chinese sectors, and the results are plotted against the Kendall rank correlation coefficient of the benchmark case (= 1, = 2) in Figure 8.
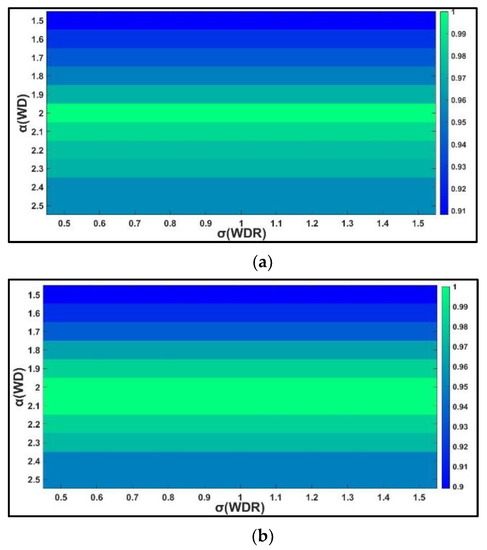
Figure 8.
(a) Kendall index for industry-wide VWSR output ranking at different parameters. (b) Kendall index for industry-wide VWSR input ranking at different parameters.
Since the virtual water scarcity risk transfer of Chinese sectors is calculated via a single-region input–output table, the will not affect the risk import concentration, and the Kendall correlation coefficient will not change when is different. As shown in Figure 8, the Kendall correlation coefficients between the ranking of sector-wide virtual water scarcity risk transfer and the benchmark values are always greater than 0.9 when takes different values, indicating that the calculated inter-sector input and output rankings of virtual water scarcity risk in China are very robust and have reference value.
3.2.4. Intermediate Virtual Water Scarcity Risk Transfer between Sectors
Based on the ranking in Figure 8, Figure 9 further reflects the transfer of main domestic intermediate virtual water scarcity risk between sectors in China in 2018, with the direction from left to right, in CNY billions. Due to the large number of sectors involved in the transfer network, Figure 9 only shows the flow with virtual water scarcity risk transfer volume greater than CNY 5 billion. The intermediate virtual water scarcity risk output of the primary industry accounted for 22.5%, while the proportion of secondary industry was up to 77.0% and the tertiary only reached 0.5%. In addition, the input of the three industries accounted for 2.0%, 74.7%, 23.4%, respectively. This shows that the intermediate virtual water scarcity risk in China is mainly transferred through the secondary industry.
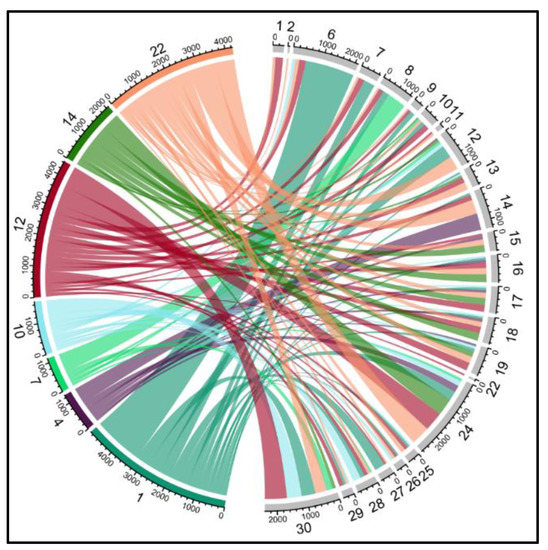
Figure 9.
Main intermediate virtual water scarcity risk transfer between sectors in China in 2018 (units: CNY billion ).
The specific main output sectors of intermediate virtual water scarcity risk include the agriculture (1), chemical industry (12), electricity and heat supply (22), metallurgy (14), paper printing and stationery (10), textile (7) and metal mining (4) sectors. Moreover, the virtual water scarcity risk output from the agriculture (1), chemical industry (12) and electricity and heat supply (22) sectors accounted for 22.5%, 20.3% and 19.5%, respectively. The mainly input sectors include construction (24), other services (30), and food and tobacco (6). Among them, the construction (24) sector received the risk mainly from the electricity and heat supply (22), chemical industry (12), metallurgy (14) and agriculture (1) sectors, while other services (30) mainly from the paper printing and stationery (10), chemical industry (12), agriculture (1) and electricity and heat supply (22). In addition, 75.6% of the virtual water scarcity risk that food and tobacco (6) take in is from agriculture (1), which reflects a strong supply and demand linkage between agricultural products and material of the food and tobacco (6) sector.
Figure 10 shows the estimated virtual water scarcity risk transfer network between sectors in China in 2018 on the heat map. It is calculated by taking the logarithm of the virtual water scarcity risk intersected by each two sectors in trade with a base of 10. In the figure, the horizontal direction represents the virtual water scarcity risk output value from a certain sector to others, respectively, and the vertical direction represents the respective input value of the certain sector from other sectors. As can be seen, the color blocks that represent certain transfer processes are particularly dark, signifying the higher risk volume of the according transfer. These dark areas include the transfer from the agriculture sector (1) to the food and tobacco (6), chemical industry (12) and other services (30) sectors, and that from the textile sector (7) to apparel leather (8). It also appears more remarkable in the transfer from the metal mining (4) sector to metallurgy (14), from metallurgy (14) to construction (24), from chemical industry (12) to construction (24) and other services (30), from electricity and heat supply (22) to chemical industry (12), metallurgy (14), and construction (24), from printing industry to other services (30), etc. The abovementioned is the transfer estimated at over CNY 400 billion in the scenario where = 1 and = 2. It shows that these intermediate input processes are the main places where intermediate virtual water scarcity risk transfer occurs; therefore, it is particularly necessary to ensure the water demand of the output sectors and enhance the resistance ability of the input sectors mentioned.
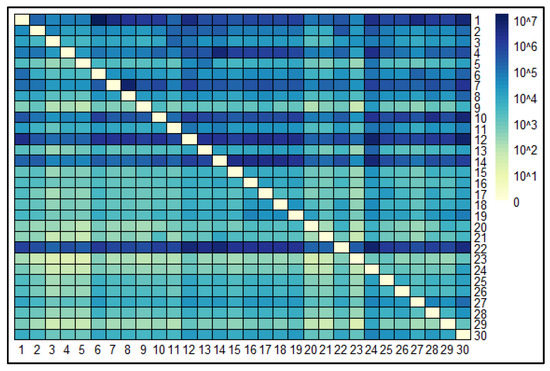
Figure 10.
Intermediate virtual water scarcity risk transfer network between sectors in China in 2018.
3.2.5. Intermediate Virtual Water Scarcity Risk Index by Sector
To provide a more sensitive indication of the relationship between inter-sector virtual water scarcity risk transfer and sectoral economic output, the intermediate virtual water scarcity risk transfer index for each sector in China is calculated in Figure 11.
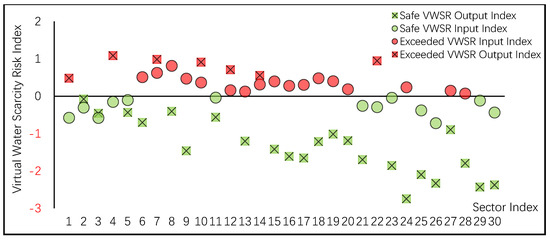
Figure 11.
Virtual water scarcity risk index of Chinese sectors in 2018.
The sectors whose intermediate virtual water scarcity risk output index is indicated with red rectangles output virtual water scarcity risk above average, while others indicated with green rectangles represent sectors with safe output index. As shown in the figure, the sectors with exceeded output index include the agriculture (1), metal mining (4), textile (7), paper printing and stationery (10), petroleum refining and coking (11), chemical industry (12), metallurgy (14) and electricity and heat supply (22) sectors.
Accordingly, the red circles in Figure 11 reflect corresponding sectors input virtual water scarcity risk above average, while green circles represent sectors with safe input index. The sectors with exceeded input index include the food and tobacco (6), textile (7), apparel leather (8), woodworking and furniture (9), paper printing and stationery (10), chemical industry (12), non-metallic products (13), metallurgy (14), metal products, machinery manufacturing (16), transportation equipment (17), electrical equipment (18), electronic equipment (19), instruments and meters (20), construction (24), restaurant and accommodation (27) and other services (30) sectors.
Sectors indicated in red have greater potential economic losses due to water shortages and require additional attention when allocating water. Specifically, those with exceeded outputs are more hazardous, and those with exceeded inputs are more vulnerable. In fact, these vulnerable sectors are often downstream of hazardous sectors. In order to reduce the risk of virtual water scarcity existing in the trade chain, it is necessary, on the one hand, to improve the water-use efficiency of upstream risky sectors, and, on the other hand, to disperse the import sources of downstream vulnerable sectors as much as possible.
Furthermore, it can be observed that more sectors exceed the average value in the virtual water scarcity risk input compared to the output. However, the maximum value of risk transfer per unit of GDP output is lower in the input, with less variance, and the virtual water scarcity risk transmitted from upstream is significantly dispersed. This suggests that abundant import relations are conducive to reducing the risk of upstream water shortage transmission. Even if the industry production factors are not substitutable, it is still possible to diversify imports by enriching the origin and source of raw materials. There is a need to promote the balanced development of markets in all regions, and close production linkages between different sectors. Enriching trade networks is capable of enhancing the resilience to cope with the water shortage occurring in upstream sectors, which will contribute to sustainable economic development.
3.2.6. Herfindahl Index by Sector
To analyze the concentration of virtual water scarcity risk inputs sources of sectors, we calculated the Herfindahl index for each sector in China in 2018 and presented the results together with the water-use coefficients in Figure 12a.
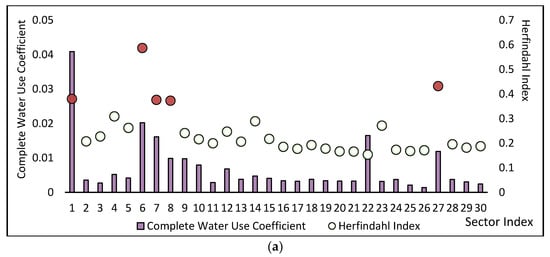
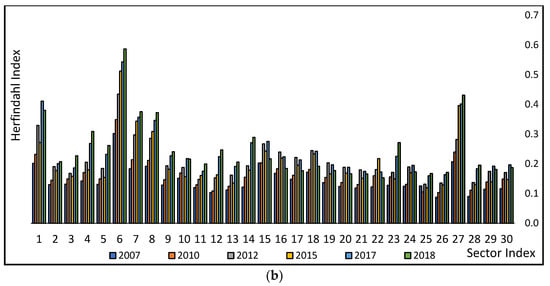
Figure 12.
(a) Herfindahl index and complete water-use coefficient of Chinese sectors in 2018. (b) Trends of Herfindahl index of sectors in China in selected year between 2007 to 2018.
As can be observed in Figure 12a, the Herfindahl index values for the food and tobacco (6), agriculture (1), textile (7), apparel leather (8), woodworking and furniture (9), and restaurant and accommodation (27) sectors are significantly higher than those of other sectors. Among them, the water-use coefficients of the agriculture (1), food and tobacco (6), textile (7) and accommodation (27) sectors are also at relatively high level. This means that, on the one hand, the above sectors have low water efficiency and receive less economic return per unit of water used. On the other hand, they have intensive sources of intermediate inputs and high vulnerability. In addition, combined with Figure 4 and Figure 9, the tendency that the sectors with high Herfindahl index have few input sources is more evident in the virtual water transfer pattern compared to the virtual water scarcity risk transfer pattern. This indicates that those sectors have high water footprints, requiring high water consumption during the production and trade process, which is also evidenced by the complete water-use coefficients in Figure 12a.
Despite the low economic efficiency of water consumption, the water demand of those upstream sectors with high Herfindahl index have to be met in order to avoid a chain crisis in downstream sectors. In addition, in order to disperse the concentrated input resource, it also necessary to improve their water-saving technology and reduce their water dependence.
Figure 12b shows the Herfindahl index of sectors in China for selected years between 2007 and 2018. In general, the concentration of water scarcity risk inputs of Chinese sectors showed an overall increasing trend. In 2010, China became the world’s second largest economy. With the domestic economic market developing rapidly since that year, the Herfindahl index of most Chinese sectors showed significant increase, reflecting the increasing vulnerability of those sectors to water scarcity, which is detrimental to sustainable economic development. Therefore, in 2017, China proposed a series of industrial structure reform policies [41]. Accordingly, it can be observed that the Herfindahl index of some sectors partially declined from 2017 to 2018, such as those of the agriculture (1), metallic products (15), machinery manufacturing (16), transportation equipment (17), electrical equipment (18) sectors, etc. This reflects the impact and effectiveness of industrial structure optimization in supporting sustainable resources’ utilization and improving economic resilience to water scarcity. However, the Herfindahl Index was still increasing in some sectors, notably including the food and tobacco (6), non-metallic mining (5), oil and gas (3), and metal mining, gas water supply (23), restaurant and accommodation (27) sectors, etc. Moreover, from 2017 to 2018, the increase in the Herfindahl index for the oil and gas (3), textile (7), restaurant and accommodation (27) sectors was even more rapid, indicating that comprehensive industrial structure reform still needs to be persistently promoted in China.
4. Discussion
Based on previous studies, this paper focuses on the rational allocation of water resources among sectors through the perspective of intermediate virtual water scarcity risk. We proposed a method to calculate the intermediate virtual water scarcity risk transfer among sectors through the Leontief inverse matrix and the intermediate input matrix. With this method applied to virtual water trade in China in 2018, we evaluated the performance of Chinese sectors in the virtual water scarcity risk and their vulnerability to water shortage. Conclusions obtained are beneficial to reveal the distribution of potential risks in China’s industrial chain, and the following points still need to be discussed.
- (i)
- The water input–output model has some limitations from the perspective of economics since it assumes economies or diseconomies of scale and does not incorporate supply constraints. However, it can reveal water utilization in economic input–output, and is a beneficial way for studying virtual water trade and water footprint. The former studies have provided extensive ideas for world water security [42,43,44,45]. This paper based on the water input–output model draws conclusions of reference significance in the rational allocation of water resources.
- (ii)
- The virtual water scarcity risk output decides mainly on the dependence of each sector on physical water, and the virtual water scarcity risk input mainly depends on the necessary degree of direct water used in the production of upstream sectors closely related. Therefore, the upstream sectors with high water consumption will output more risk, and the midstream industry with indispensable input demand for products of these upstream exporters will input a large amount of virtual water scarcity risks. However, the risk output by some midstream sectors is low since they consume water through intermediate inputs instead of physical water. Similarly, the downstream sectors have less risk input.
- (iii)
- According to the sensitivity analysis, the input ranking of virtual water scarcity risk is more robust. This is due to the fact that the parameter taken will directly affect a particular significantly; however, virtual water scarcity risk input comes from multiple sectors. The virtual water scarcity risk output occurs when the production is completed in the source sector, and is only transferred into the downstream sector after the intermediate input process. A complex trade system reduces the impact of parameter changes. Nevertheless, the Kendall index for both rankings is above 0.9, indicating that our calculations are credible and informative.
- (iv)
- The virtual water scarcity risk for each sector in the paper does not respond to absolute values due to the calculation results being subject to parameter variation. and do not have statistical data; they need to be extrapolated from the related variables and measured in relative terms. Therefore, is also measured in relative terms. For the virtual water scarcity risk, this paper focuses only on the ranking, proportion and other relative quantities of sectors, which can also provide reference significance.
- (v)
- The intermediate virtual water scarcity risk index evaluates the level of virtual water scarcity risk input or output in a certain sector compared to the industry-wide average for the current year, focusing on the volume of risk, which can be evaluated to find the sectors with especially high virtual water scarcity risk. The Herfindahl index describes the concentration degree of input sources from upstream of a certain sector, focusing on the low resistance to water scarcity caused by simple input relations. This simplicity prevents HI from accurately assessing competitive or monopolistic market conditions. However, only from the perspective of virtual water, introducing it to evaluate can still intuitively reflect the sectors with high input concentration and which are, thus, vulnerable to water shortage [11,12,22,46].
5. Conclusions
In order to explore the potential economic losses due to water scarcity in trade chains, this paper intends to quantify industrial virtual water scarcity risk from the perspective of intermediate inputs. To this end, this paper proposes a methodology to calculate the intermediate virtual water scarcity risk transfer, which is applied to the study of inter-sector virtual water trade in China in 2018. The main conclusions are drawn as follows.
- (i)
- China’s virtual water and water scarcity risk are mainly transferred through the secondary industry. The secondary industry accounted for 51.8% of the output and 71.8% of the input in the intermediate virtual water transfer in 2018. In the intermediate virtual water scarcity risk transfer, the output of the secondary industry accounts for 77.0%, and the input accounts for 74.7%.
- (ii)
- In terms of intermediate virtual water scarcity risk output, the agriculture, chemical industry, metallurgy, and electricity and heat supply sectors always ranked in the top four from 2017 to 2018. These industries are the origin of virtual water scarcity risk in China’s supply chain and have a long-term high degree of dependence on direct water use. Once they face reduction in production in case of water scarcity, a huge impact will be introduced to the whole economic system. In terms of intermediate virtual water scarcity risk input, the construction, metallurgy, and other services sectors were stable within the top four from 2007 to 2018, all of which have high reliance on specific production factors. Meanwhile, they are the downstream sectors of the main output sectors; therefore, these have a higher intermediate virtual water scarcity risk input.
- (iii)
- Compared with the output, the peak value of ratio of virtual water scarcity risk input to industry gross product is lower, and the variance is smaller. The virtual water scarcity risk transmitted from upstream is significantly dispersed after the intermediate input process. This indicates that the rich import relationships are conducive to reducing the risk transmitted by upstream water shortages; thus, it is necessary to promote balanced market development and close production linkages among various sectors.
- (iv)
- Although the water-use efficiency of all sectors in China increased steadily from 2007 to 2008, the overall input concentration of virtual water scarcity risk showed a rising trend, reflecting the gradual increase in the vulnerability of the industrial chain to water shortage. While focusing on economic development, attention should also be paid to industrial restructuring to ensure the sustainable utilization of resources and enhance economic resilience. After the industrial structure reform policies established in 2017, the Herfindahl index was still increasing in certain sectors, notably the food and tobacco, non-metallic mining, oil and gas, and metal mining, metal mining, gas water supply, and restaurant and accommodation sectors, etc. In 2018, the Herfindahl index values for the food and tobacco, agriculture, apparel leather, woodworking and furniture, and restaurant and accommodation sectors were still significantly higher than those of other sectors. Additional efforts are needed to reduce the water dependence of these industries and their upstream industries.
- (v)
- Despite water-use efficiency suggesting water resources should be prioritized to meet the water needs of service and industrial sectors with higher economic efficiency, water allocation should not take this as a one-sided standard. From the perspective of intermediate inputs for industry production, the water needs of major virtual water scarcity risk output sectors such as agriculture, chemical industry, and electricity and heat supply should be satisfied. This is to avoid the chain economic loss occurring in downstream sectors due to their reduced production once impacted by water scarcity.
In summary, through the study of China’s intermediate virtual water trade and the transfer of water scarcity risk across sectors, this paper concludes that reducing the virtual water scarcity risk existing in the trade chain needs to be carried out from two aspects. First, it is necessary to reduce the water scarcity risk output from upstream source sectors by ensuring their water supply and improving their efficiency. Second, it is of great importance to enrich intersectoral production linkages and diversify import sources to enhance the resistance of downstream sectors to cope with virtual water scarcity risks. The findings of this paper provide a reference for addressing the potential risks in the economic system due to water scarcity, and support the rational allocation of water resources among sectors.
Author Contributions
Conceptualization, Y.Z.; Methodology, X.N., H.X. and W.D.; Formal analysis, W.D.; Investigation, W.D. and L.Z.; Data curation, H.X. and Y.S.; Writing—original draft, X.N.; Writing—review & editing, X.N. and Y.Z.; Visualization, X.N. and Y.S.; Supervision, Y.Z.. All authors have read and agreed to the published version of the manuscript.
Funding
This research was funded by the National Key R&D Program of China grant number No.2017YFA0603704.
Institutional Review Board Statement
Not applicable.
Informed Consent Statement
The study did not involve humans.
Data Availability Statement
The data presented in this study are available in Section 2.1. Data.
Conflicts of Interest
The authors declare no conflict of interest.
References
- Oki, T.; Kanae, S. Global Hydrological Cycles and World Water Resources. Science 2006, 313, 1068–1072. [Google Scholar] [CrossRef] [PubMed]
- World Economic Forum. Global Risks 2017; World Economic Forum: Cologny, Switzerland, 2017. [Google Scholar]
- Zhao, D.; Liu, J.; Yang, H.; Sun, L.; Varis, O. Socioeconomic drivers of provincial-level changes in the blue and green water footprints in China. Resour. Conserv. Recycl. 2021, 175, 105834. [Google Scholar] [CrossRef]
- Gleick, P.H.; Cooley, H. Freshwater Scarcity. Annu. Rev. Environ. Resour. 2021, 46, 319–348. [Google Scholar] [CrossRef]
- Alexoaei, A.P.; Cojanu, V.; Coman, C.-I. On Sustainable Consumption: The Implications of Trade in Virtual Water for the EU’s Food Security. Sustainability 2021, 13, 11952. [Google Scholar] [CrossRef]
- Huang, H.; Jiang, S.; Gao, X.; Zhao, Y.; Lin, L.; Wang, J.; Han, X. The Temporal Evolution of Physical Water Consumption and Virtual Water Flow in Beijing, China. Sustainability 2022, 14, 9596. [Google Scholar] [CrossRef]
- Orr, S.; Cartwright, A. Water scarcity risks: Experience of the private sector. In Re-thinking Water and Food Security; CRC Press: Boca Raton, FL, USA, 2010. [Google Scholar]
- Falkenmark, M. Growing water scarcity in agriculture: Future challenge to global water security. Philos. Trans. R. Soc. A Math. Phys. Eng. Sci. 2013, 371, 20120410. [Google Scholar] [CrossRef]
- Lenzen, M.; Moran, D.; Bhaduri, A.; Kanemoto, K.; Bekchanov, M.; Geschke, A.; Foran, B. International trade of scarce water. Ecol. Econ. 2013, 94, 78–85. [Google Scholar] [CrossRef]
- Vörösmarty, C.J.; Hoekstra, A.Y.; Bunn, S.E.; Conway, D.; Gupta, J. Fresh water goes global. Science 2015, 349, 478–479. [Google Scholar] [CrossRef]
- Zhao, H.; Qu, S.; Liu, Y.; Guo, S.; Zhao, H.; Chiu, A.C.F.; Liang, S.; Zou, J.-P.; Xu, M. Virtual water scarcity risk in China. Resour. Conserv. Recycl. 2020, 160, 104886. [Google Scholar] [CrossRef]
- Qu, S.; Liang, S.; Konar, M.; Zhu, Z.; Chiu, A.S.F.; Jia, X.; Xu, M. Virtual Water Scarcity Risk to the Global Trade System. Environ. Sci. Technol. 2018, 52, 673–683. [Google Scholar] [CrossRef]
- Gain, A.K.; Giupponi, C. A dynamic assessment of water scarcity risk in the Lower Brahmaputra River Basin: An integrated approach. Ecol. Indic. 2015, 48, 120–131. [Google Scholar] [CrossRef]
- United Nations Development Programme. Human Development Report 2006; Human Development Report Office: New York, NY, USA, 2006. [Google Scholar]
- Hoekstra, A.Y. Water scarcity challenges to business. Nat. Clim. Change 2014, 4, 318–320. [Google Scholar] [CrossRef]
- Schyns, J.F.; Hamaideh, A.; Hoekstra, A.Y.; Mekonnen, M.M.; Schyns, M. Mitigating the Risk of Extreme Water Scarcity and Dependency: The Case of Jordan. Water 2015, 7, 5705–5730. [Google Scholar] [CrossRef]
- DeNicola, E.; Aburizaiza, O.S.; Siddique, A.; Khwaja, H.; Carpenter, D.O. Climate Change and Water Scarcity: The Case of Saudi Arabia. Ann. Glob. Health 2015, 81, 342–353. [Google Scholar] [CrossRef]
- Hoekstra, A.Y.; Mekonnen, M.M. Imported water risk: The case of the UK. Environ. Res. Lett. 2016, 11, 055002. [Google Scholar] [CrossRef]
- Rushforth, R.R.; Ruddell, B.L. The vulnerability and resilience of a city’s water footprint: The case of Flagstaff, Arizona, USA. Water Resour. Res. 2016, 52, 2698–2714. [Google Scholar] [CrossRef]
- Chini, C.M.; Konar, M.; Stillwell, A.S. Direct and indirect urban water footprints of the United States. Water Resour. Res. 2017, 53, 316–327. [Google Scholar] [CrossRef]
- Djehdian, L.A.; Chini, C.M.; Marston, L.; Konar, M.; Stillwell, A.S. Exposure of urban food–energy–water (FEW) systems to water scarcity. Sustain. Cities Soc. 2019, 50, 101621. [Google Scholar] [CrossRef]
- Zhao, H.; Qu, S.; Guo, S.; Zhao, H.; Liang, S.; Xu, M. Virtual water scarcity risk to global trade under climate change. J. Clean. Prod. 2019, 230, 1013–1026. [Google Scholar] [CrossRef]
- Cao, T.; Wang, S.; Chen, B. Water shortage risk transferred through interprovincial trade in Northeast China. Energy Procedia 2019, 158, 3865–3871. [Google Scholar] [CrossRef]
- Yao, X.; Tang, X.; Farnoosh, A.; Feng, C. Quantifying virtual water scarcity risk transfers of energy system in China. Environ. Econ. Policy Stud. 2021, 23, 945–969. [Google Scholar] [CrossRef]
- Wang, L.; Li, Y.; Liang, S.; Xu, M.; Qu, S. Trade-related water scarcity risk under the Belt and Road Initiative. Sci. Total Environ. 2021, 801, 149781. [Google Scholar] [CrossRef] [PubMed]
- Markusen, J.R. Trade in Producer Services and in Other Specialized Intermediate Inputs. Am. Econ. Rev. 1989, 79, 85–95. [Google Scholar]
- Liu, X.; Du, H.; Zhang, Z.; Crittenden, J.C.; Lahr, M.L.; Moreno-Cruz, J.; Guan, D.; Mi, Z.; Zuo, J. Can virtual water trade save water resources? Water Res. 2019, 163, 114848. [Google Scholar] [CrossRef] [PubMed]
- Wu, X.D.; Guo, J.L.; Li, C.H.; Shao, L.; Han, M.Y.; Chen, G.Q. Global socio-hydrology: An overview of virtual water use by the world economy from source of exploitation to sink of final consumption. J. Hydrol. 2019, 573, 794–810. [Google Scholar] [CrossRef]
- National Bureau of Statistics of China. China Statistical Yearbook 2018; National Bureau of Statistics of China: Beijing, China, 2018.
- National Bureau of Statistics of China. China Statistical Yearbook 2010; National Bureau of Statistics of China: Beijing, China, 2010.
- National Bureau of Statistics of China. China Statistical Yearbook 2007; National Bureau of Statistics of China: Beijing, China, 2007.
- National Bureau of Statistics of China. China Statistical Yearbook 2012; National Bureau of Statistics of China: Beijing, China, 2012.
- China Statistical Yearbook 2015; National Bureau of Statistics of China: Beijing, China, 2015.
- National Bureau of Statistics of China. China Statistical Yearbook 2017; National Bureau of Statistics of China: Beijing, China, 2017.
- China Statistical Press. China Economic Census Yearbook; China Statistical Press: Beijing, China, 2008. [Google Scholar]
- Standardization Administration of China. General Administration of Quality Supervision, Inspection and Quarantine of the People’s Republic of China, Industrial Classification for National Economic Activities; Standardization Administration of China: Beijing, China, 2017. [Google Scholar]
- Hubacek, K.; Sun, L. Economic and Societal Changes in China and their Effects on Water Use A Scenario Analysis. J. Ind. Ecol. 2008, 9, 187–200. [Google Scholar] [CrossRef]
- Guan, D.; Hubacek, K. Assessment of regional trade and virtual water flows in China. Ecol. Econ. 2007, 61, 159–170. [Google Scholar] [CrossRef]
- Leontief, W. Input-Output Economics; Oxford University Press: Oxford, UK, 1986; Available online: https://books.google.com.hk/books?id=HMnQCwAAQBAJ (accessed on 29 December 2022).
- Ghosh, A. Input-Output Approach in an Allocation System. Economica 1958, 25, 58–64. [Google Scholar] [CrossRef]
- Zhang, H. Supply-side Structural Reform: New Practice under the “New Normal”. China Today, 31 July 2017. [Google Scholar]
- Lenzen, M.; Foran, B. An input–output analysis of Australian water usage. Water Policy 2001, 3, 321–340. [Google Scholar] [CrossRef]
- Zhao, X.; Chen, B.; Yang, Z.F. National water footprint in an input-output framework—A case study of China 2002. Ecol. Model. 2009, 220, 245–253. [Google Scholar] [CrossRef]
- Velázquez, E. An input-output model of water consumption: Analysing intersectoral water relationships in Andalusia. Ecol. Econ. 2006, 56, 226–240. [Google Scholar] [CrossRef]
- Duarte, R.; Sánchez-Chóliz, J.; Bielsa, J. Water use in the Spanish economy: An input-output approach. Ecol. Econ. 2002, 43, 71–85. [Google Scholar] [CrossRef]
- Sonderegger, T.; Pfister, S.; Hellweg, S. Criticality of Water: Aligning Water and Mineral Resources Assessment. Environ. Sci. Technol. 2015, 49, 12315–12323. [Google Scholar] [CrossRef]
Disclaimer/Publisher’s Note: The statements, opinions and data contained in all publications are solely those of the individual author(s) and contributor(s) and not of MDPI and/or the editor(s). MDPI and/or the editor(s) disclaim responsibility for any injury to people or property resulting from any ideas, methods, instructions or products referred to in the content. |
© 2023 by the authors. Licensee MDPI, Basel, Switzerland. This article is an open access article distributed under the terms and conditions of the Creative Commons Attribution (CC BY) license (https://creativecommons.org/licenses/by/4.0/).