Abstract
Rewetting peatland is an ongoing effort in Indonesia to restore the hydrological cycle and carbon balance of the ecosystem. However, quantifying the impact of rewetting on mitigating fire remains a challenge. Here, we assess the impact of large-scale rewetting on fire risks and occurrences (duration, coverage area, and the number of events) in 2015–2021. The weather research and forecasting (WRF) model was integrated with a drought–fire model to spatially quantify fire hazards in Riau, Sumatra. The results show that rewetting has resulted in decreasing the frequency of extreme events in the study area (pre- and post-rewetting, respectively, were seven and four events). Although the area influenced by extreme events reduced following rewetting by 5%, the mean duration of extreme events increased. Our findings reveal that widespread prolonged extreme fire hazards only occurred during drying El Niño events in 2015 and 2019. The findings obtained in this case study provide quantitative evidence of the reduced fire hazard resulting from peat restoration in Indonesia. Further, the findings assist in assessing the success of peatland restoration programs and improve our knowledge of the ability to monitor and forecast fire risks in tropical peatlands.
1. Introduction
More than 4 million hectares of peatland in Indonesia have been subjected to anthropogenic disturbance [1]. Large-scale drainage for agriculture and forestry plantations is the main cause of peat degradation and subsequent deprivation of peatland ecosystem services in Indonesia. Following drainage, the loss of water triggered peat subsidence and mineralization that alters peat hydrological properties [2,3]. The long-term effect of such disturbance is a reduction of hydrological function [4]. Subsequently, this leads to peatland vulnerability, as indicated by recurrent wildfires in Sumatra and Kalimantan peatlands in the past decade [5]. Recent peatland fires in Indonesia resulted in an economic loss up to USD 93 billion [6]. Furthermore, peat degradation resulted in enhanced peat oxidation and reduced biodiversity that alters the capability of peatlands to sequester carbon.
Changes in hydrological characteristics due to natural or anthropogenic factors have greatly influenced peatland behavior. Research revealed that the alteration of peatland hydrology could enhance carbon emissions [7], and this phenomenon is clearly observed in drained peatland [8,9]. High peat humification also affects hydrology by altering peat water retention properties and accelerating water table drawdown [10]. In turn, the dynamics of the water table greatly influenced the net warming impact of greenhouse gas emission [9,11]. Additionally, research revealed that frequent fires in Indonesian peatlands were associated with drying peatland through intensive canal drainage [12,13].
Efforts have been conducted to restore the hydrological functions of peatlands, including blocking drainage canals. Canal blocking could increase peat moisture and the water table, but the negative impact of increased subsidence near the canal cannot be avoided [14]. Peatland hydrology was improved after restoration as reported in tropical [15] and boreal [16] peatlands, such as an increased water storage capacity, more inundation events, and low diurnal water table fluctuation. Canal blocking has been adopted to rewet Indonesian peatlands and has been occurring since the early 2000s. There are emergent studies on the rewetting impacts on hydrology and carbon emission [17,18], but there is a lack of quantitative studies on its impact on peat fire.
Since the number of local meteorological stations in Indonesian peatlands is sparse, their ability to provide regional climate variations is limited by their coarse resolution. The weather research and forecasting (WRF) model, an open-source atmospheric simulation model that integrates regional land–atmosphere phenomena [19], can overcome many limitations of the observed stations in providing information relevant to local and regional fire management at a finer spatial scale. WRF has widely been applied in fire research by providing weather input data of drought–fire models, such as in Australia [20], Poland [21], and the United States [22]. In Indonesia, the applicability of the WRF of fire assessment has been initiated recently in Sumatra peatlands [23,24].
This study aims to investigate the impact of peatland rewetting on peat fire occurrences in Riau province, Indonesia. We evaluate this using an integration of the weather and research forecasting (WRF) model and a drought–fire model to simulate weather and peatland conditions from 2015 to 2021 in Riau province, Indonesia.
2. Materials and Methods
2.1. Study Area
Riau has one of the largest peatland areas on the eastern coast of Sumatra that covers an area of 3.57 M Ha (61% of peat area in Sumatra) with a thickness of up to 7–10 m [25]. Most peatland areas in Riau have been utilized for agriculture and forestry plantations and only hold the remnants of pristine peat swamp forests [1]. We selected the study area (Figure 1, red polygon) for assessing fire hazard in peat-dominated landscapes. Rewetting peatland by canal blocking has been initiated since the end of 2018 by the Indonesian peat restoration agency (BRGM) in the study area.
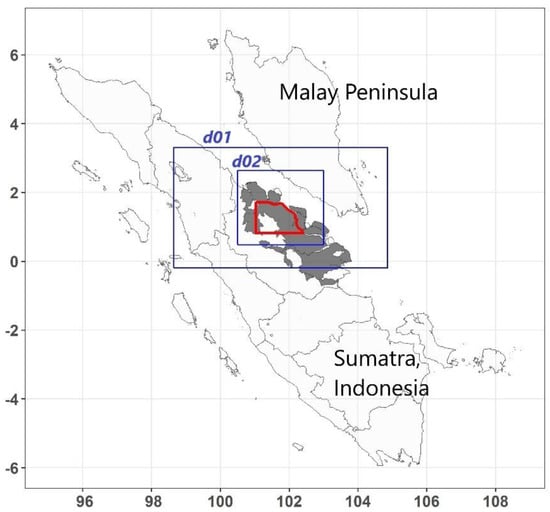
Figure 1.
Location of study area in Riau province, Indonesia, as shown by a red polygon. The study site is within WRF domain 2 (blue box, d02), which has a spatial resolution of 5 km. For domain 1 (d01), the spatial resolution is 15 km. Peatland area is indicated by dark gray color. X- and Y-axis represent the longitude and latitude of geographic coordinate system.
2.2. Model Setup and Input
The Weather Research and Forecasting model (WRF) is the longest-lasting and most advanced numerical weather prediction system. Since its development in 2001, the WRF model has been widely used for a broad range of applications across different topics [23,26,27,28,29].
Advance Research WRF model version 4.0 was used for weather simulation at horizontal and vertical grids. The simulation was performed on two-nested domains with horizontal spatial resolutions of 15 km and 5 km, respectively, for outer domain 1 and inner domain 2 (Figure 1). The WRF domain covered part of the Riau province, Indonesia, and Malay peninsula, as well as parts of the surrounding Malaka Strait (−0.193° S to 3.314° N, 98.646° W to 104.854° E). In the vertical direction, 35 sigma levels were identified for all domains, with the top fixed at 1 hPa. For domain 2, in total, there were 514 horizontal grids that we focused on for analysis.
The physical parameterization schemes of the WRF model were given as follows (Table 1): (1) the Eta scheme for microphysics; (2) the New Goddard scheme for shortwave radiation; (3) the RRTM scheme for longwave radiation; (4) the Monin–Obukhov scheme for surface layer; (5) the Mellor–Yamada–Janjic planetary boundary layer scheme; (6) the Unified Noah-LSM scheme for land surface process; and (7) the Grell–Devenyi ensemble scheme for cumulus parameterization.

Table 1.
Model domain setting for weather research forecasting (WRF) simulation used in the study.
Reanalysis data from the Global Forecast System (GFS) at the spatial resolution of 0.25° and temporal resolution of 3 h ftp://nomads.ncdc.noaa.gov/GFS/ (accessed on 11 July 2022) is an input for the initial and lateral boundary conditions. The simulations were conducted from 1 January 2015 to 31 December 2021.
2.3. Fire Hazard Assessment
We employed the drought–fire index, which was specifically developed for tropical peatland, called Peat Fire Vulnerability Index (PFVI) for assessing fire hazard (Equation (1)). The index ranges from 0 to 300, where 0 means no moisture deficiency and 300 reflects the highest moisture depletion [37].
PFVI represents the hazard index at day t. The DF is drought factor, which represents water loss through evapotranspiration (Equation (2)). The rainfall factor (RF) is computed based on Equation (3). The PFVI is initialized when the soil is close to saturation level (value = 0).
The DF depends on daily max air temperature . R0 represents annual rainfall in the study site, which is ca. 2500 mm. The RF depend on daily rainfall (Equation (3)).
The water table factor (WTF) that represents the contribution of the groundwater table to the upper moisture content is calculated in Equation (4). Here, we assumed that soil moisture derived from WRF represents this contribution. The model has been validated in Indonesian peatlands for the assessment of peat moisture and fire risks [37].
The output WRF used in the study were three variables, namely max air temperature, rainfall, and soil moisture. We corrected daily temperature and rainfall from WRF output with the observed data from nearby local weather station in Pekanbaru. The corrected temperature and rainfall were used to calculate drought factor (Equation (2)) and rainfall factor (Equation (3)), respectively.
Soil moisture was a proxy for water table (Equation (4)). In this research, we followed the approach proposed by Sanusi et al. [23] that used characteristics of peat water retention to determine the top and lower boundary of moisture (water suction at saturation and wilting point, respectively). Then, we rescaled the distribution of soil moisture at each grid as an input for Equation (4). The use of WRF output was to overcome local and regional variations in weather and climate at a spatial scale that the local meteorological station is not able to perform.
For each grid, the daily PFVI was assigned to one of the fire hazards classes: low (0–75), moderate (76–150), high (151–225), or extreme (226–300). In this study, we only focused on the extreme class, as it potentially triggers fire occurrence over large areas [37].
2.4. Assessment on the Rewetting Impcat
The rewetting impact on fire hazard was assessed by comparing fire characteristics between pre- (until 2018) and post-rewetting (after 2018). Two fire characteristics, namely coverage area (%) and duration (days), were identified. We focused on the fire hazard in the extreme class (PFVI > 225), which potentially caused peat fire burning.
We quantified the proportion of grid cells in the study area for which the daily PFVI was in the extreme class, and we defined this proportion as the coverage area with extreme hazard. The daily percentage area in extreme hazard () for the whole of study site for day was calculated in Equation (5):
where describes whether a grid cell for day is in extreme class; Ng is number of grid cells covering study area. Peat fire may occur when groundwater tables fall below 60 cm depth, which is equal to extreme class (PFVI > 225) [37]. Here, we determined that large fires might occur when 50% area has extreme hazard class and it has lasted for at least 5 days, consecutively.
During the study period, ENSO influence was prevalent, such as El Niño in 2015 and 2019 and La Niña in 2016–2018 and 2021 https://ggweather.com/enso/oni.htm (accessed on 4 November 2022). All analysis and figures in the study were performed in R computational language [38] with several packages including tidyverse [39] and raster [40].
2.5. Fire Hotspots
During the simulation period, many fire events occurred within the study area and its surroundings. We used fire hotspot data to verify the index performance for class of extreme hazard. Historical fire hotspots were widely applied to verify the fire events in case of no records of fire occurrences [41,42]. Fire hotspot data were derived from Moderate Resolution Imaging Spectroradiometer (MODIS) Collection 6, shortened to MCD14ML, available from NASA website https://firms.modaps.eosdis.nasa.gov/download/ (accessed on 4 November 2022). The hotspots are an indication of fire location detected by MODIS infrared and thermal bands at daily 1 km spatial resolution. Total hotspots each month were computed by considering only data with at least 80% confidence level within and at a 10 km buffer area from the study site.
3. Results
3.1. Rainfall Condition for the Study Site
The study area received a huge amount of rainfall annually; on average, between 1890 and 3092 mm based on the output of the weather and forecasting (WRF) model for 2015–2021. Annual rainfall varied between 514 grids, which depended on global climate condition. The lowest annual rainfall was in 2015, coinciding with the strong El Niño event, followed by annual rainfall in 2019 (1916 mm, weak El Niño). The highest annual rainfall fell in La Niña in 2017 and 2021 (3092 and 3032 mm, respectively). This amount was in accordance with the local weather station, which recorded an annual mean rainfall of 25 mm.
On a monthly scale, rainfall variability was very large as indicated by spreads of rainfall across grids (Figure 2). Monthly rainfall over 400 mm (median) was recorded several times, such as in November 2015, November 2016, March 2017, and December 2018 (Figure 2). Monthly rainfall below 100 cm was occasionally recorded, especially during peak dry season in July-September. Low rainfall was also registered in February. For example, during the El Niño in 2019, cumulative rainfall for July–September was below 200 mm, whereas monthly rainfall in February 2015 was below 30 mm.
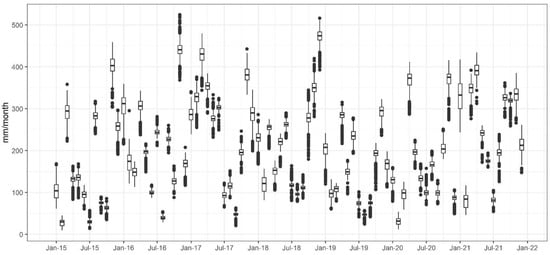
Figure 2.
Timeseries of monthly rainfall for 2015–2021 in the study site. Each boxplot represents monthly rainfall data from 514 grids. The boxplot denotes the 25% quantiles, the median, and 75% quantiles. The 10 and 90% quantiles are indicated by the whisker, while dots indicate outliers.
3.2. Characteristics of Extreme Hazard
We calculated the fire vulnerability based on our drought–fire model (Equations (1)–(4)). Then, we focused on the fire vulnerability that can easily trigger peat fire ignition, namely classed as extreme hazard. Table 2 presents the characteristics of a continuous extreme class comprising the duration and coverage area. In the pre-rewetting period (2015–2018), there were seven extreme events on average, twice a year except in 2018. However, the record in 2018 lasted less than a week (6 days, Table 2). The results also found that the duration of the extreme class linearly related to its coverage area. For instance, short extreme class events at the end of August 2018 covered 79.7% of the area, and it sharply increased to 95% during a prolonged extreme class (37 days) in the peak dry season of 2015.
Table 2.
Characteristics of fire vulnerability at extreme class for 2018-2021 by considering events that occurred over 50% area.
Extreme class events were triggered by prolonged low rainfall below 100 mm/month that occurred over large areas, such as in July 2015 and September 2017 (Figure 2). When monthly rainfall is about 100 mm, extreme class events might occur but in short duration, such as in the end of August 2018 (5 days). The coverage area during pre-rewetting was between 79.7–95%, and the mean duration of the extreme class was 19 days.
After rewetting, the frequency of continuous extreme class declined by 40% (4 events) over 2019 to 2021. Prolonged and extensive extreme class was recorded for over 2 months in the dry season of 2019. The extensive extreme class occurred from the beginning of August to mid-October 2019 (74 days, Table 2) and covered more than 93% of the study area. The worst condition was in July-August 2019, with rainfall below 100 mm/month (Figure 2). Overall, the mean coverage area for post-rewetting was 84.2%, whereas the mean duration of extreme hazard was around 30 days (Table 2).
Our results found that rewetting reduced the area of the prolonged extreme hazard. The data indicated a linear trend, as shown by the decreased in extreme hazard area since 2015 (Figure 3a-area). However, the average area post-rewetting was only 5% lower than pre-rewetting (Table 2).
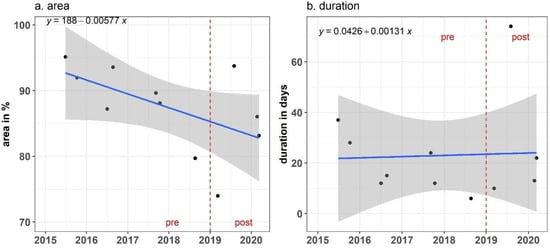
Figure 3.
Events of extreme fire hazard for 2015–2021, which occurred over 50% of the study area. The events were based on the peat fire vulnerability index under pre- and post-rewetting: (a) proportion of area (%); (b) duration of events (days). The vertical red dashed line indicates the period when the rewetting program was initiated.A linear trend is indicated by a blue line with 95% confidence interval (shadow). There were no extreme events in 2021.
For the duration, it is likely that rewetting does not significantly influence over a large area. Prolonged extreme events (74 days in a row) in the peak dry season of 2019 were triggered by a consistently low rainfall below 100 mm/month for July-September 2019. The prolonged extreme hazard of more than 1 month only occurred during the peak dry season that coincided with El Niño (such as in 2015 and 2019). Thus, rewetting did not influence the duration of extreme hazards, as shown by a small slope in the linear trend for the duration (Figure 3b).
3.3. Verification of Fire Hazard
In 2015, 961 hotspots were recorded from June to October 2015. Fire hotspots were associated with a high and extreme fire hazard class (FVI > 150), yet the average PFVI value exceeded 170. Of the 961 hotspots, more than 68% coincided with an extreme fire hazard (PFVI > 225), and the remaining fell in high hazard class. However, the number of hotspots decreased when 80% of confidence levels were applied (224 hotspots).
Most fire hotspots were concentrated in July 2015 (600 hotspots), followed by June and September 2015. In July 2015, hotspots were more concentrated in the northern part of the area, with the remaining hotspots widespread randomly throughout the study area (Figure 4a). In July 2015, the average monthly rainfall declined to below 100 mm throughout the area (Figure 2). The low rainfall below 100 mm was also observed in June and September 2015.
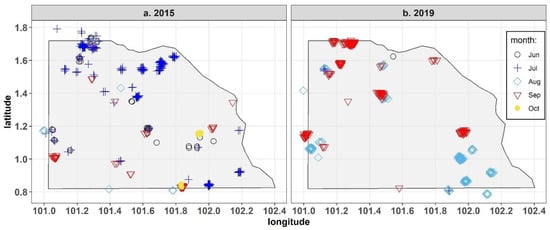
Figure 4.
The monthly number of hotspots (confidence level ≥ 80%) observed within the study area and its surroundings from June to October in 2015 and 2019. These years were chosen as both were particularly fire-prone on account of El Niño events.
In 2019, prolonged low rainfall (<100 mm/month) was observed throughout the study area in July-September. As a result, widespread fires erupted as characterized by abundant hotspots, reaching 790 events. Most hotspots were concentrated in August-September (97%), with the remaining few hotspots in June-July (Figure 4b). Of the 790 events, 80% hotspots coincided with the extreme hazard (PFVI > 225 by over 50% area), and the remaining hotspots fell in the high hazard class.
4. Discussion
In this study, we tested and applied the WRF to assess the impact of peat restoration project activity in Indonesia via rewetting on fire occurrences. We selected the study area in the Riau peatlands (Figure 1), in which rewetting peatland by BRGM (Indonesian peat restoration agency) has been implemented. Rewetting in the study area was performed through canal blocking in drained peatlands [17,18]. We assessed fire hazard behavior before and after rewetting peatlands. Here, the WRF provides daily climate data (2015–2021) for peat hazard calculation. The findings obtained in the case study will benefit and improve our knowledge of the assessment of peat restoration project activity in Indonesia.
Peat fires in Indonesia occur annually [41,43]. Research showed that fires occurred more frequently when the groundwater table was deeper than 60 cm, under the extreme hazard class [37]. Therefore, in this paper, we focused on the prolonged extreme class events, which widely occurred in at least 50% of the study area. The findings showed that rewetting peatlands has contributed to reducing the fire area and the number of events (Table 2). The area reduction might not be significant (~5%), but the number of events was greatly reduced by about 40%. This finding confirmed the reduction of fire occurrences due to restoration activities, as reported earlier in Central Kalimantan [44].
4.1. Spatiotemporal Variation
Figure 5 presents the monthly dynamics of fire hazards during the dry season in 2015–2021. Fires were recorded annually regardless of La Niña years, such as in 2017–2018 and 2021 as indicated by fire hotspots. Although peat fires were recorded each year, extreme events only occurred during El Niño years. Extensive extreme events recorded in 2015 and 2019 were triggered by deficient rainfall below 100 mm/month (Figure 2). During La Niña years, extreme events were rarely observed, especially in 2016, 2018, and 2021.
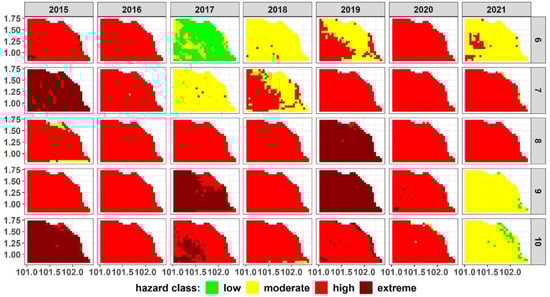
Figure 5.
Spatial–temporal evolution of fire hazard during the dry seasons in 2015–2021. The hazard is calculated as the monthly average of the peat fire vulnerability index (PFVI) for each grid.
Rainfall over the study area is influenced by the complex land–sea–atmospheric interaction, especially the zonal circulation in the equator. Drought-contributing fires have been attributed mainly to El Niño conditions [45]; however, the role of Indian Ocean Dipole (IOD) to drying peatland was also suggested [46,47,48]. Warm sea surface temperature in the western Indian and Pacific Oceans decreases moisture convergence over Indonesia [28,49], thus significantly reducing wet spells in July–October.
4.2. Limitations
While the model was able to simulate fire risk, there are potential drawbacks to this study. First, the land–surface model (Table 1) used in the WRF model relies on parameters designed for mineral soils. Soil moisture flux controlling drying surface depends on soil-hydrology characteristics (water retention and hydraulic conductivity) that varies across soil types [50,51]. Physical characteristics of peat include the rapid transport of water over long distances [52]; therefore, it may accelerate water loss in response to dry spells or drainage canals [10]. This implies that the extreme fire hazard in our study may be underpredicted to some extent.
Second, we calibrated rainfall data based on the availability of the overserved rainfall in Pekanbaru airport, >100 km distance from the study area. This may disregard local influences of the spatiotemporal variability of rainfall over the study area. More local rainfall stations are required to improve the WRF estimates on daily intervals. The sophisticated spatial rainfall data, such as those derived from TRMM, JSMAP, and other satellite products, are good options for evaluating the rainfall estimates, although they also have some discrepancies [53,54] as they depend on local calibration as well.
Third, our simulation was in the period of strong ENSO (either El Niño or La Niña) events. Four out of seven years in the study period were categorized as La Niña years (2016/17, 2017/18, 2020/21, and 2021/22). During La Niña, more wet spells are recorded for July-October, and heavy rainfall and flooding occur more frequently [55,56]. Therefore, fewer extreme events occurred in that period, which has driven the decreasing trend, as shown in Figure 3a. This suggests that our findings may underestimate extreme hazards under normal climate years.
Anticipating uncertainty related to future fire risk in tropical peatlands, such a development of a fire assessment tool may play an increasingly important role in the human-dominated landscape. Findings presented here suggest that the integration of numerical weather prediction (such as WRF) may benefit fire prevention and peat restoration. In the long run, it can raise awareness from key stakeholders working on peatlands. Restoration can only be successful if any key stakeholders working on peatlands are actively involved in the planning and implementation of restoration measures.
5. Conclusions
Degraded peatlands triggered fire outbreaks, and thus there is an urgent need to restore them by rewetting. However, quantifying the impact of rewetting on fire occurrences remains a challenge. This study made the first attempt by integrating weather and drought–fire models to assess the impact of rewetting peatland on extreme occurrences. Our findings showed that rewetting peatlands caused the number of extreme fire events to drop significantly. However, the duration of extreme events was controlled by the weather and not influenced by rewetting. Further, ENSO triggering fires were evident in the study site. This model can be used to assess the success of regional peatland rewetting on hydrological cycles and fire risks prevention. Finally, the research demonstrates that the daily weather model combined with a drought–fire model can be used to raise fire risk alarms for fire prevention and peat restoration. In the long run, such a system can be used to monitor and forecast peatland fire risk across the tropical region and contribute to raising awareness among key stakeholders.
Author Contributions
Conceptualization, M.T., I.P.S.; methodology, M.T. and M.H.; writing—original draft preparation, M.T., M.H., and M.T.W.; writing—review and editing, M.T.; visualization, M.T.; project administration, M.T.W.; funding acquisition, M.T., I.P.S., and C.A. All authors have read and agreed to the published version of the manuscript.
Funding
The research was funded by DIKTI, Ministry of Education, Culture, Research, and Technology, Indonesia (contract: 3550/IT3.L1/PT.01.03/P/B/2022).
Institutional Review Board Statement
Not applicable.
Informed Consent Statement
Not applicable.
Data Availability Statement
The data presented in this study are available upon request from the corresponding author. The data are not publicly available due to shared ownership between all parties that contributed to the research.
Acknowledgments
The authors thank DIKTI, Ministry of Education, Culture, Research, and Technology, Indonesia for funding this research (contract: 3550/IT3.L1/PT.01.03/P/B/2022). We thank Budiman Minasny (the University of Sydney) and David Large (Nottingham University) for their comments and input to the original manuscript.
Conflicts of Interest
The authors declare no conflict of interest.
References
- Miettinen, J.; Shi, C.; Liew, S.C. Land Cover Distribution in the Peatlands of Peninsular Malaysia, Sumatra and Borneo in 2015 with Changes since 1990. Glob. Ecol. Conserv. 2016, 6, 67–78. [Google Scholar] [CrossRef]
- Liu, H.; Lennartz, B. Hydraulic Properties of Peat Soils along a Bulk Density Gradient—A Meta Study. Hydrol. Process. 2019, 33, 101–114. [Google Scholar] [CrossRef]
- Silins, U.; Rothwell, R.L. Forest Peatland Drainage and Subsidence Affect Soil Water Retention and Transport Properties in an Alberta Peatland. Soil Sci. Soc. Am. J. 1998, 62, 1048–1056. [Google Scholar] [CrossRef]
- Luscombe, D.J.; Anderson, K.; Grand-Clement, E.; Gatis, N.; Ashe, J.; Benaud, P.; Smith, D.; Brazier, R.E. How Does Drainage Alter the Hydrology of Shallow Degraded Peatlands across Multiple Spatial Scales? J. Hydrol. 2016, 541, 1329–1339. [Google Scholar] [CrossRef]
- Vetrita, Y.; Cochrane, M.A. Fire Frequency and Related Land-Use and Land-Cover Changes in Indonesia’s Peatlands. Remote Sens. 2019, 12, 5. [Google Scholar] [CrossRef]
- Kiely, L.; Spracklen, D.V.; Arnold, S.R.; Papargyropoulou, E.; Conibear, L.; Wiedinmyer, C.; Knote, C.; Adrianto, H.A. Assessing Costs of Indonesian Fires and the Benefits of Restoring Peatland. Nat Commun 2021, 12, 7044. [Google Scholar] [CrossRef]
- Hu, Y.; Christensen, E.G.; Amin, H.M.; Smith, T.E.; Rein, G. Experimental Study of Moisture Content Effects on the Transient Gas and Particle Emissions from Peat Fires. Combust. Flame 2019, 209, 408–417. [Google Scholar] [CrossRef]
- Manning, F.C.; Kho, L.K.; Hill, T.C.; Cornulier, T.; Teh, Y.A. Carbon Emissions From Oil Palm Plantations on Peat Soil. Front. For. Glob. Chang. 2019, 2, 37. [Google Scholar] [CrossRef]
- Prananto, J.A.; Minasny, B.; Comeau, L.-P.; Rudiyanto, R.; Grace, P. Drainage Increases CO2 and N2O Emissions from Tropical Peat Soils. Glob. Chang. Biol. 2020, 26, 4583–4600. [Google Scholar] [CrossRef]
- Taufik, M.; Veldhuizen, A.A.; Wösten, J.H.M.; van Lanen, H.A.J. Exploration of the Importance of Physical Properties of Indonesian Peatlands to Assess Critical Groundwater Table Depths, Associated Drought and Fire Hazard. Geoderma 2019, 347, 160–169. [Google Scholar] [CrossRef]
- Evans, C.D.; Peacock, M.; Baird, A.J.; Artz, R.R.E.; Burden, A.; Callaghan, N.; Chapman, P.J.; Cooper, H.M.; Coyle, M.; Craig, E.; et al. Overriding Water Table Control on Managed Peatland Greenhouse Gas Emissions. Nature 2021, 593, 548–552. [Google Scholar] [CrossRef] [PubMed]
- Konecny, K.; Ballhorn, U.; Navratil, P.; Jubanski, J.; Page, S.E.; Tansey, K.; Hooijer, A.; Vernimmen, R.; Siegert, F. Variable Carbon Losses from Recurrent Fires in Drained Tropical Peatlands. Glob. Chang. Biol 2016, 22, 1469–1480. [Google Scholar] [CrossRef] [PubMed]
- Taufik, M.; Setiawan, B.I.; Van Lanen, H.A.J. Increased Fire Hazard in Human-Modified Wetlands in Southeast Asia. AMBIO 2019, 48, 363–373. [Google Scholar] [CrossRef] [PubMed]
- Ritzema, H.; Limin, S.; Kusin, K.; Jauhiainen, J.; Wösten, H. Canal Blocking Strategies for Hydrological Restoration of Degraded Tropical Peatlands in Central Kalimantan, Indonesia. Catena 2014, 114, 11–20. [Google Scholar] [CrossRef]
- Jaenicke, J.; Englhart, S.; Siegert, F. Monitoring the Effect of Restoration Measures in Indonesian Peatlands by Radar Satellite Imagery. J. Environ. Manag. 2011, 92, 630–638. [Google Scholar] [CrossRef] [PubMed]
- Menberu, M.W.; Tahvanainen, T.; Marttila, H.; Irannezhad, M.; Ronkanen, A.-K.; Penttinen, J.; Kløve, B. Water-Table-Dependent Hydrological Changes Following Peatland Forestry Drainage and Restoration: Analysis of Restoration Success. Water Resour. Res. 2016, 52, 3742–3760. [Google Scholar] [CrossRef]
- Lestari, I.; Murdiyarso, D.; Taufik, M. Rewetting Tropical Peatlands Reduced Net Greenhouse Gas Emissions in Riau Province, Indonesia. Forests 2022, 13, 505. [Google Scholar] [CrossRef]
- Murdiyarso, D.; Lestari, I.; Hanggara, B.B.; Saragi-Sasmito, M.; Basuki, I.; Taufik, M. Managing Water Regimes: Controlling Greenhouse Gas Emissions and Fires in Indonesian Tropical Peat Swamp Forests. In Geophysical Monograph Series; Krauss, K.W., Zhu, Z., Stagg, C.L., Eds.; Wiley: New York, NY, USA, 2021; pp. 355–369. ISBN 978-1-119-63928-2. [Google Scholar]
- Powers, J.G.; Klemp, J.B.; Skamarock, W.C.; Davis, C.A.; Dudhia, J.; Gill, D.O.; Coen, J.L.; Gochis, D.J.; Ahmadov, R.; Peckham, S.E.; et al. The Weather Research and Forecasting Model: Overview, System Efforts, and Future Directions. Bull. Am. Meteorol. Soc. 2017, 98, 1717–1737. [Google Scholar] [CrossRef]
- Clarke, H.; Evans, J.P.; Pitman, A.J. Fire Weather Simulation Skill by the Weather Research and Forecasting (WRF) Model over South-East Australia from 1985 to 2009. Int. J. Wildland Fire 2013, 22, 739. [Google Scholar] [CrossRef]
- Mandal, A.; Nykiel, G.; Strzyzewski, T.; Kochanski, A.; Wrońska, W.; Gruszczynska, M.; Figurski, M.; Mandal, A.; Nykiel, G.; Strzyzewski, T.; et al. High-Resolution Fire Danger Forecast for Poland Based on the Weather Research and Forecasting Model. Int. J. Wildland Fire 2021, 31, 149–162. [Google Scholar] [CrossRef]
- Mölders, N. Suitability of the Weather Research and Forecasting (WRF) Model to Predict the June 2005 Fire Weather for Interior Alaska. Weather Forecast. 2008, 23, 953–973. [Google Scholar] [CrossRef]
- Sanusi, A.R.; Taufik, M.; Santikayasa, I.P. The Use of Weather Research and Forecasting Model to Predict Rainfall in Tropical Peatland: 1. Model Parameterization. J.Agromet 2021, 35, 49–59. [Google Scholar] [CrossRef]
- Lisnawati; Taufik, M.; Dasanto, B.D.; Sopaheluwakan, A. Fire Danger on Jambi Peatland Indonesia Based on Weather Research and Forecasting Model. Agromet 2022, 36, 1–10. [Google Scholar] [CrossRef]
- Anda, M.; Ritung, S.; Suryani, E.; Sukarman; Hikmat, M.; Yatno, E.; Mulyani, A.; Subandiono, R.E.; Suratman; Husnain. Revisiting Tropical Peatlands in Indonesia: Semi-Detailed Mapping, Extent and Depth Distribution Assessment. Geoderma 2021, 402, 115235. [Google Scholar] [CrossRef]
- Li, H.; Wolter, M.; Wang, X.; Sodoudi, S. Impact of Land Cover Data on the Simulation of Urban Heat Island for Berlin Using WRF Coupled with Bulk Approach of Noah-LSM. Theor. Appl. Climatol. 2018, 134, 67–81. [Google Scholar] [CrossRef]
- Mandel, J.; Amram, S.; Beezley, J.D.; Kelman, G.; Kochanski, A.K.; Kondratenko, V.Y.; Lynn, B.H.; Regev, B.; Vejmelka, M. Recent Advances and Applications of WRF–SFIRE. Nat. Hazards Earth Syst. Sci. 2014, 14, 2829–2845. [Google Scholar] [CrossRef]
- Ratna, S.B.; Ratnam, J.V.; Behera, S.K.; Tangang, F.T.; Yamagata, T. Validation of the WRF Regional Climate Model over the Subregions of Southeast Asia: Climatology and Interannual Variability. Clim. Res. 2017, 71, 263–280. [Google Scholar] [CrossRef]
- Wang, N.; Guo, H.; Jiang, F.; Ling, Z.H.; Wang, T. Simulation of Ozone Formation at Different Elevations in Mountainous Area of Hong Kong Using WRF-CMAQ Model. Sci. Total Environ. 2015, 505, 939–951. [Google Scholar] [CrossRef]
- Rogers, E.; Black, T.; Ferrier, B.; Lin, Y.; Parrish, D.; DiMego, G. Changes to the NCEP Meso Eta Analysis and Forecast System: Increase in Resolution, New Cloud Microphysics, Modified Precipitation Assimilation, Modified 3DVAR Analysis; NWS Technical Procedures Bulletin; NASA: Washington, DC, USA, 2001. [Google Scholar]
- Chou, M.D.; Suarez, M.J. A Solar Radiation Parameterization (CLIRAD-SW) Developed at Goddard Climate and Radiation Branch for Atmospheric Studies; NASA Technical Memorandum NASA/TM-1999-104606; NASA: Washington, DC, USA, 1999. [Google Scholar]
- Mlawer, E.J.; Taubman, S.J.; Brown, P.D.; Iacono, M.J.; Clough, S.A. Radiative Transfer for Inhomogeneous Atmospheres: RRTM, a Validated Correlated-k Model for the Longwave. J. Geophys. Res. Atmos. 1997, 102, 16663–16682. [Google Scholar] [CrossRef]
- Janjić, Z.I. The Mellor-Yamada Level 2.5 Scheme in the NCEP Eta Model. In Proceedings of the Eleventh Conference on Numerical Weather Prediction, Norfolk, VA, USA, 19–23 August 1996; Amer. Meteor. Soc.: Boston, MA, USA, 1996; pp. 354–355. [Google Scholar]
- Tewari, M.; Chen, F.; Wang, W.; Dudhia, J.; LeMone, M.A.; Mitchell, K.; Ek, M.; Gayno, G.; Wegiel, J.; Cuenca, R.H. Implementation and Verification of the Unified Noah Land Surface Model in the WRF Model. Bull. Am. Meteorol. Soc. 2004, 14, 2165–2170. [Google Scholar]
- Janjić, Z.I. The Step-Mountain Eta Coordinate Model: Further Developments of the Convection, Viscous Sublayer, and Turbulence Closure Schemes. Mon. Weather Rev. 1994, 122, 927–945. [Google Scholar] [CrossRef]
- Grell, G.A.; Dévényi, D. A Generalized Approach to Parameterizing Convection Combining Ensemble and Data Assimilation Techniques. Geophys. Res. Lett. 2002, 29, 10–13. [Google Scholar] [CrossRef]
- Taufik, M.; Widyastuti, M.T.; Sulaiman, A.; Murdiyarso, D.; Santikayasa, I.P.; Minasny, B. An Improved Drought-Fire Assessment for Managing Fire Risks in Tropical Peatlands. Agric. For. Meteorol. 2022, 312, 108738. [Google Scholar] [CrossRef]
- R Core Team. R: A Language and Environment for Statistical Computing 2022. Available online: https://www.R-project.org/ (accessed on 2 December 2022).
- Wickham, H.; Averick, M.; Bryan, J.; Chang, W.; McGowan, L.; François, R.; Grolemund, G.; Hayes, A.; Henry, L.; Hester, J.; et al. Welcome to the Tidyverse. JOSS 2019, 4, 1686. [Google Scholar] [CrossRef]
- Hijmans, R. Raster: Geographic Data Analysis and Modeling. R Package Version 3.6-3. 2022. Available online: https://CRAN.R-Project.Org/Package=raster (accessed on 2 December 2022).
- Hayasaka, H.; Usup, A.; Naito, D. New Approach Evaluating Peatland Fires in Indonesian Factors. Remote Sens. 2020, 12, 2055. [Google Scholar] [CrossRef]
- Miettinen, J.; Shi, C.; Liew, S.C. Fire Distribution in Peninsular Malaysia, Sumatra and Borneo in 2015 with Special Emphasis on Peatland Fires. Environ. Manag. 2017, 60, 747–757. [Google Scholar] [CrossRef]
- Field, R.D.; van der Werf, G.R.; Shen, S.S.P. Human Amplification of Drought-Induced Biomass Burning in Indonesia since 1960. Nat. Geosci 2009, 2, 185–188. [Google Scholar] [CrossRef]
- Horton, A.J.; Lehtinen, J.; Kummu, M. Targeted Land Management Strategies Could Halve Peatland Fire Occurrences in Central Kalimantan, Indonesia. Commun Earth Env. 2022, 3, 204. [Google Scholar] [CrossRef]
- Taufik, M.; Torfs, P.J.J.F.; Uijlenhoet, R.; Jones, P.D.; Murdiyarso, D.; Van Lanen, H.A.J. Amplification of Wildfire Area Burnt by Hydrological Drought in the Humid Tropics. Nat. Clim. Chang. 2017, 7, 428–431. [Google Scholar] [CrossRef]
- Kurniadi, A.; Weller, E.; Min, S.-K.; Seong, M.-G. Independent ENSO and IOD Impacts on Rainfall Extremes over Indonesia. Int. J. Climatol. 2021, 41, 3640–3656. [Google Scholar] [CrossRef]
- Nurdiati, S.; Sopaheluwakan, A.; Septiawan, P. Joint Pattern Analysis of Forest Fire and Drought Indicators in Southeast Asia Associated with ENSO and IOD. Atmosphere 2022, 13, 1198. [Google Scholar] [CrossRef]
- Pan, X.; Chin, M.; Ichoku, C.M.; Field, R.D. Connecting Indonesian Fires and Drought With the Type of El Niño and Phase of the Indian Ocean Dipole During 1979–2016. J. Geophys. Res. Atmos. 2018, 123, 7974–7988. [Google Scholar] [CrossRef]
- Amirudin, A.A.; Salimun, E.; Tangang, F.; Juneng, L.; Zuhairi, M. Differential Influences of Teleconnections from the Indian and Pacific Oceans on Rainfall Variability in Southeast Asia. Atmosphere 2020, 11, 886. [Google Scholar] [CrossRef]
- Durner, W.; Lipsius, K. Determining Soil Hydraulic Properties. In Encyclopedia of Hydrological Sciences; John Wiley & Sons: Hoboken, NJ, USA, 2006; pp. 1–23. [Google Scholar]
- Weber, T.K.D.; Durner, W.; Streck, T.; Diamantopoulos, E. A Modular Framework for Modeling Unsaturated Soil Hydraulic Properties Over the Full Moisture Range. Water Resour. Res. 2019, 55, 4994–5011. [Google Scholar] [CrossRef]
- Kurnianto, S.; Selker, J.; Boone Kauffman, J.; Murdiyarso, D.; Peterson, J.T. The Influence of Land-Cover Changes on the Variability of Saturated Hydraulic Conductivity in Tropical Peatlands. Mitig. Adapt. Strat. Glob. Chang. 2019, 24, 535–555. [Google Scholar] [CrossRef]
- Henderson, D.S.; Kummerow, C.D.; Berg, W. ENSO Influence on TRMM Tropical Oceanic Precipitation Characteristics and Rain Rates. J. Clim. 2018, 31, 3979–3998. [Google Scholar] [CrossRef]
- Nwachukwu, P.N.; Satge, F.; Yacoubi, S.E.; Pinel, S.; Bonnet, M.-P. From TRMM to GPM: How Reliable Are Satellite-Based Precipitation Data across Nigeria? Remote Sens. 2020, 12, 3964. [Google Scholar] [CrossRef]
- Iskandar, I.; Lestari, D.O.; Masumoto, Y. La Niña Modoki Enhanced Summer-Autumn Precipitation over the Indonesian Region. Asia-Pac J Atmos Sci 2022, 58, 507–517. [Google Scholar] [CrossRef]
- Rodysill, J.R.; Russell, J.M.; Vuille, M.; Dee, S.; Lunghino, B.; Bijaksana, S. La Niña-Driven Flooding in the Indo-Pacific Warm Pool during the Past Millennium. Quat. Sci. Rev. 2019, 225, 106020. [Google Scholar] [CrossRef]
Disclaimer/Publisher’s Note: The statements, opinions and data contained in all publications are solely those of the individual author(s) and contributor(s) and not of MDPI and/or the editor(s). MDPI and/or the editor(s) disclaim responsibility for any injury to people or property resulting from any ideas, methods, instructions or products referred to in the content. |
© 2023 by the authors. Licensee MDPI, Basel, Switzerland. This article is an open access article distributed under the terms and conditions of the Creative Commons Attribution (CC BY) license (https://creativecommons.org/licenses/by/4.0/).